Integrated Evaluation of Coupling Coordination for Land Use Change and Ecological Security: A Case Study in Wuhan City of Hubei Province, China


Abstract
:1. Introduction
2. Study Area and Data
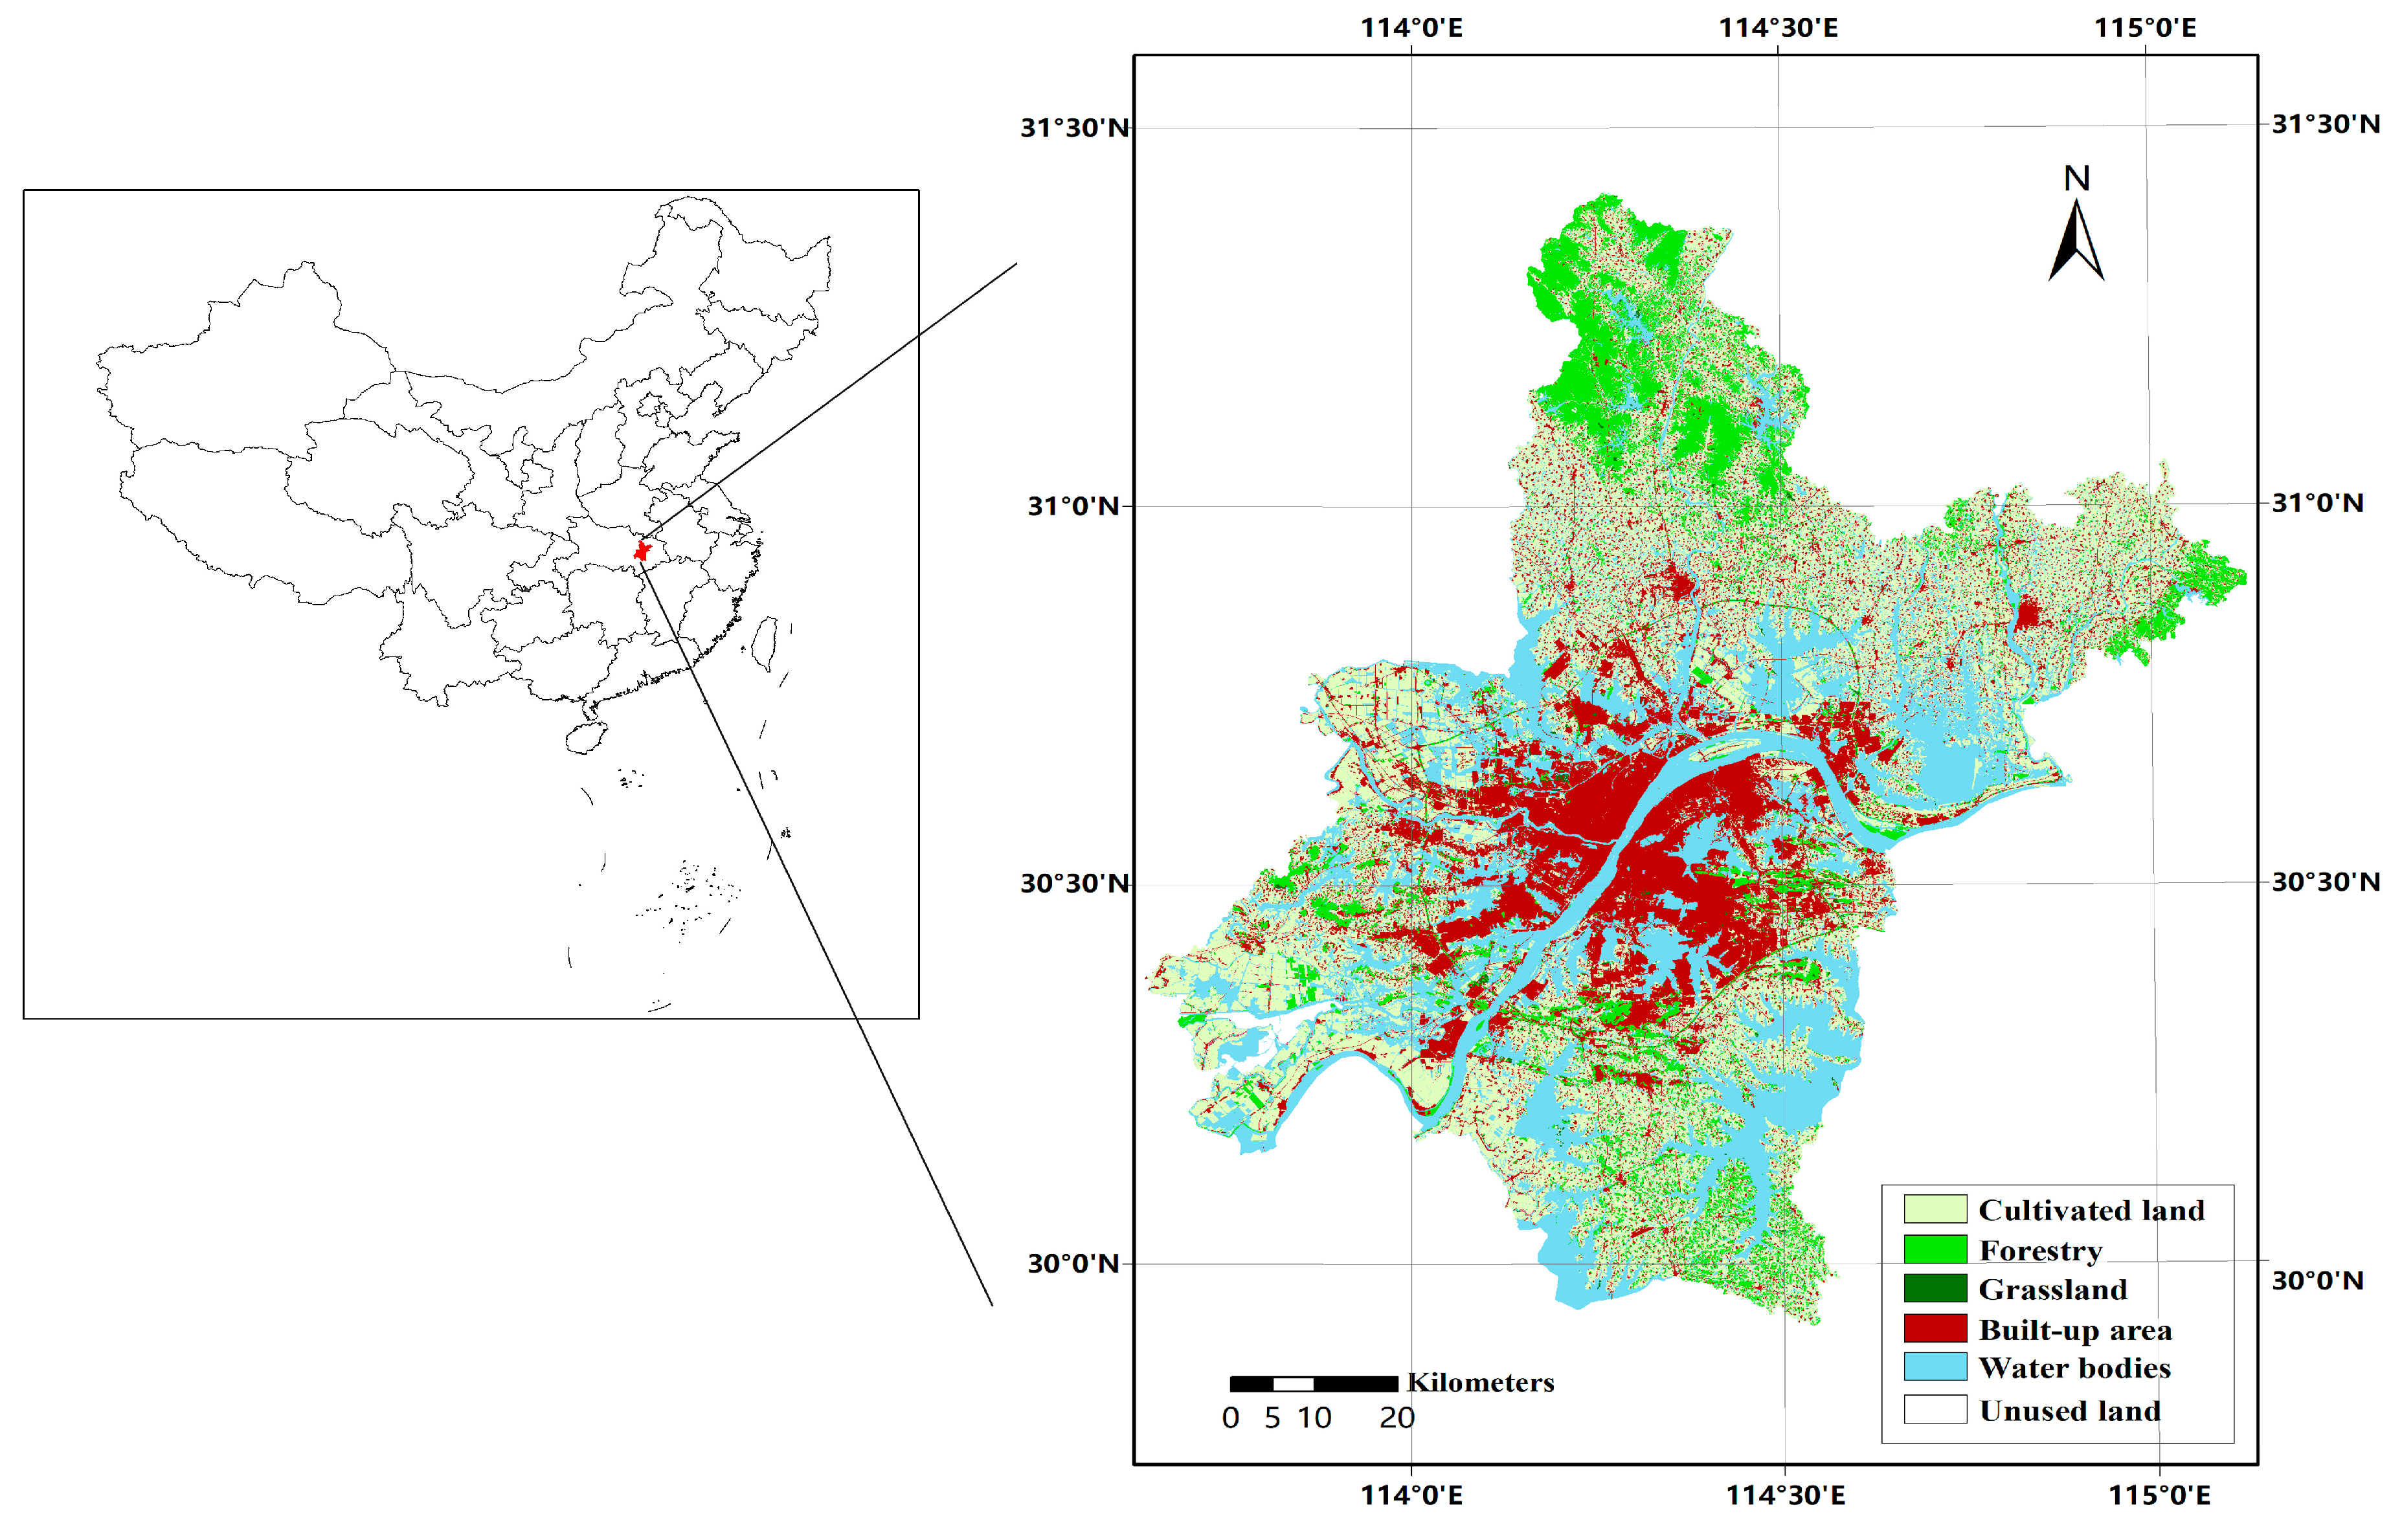
2.1. Study Area
2.2. Data Sources
3. Methods
3.1. Analysis of Land Use Change
3.2. Assessment of Ecological Security
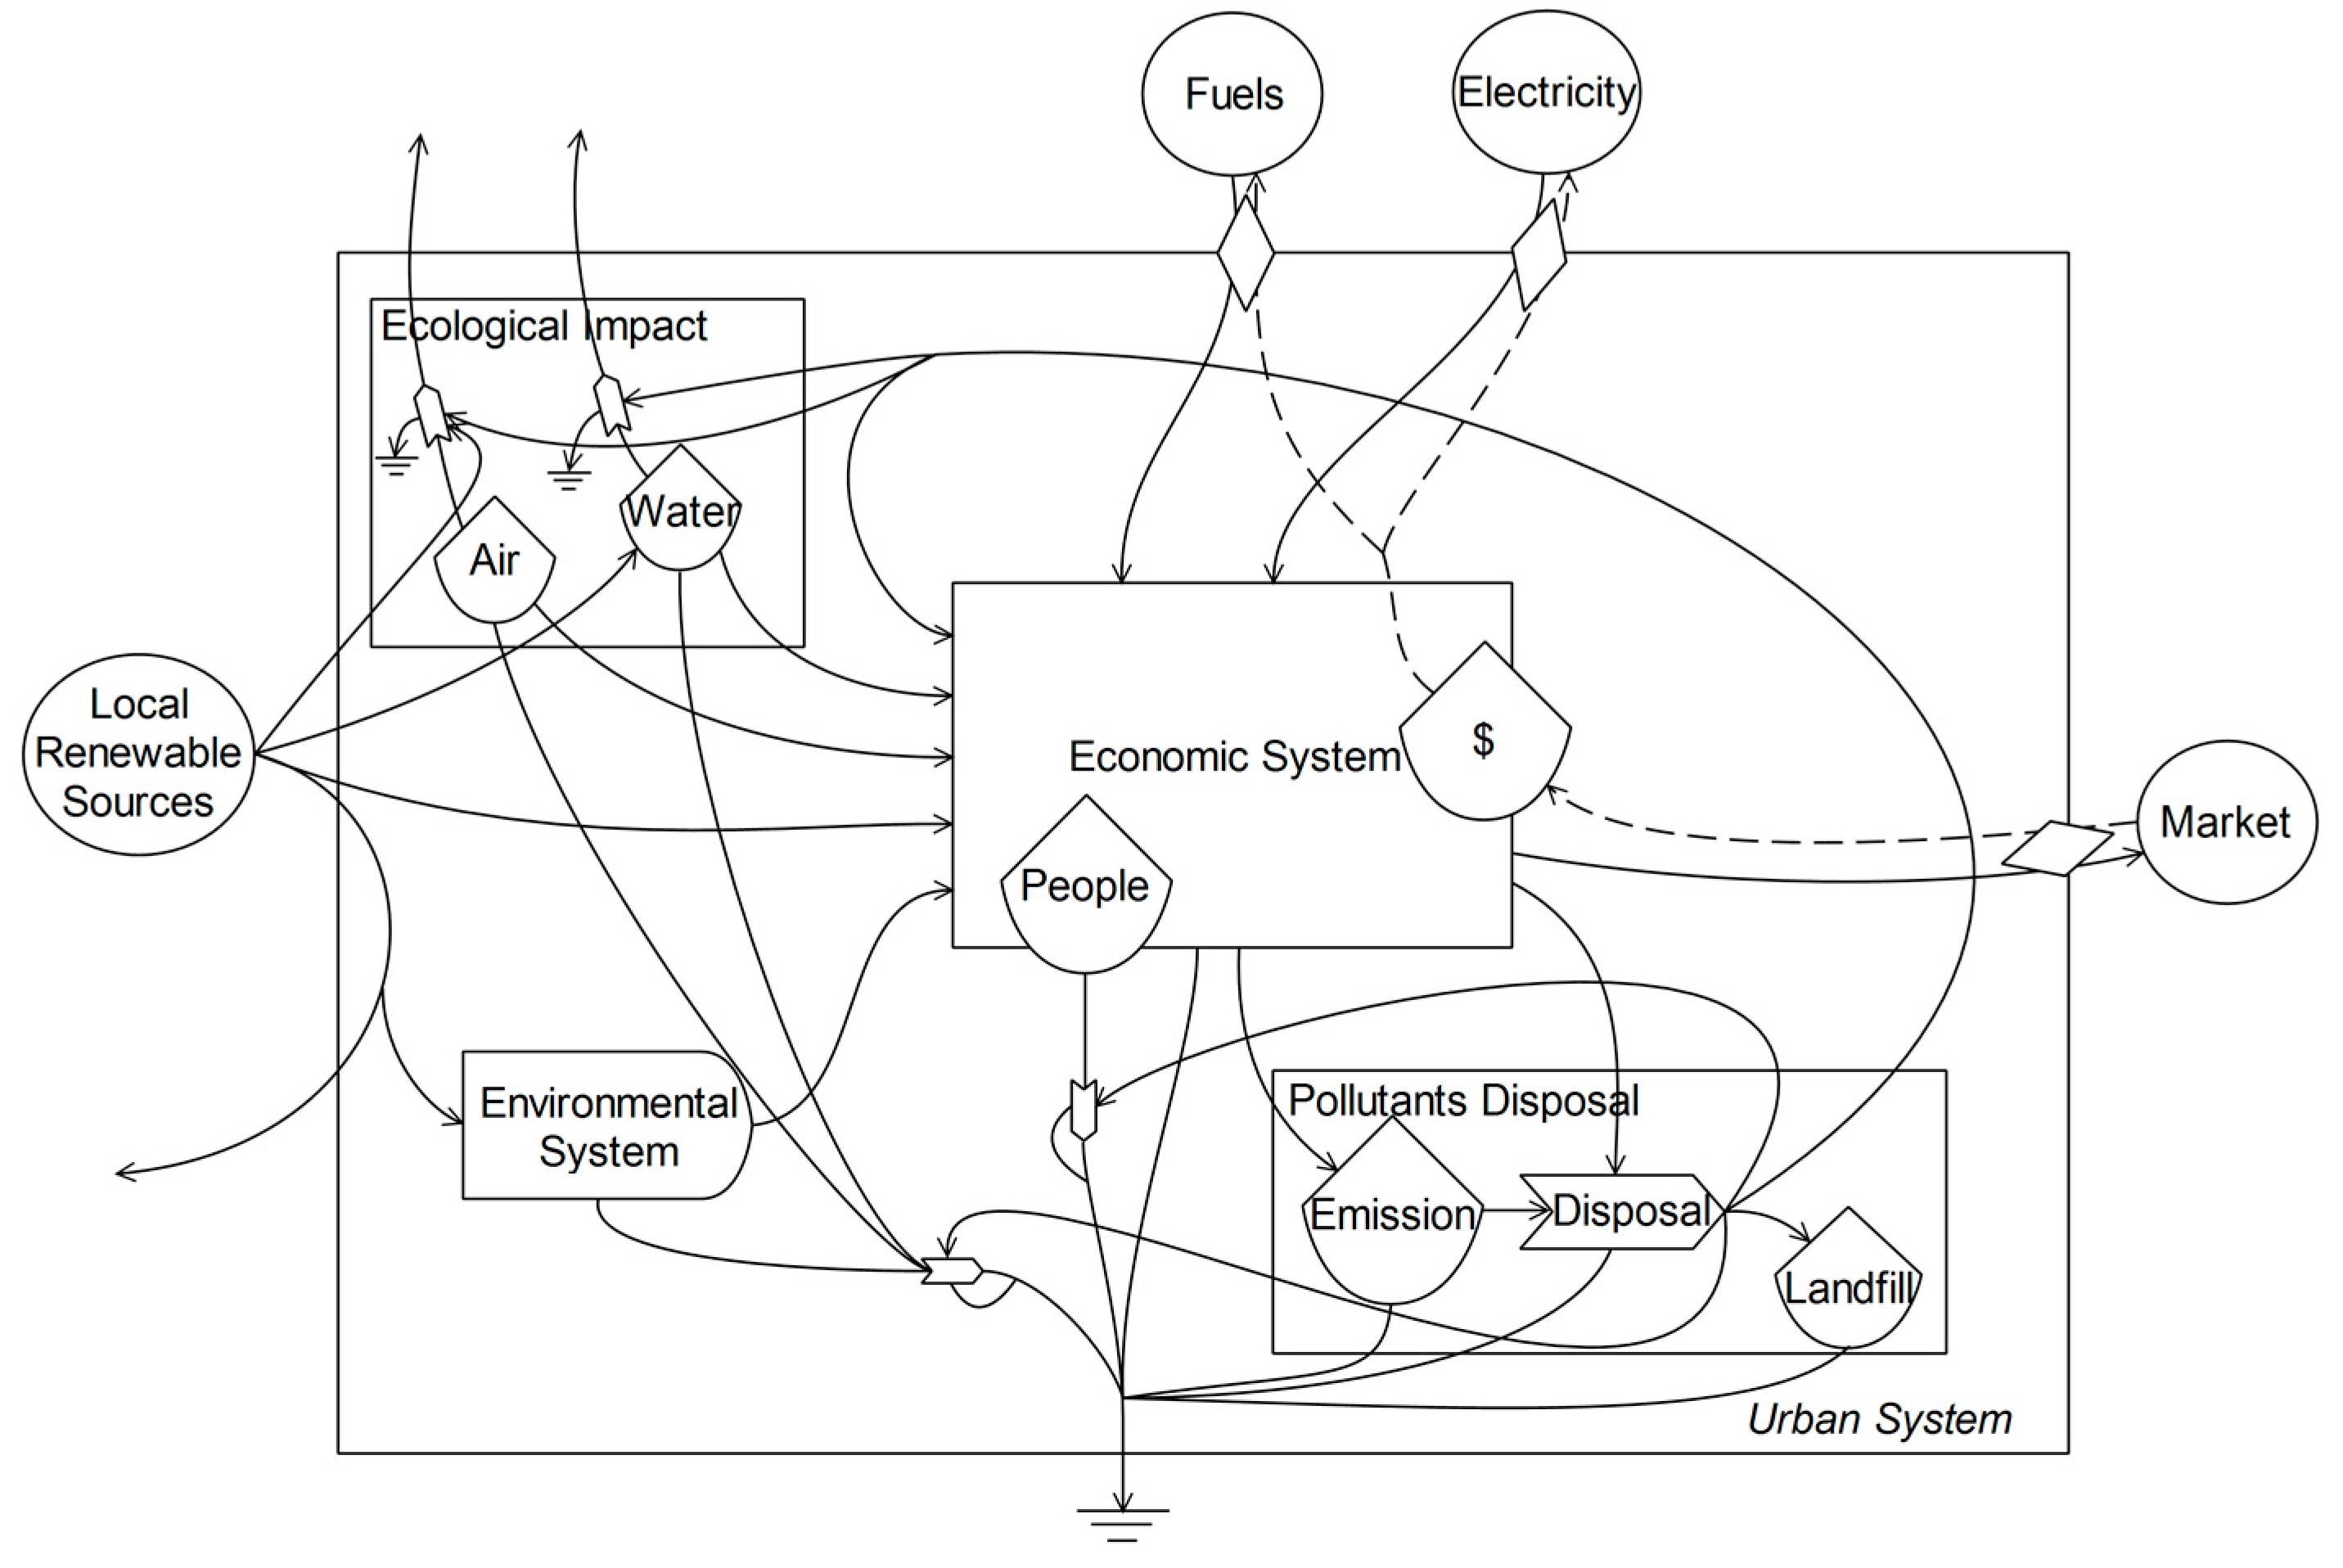
3.2.1. Emergy Analysis
3.2.2. Calculation of Ecosystem Emergy
3.2.3. Evaluating Indicators System Based on Emergy
3.2.4. Emergy-Based Ecological Security Index
3.3. Coupling Coordination Analysis
4. Results
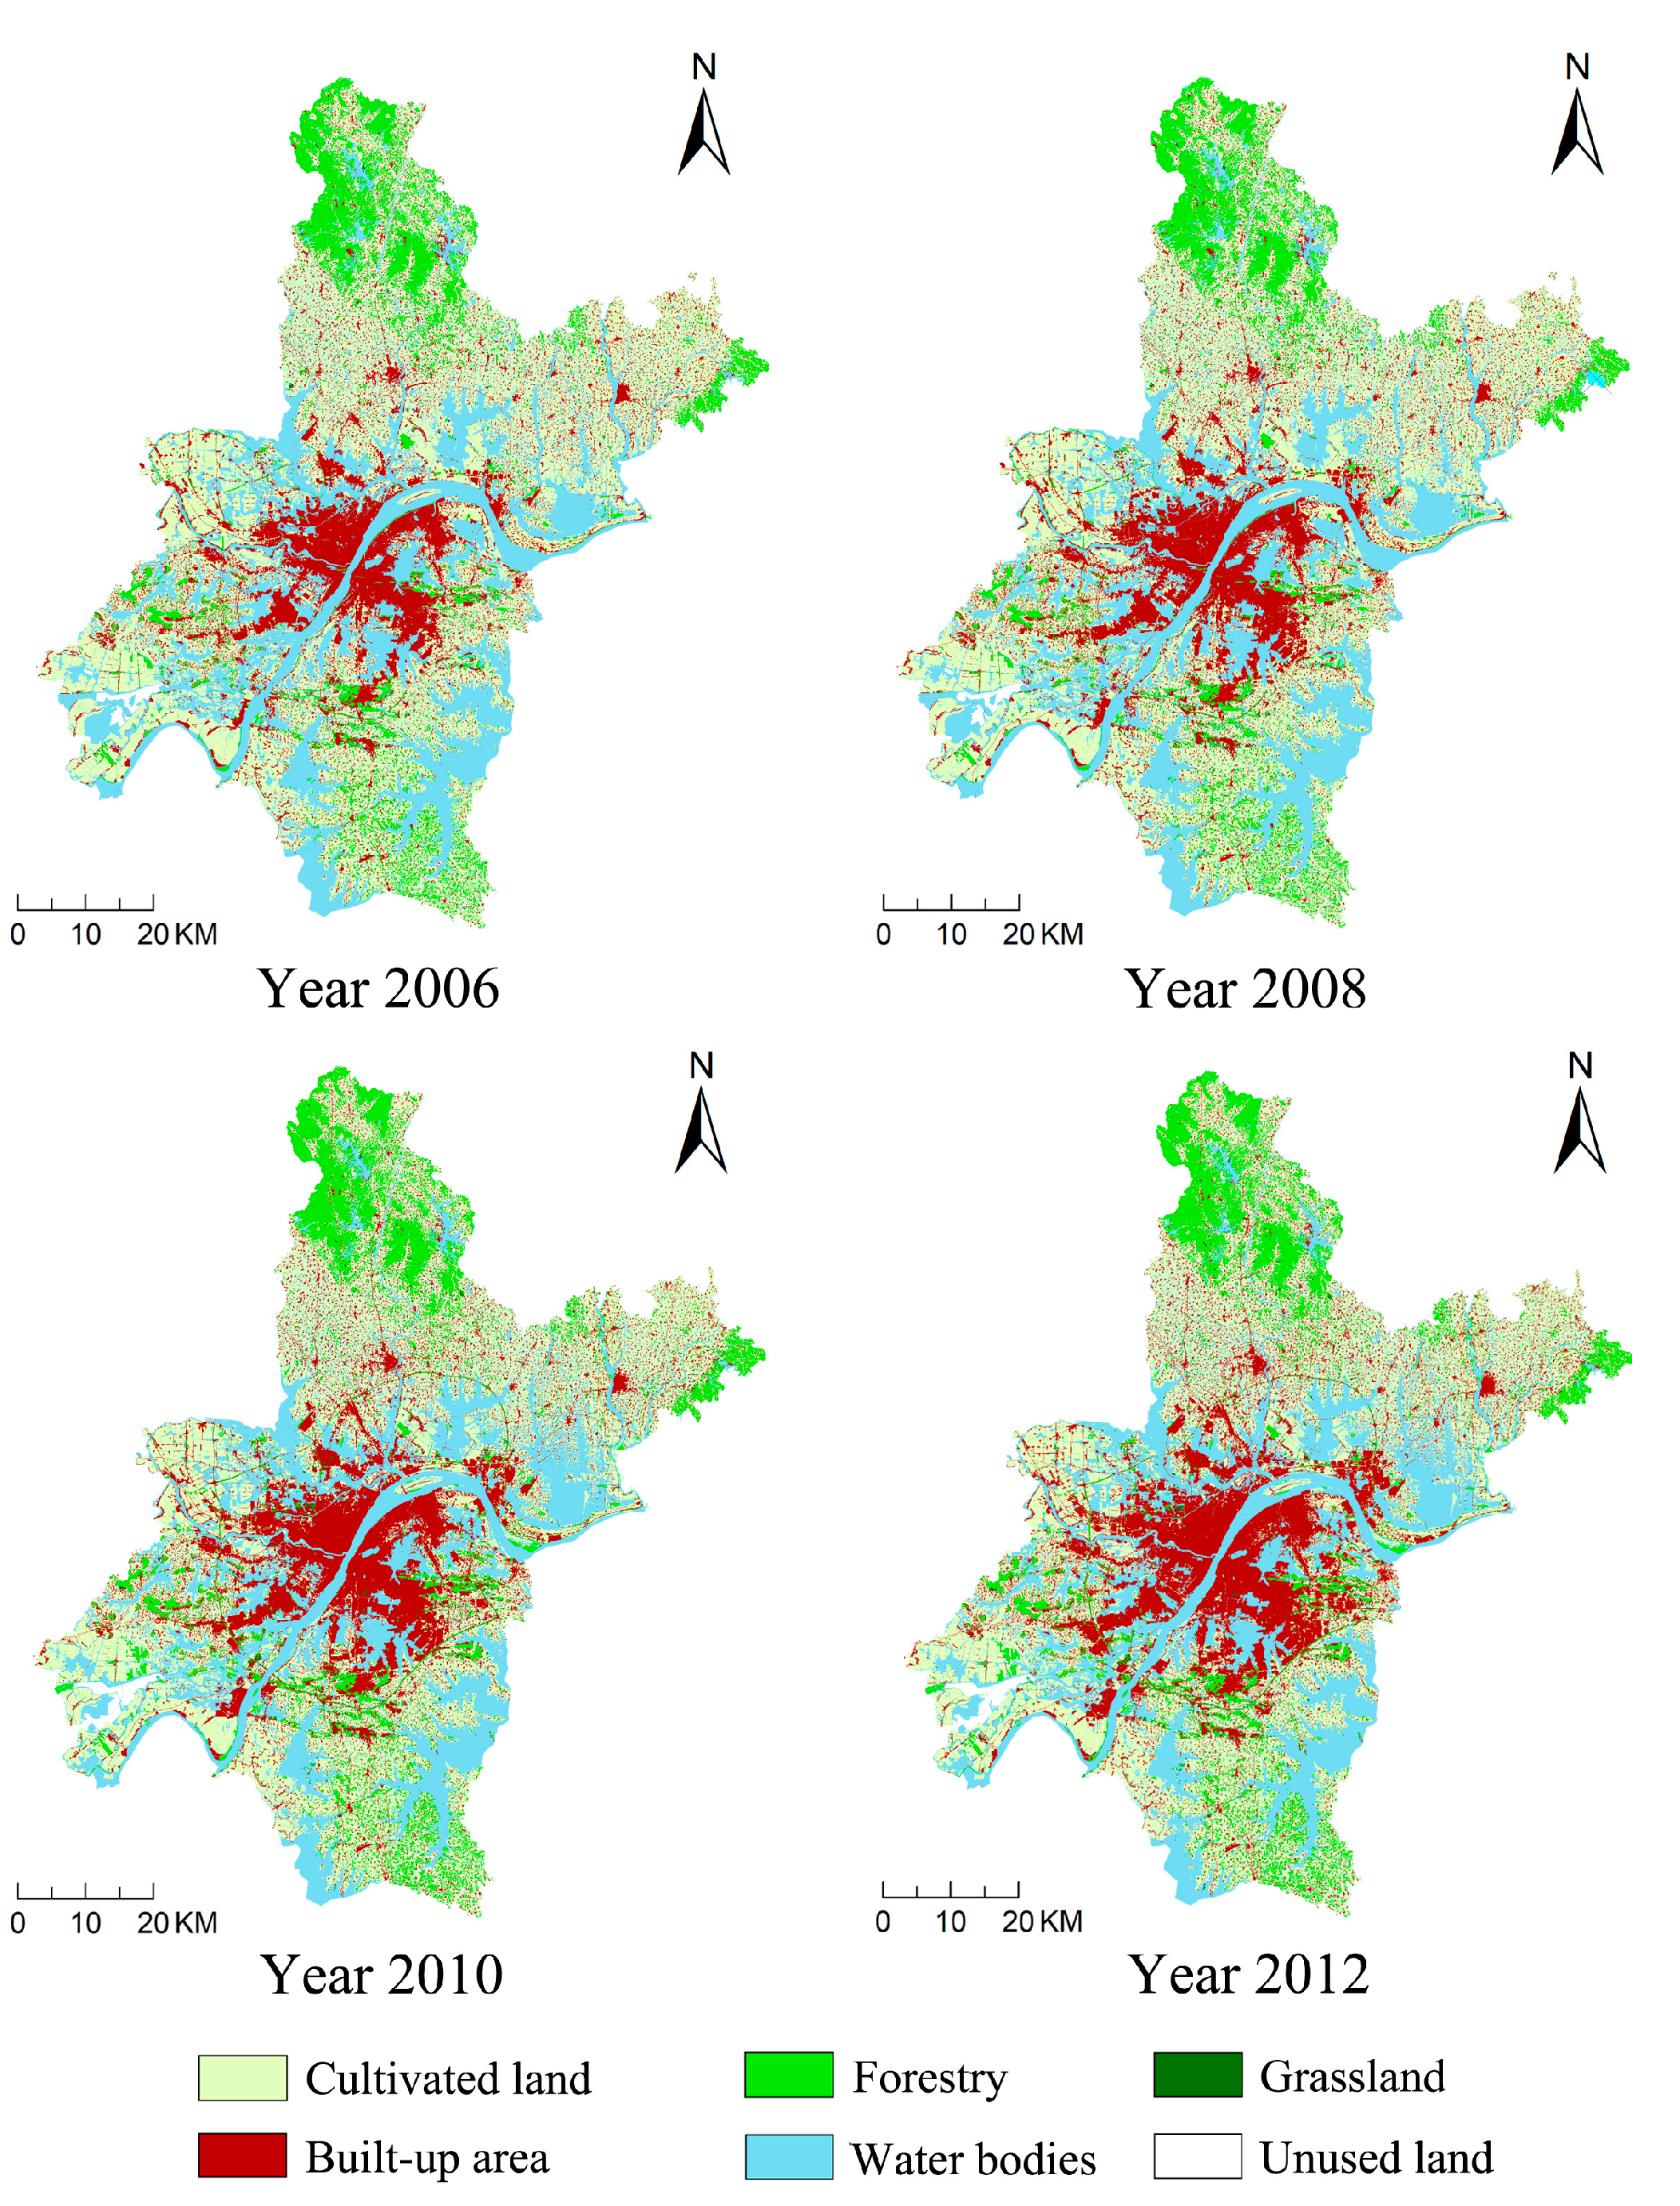
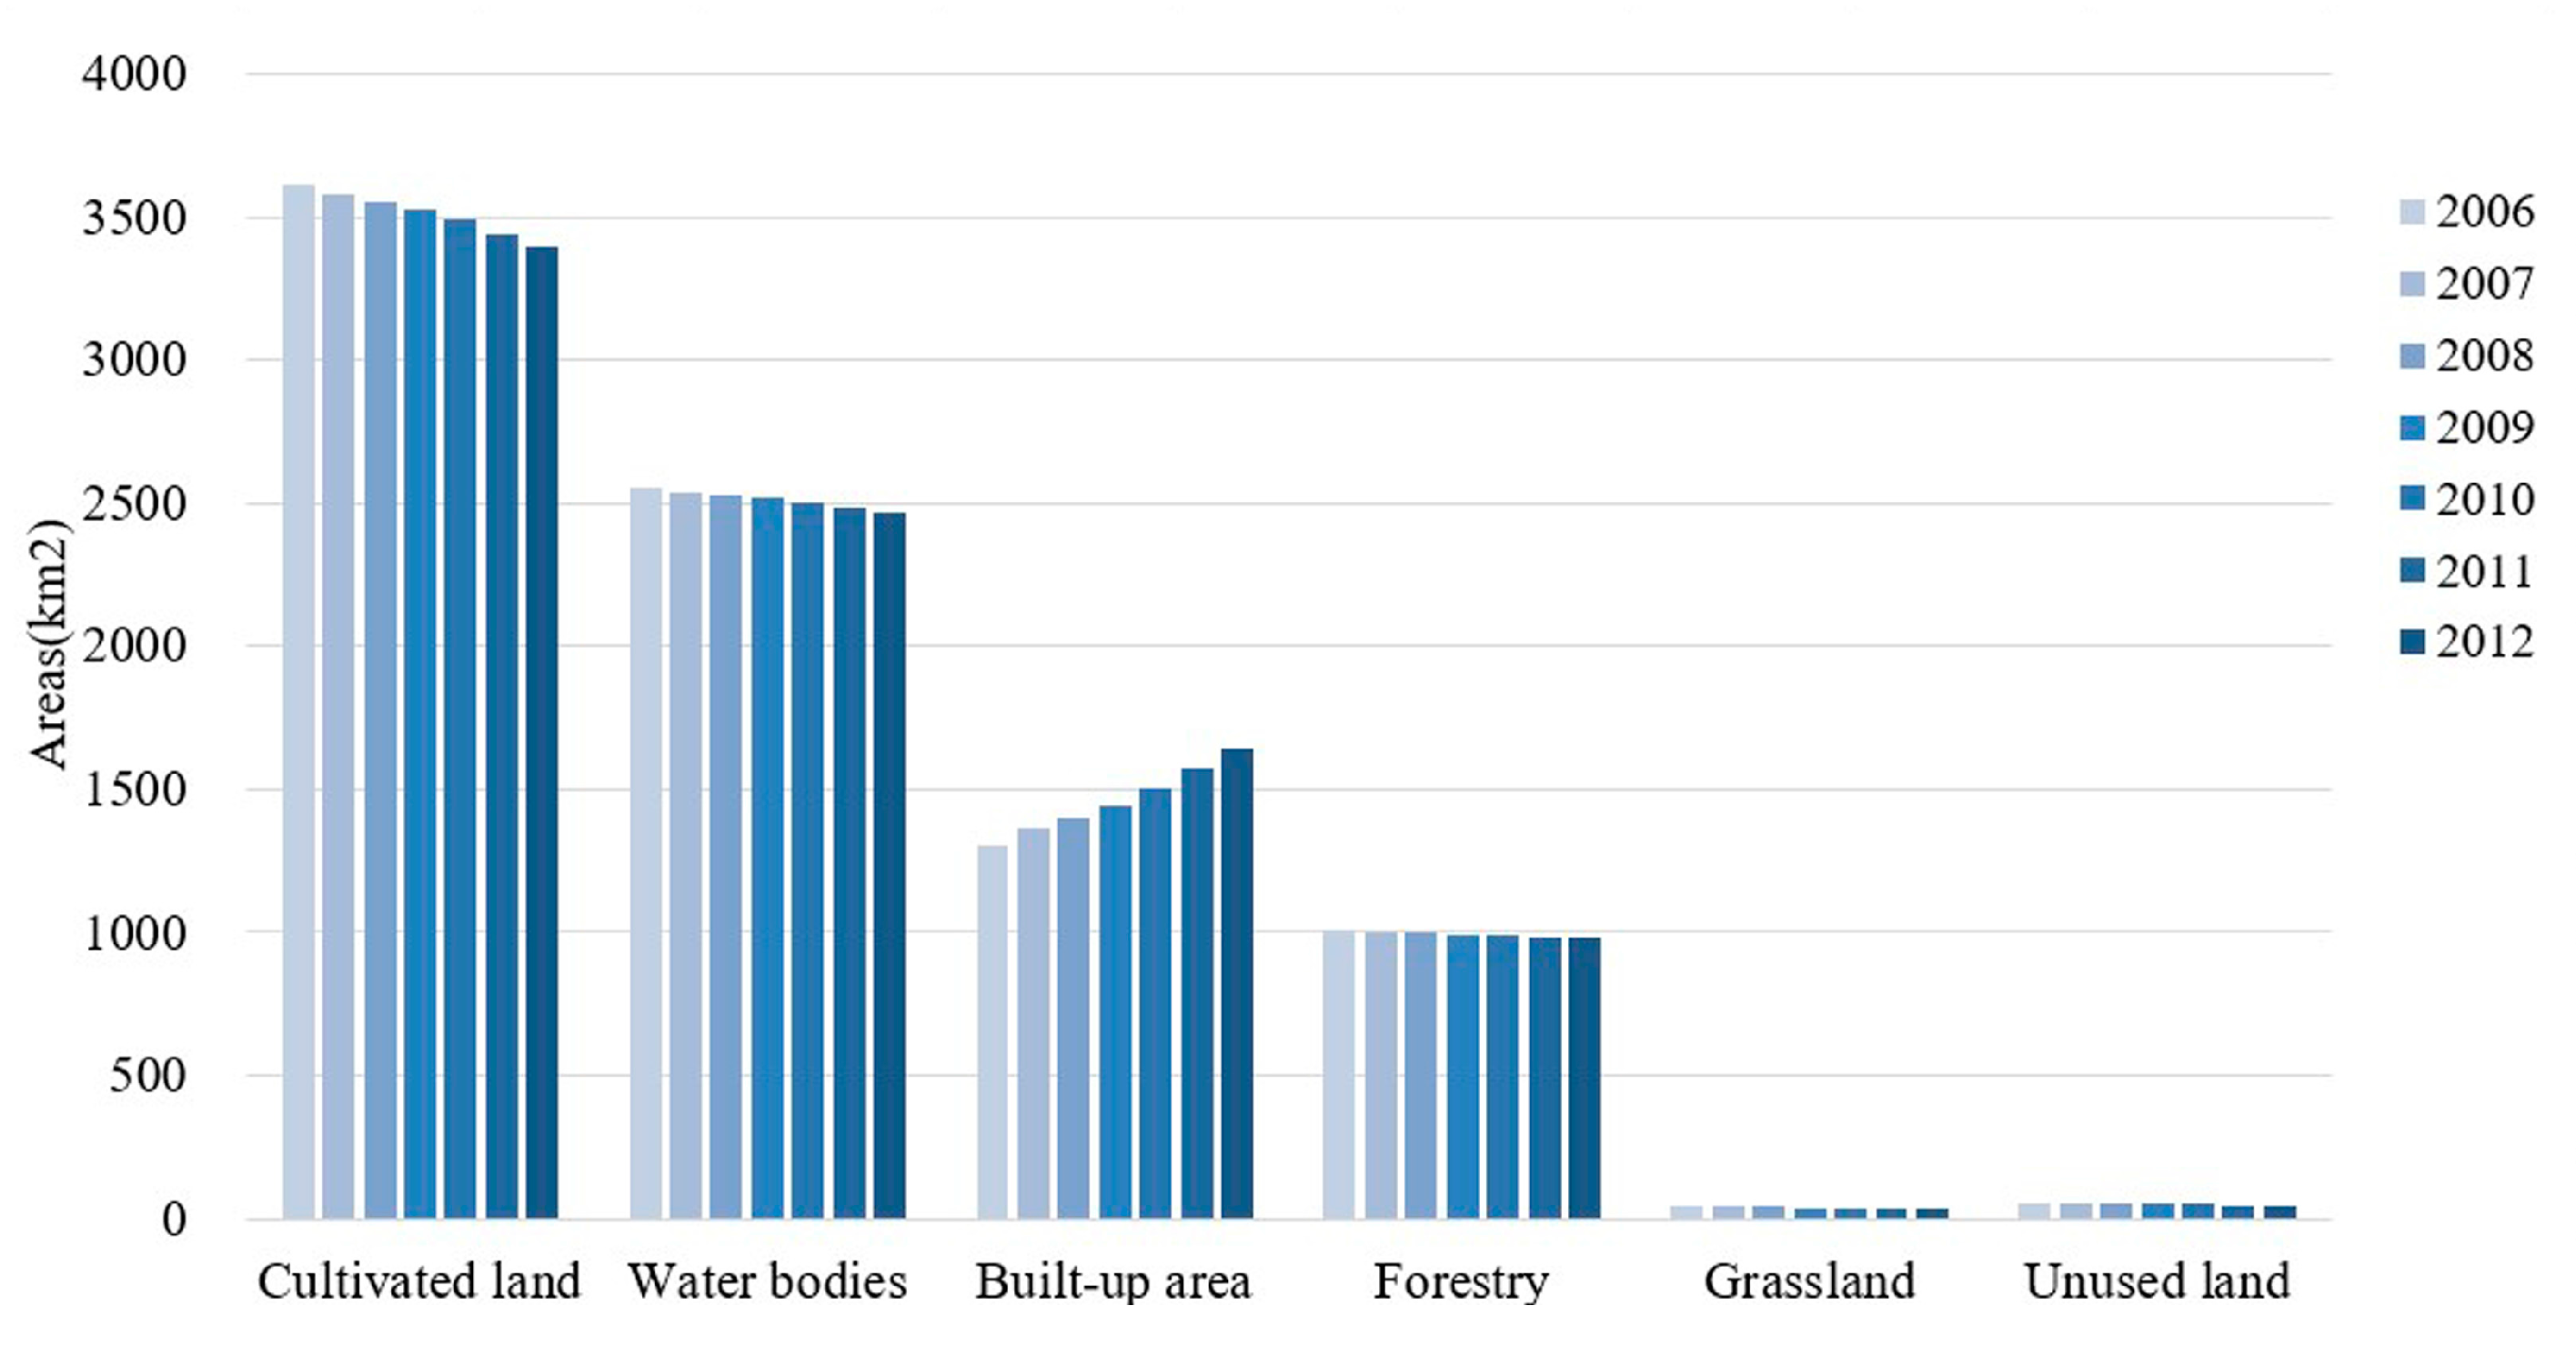
4.1. Analysis of Land Use Change
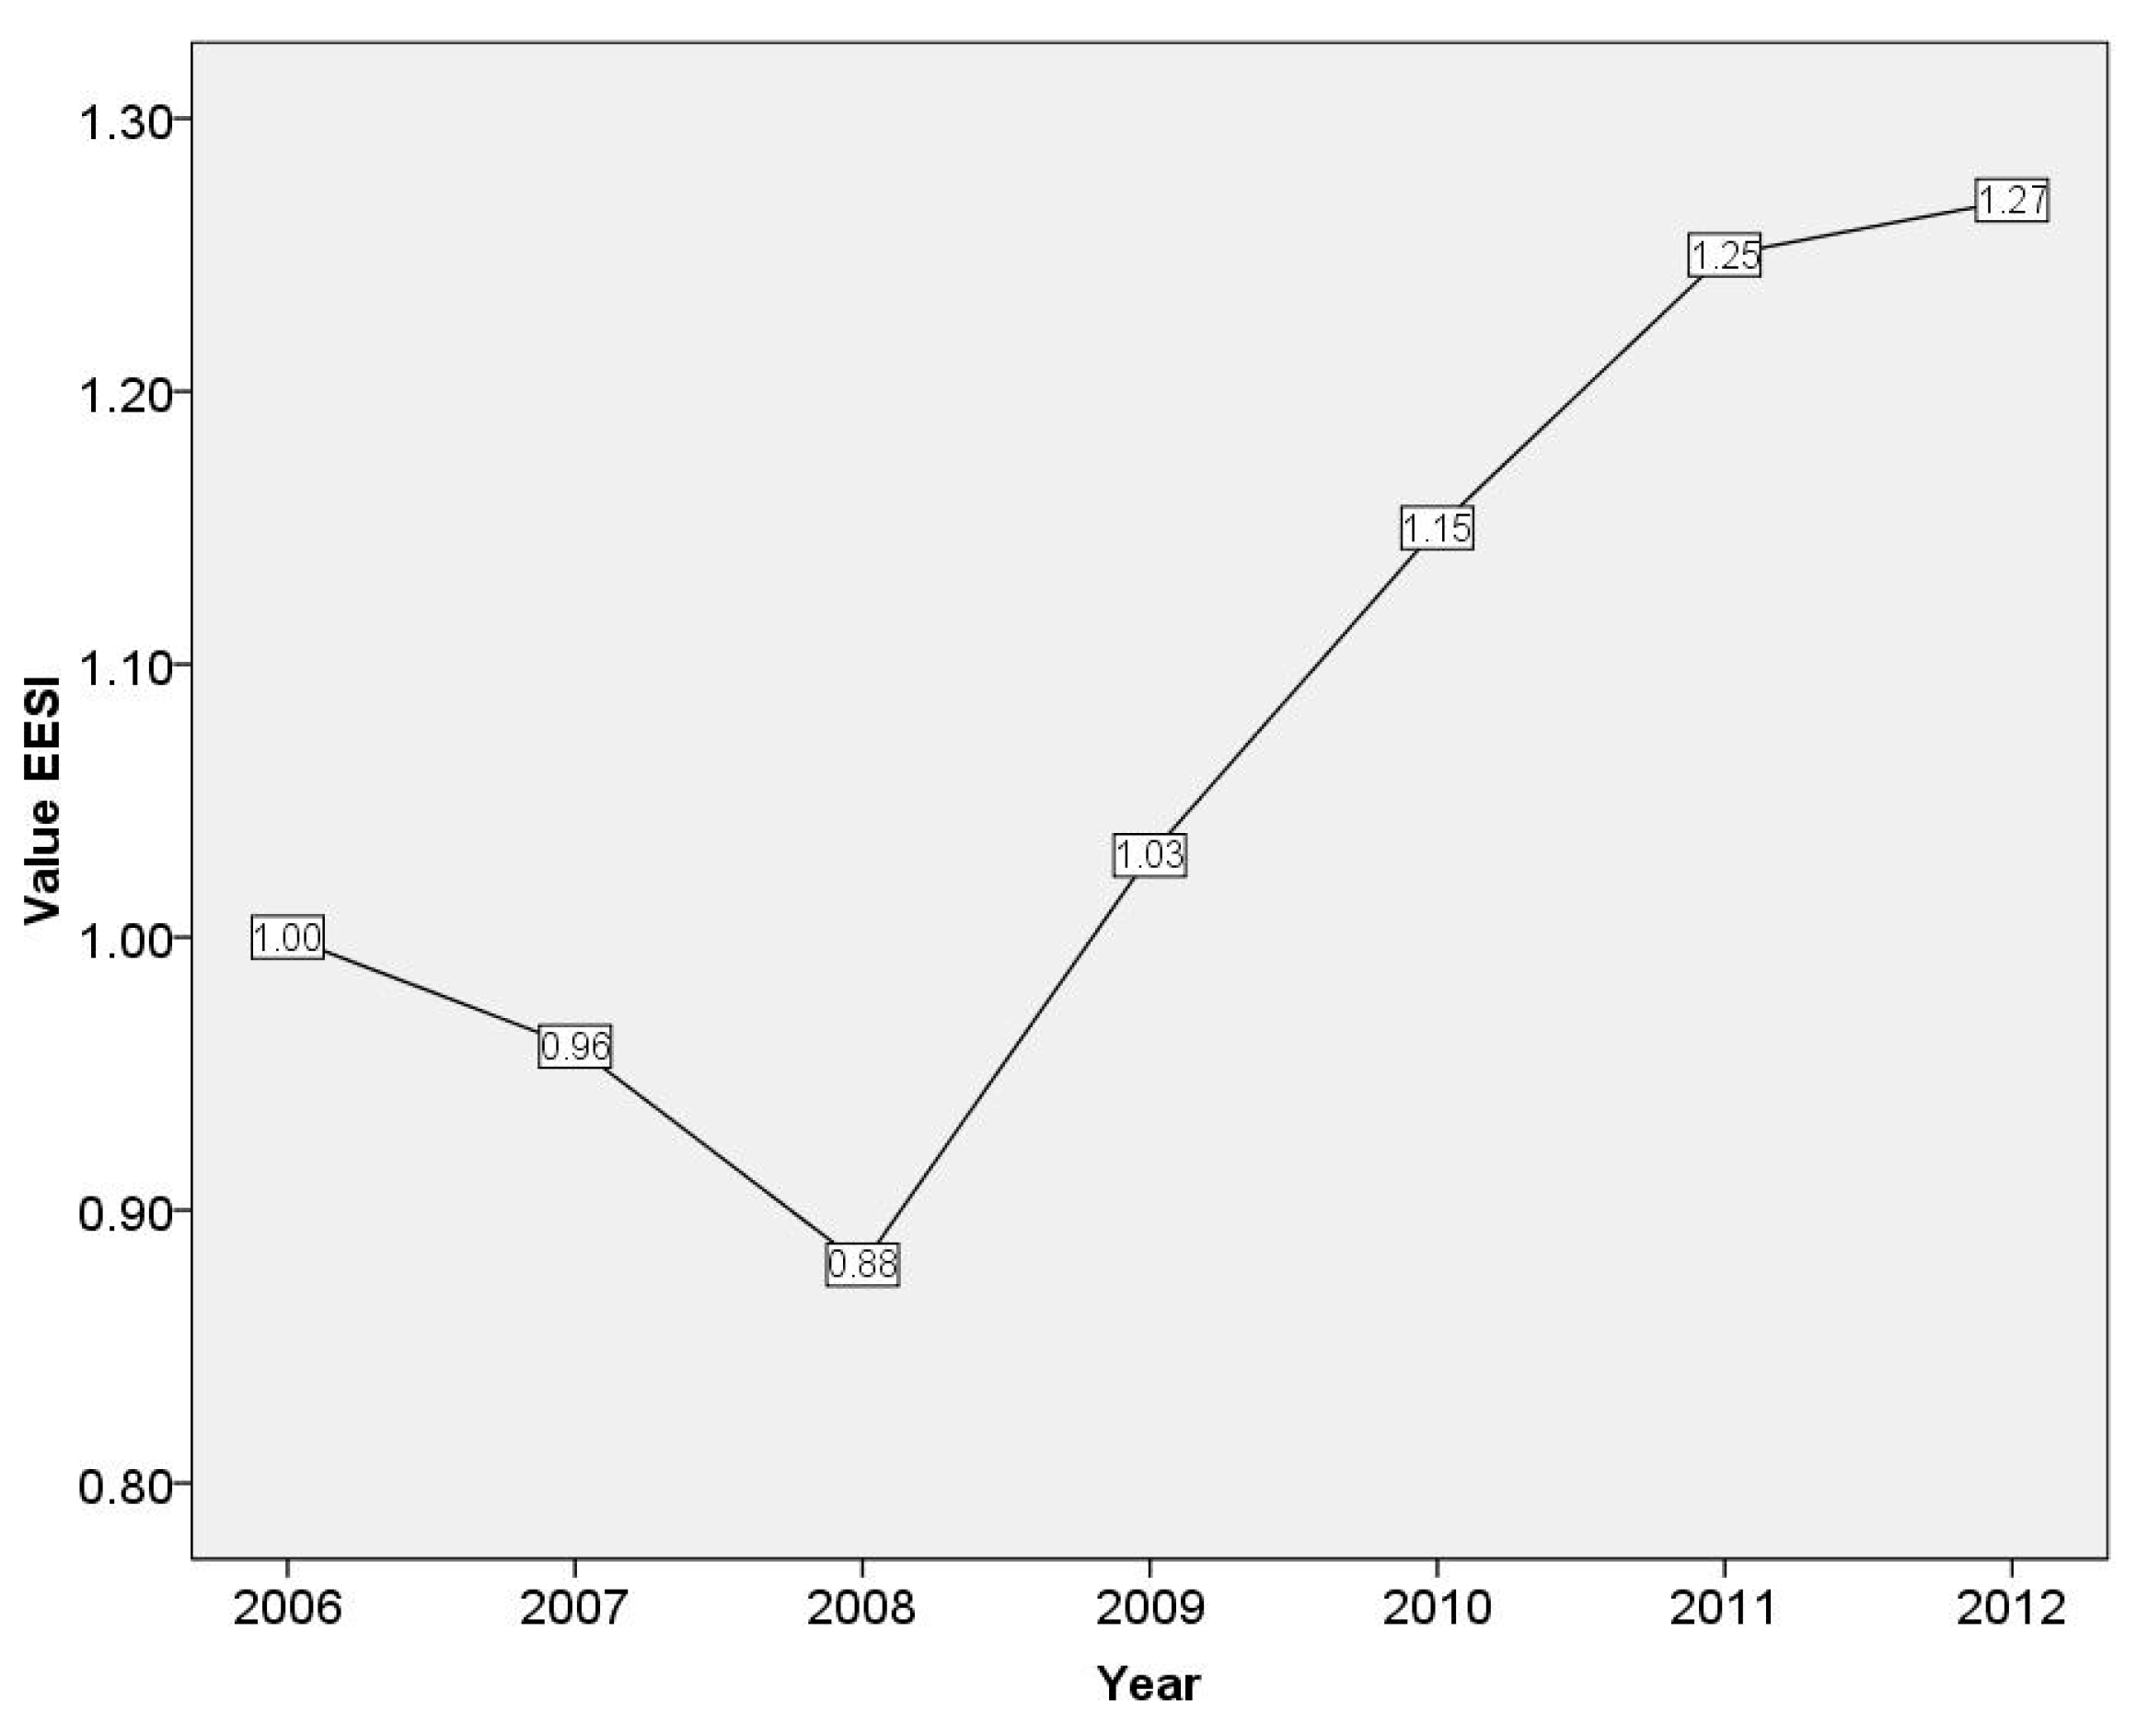
4.2. Assessment of Ecological Security Based on Emergy
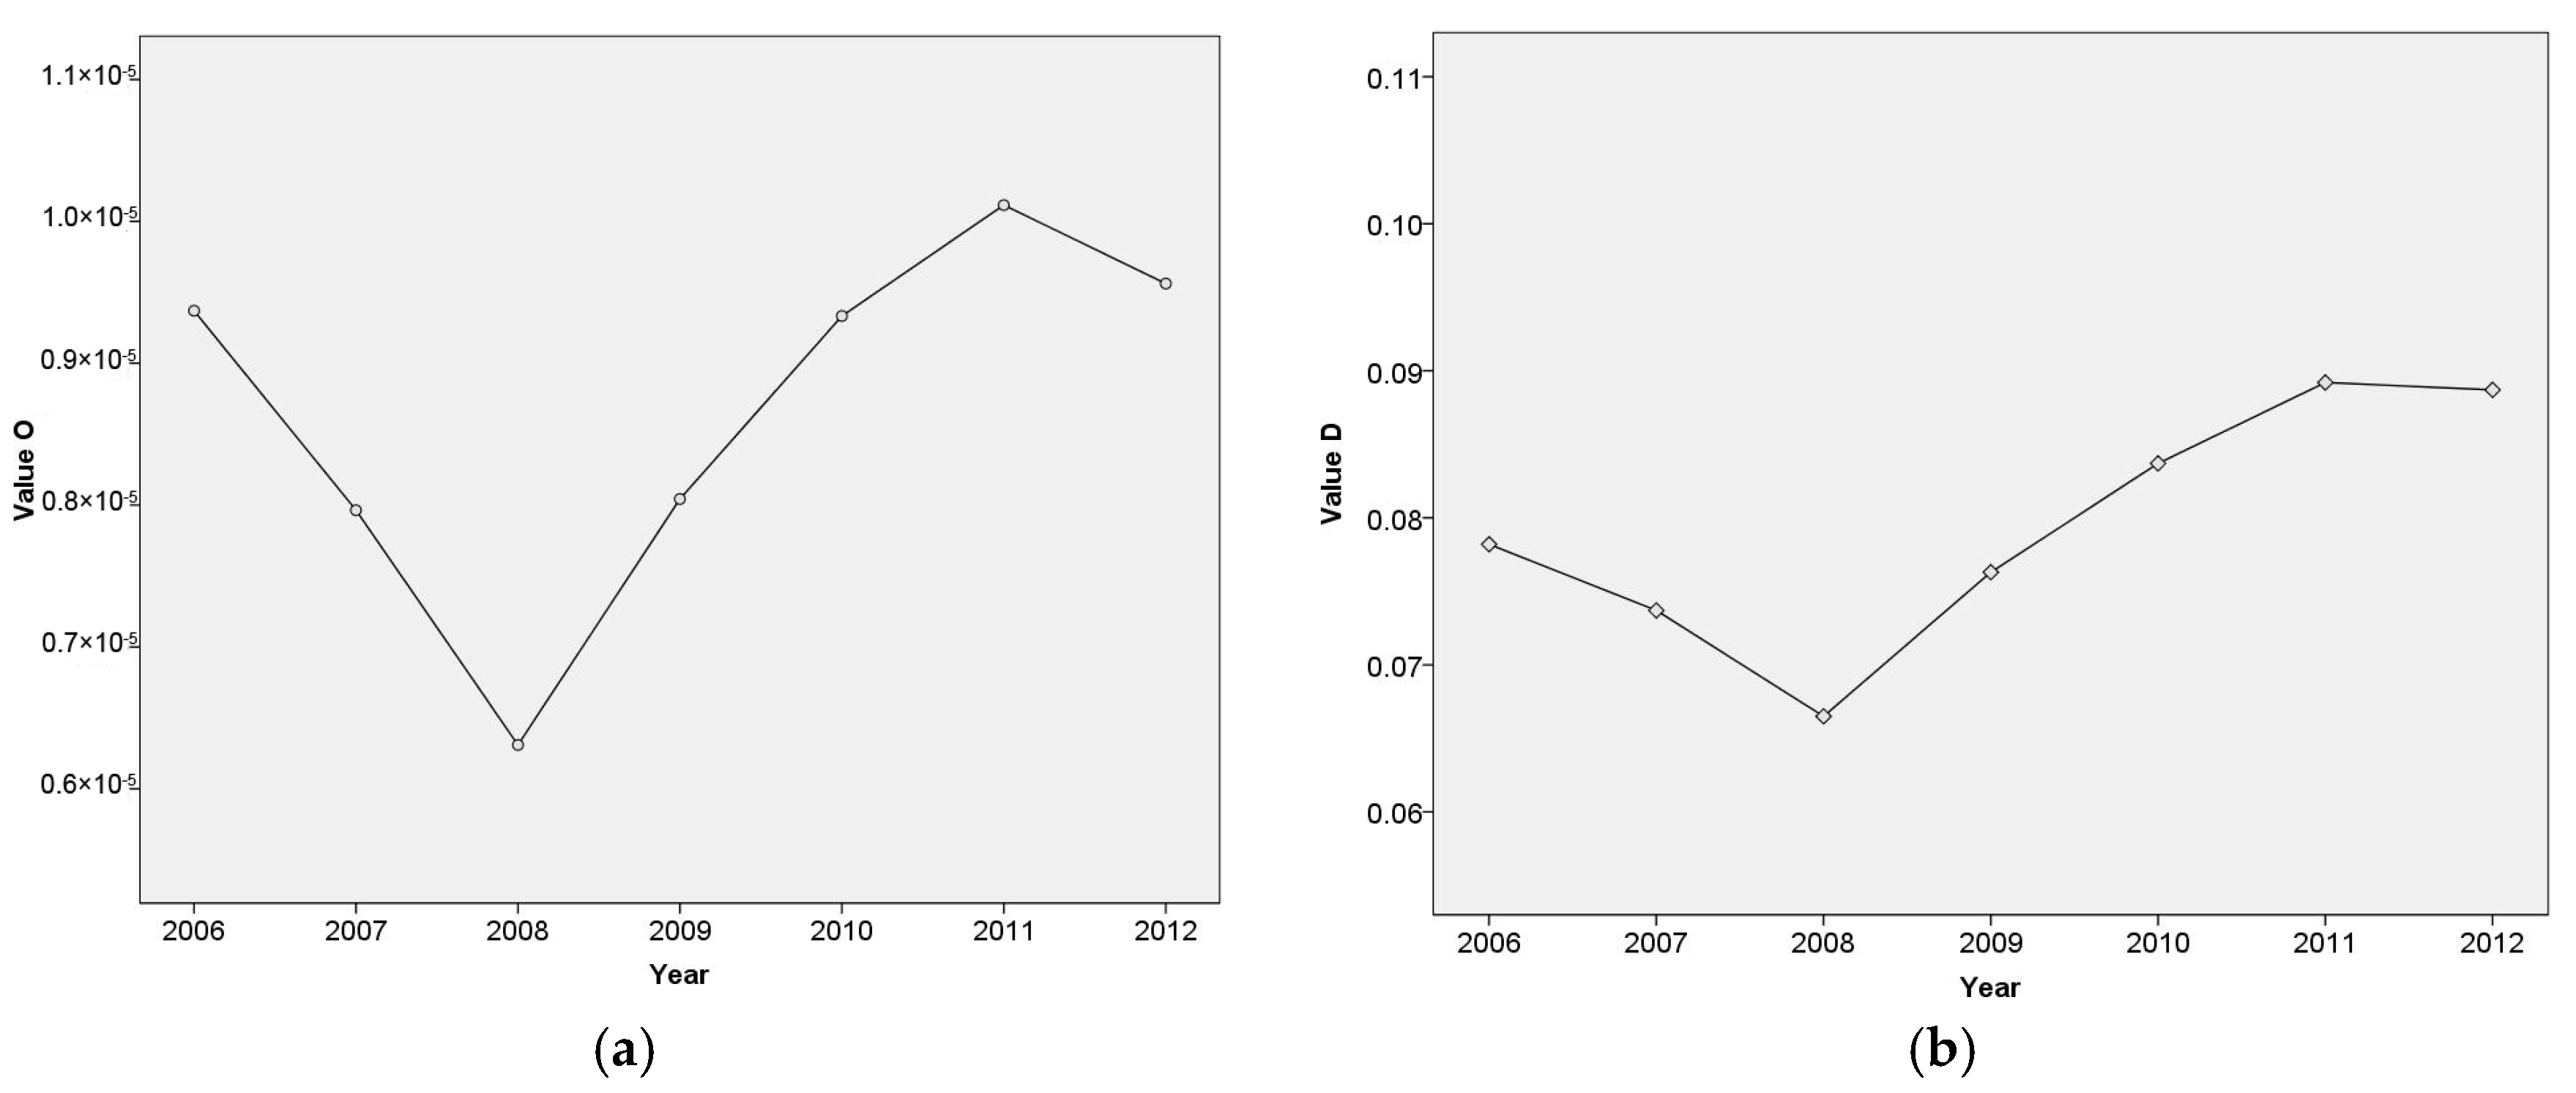
4.3. Coupling Coordination Analysis
5. Discussion
5.1. Driving Forces of Land Use Change in Wuhan City
5.2. Main Factors Influencing Ecological Security Change in Wuhan City
5.3. Implications of Land Use and Environmental Management According to Coupling Coordination Analysis
5.4. Comparison with Previous Studies and Further Research Prospects
6. Conclusions
Acknowledgments
Author Contributions
Conflicts of Interest
Appendix A

| Item | Value | Unit | Reference | |
|---|---|---|---|---|
| 1 | Sunlight | |||
| Area | =8.57 × 10⁹ | m2 | ||
| Sun radiation | =5.65 × 10⁹ | J/(m2year) | [32] | |
| Energy | =(area) × (sun radiation) | J/year | ||
| UEV | =1 | seJ/year | [50] | |
| 2 | Wind | |||
| Area | =8.57 × 10⁹ | m2 | ||
| Air density | =1.23 | kg/m3 | ||
| Eddy diffusivity | =12.95 | m3/s | [32] | |
| Wind velocity gradient | =3.93 × 10⁻³ | m/s/m2 | [32] | |
| Time frame | =3.15 × 10⁷ | s/year | ||
| Energy | =(area) × (air density) × (eddy diffusivity) × (wind velocity gradient)2 × (time frame) × 1000 | J/year | ||
| UEV | =1.91 × 10³ | seJ/J | [50], converted to the new baseline | |
| 3 | Rain (geopotential) | |||
| Area | =8.57 × 10⁹ | m2 | ||
| Average elevation | =23.3 | m | [32] | |
| Annual rainfall | m/year | [32] | ||
| Acceleration of gravity | =9.8 | m/s2 | ||
| Water density | =1000 | kg/m3 | ||
| Energy | =(area) × (average elevation) × (annual rainfall) × (acceleration of gravity) × (water density) | J/year | ||
| UEV | =1.32 × 10⁴ | seJ/J | [50], converted to the new baseline | |
| 4 | Rain (chemical) | |||
| Area | =8.57 × 10⁹ | m2 | ||
| Annual rainfall | m/year | [32] | ||
| Gibbs energy of rain | =4.94 | J/g | ||
| Water density | =1000 | kg/m3 | ||
| Energy | =(area) × (annual rainfall) × (gibbs energy of rain) × (water density) | J/year | ||
| UEV | =2.32 × 10⁴ | seJ/J | [50], converted to the new baseline | |
| 5 | Geothermal heat | |||
| Area | =8.57 × 10⁹ | m2 | ||
| Heat flux | =1.45 × 10⁶ | J/m2/year | [32] | |
| Energy | =(area) × (heat flux) | J/year | ||
| UEV | =5.38 × 10⁴ | seJ/J | [50], converted to the new baseline | |
| 6 | Top soil | |||
| Cultivated area | m2 | |||
| Erosion rate | =250 | g/m2/year | [25,26,27,28,29,30,31] | |
| Organic matter in top soil | =56.4 | % | ||
| Organic matter energy | =2.26 × 10⁴ | J/g | ||
| Energy | =(cultivated area) × (erosion rate) × (organic matter in top soil) × (organic matter energy) | J/year | ||
| UEV | =9.35 × 10⁴ | seJ/J | [50], converted to the new baseline | |
| 7 | Coal | |||
| Coal consumption | t/year | [18,19,20,21,22,23,24] | ||
| Energy content | =2.09 × 10¹⁰ | J/t | ||
| Energy | =(coal consumption) × (en. content) | J/year | ||
| UEV | =5.08 × 10⁴ | seJ/J | [50], converted to the new baseline | |
| 8 | Coke | |||
| Coke consumption | t/year | [18,19,20,21,22,23,24] | ||
| Energy content | =3.18 × 10¹⁰ | J/t | ||
| Energy | =(coke consumption) × (en. content) | J/year | ||
| UEV | =8.36 × 10⁴ | seJ/year | [51], converted to the new baseline | |
| 9 | Crude oil | |||
| Crude oil consumption | t/year | [18,19,20,21,22,23,24] | ||
| Energy content | =4.18 × 10¹⁰ | J/t | ||
| Energy | =(crude oil consumption) × (en. content) | J/year | ||
| UEV | =6.90 × 10⁴ | seJ/J | [51], converted to the new baseline | |
| 10 | Gasoline | |||
| Gasoline consumption | t/year | [18,19,20,21,22,23,24] | ||
| Energy content | =4.61 × 10¹⁰ | J/t | ||
| Energy | =(gasoline consumption) × (en.content) | J/year | ||
| UEV | =7.98 × 10⁴ | seJ/J | [51], converted to the new baseline | |
| 11 | Kerosene | |||
| Kerosene consumption | t/year | [18,19,20,21,22,23,24] | ||
| Energy content | =4.35 × 10¹⁰ | J/t | ||
| Energy | =(kerosene consumption) × (en.content) | J/year | ||
| UEV | =8.36 × 10⁴ | seJ/J | [51], converted to the new baseline | |
| 12 | Liquefied petroleum gas | |||
| Liquefied petroleum gas consumption | m3/year | [18,19,20,21,22,23,24] | ||
| Energy content | =2.93 × 10¹⁰ | J/m3 | ||
| Energy | =(liquefied petroleum gas consumption) × (en. content) | J/year | ||
| UEV | =8.44 × 10⁴ | seJ/J | [51], converted to the new baseline | |
| 13 | Electricity | |||
| Electricity consumption | kWh/year | [18,19,20,21,22,23,24] | ||
| Energy content | =3.60 × 10⁶ | J/kWh | ||
| Energy | =(electricity consumption) × (en. content) | J/year | ||
| UEV | =1.32 × 10⁵ | seJ/J | [50], converted to the new baseline | |
References
- Chen, H.S. Evaluation and analysis of eco-security in environmentally sensitive areas using an emergy ecological footprint. Int. J. Environ. Res. Public Health 2017, 14, 136. [Google Scholar] [CrossRef] [PubMed]
- Zhao, C.R.; Zhou, B.; Su, X. Evaluation of urban eco-security—A case study of Mianyang City, China. Sustainability 2014, 6, 2281–2299. [Google Scholar] [CrossRef]
- Peng, J.; Zhao, M.Y.; Guo, X.N.; Pan, Y.J.; Liu, Y.X. Spatial-temporal dynamics and associated driving forces of urban ecological land: A case study in Shenzhen city, China. Habitat Int. 2017, 60, 81–90. [Google Scholar] [CrossRef]
- Lin, Y.P.; Hong, N.M.; Chiang, L.C.; Liu, Y.L.; Chu, H.J. Adaptation of land-use demands to the impact of climate change on the hydrological processes of an urbanized watershed. Int. J. Environ. Res. Public Health 2012, 9, 4083–4102. [Google Scholar] [CrossRef] [PubMed]
- Jin, G.; Wang, P.; Zhao, T.; Bai, Y.P.; Zhao, C.H.; Chen, D.D. Reviews on land use change induced effects on regional hydrological ecosystem services for integrated water resources management. Phys. Chem. Earth 2015, 89–90, 33–39. [Google Scholar] [CrossRef]
- Yin, K.; Lu, D.S.; Tian, Y.C.; Zhao, Q.J.; Yuan, C. Evaluation of carbon and oxygen balances in urban ecosystems using land use/land cover and statistical data. Sustainability 2015, 7, 195–224. [Google Scholar] [CrossRef]
- Salvati, L.; Carlucci, M. Estimating land degradation risk for agriculture in Italy using an indirect approach. Ecol. Econ. 2010, 69, 511–518. [Google Scholar] [CrossRef]
- Salvati, L.; Bajocco, S. Land sensitivity to desertification across Italy Past, present, and future. Appl. Geogr. 2011, 31, 223–231. [Google Scholar] [CrossRef]
- Sulistyawati, E.; Noble, I.R.; Roderick, M.L. A simulation model to study land use strategies in swidden agriculture systems. Agric. Syst. 2005, 85, 271–288. [Google Scholar] [CrossRef]
- Xu, C.Y.; Pu, L.J.; Zhu, M.; Li, J.G.; Chen, X.J.; Wang, X.H.; Xie, X.F. Ecological security and ecosystem services in response to land use change in the Coastal Area of Jiangsu, China. Sustainability 2016, 8, 816. [Google Scholar] [CrossRef]
- Su, Y.X.; Chen, X.Z.; Liao, J.S.; Zhang, H.O.; Wang, C.J.; Ye, Y.Y.; Wang, Y. Modeling the optimal ecological security pattern for guiding the urban constructed land expansions. Urban For. Urban Green. 2016, 19, 35–46. [Google Scholar] [CrossRef]
- Hong, W.Y.; Jiang, R.R.; Yang, C.Y.; Zhang, F.F.; Su, M.; Liao, Q. Establishing an ecological vulnerability assessment indicator system for spatial recognition and management of ecologically vulnerable areas in highly urbanized regions: A case study of Shenzhen, China. Ecol. Indic. 2016, 69, 540–547. [Google Scholar] [CrossRef]
- Wessels, K.J.; Prince, S.D.; Frost, P.E.; van Zyl, D. Assessing the effects of human-induced land degradation in the former homelands of northern South Africa with a 1 km AVHRR NDVI time-series. Remote Sens. Environ. 2004, 91, 47–67. [Google Scholar] [CrossRef]
- Xu, L.Y.; Yin, H.; Li, Z.X.; Li, S. Land ecological security evaluation of Guangzhou, China. Int. J. Environ. Res. Public Health 2014, 11, 10537–10558. [Google Scholar] [CrossRef] [PubMed]
- Gong, J.; Yang, J.X.; Tang, W.W. Spatially explicit landscape-level ecological risks induced by land use and land cover change in a national ecologically representative region in China. Int. J. Environ. Res. Public Health 2015, 12, 14192–14215. [Google Scholar] [CrossRef] [PubMed]
- Li, Y.; Huang, S.L. Landscape ecological risk responses to land use change in the Luanhe River Basin, China. Sustainability 2015, 7, 16631–16652. [Google Scholar] [CrossRef]
- Liu, J.Y.; Liu, M.L.; Zhuang, D.F.; Zhang, Z.X.; Deng, X.Z. Study on spatial pattern of land-use change in China during 1995–2000. Sci. China Ser. D. 2002, 46, 373–382. (In Chinese) [Google Scholar]
- Statistical Bureau of Wuhan. Wuhan Statistical Year Book, 2007; China Statistics Press: Beijing, China, 2007; pp. 102–106.
- Statistical Bureau of Wuhan. Wuhan Statistical Year Book, 2008; China Statistics Press: Beijing, China, 2008; pp. 93–95.
- Statistical Bureau of Wuhan. Wuhan Statistical Year Book, 2009; China Statistics Press: Beijing, China, 2009; pp. 95–99.
- Statistical Bureau of Wuhan. Wuhan Statistical Year Book, 2010; China Statistics Press: Beijing, China, 2010; pp. 90–93.
- Statistical Bureau of Wuhan. Wuhan Statistical Year Book, 2011; China Statistics Press: Beijing, China, 2011; pp. 92–95.
- Statistical Bureau of Wuhan. Wuhan Statistical Year Book, 2012; China Statistics Press: Beijing, China, 2012; pp. 88–94.
- Statistical Bureau of Wuhan. Wuhan Statistical Year Book, 2013; China Statistics Press: Beijing, China, 2013; pp. 86–92.
- National Bureau of Statistics; Ministry of Environmental Protection. China Statistical Year Book on Environment, 2007; China Statistics Press: Beijing, China, 2007; pp. 56–65.
- National Bureau of Statistics; Ministry of Environmental Protection. China Statistical Year Book on Environment, 2008; China Statistics Press: Beijing, China, 2008; pp. 67–78.
- National Bureau of Statistics; Ministry of Environmental Protection. China Statistical Year Book on Environment, 2009; China Statistics Press: Beijing, China, 2009; pp. 58–69.
- National Bureau of Statistics; Ministry of Environmental Protection. China Statistical Year Book on Environment, 2010; China Statistics Press: Beijing, China, 2010; pp. 57–68.
- National Bureau of Statistics; Ministry of Environmental Protection. China Statistical Year Book on Environment, 2011; China Statistics Press: Beijing, China, 2011; pp. 65–75.
- National Bureau of Statistics; Ministry of Environmental Protection. China Statistical Year Book on Environment, 2012; China Statistics Press: Beijing, China, 2012; pp. 78–86.
- National Bureau of Statistics; Ministry of Environmental Protection. China Statistical Year Book on Environment, 2013; China Statistics Press: Beijing, China, 2013; pp. 75–82.
- China Meteorological Data Service Center. Available online: http://data.cma.cn/ (accessed on 9 June 2017).
- Wang, X.L.; Bao, Y.H. Study on the methods of land use dynamic change research. Prog. Geogr. 1999, 18, 83–89. (In Chinese) [Google Scholar]
- Wang, Z.Q.; Chai, J.; Li, B.Q. The impacts of land use change on residents’ living based on urban metabolism: A case study in Yangzhou City of Jiangsu Province, China. Sustainability 2016, 8, 1004. [Google Scholar] [CrossRef]
- Odum, H.T. Emergy in ecosystems. In Ecosystem Theory and Application; Polunin, N., Ed.; John Wiley & Sons: New York, NY, USA, 1986; pp. 337–369. [Google Scholar]
- Brown, M.T.; Ulgiati, S. Emergy-based indices and ratios to evaluate sustainability: Monitoring economies and technology toward environmentally sound innovation. Ecol. Eng. 1997, 9, 51–69. [Google Scholar] [CrossRef]
- Ulgiati, S.; Brown, M.T. Quantifying the environmental support for dilution and abatement of process emissions: The case of electricity production. J. Clean. Prod. 2002, 10, 335–348. [Google Scholar] [CrossRef]
- Ukidwe, N.U.; Bakshi, B.R. Thermodynamic accounting of ecosystem contribution to economic sectors with application to 1992 U.S. economy. Environ. Sci. Technol. 2004, 38, 4810–4827. [Google Scholar] [CrossRef] [PubMed]
- Brown, M.T.; Ulgiati, S.; Jørgensen, S.E.; Constanza, R.; Xu, F.L. Handbook of Ecological Indicators for Assessment of Ecosystem Health, 2nd ed.; CRC Press: Boca Raton, FL, USA, 2010; pp. 333–352. ISBN 978-1-4398-0937-2. [Google Scholar]
- Liu, G.Y.; Yang, Z.F.; Chen, B. Urban metabolism process based on emergy synthesis: Theory and method. Acta Ecol. Sin. 2013, 33, 4539–4551. (In Chinese) [Google Scholar]
- Brown, M.T.; Campbell, D.E.; De Vilbiss, C.; Ulgiati, S. The geobiosphere emergy baseline: A synthesis. Ecol. Model. 2016, 339, 92–95. [Google Scholar] [CrossRef]
- Goedkoop, M.; Spriensma, R. The Eco-Indicator 99, a Damage Oriented Method for Life Cycle Impact Assessment: Methodology Report; Pré Consultants: Amersfoort, The Netherlands, 2000; pp. 75–86. [Google Scholar]
- Wang, J.N.; Yu, F.; Cao, D. Study report 2004 for green national economic accounting. China Popul. Resour. Environ. 2006, 16, 11–17. (In Chinese) [Google Scholar]
- Liu, G.Y.; Yang, Z.F.; Chen, B. Urban metabolism process based on emergy synthesis: A case study of Beijing. Acta Ecol. Sin. 2013, 33, 5078–5089. (In Chinese) [Google Scholar]
- Cao, M.L.; Li, Y.D. Ecological security assessment of Tangshan City based on emergy analysis. J. Appl. Ecol. 2009, 20, 2214–2218. (In Chinese) [Google Scholar]
- Zhao, L.; Li, L.; Wu, Y. Research on the coupling coordination of a sea–land system based on an integrated approach and new evaluation index system: A case study in Hainan Province, China. Sustainability 2017, 9, 859. [Google Scholar] [CrossRef]
- Tang, Z. An integrated approach to evaluating the coupling coordination between tourism and the environment. Tour. Manag. 2015, 46, 11–19. [Google Scholar] [CrossRef]
- Liao, C.B. Quantitative judgement and classification system for coordinated development of environment and economy: A case study of the city group in the Pearl River Delta. Trop. Geogr. 1999, 19, 171–177. (In Chinese) [Google Scholar]
- Yi, P.; Fang, S.M. Coupling coordination between the socio-economic benefits and environmental benefits of the Songshan Global Geopark. Resour. Sci. 2014, 36, 206–216. (In Chinese) [Google Scholar]
- Odum, H.T.; Brown, M.T.; Brandt-Williams, S.B. Handbook of Emergy Evaluation: A Compendium of Data for Emergy Computation Issued in a Series of Folios; Center for Environmental Policy, University of Florida: Gainesville, FL, USA, 2000. [Google Scholar]
- Bastianoni, S.; Campbell, D.E.; Ridolfi, R.; Pulselli, F.M. The solar transformity of petroleum fuels. Ecol. Model. 2009, 220, 40–50. [Google Scholar] [CrossRef]
- Chen, H.S.; Liu, W.Y.; Hsieh, C.M. Integrating ecosystem services and eco-security to assess sustainable development in Liuqiu Island. Sustainability 2017, 9, 1002. [Google Scholar] [CrossRef]
- Han, B.L.; Liu, H.X.; Wang, R.X. Urban ecological security assessment for cities in the Beijing-Tianjin-Hebei metropolitan region based on fuzzy and entropy methods. Ecol. Model. 2015, 318, 217–225. [Google Scholar] [CrossRef]
- Cen, X.T.; Wu, C.F.; Xing, X.F.; Fang, M.; Garang, Z.M.; Wu, Y.Z. Coupling intensive land use and landscape ecological security for urban sustainability: An integrated socioeconomic data and spatial metrics analysis in Hangzhou City. Sustainability 2015, 7, 1459–1482. [Google Scholar] [CrossRef]


| Index | Calculation | Unit |
|---|---|---|
| Environment loading ratio | (N + F + E)/R | - |
| Environmental potential | R/N + F + R | - |
| Ecological cost per GDP | (E2 + E3 + E4)/GDP | seJ/$ |
| Emissions impact per energy consumption | E/F | - |
| Land Types/Period | 2006–2007 | 2007–2008 | 2008–2009 | 2009–2010 | 2010–2011 | 2011–2012 |
|---|---|---|---|---|---|---|
| Cultivated land | −1.04% | −0.65% | −0.78% | −0.98% | −1.31% | −1.45% |
| Water bodies | −0.58% | −0.37% | −0.50% | −0.56% | −0.77% | −0.67% |
| Built-up area | 4.33% | 3.88% | 2.83% | 3.78% | 3.77% | 4.62% |
| Forestry | −0.31% | −0.43% | −0.50% | −0.43% | −0.41% | −0.47% |
| Period | 2006–2007 | 2007–2008 | 2008–2009 | 2009–2010 | 2010–2011 | 2011–2012 |
|---|---|---|---|---|---|---|
| Rt | 1.32% | 0.89% | 1.10% | 1.27% | 1.66% | 1.69% |
| Note | Item | Unit | UEV (seJ/Unit) | Source * | Emergy (seJ/year) | ||||||
|---|---|---|---|---|---|---|---|---|---|---|---|
| 2006 | 2007 | 2008 | 2009 | 2010 | 2011 | 2012 | |||||
| Local Renewable resources (R) | |||||||||||
| 1 | Sunlight | J/year | 1 | [50] | 4.84 × 10¹⁹ | 4.84 × 10¹⁹ | 4.84 × 10¹⁹ | 4.84 × 10¹⁹ | 4.84 × 10¹⁹ | 4.84 × 10¹⁹ | 4.84 × 10¹⁹ |
| 2 | Wind | J/year | 1.91 × 10³ | [50] | 3.23 × 10²² | 3.23 × 10²² | 3.23 × 10²² | 3.23 × 10²² | 3.23 × 10²² | 3.23 × 10²² | 3.23 × 10²² |
| 3 | Rain (geopotential) | J/year | 1.32 × 10⁴ | [50] | 2.71 × 10²³ | 3.16 × 10²³ | 3.28 × 10²³ | 3.00 × 10²³ | 3.46 × 10²³ | 2.55 × 10²³ | 3.66 × 10²³ |
| 4 | Rain (chemical) | J/year | 2.32 × 10⁴ | [50] | 1.03 × 10²² | 1.20 × 10²² | 1.24 × 10²² | 1.14 × 10²² | 1.31 × 10²² | 9.69 × 10²¹ | 1.39 × 10²² |
| 5 | Geothermal heat | J/year | 5.38 × 10⁴ | [50] | 5.44 × 10²⁰ | 5.44 × 10²⁰ | 5.44 × 10²⁰ | 5.44 × 10²⁰ | 5.44 × 10²⁰ | 5.44 × 10²⁰ | 5.44 × 10²⁰ |
| Local Non-renewable resources (N) | |||||||||||
| 6 | Topsoil loss | J/year | 9.35 × 10⁴ | [50] | 1.08 × 10²¹ | 1.06 × 10²¹ | 1.06 × 10²¹ | 1.05 × 10²¹ | 1.04 × 10²¹ | 1.03 × 10²¹ | 1.01 × 10²¹ |
| Imported (non-renewable) inputs (F) | |||||||||||
| 7 | Coal | J/year | 5.08 × 10⁴ | [50] | 3.33 × 10²¹ | 3.94 × 10²¹ | 3.85 × 10²¹ | 1.82 × 10²² | 2.12 × 10²² | 1.82 × 10²² | 2.13 × 10²² |
| 8 | Coke | J/year | 8.36 × 10⁴ | [51] | 1.08 × 10²² | 1.04 × 10²² | 1.24 × 10²² | 1.19 × 10²² | 1.58 × 10²² | 1.64 × 10²² | 1.54 × 10²² |
| 9 | Crude Oil | J/year | 6.90 × 10⁴ | [51] | 1.17 × 10²² | 1.24 × 10²² | 1.15 × 10²² | 1.31 × 10²² | 1.44 × 10²² | 1.46 × 10²² | 1.25 × 10²² |
| 10 | Gasoline | J/year | 7.98 × 10⁴ | [51] | 2.36 × 10²² | 2.53 × 10²² | 3.22 × 10²² | 3.23 × 10²² | 3.36 × 10²² | 3.62 × 10²² | 4.12 × 10²² |
| 11 | Kerosene | J/year | 8.36 × 10⁴ | [51] | 4.95 × 10²² | 5.46 × 10²² | 6.64 × 10²² | 7.28 × 10²² | 7.51 × 10²² | 7.55 × 10²² | 8.09 × 10²² |
| 12 | Liquefied petroleum gas | J/year | 8.44 × 10⁴ | [51] | 1.11 × 10¹⁹ | 1.56 × 10¹⁹ | 1.63 × 10¹⁹ | 1.76 × 10¹⁹ | 2.87 × 10¹⁹ | 2.05 × 10¹⁹ | 1.43 × 10¹⁹ |
| 13 | Electricity | J/year | 1.32 × 10⁵ | [50] | 1.10 × 10²² | 1.36 × 10²² | 1.36 × 10²² | 1.48 × 10²² | 1.68 × 10²² | 1.83 × 10²² | 1.92 × 10²² |
| Emissions Impact (E) | |||||||||||
| Ecological services needed to dissipate the emissions (E1) | |||||||||||
| 14 | SO2 | J/year | ** | - | 7.75 × 10¹⁹ | 7.43 × 10¹⁹ | 6.89 × 10¹⁹ | 6.66 × 10¹⁸ | 5.15 × 10¹⁹ | 6.02 × 10¹⁹ | 5.87 × 10¹⁹ |
| 15 | Industrial dust | J/year | ** | - | 1.94 × 10¹⁸ | 1.23 × 10¹⁸ | 1.18 × 10¹⁸ | 1.14 × 10¹⁸ | 1.19 × 10¹⁸ | 2.47 × 10¹⁸ | 2.31 × 10¹⁸ |
| 16 | Soot | J/year | ** | - | 3.31 × 10¹⁹ | 3.11 × 10¹⁹ | 2.82 × 10¹⁹ | 2.36 × 10¹⁹ | 1.01 × 10¹⁹ | 2.10 × 10¹⁹ | 1.96 × 10¹⁹ |
| 17 | NOx | J/year | ** | - | 4.68 × 10¹⁹ | 4.49 × 10¹⁹ | 4.17 × 10¹⁹ | 4.03 × 10¹⁸ | 3.11 × 10¹⁹ | 3.74 × 10¹⁹ | 3.46 × 10¹⁹ |
| 18 | COD | J/year | ** | - | 2.37 × 10²¹ | 2.27 × 10²¹ | 2.20 × 10²¹ | 2.16 × 10²¹ | 2.10 × 10²¹ | 2.44 × 10²¹ | 2.31 × 10²¹ |
| 19 | NH3-N | J/year | ** | - | 2.63 × 10²¹ | 3.47 × 10²¹ | 4.79 × 10²¹ | 3.82 × 10²¹ | 3.64 × 10²¹ | 3.89 × 10²¹ | 4.74 × 10²¹ |
| Emergy of the human life losses caused by the emissions (E2) | |||||||||||
| 20 | SO2 | J/year | ** | - | 6.51 × 10¹⁹ | 6.25 × 10¹⁹ | 5.79 × 10¹⁹ | 5.60 × 10¹⁸ | 4.33 × 10¹⁹ | 5.06 × 10¹⁹ | 4.94 × 10¹⁹ |
| 21 | NOx | J/year | ** | - | 1.60 × 10²⁰ | 1.53 × 10²⁰ | 1.42 × 10²⁰ | 1.37 × 10¹⁹ | 1.06 × 10²⁰ | 1.27 × 10²⁰ | 1.18 × 10²⁰ |
| 22 | Industrial dust | J/year | ** | - | 4.50 × 10¹⁹ | 2.86 × 10¹⁹ | 2.73 × 10¹⁹ | 2.63 × 10¹⁹ | 2.76 × 10¹⁹ | 5.73 × 10¹⁹ | 5.34 × 10¹⁹ |
| 23 | Hexavalent chromium | J/year | ** | - | 2.35 × 10¹⁷ | 2.06 × 10¹⁷ | 3.53 × 10¹⁷ | 7.64 × 10¹⁷ | 1.41 × 10¹⁸ | 9.99 × 10¹⁷ | 8.23 × 10¹⁷ |
| Emergy of the ecological losses due to the emissions (E3) | |||||||||||
| 24 | SO2 | J/year | ** | - | 1.10 × 10¹⁹ | 1.06 × 10¹⁹ | 9.82 × 10¹⁸ | 9.49 × 10¹⁷ | 7.33 × 10¹⁸ | 8.58 × 10¹⁸ | 8.36 × 10¹⁸ |
| 25 | NOx | J/year | ** | - | 9.15 × 10¹⁹ | 8.77 × 10¹⁹ | 8.14 × 10¹⁹ | 7.87 × 10¹⁹ | 6.08 × 10¹⁹ | 7.30 × 10¹⁹ | 6.76 × 10¹⁹ |
| Emergy of the land occupation caused by the emissions (E4) | |||||||||||
| 26 | Solid wastes | J/year | ** | - | 2.84 × 10¹⁶ | 1.82 × 10¹⁶ | 2.45 × 10¹⁶ | 3.09 × 10¹⁶ | 5.27 × 10¹⁵ | 9.35 × 10¹⁵ | 1.91 × 10¹⁶ |
| Emergy Flows | Value (seJ/year) | ||||||
|---|---|---|---|---|---|---|---|
| 2006 | 2007 | 2008 | 2009 | 2010 | 2011 | 2012 | |
| R | 2.71 × 10²³ | 3.16 × 10²³ | 3.28 × 10²³ | 3.00 × 10²³ | 3.46 × 10²³ | 2.55 × 10²³ | 3.66 × 10²³ |
| N | 1.08 × 10²¹ | 1.06 × 10²¹ | 1.06 × 10²¹ | 1.05 × 10²¹ | 1.04 × 10²¹ | 1.03 × 10²¹ | 1.01 × 10²¹ |
| F | 1.10 × 10²³ | 1.20 × 10²³ | 1.40 × 10²³ | 1.63 × 10²³ | 1.77 × 10²³ | 1.79 × 10²³ | 1.91 × 10²³ |
| E1 | 5.16 × 10²¹ | 5.89 × 10²¹ | 7.13 × 10²¹ | 6.01 × 10²¹ | 5.84 × 10²¹ | 6.45 × 10²¹ | 7.16 × 10²¹ |
| E2 | 2.70 × 10²⁰ | 2.44 × 10²⁰ | 2.28 × 10²⁰ | 4.64 × 10¹⁹ | 1.78 × 10²⁰ | 2.36 × 10²⁰ | 2.22 × 10²⁰ |
| E3 | 1.03 × 10²⁰ | 9.83 × 10¹⁹ | 9.12 × 10¹⁹ | 7.96 × 10¹⁹ | 6.81 × 10¹⁹ | 8.16 × 10¹⁹ | 7.60 × 10¹⁹ |
| E4 | 2.84 × 10¹⁶ | 1.82 × 10¹⁶ | 2.45 × 10¹⁶ | 3.09 × 10¹⁶ | 5.27 × 10¹⁵ | 9.35 × 10¹⁵ | 1.91 × 10¹⁶ |
| E | 5.53 × 10²¹ | 6.23 × 10²¹ | 7.45 × 10²¹ | 6.14 × 10²¹ | 6.08 × 10²¹ | 6.77 × 10²¹ | 7.46 × 10²¹ |
| U | 3.88 × 10²³ | 4.44 × 10²³ | 4.76 × 10²³ | 4.70 × 10²³ | 5.30 × 10²³ | 4.42 × 10²³ | 5.65 × 10²³ |
| Index | Value | ||||||
|---|---|---|---|---|---|---|---|
| 2006 | 2007 | 2008 | 2009 | 2010 | 2011 | 2012 | |
| Environment loading ratio | 0.43 | 0.40 | 0.45 | 0.57 | 0.53 | 0.73 | 0.54 |
| Environmental potential | 0.71 | 0.72 | 0.70 | 0.65 | 0.66 | 0.59 | 0.66 |
| Ecological cost per GDP (seJ/$) | 9.45 × 10⁹ | 7.26 × 10⁹ | 5.27 × 10⁹ | 1.86 × 10⁹ | 3.01 × 10⁹ | 3.20 × 10⁹ | 2.53 × 10⁹ |
| Emissions impact per energy consumption | 0.05 | 0.05 | 0.05 | 0.04 | 0.03 | 0.04 | 0.04 |
© 2017 by the authors. Licensee MDPI, Basel, Switzerland. This article is an open access article distributed under the terms and conditions of the Creative Commons Attribution (CC BY) license (http://creativecommons.org/licenses/by/4.0/).
Share and Cite
Chai, J.; Wang, Z.; Zhang, H. Integrated Evaluation of Coupling Coordination for Land Use Change and Ecological Security: A Case Study in Wuhan City of Hubei Province, China. Int. J. Environ. Res. Public Health 2017, 14, 1435. https://doi.org/10.3390/ijerph14111435
Chai J, Wang Z, Zhang H. Integrated Evaluation of Coupling Coordination for Land Use Change and Ecological Security: A Case Study in Wuhan City of Hubei Province, China. International Journal of Environmental Research and Public Health. 2017; 14(11):1435. https://doi.org/10.3390/ijerph14111435
Chicago/Turabian StyleChai, Ji, Zhanqi Wang, and Hongwei Zhang. 2017. "Integrated Evaluation of Coupling Coordination for Land Use Change and Ecological Security: A Case Study in Wuhan City of Hubei Province, China" International Journal of Environmental Research and Public Health 14, no. 11: 1435. https://doi.org/10.3390/ijerph14111435