1. Introduction
Dental diseases are the most prevalent non-communicable disease globally [
1] and the leading cause of preventable hospitalisations among children in Australia [
2]. The prevalence of dental caries in Australian children began to decline significantly during the 1970s. However, in the mid-1990s, this downward trend reversed and caries prevalence has increased steadily ever since [
3,
4]. In addition, disparities in caries experience exist between children based on socio-economic status, remoteness and availability of fluoridated water [
4].
The relationship between free sugar intakes and dental caries is well established, although the lower level of the effect is less clear [
1,
5,
6,
7]. In 2015, the World Health Organization (WHO) released the
Guideline: Sugars intake for adults and children, with a focus on preventing dental disease and obesity [
1]. Although the Guideline sets out a strong recommendation to reduce the intake of free sugars to less than 10% of total energy intake, the conditional recommendation to further reduce intake to less than 5% of total energy was limited by the low quality of evidence. The supporting evidence review highlights the lack of consistency and precision of dietary assessment methods in dental studies [
5], leading to a call within the Guideline for new studies with an improved dietary assessment methodology [
1].
Controlling for key dietary risk factors is a critical component of oral health research. However, dietary assessment is complex, and reviews of dental studies highlight the inconsistency and imprecision of approaches used for measuring dietary intakes and food behaviours [
6,
8,
9]. Newly designed dietary assessment tools should be validated prior to use, and existing tools should be calibrated to each cohort [
10,
11,
12]. An ongoing limitation of dental research is the lack of rigour in dietary assessment methodology, with many studies still not using validated dietary questionnaires to capture sugars intake, and fewer still undertaking internal calibration [
5,
8].
One reason for this lack of rigour is that an appropriate tool often does not exist [
8,
13]. Dietary assessment design and validation is a branch of nutrition research, and dental research teams do not always have the resources or nutrition expertise required to undertake validity studies. Childhood dietary intake is particularly challenging to capture, due to the participant age and varying ability to self-report intake, as well as the greater rate of fluctuation in dietary intake patterns throughout childhood compared to adults [
10,
14]. This is especially relevant throughout the first three years of life, as a child progresses from a newborn diet of breast milk or infant formula, via a range of textures, through to family foods. This transitioning diet combined with the unique dietary data requisites of dental research means that the tools used during the pre-school years need to be age-specific and developed purposely for dental research.
There are a number of methods used in dietary assessment, but the Food Frequency Questionnaire (FFQ) is considered the most appropriate data collection method for large, prospective studies [
10,
11,
12]. Once developed, it is quick and inexpensive to administer and process, as it can be self-administered and rapidly analysed. Additionally, it has a lower subject burden than weighed food records, and captures usual dietary intakes over a longer period of time [
10,
11]. Although it is a commonly used method, the FFQ must be tailored to both the population and outcomes of interest if it is to produce useful data [
10,
11,
12].
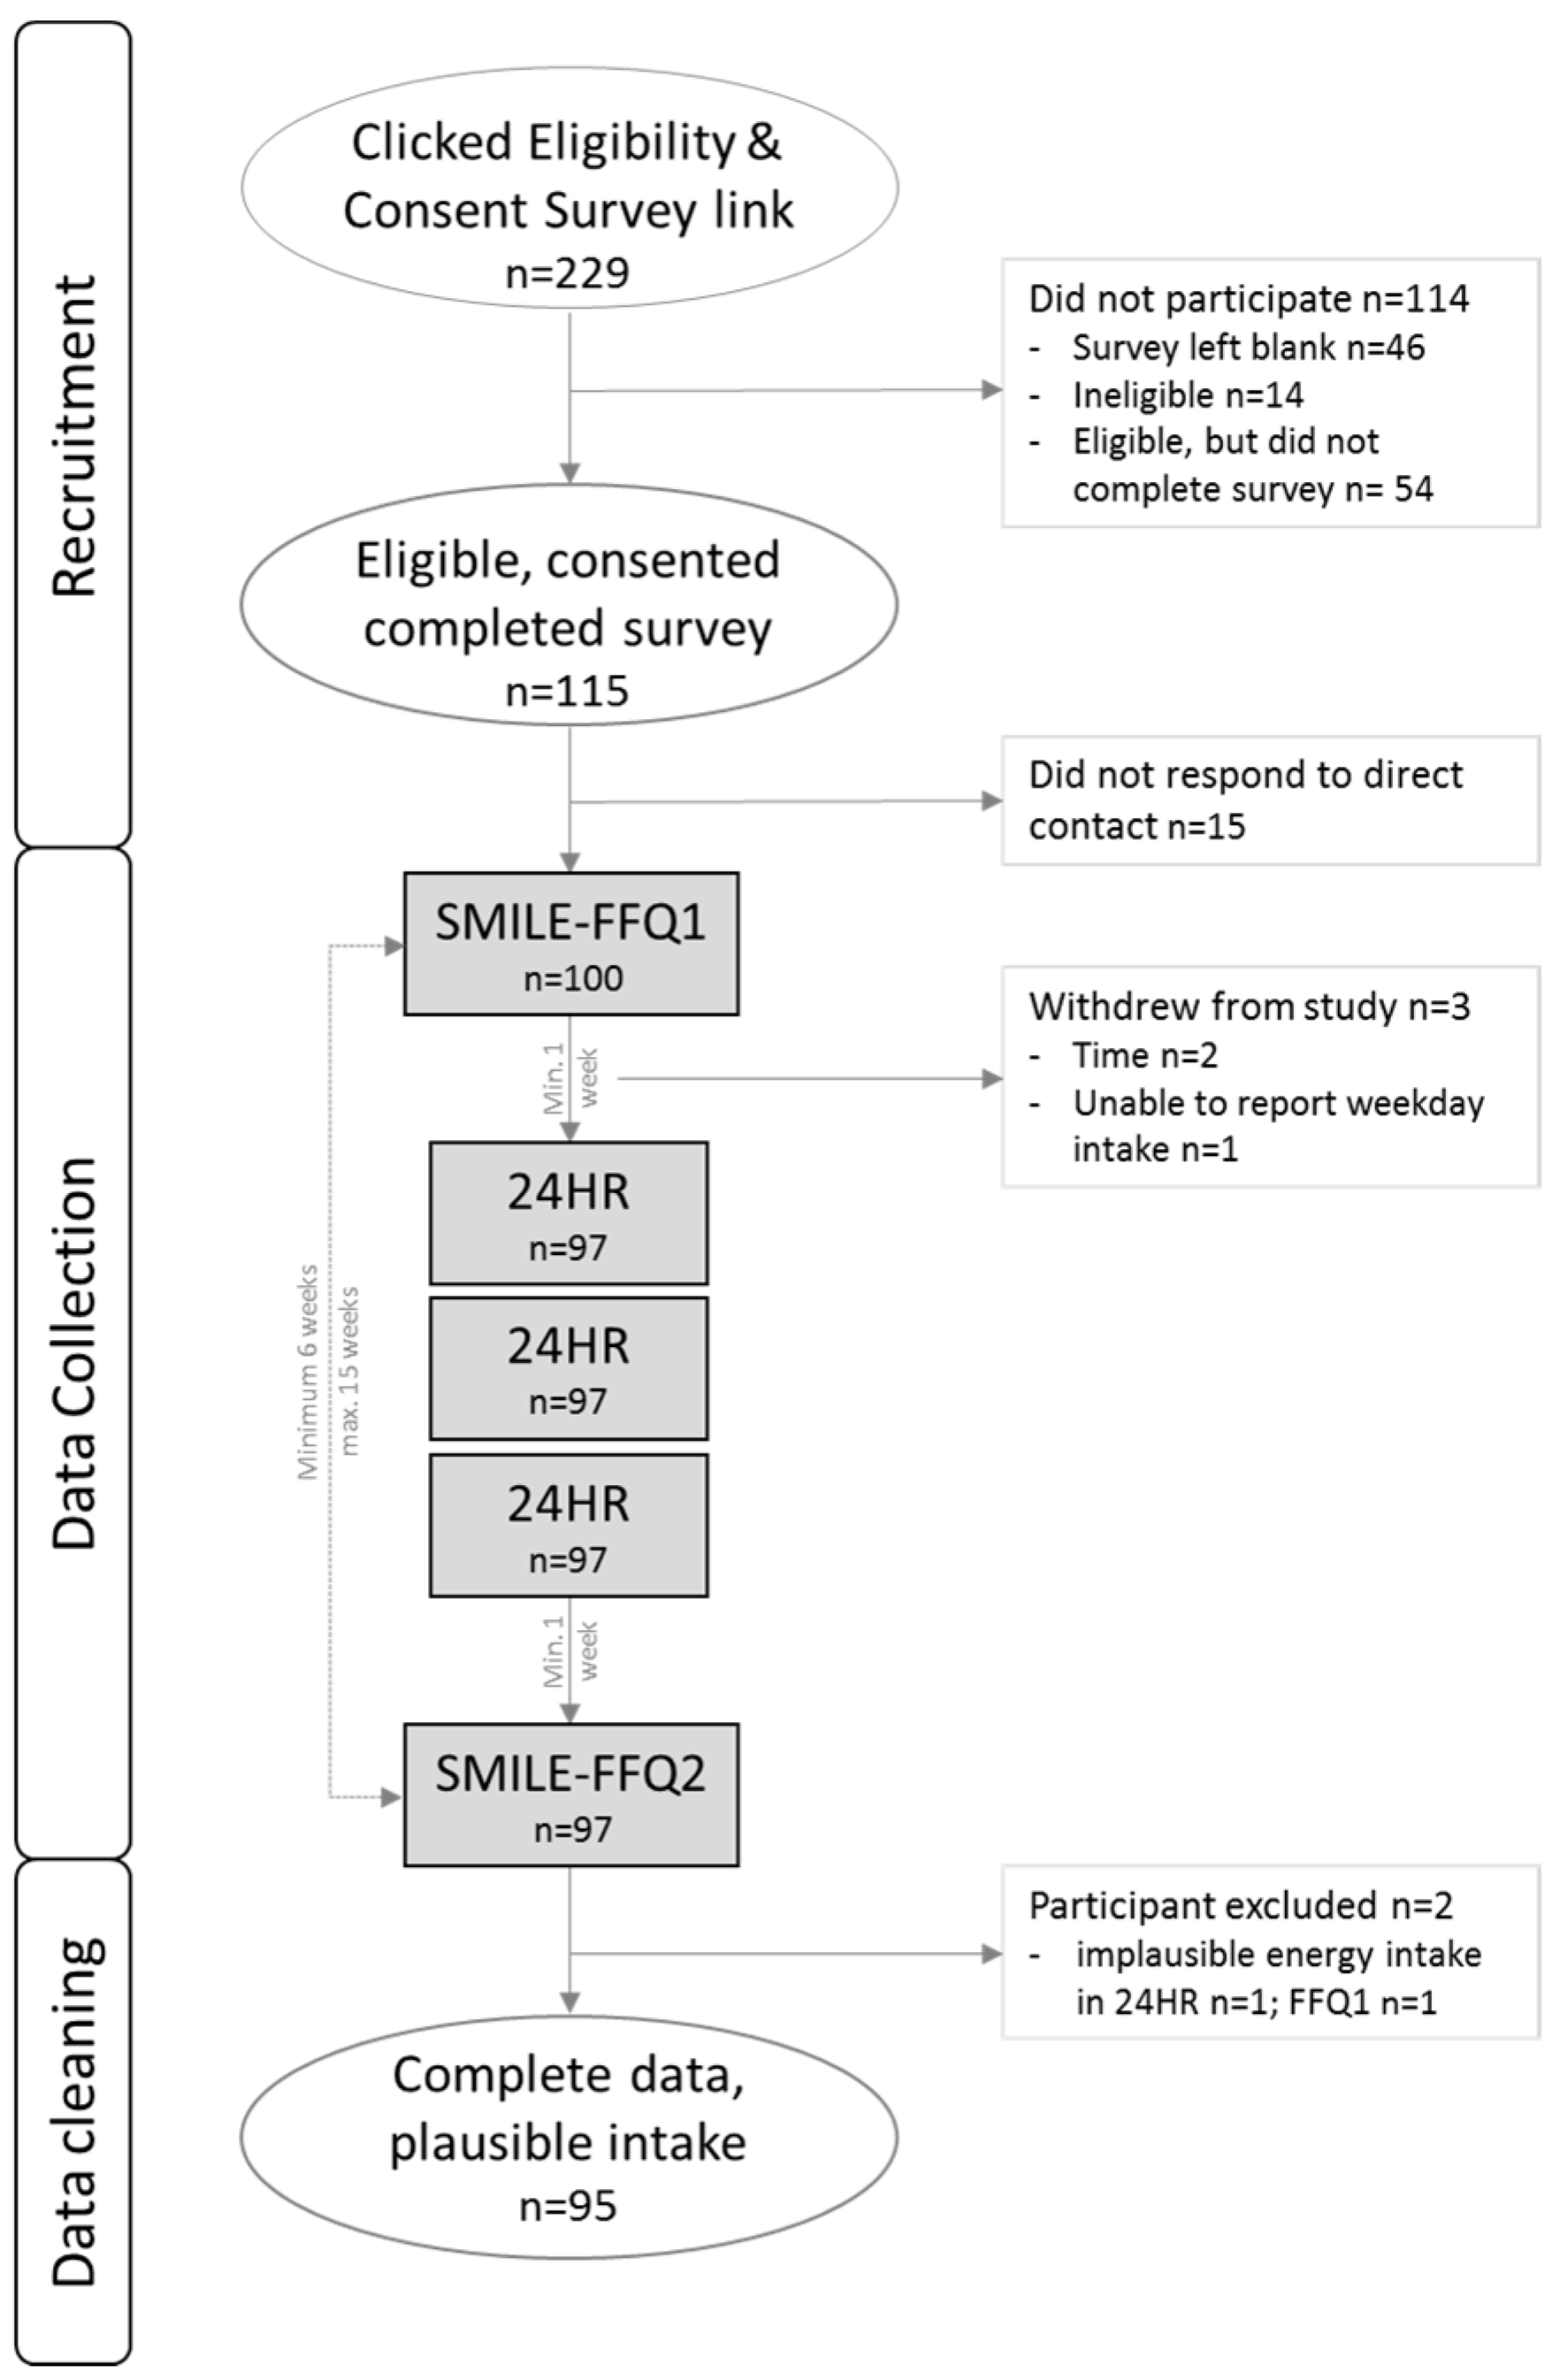
The aim of this study is twofold: firstly, to develop a FFQ to assess intakes of total and free sugars from major food and beverage sources, fluoride from non-water sources and other key foods relevant to dental caries in Australian toddlers aged 18–30 months via a proxy report. Secondly, to investigate the relative validity and reproducibility of this FFQ for total and free sugars against repeat 24-h recalls (24HR).
4. Discussion
4.1. Validity
Food Frequency Questionnaires aim to provide estimates of long-term dietary intake, and are generally considered unsuited to estimating absolute daily intakes of nutrients or capturing short-term dietary intakes [
10,
11]. The findings of this validation study reflect this, as the weakest agreement was observed in comparisons of absolute intake.
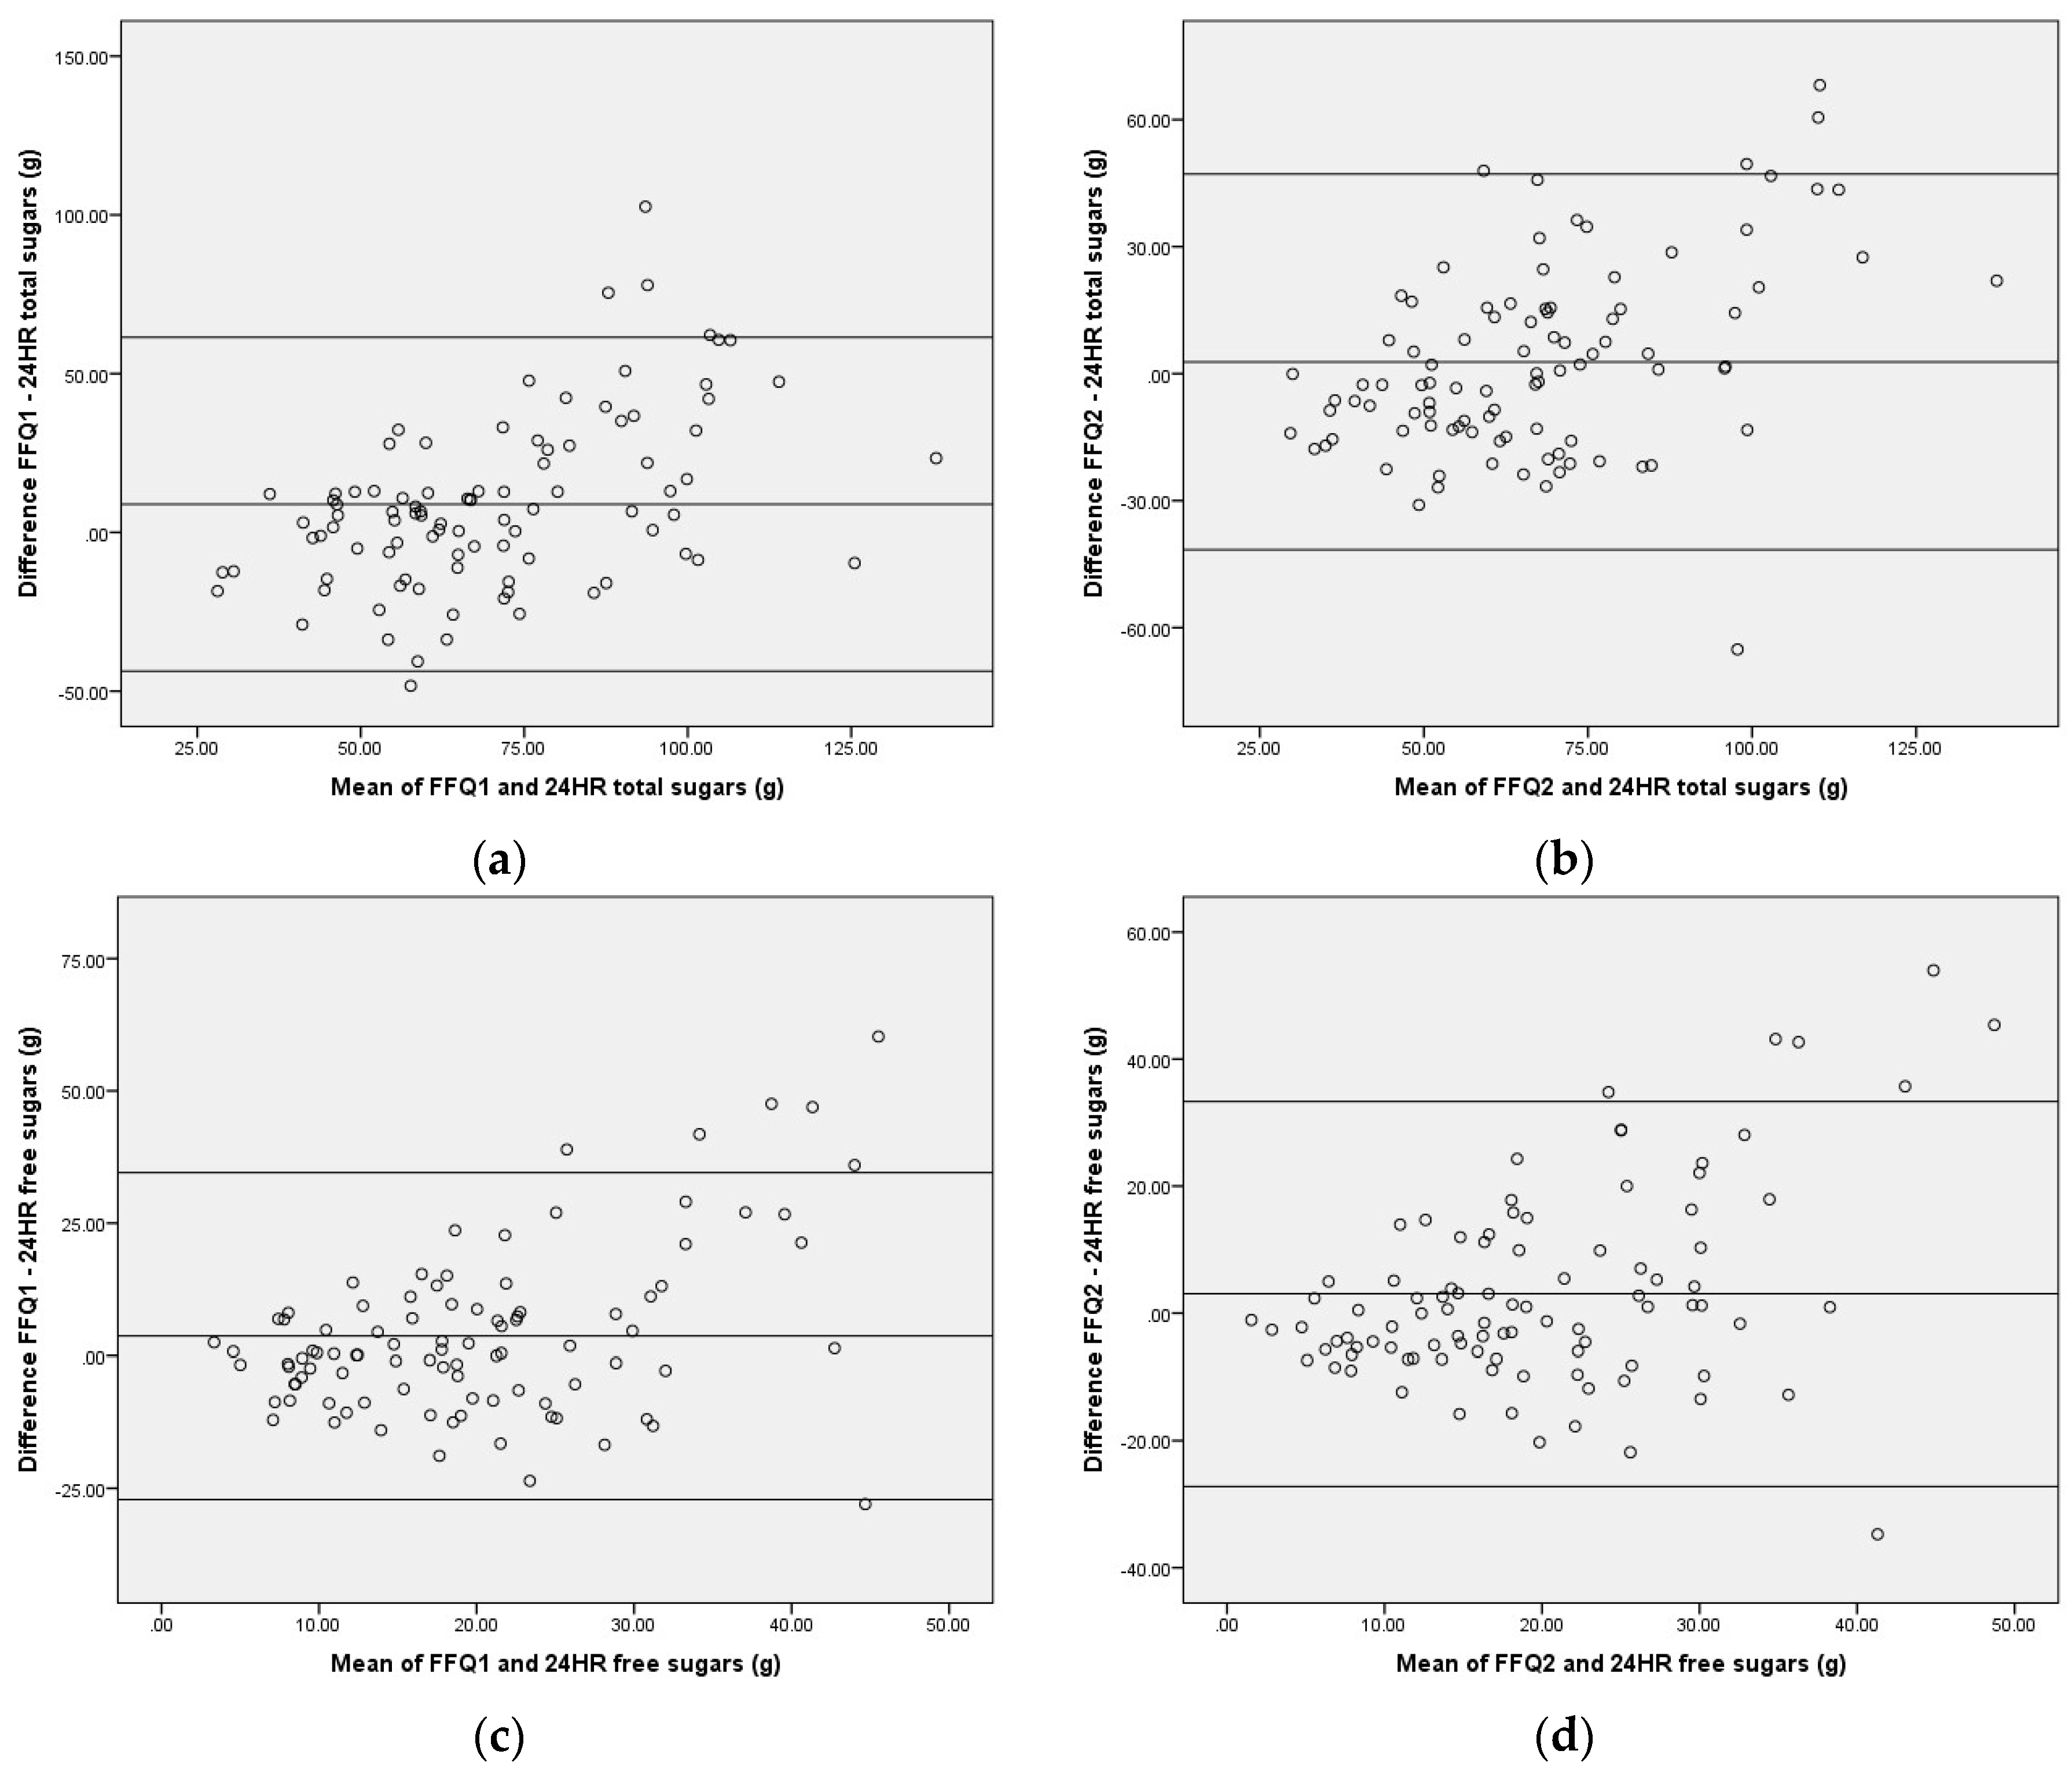
Combining the findings of the various tests, it is evident that individual level validity is more consistently rated as good than group level validity, and that the tool is most effective for ranking participants but not necessarily for determining absolute intakes of total and free sugars. The tendency of the tool to underestimate intakes in participants with lower 24HR values and overestimate intakes in those with higher values is consistent with other FFQs [
23,
33], and has a lesser impact on the accuracy of ranking than of absolute intakes. These results indicate that the SMILE-FFQ performs comparably to the 24HR as a measure of total and free sugars of individuals and to a lesser extent the group, and is therefore acceptable for use in observational studies of Australian toddlers if absolute sugars intakes is not an explanatory or outcome measure.
At present, the number of available tools which assess dietary intakes during early childhood is very small, and fewer still capture total sugars. To our knowledge, this is the first FFQ designed to measure free sugars in this age group (18–30 months), and the first Australian FFQ that has been validated for total or free sugars in any pre-school aged children (0–5 years). As such, comparison data in this age group are scarce. The National Infant Feeding Survey focuses on milk-feeding methods in the first two years of life rather than total diet [
18], and although the recent Australian Health Survey included participants as young as two, reporting of results for this age group is incomplete [
34].
Bell et al. [
35] recently developed a short food-group-based dietary risk assessment tool for use with Australian toddlers (aged 1–3 years). This 19-item screener generates a dietary risk score between 0 and 100, but is not designed to obtain nutrient values. Flood et al. [
25] developed a 17-item screener in FFQ style to rank Australian pre-school aged children (2–5 years) based on key dietary habits. Four questions pertained to major contributors of free sugars (biscuits, confectionery, soft-drink, fruit juice); however, two of these performed poorly against the reference method. Burrows et al. [
36] developed the 70-item Australian Recommended Food Score for Pre-schoolers (ARFS-P), but to date, this has only provided validation reporting against the FFQ from which it was developed, and scoring occurs at the food group rather than nutrient level, with a focus on core foods.
A FFQ has been developed for 12-month-olds in the United Kingdom [
22] and modified for use in New Zealand with toddlers aged 12–24 months [
24,
37]; however, it was not designed to capture free sugars, and the New Zealand validation studies do not report findings for total sugars. Nevertheless, it is rarely appropriate to use a tool designed for another population without adaptation and further validation, as food supply, composition, and terminology differ between countries. A notable example is the eight-item screener developed to assess the consumption of sugar snacks in Ugandan school-aged children (mean 12.4 years of age) [
38]. This tool lists tea and coffee as two of the eight food items included and as such is not transferable to Australian children. Although tea and coffee are significant contributors to sugar consumption of Ugandan children, the 2007 Australian National Children’s Nutrition and Physical Activity Survey reports a very low prevalence of consumption of tea and coffee in this age group, at 6.6% and 2.3%, respectively [
39], and so the tool is not compatible with Australian research.
4.2. Challenges in Dietary Assessment of Pre-School Aged Children
Dietary assessment in early childhood presents some unique challenges. Young children are unable to self-report, so proxy reporting must be used to collect the data from a surrogate [
10,
14,
40,
41]. Parents are not always aware of their child’s complete dietary intake as feeding roles may be shared amongst other caregivers and child-care providers [
14,
41]. In addition, toddlers tend to have higher amounts of plate waste than older children and adults, which makes estimating actual consumption more cognitively complex [
10,
14].
In addition, toddlers experience a unique food landscape. Portion sizes are small and highly variable, and the frequency of meals and snacks tends to be greater than for older children and adults. Young children also have strong appetite cues [
42], and experience irregular patterns of rapid physical and cognitive growth. As a result, food intake and preferences have greater variability than that of adults in terms of both day-to-day intake and overall eating pattern, and change rapidly across the pre-school years [
10,
14,
41]. An FFQ for this age needs to offer a wide range of lower-size portion options that include very small values. These small amounts seem negligible to overall nutritional intake; however, if lower end options are not provided, reporters may select the lowest available value, which may be several times larger than what was actually consumed. Also, due to the smaller energy and nutrient requirements of pre-school aged children, the small, frequent “tastes” of food may add up to a significant proportion of overall intake. The development of FFQs for this age bracket has often occurred by testing the validity of a tool originally designed for adults or older children, the portion sizes of which may be inappropriate and contribute to the common finding of overestimation [
23,
33,
43,
44].
These challenges limit the accuracy of most dietary assessment methods, including the SMILE-FFQ. The design of this FFQ attempts to minimise error from these challenges by targeting a narrow age range, providing portion size options specifically suited to toddlers and including only those foods of relevance to total and free sugars intakes rather than total diet. To reduce the difficulties arising from the high variability of the toddler diet, participants were asked to report “usual intake”, rather than over a specified period of weeks. However, some participants may have found this more challenging as usual intake may be difficult to define.
The FFQ is well suited to comparing food group contribution to nutrient intake, as further interrogation of FFQ data can be conducted at the line item or block level. However, FFQs are unable to separate out individual sources at the single food level. For example, the SMILE-FFQ is able to identify major sources of sugar by food type (milk, yoghurt, biscuits, chocolate, breakfast cereal, table sugar, etc.), but is unable to describe precisely where, when, and in what combinations these foods are consumed.
4.3. Limitations of the Study
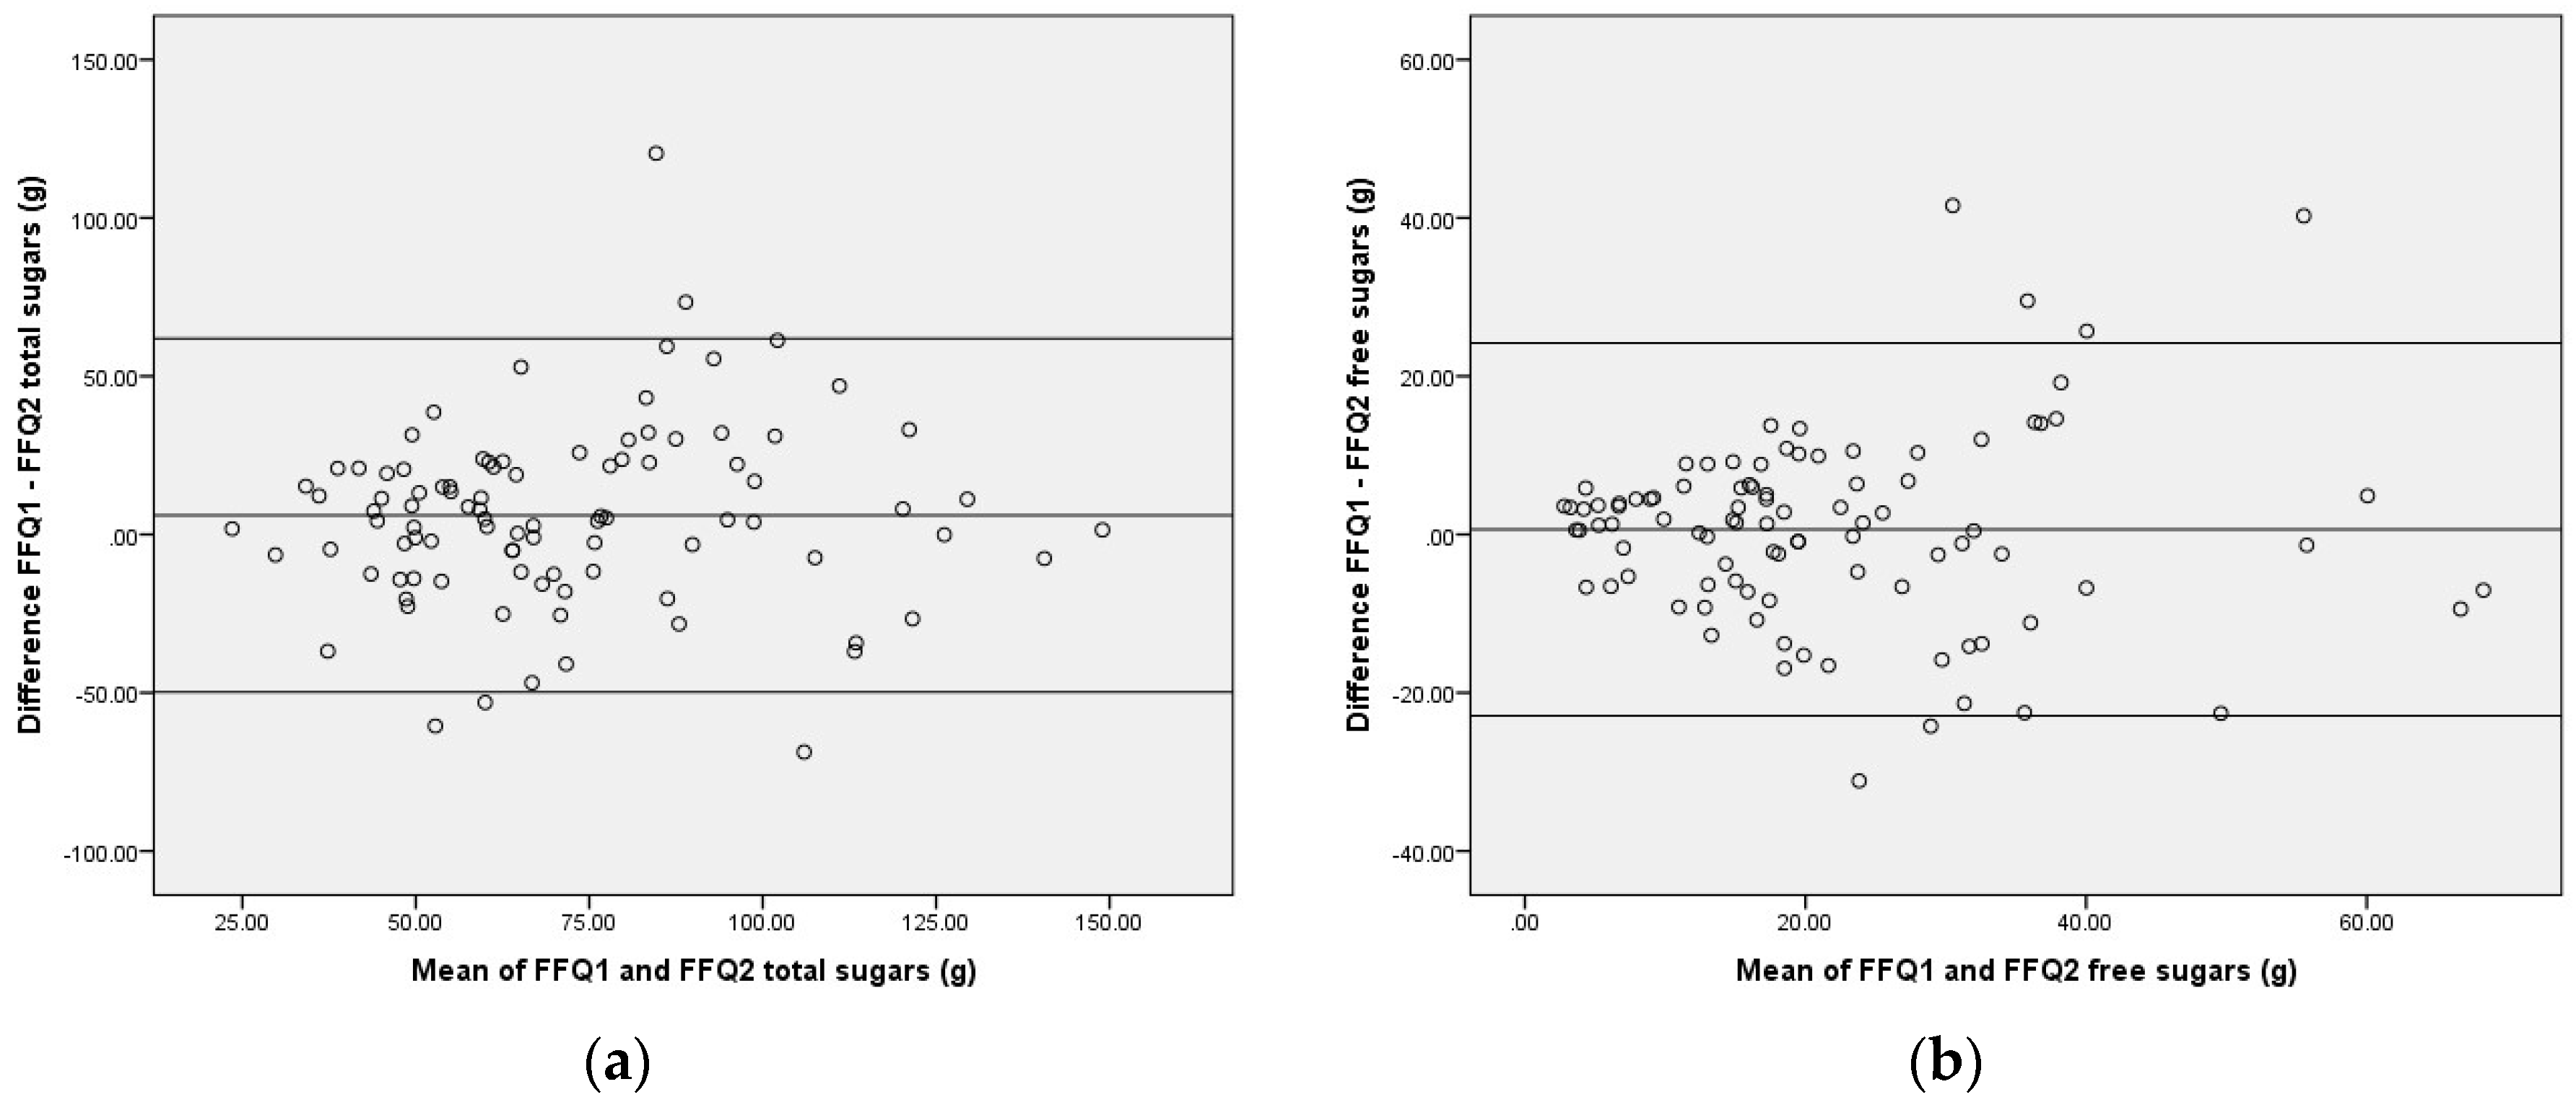
Participation in the 24HR may have increased parent awareness of their child’s food intake and influenced their responses to SMILE-FFQ2. This influence could partially explain the wide limits of agreement between repeat administrations of SMILE-FFQ, and why the total sugars results from SMILE-FFQ2 showed greater agreement with 24HR, a finding consistent with other studies of this type [
45].
It is also likely that social desirability bias played a greater role in the 24HR, which were conducted by a dietitian via telephone interview, than the FFQs, which were self-administered online. This may explain some of the proportional bias; that participants who reported the highest sugars intakes via the online SMILE-FFQ provided more conservative estimates when reporting to the dietitian than those with lower SMILE-FFQ sugars intakes. Other studies support this theory, suggesting social desirability bias influences parents’ reporting of their children’s intakes, particularly in relation to their child’s weight or higher levels of foods that are perceived as unhealthy [
46,
47]. The recent focus on reducing the intake of free sugars by the scientific community, coupled with current food fads in popular media that demonise sugar intake from any and all sources, may have exacerbated the rates of underreporting of foods high in sugars via telephone interviews. This does not, however, account for the underestimation at lower intakes.
There is some evidence to indicate that seasonal variation may affect dietary assessment responses; however, these effects are generally considered minor, with the greatest variation between different types of fruit and vegetables [
48,
49]. This FFQ does not differentiate between types of fruit, but rather asks participants to estimate the overall frequency of consumption of any fruit. Additionally, the reference method (24HR) was administered in the middle of the data collection phase, which for most participants (90%), was completed within two months. This is likely to have ameliorated the effect of seasonal change on questionnaire responses.
A further limitation of this study design is the absence of a biomarker for validation. A urinary sugars biomarker based on a 24-h urine collection could be a suitable reference measure in future studies; however, research to date is limited by small sample sizes [
50] and a 24-h urine collection in 18–30 month olds may be particularly challenging. In order to provide an estimate of usual intake, multiple collections would be required, resulting in a high cost and subject burden. In the absence of this, there is no reference instrument that can provide an accurate measure of a person’s usual dietary intake. Repeat 24-h recalls are accepted as a suitable but imperfect reference instrument, considered to contain less systematic error than FFQs [
11,
12]. The collection of intake data on three non-consecutive days in the 24HR may not have been sufficient to represent usual intake for some participants. Use of this imperfect reference instrument may have resulted in correlated errors between the two methods. Conversely, discrepancy between the SMILE-FFQ and 24HR may be the result of departure from true intake by either or both questionnaires.
4.4. Opportunities
As an online tool, the SMILE-FFQ is easily administered and shows potential for use in future Australian dental observational studies involving toddlers and pre-schoolers. If, however, the cohort is substantially different from the one described here, or the tool is modified in any way, an external or internal validation study is required to assess validity [
10,
11,
12]. Further information about the questionnaire is available from the researchers upon request. The SMILE-FFQ has recently been administered to a cohort of approximately 1600 families as part of the NHMRC-funded Study of Mothers and Infants Life Events affecting oral health (SMILE) [
15].


