
Regional Variations of Public Perception on Contaminated Industrial Sites in China and Its Influencing Factors


Abstract
:1. Introduction
2. Materials and Methods
2.1. Questionnaire Design
2.2. Sample Collection
2.3. Data Analysis
3. Results and Discussion
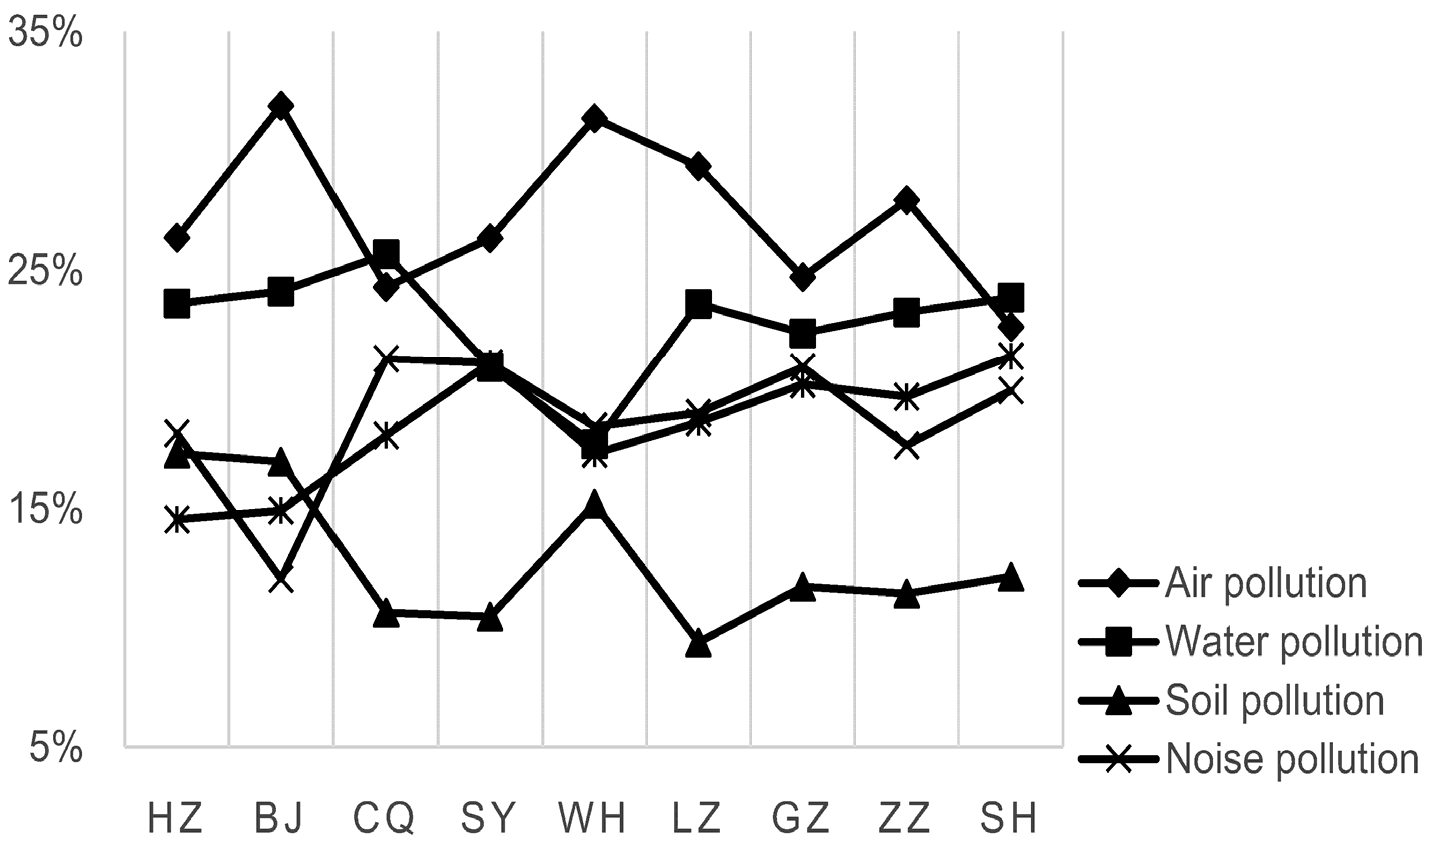
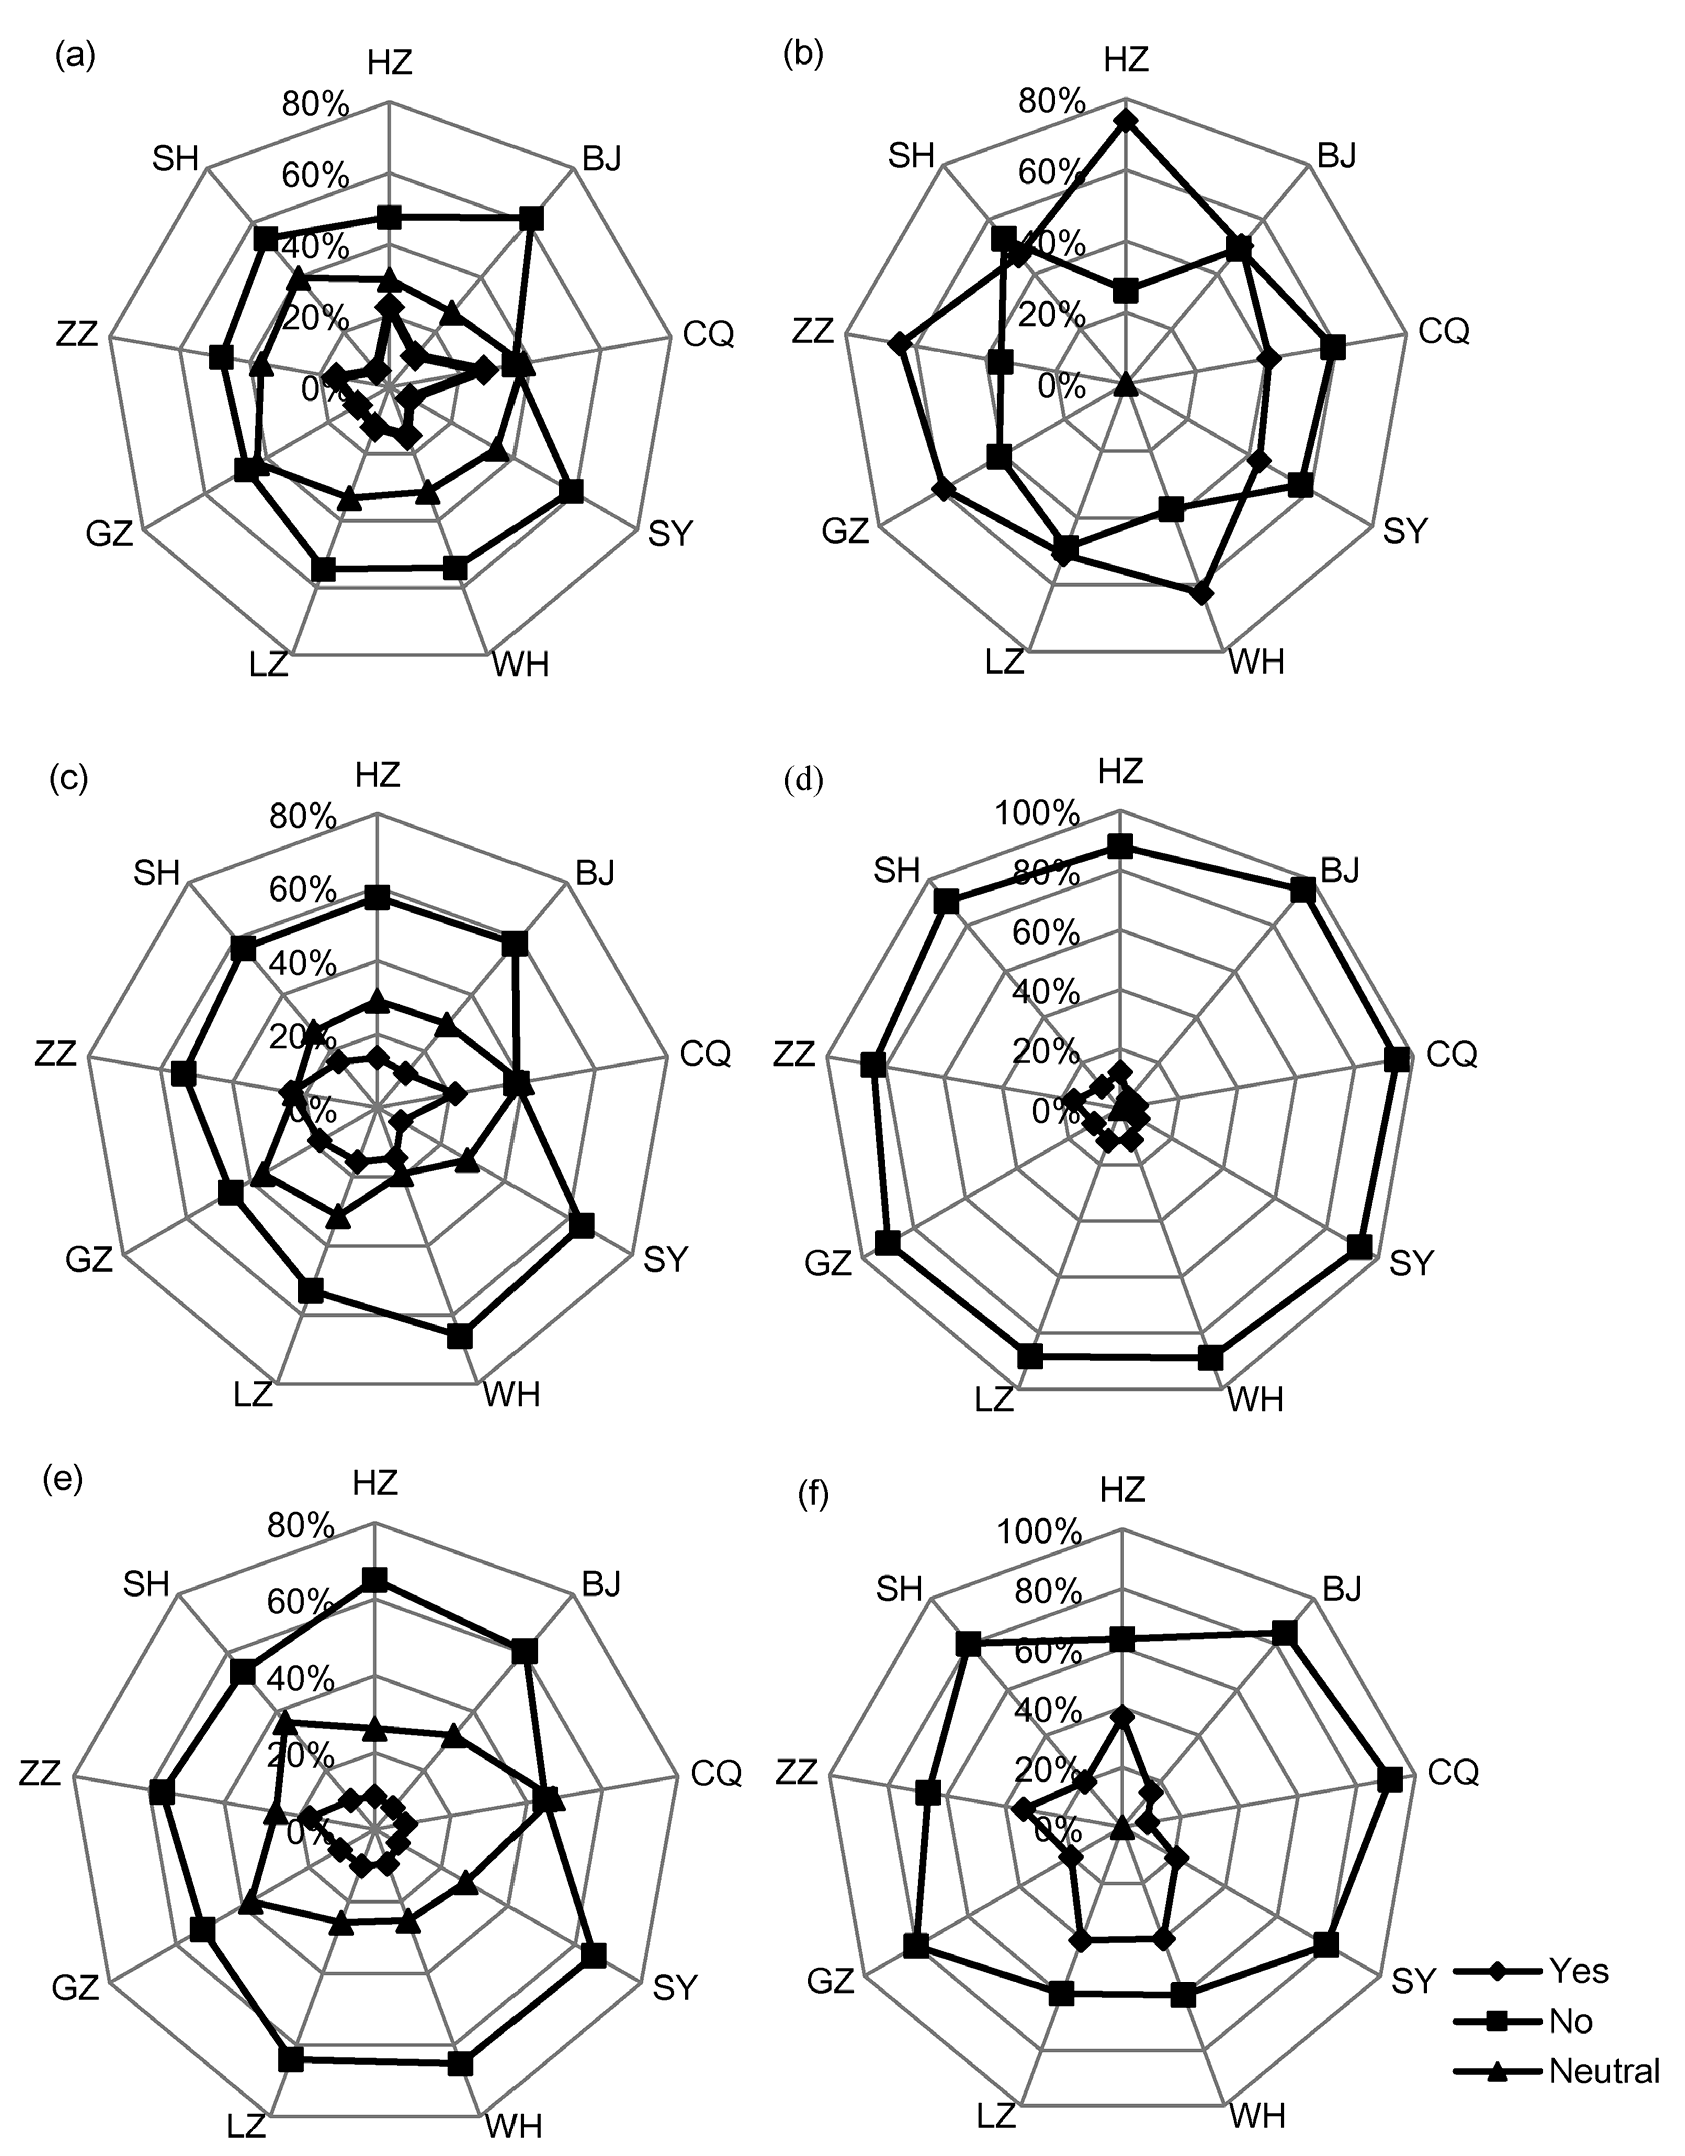
3.1. Perception on Soil Contamination
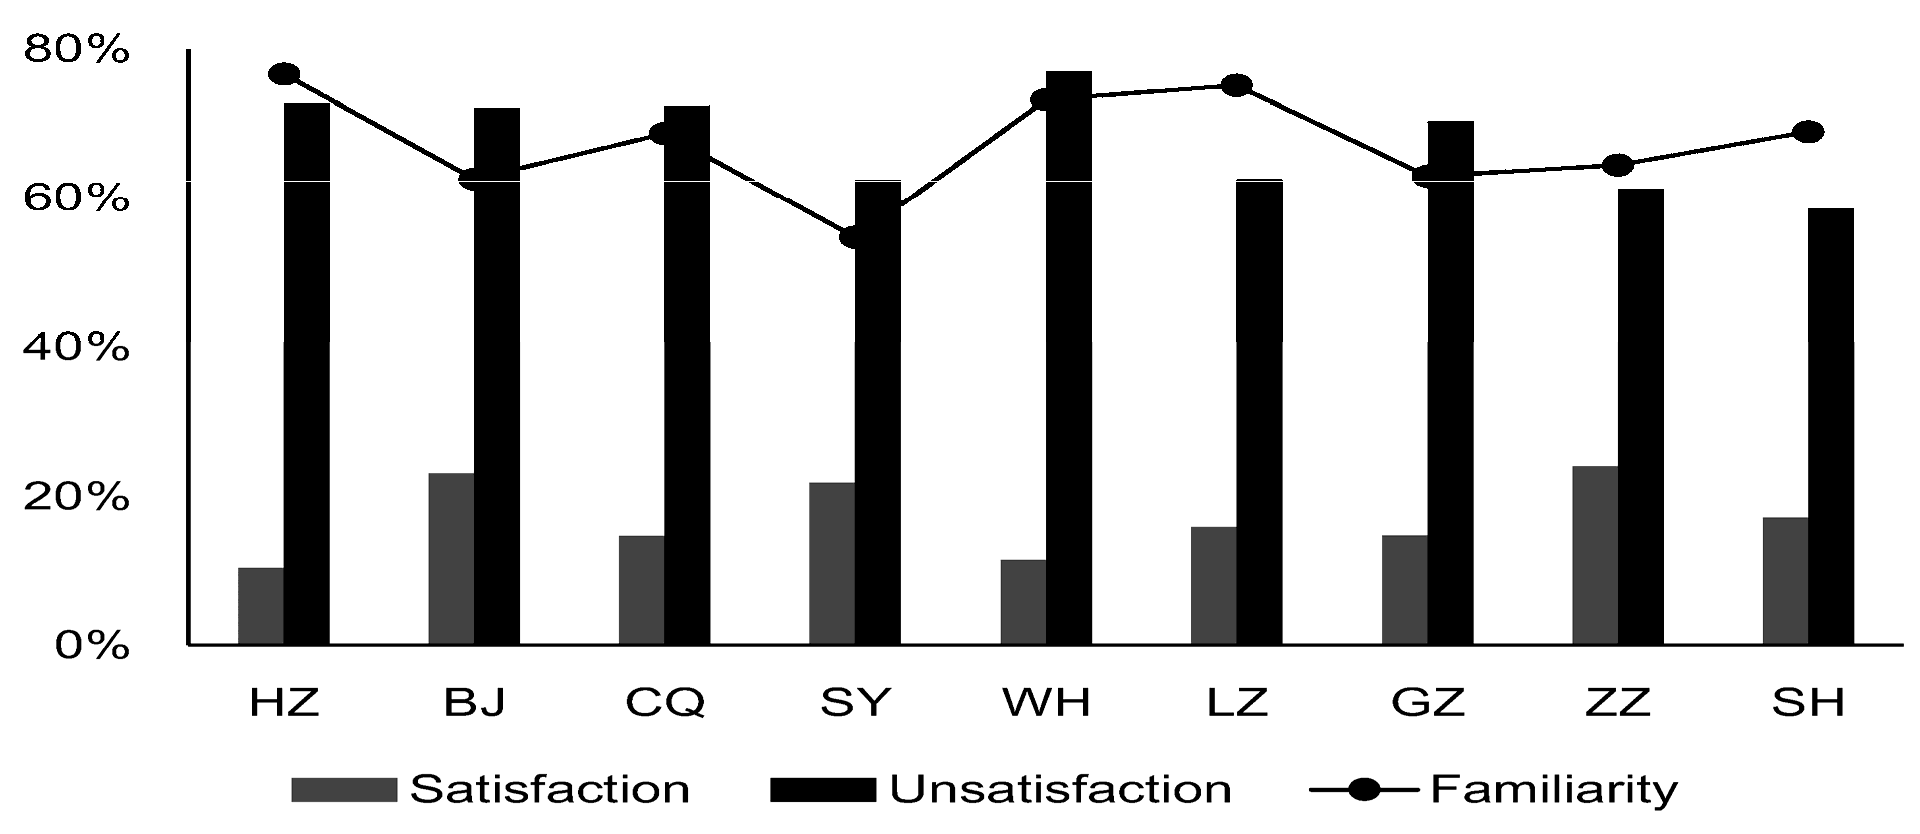
3.2. Perception on Execution Capability of Local Agencies
3.3. Preference for Remediation and Redevelopment
3.4. Internal Factors Affecting Public Perception
3.5. External Factors Affecting Public Perception
4. Conclusions
- Respondents are aware of the presence of soil pollution but they pay much lower attention to soil pollution than to air, water, noise and waste pollution. The majority of the respondents recognize the potential health risks posed by industrial contaminated sites. However, they report low willingness to relocate. There was no relationship between health risks and willingness to relocate, suggesting flawed policy and management, and emotional rather than rational public perception.
- Respondents are unsatisfied with policymaking and policy implementation. The majority of them is doubtful of policy effectiveness and perceives that deficiencies in information disclosure, publicity and education and public participation mechanisms, as well as poor departmental execution and low accountability result in poor perception on management policies.
- Preference for liability is interconnected with payment preference. Local governments and polluters are thought to be prior to take responsibility for remediating contaminated sites and the majority of residents reject payment. While, some of them are willing to pay a very small amount of money provided the improvement of living environment. Subjective consideration plays an important role in preference for buying houses and land reuse types. The regeneration of land to provide the public with goods or services (e.g., public parks, commercial use and play areas) is preferred, while residential use and agricultural use are strongly opposed.
- Approaches including media (newspaper and TV), websites, communication platforms (webchats and microblogs) and interactive modes (public meetings, hearings and telephone) don’t show significant regional differences and are preferred in information disclosure, publicity and education and public participation.
- Public perception in the nine surveyed cities varies in respect to management policy, relocation willingness, risk awareness, information disclosure and individual willingness, and follows a general descending order of Shanghai, Shenyang, Guangzhou, Lanzhou, Chongqing, Beijing, Wuhan, Zhuzhou and Hangzhou, due to the regional heterogeneity in remediation methods, media attention and practice experiences.
- Public perception was significantly different among cities and was affected by remediation technology, pollutant type, regional policy response and living distance. The perception of residents under the characteristics of in-situ remediation, heavy metal pollutants, and living distance between 1 km and 1.5 km were lower than those under the circumstances of the ex-situ remediation, organic pollutants, and living within 0.2 km.
Acknowledgments
Author Contributions
Conflicts of Interest
Appendix A

| Part I. Socio-Demographic Information | ||
| Items | Options | |
| Sex | □Male □Female | |
| Age (Year) | □<23 □23–35 □35–50 □>50 | |
| Education | □Below junior high school □High school □Junior college □Bachelor □Others | |
| Occupation | □Jobless □Student □Freelancer □Worker □Employer □Professionals □Retiree | |
| Household size | □1 □2 □3 □4 □5 □>5 | |
| Monthly income in RMB (Yuan) | □<3000 □3000–5000 □5000–8000 □>8000 | |
| Duration of residence (Year) | □<1 □1–3 □3–5 □5–10 □>10 | |
| Part II. Questions on Soil Contamination. | ||
| Items | Options | |
| Q1 | The pollution problem you concern most. | □Air □Water □Soil □Noise □Wastes |
| Q2 | I know about soil contamination very well. | □Agree strongly □Agree somewhat □Neutral □Disagree somewhat □Disagree strongly |
| Q3 | The ways that you are acquainted with soil contamination. | □Websites □Media (newspaper and TV) □Communication platform (wechat and microblog) □Popularization of science □Materials issuing □Chat □Bulletin □Conference □Work |
| Q4 | I know about hazards of soil contamination very well. | □Agree strongly □Agree somewhat □Neutral □Disagree somewhat □Disagree strongly |
| Q5 | I am aware of the contaminated soil on my parcel. | □Yes □No □Neutral |
| Q6 | I know the reason of soil contamination. | □Yes □No |
| Q7 | I think that soil contamination has posed risks for environment and health. | □Yes □No |
| Q8 | I have been compensated for soil contamination, if not, the reason. | □Yes □No, policy □No, executor □No, victim □No, ignorance |
| Q9 | I will relocate in unpolluted region. | □Yes □No □Neutral |
| Part III. Questions on Execution Capability of Local Agencies | ||
| Items | Options | |
| Q10 | Soil pollution information were available to me. | □Yes □No □Neutral |
| Q11 | I have been concerned about soil pollution information. | □Yes □No □Neutral |
| Q12 | Information disclosed is adequate. | □Yes □No □Neutral |
| Q13 | Information disclosed is timely. | □Yes □No □Neutral |
| Q14 | Information disclosed is reliable. | □Yes □No □Neutral |
| Q15 | The ways that are most effective to disclose information. | □Website □Materials issuing □Press conference □Media (newspaper and TV) □Bulletin □Information retrieval location □Communication platform (wechat and microblog) |
| Q16 | Environmental protection departments conducted educational activities on soil pollution hazards and prevention. | □ Yes □No □Neutral |
| Q17 | I have attended educational activities on soil pollution issues. | □Yes □No □Neutral |
| Q18 | The frequency of knowledge popularity is enough. | □Yes □No □Neutral |
| Q19 | The ways that are most effective for dissemination. | □Website □Bulletin □Conference □Popularization of science □Media (newspaper and TV) □Communication platform (wechat and microblog) □Materials issuing |
| Q20 | Environmental protection departments collected public suggestions on contaminated site management. | □Yes □No □Neutral |
| Q21 | I proposed some opinions on contaminated site management. | □Yes □No □Neutral |
| Q22 | The ways to participate in site management are convenient. | □Yes □No □Neutral |
| Q23 | The ways that are most effective for public participation. | □Email □Telephone □Letter □Seminar □Hearing |
| Part IV. Questions on Policy, Remediation and Redevelopment | ||
| Items | Options | |
| Q24 | I am acquainted with contaminated site management policies. | □Agree strongly □Agree somewhat □Neutral □Disagree somewhat □Disagree strongly |
| Q25 | I want to know more about contaminated site management policies. | □Yes □No □Neutral |
| Q26 | I am satisfied with contaminated site management policies, e.g., segments on information disclosure and sustainable remediation. | □Yes □No □Neutral |
| Q27 | The most effective approaches to know about contaminated site management policies: | □Website □Bulletin □Conference □Popularization of science □Media (newspaper and TV) □Communication platform (wechat and microblog) □Materials issuing |
| Q28 | My normal life is disturbed by soil remediation project in terms of: | □No □Noise pollution □Air pollution □Wastes pollution □Traffic jam □Aesthetic impact |
| Q29 | I think soil remediation project should be funded by: | □Polluter □Developer □Local government □Central government |
| Q30 | I’m willing to pay for soil remediation with certain amount of money. | □0 □<200 RMB □200–500 RMB □500–1000 RMB □>1000 RMB |
| Q31 | I am satisfied with the current type of land regeneration. | □Yes □No □Neutral |
| Q32 | I prefer land regeneration to these possibilities: | □Agriculture □Commercial use □Warehouse □Transportation □Play areas □Residential use □Nursery □Scholl □Public park |
| Q33 | I’m willing to buy a house on brownfield site after remediated. | □Yes □No □Neutral |
| Q34 | My considerations on houses on brownfield site after remediated: | □Infrastructure □Price □Location □Traffic □Convenience □Distrustful remediation outcome |
References
- Bergius, K.; Öberg, T. Initial screening of contaminated land: A comparison of U.S. and Swedish methods. J. Environ. Manag. 2007, 39, 226–234. [Google Scholar] [CrossRef] [PubMed]
- Greenberg, M.; Lewis, M.J. Brownfields redevelopment, preferences and public involvement: A case study of an ethnically mixed neighborhood. Urban Stud. 2000, 37, 2501–2514. [Google Scholar] [CrossRef]
- Van Straalen, N.M. Assessment of soil contamination—A functional perspective. Biodegradation 2002, 13, 41–52. [Google Scholar] [CrossRef] [PubMed]
- Bromberg, L.M.; Spiesman, T. Turning an economic liability into an asset: The anatomy of a redevelopment project. N. J. Law J. 2006, 184, 1–4. [Google Scholar]
- Xie, J.; Li, F.S. Overview of the Current Situation on Brownfield Remediation and Redevelopment in China. Available online: http://documents.worldbank.org/curated/en/2010/09/13132932/overview-current-situation-brownfield-remediation-redevelopment-china (accessed on 26 January 2016).
- United States Environmental Protection Agency (USEPA). Comprehensive Environmental Response, Compensation, and Liability Act (CERCLA), 1980. Available online: http://www.epw.senate.gov/cercla.pdf (accessed on 26 January 2016).
- United States Environmental Protection Agency (USEPA). EPA Adds Three Hazardous Waste Sites to Superfund’s National Priorities List. 2012. Available online: http://yosemite.epa.gov/opa/admpress.nsf/ 0/c9b5998d8d45e168852579f8005c9453 (accessed on 26 January 2016). [Google Scholar]
- Bardos, P. Progress in Sustainable Remediation. Remediat. J. 2014, 25, 23–32. [Google Scholar] [CrossRef]
- Bardos, P.; Bone, B.; Boyle, R.; Ellis, D.; Evans, F.; Harries, N.D.; Smith, J.W.N. Applying sustainable development principles to contaminated land management using the surf-uk framework. Remediat. J. 2011, 21, 77–100. [Google Scholar] [CrossRef]
- Bardos, P.; Bone, B.D.; Boyle, R.; Evans, F.; Harries, N.D.; Howard, T.; Smith, J.W.N. The rationale for simple approaches for sustainability assessment and management in contaminated land practice. Sci. Total Environ. 2016, in press. [Google Scholar] [CrossRef] [PubMed]
- Bardos, P.; Jones, S.; Stephenson, I.; Menger, P.; Beumer, V.; Neonato, F.; Maring, L.; Ferber, U.; Track, T.; Wendler, K. Optimising value from the soft re-use of brownfield sites. Sci. Total Environ. 2015, in press. [Google Scholar] [CrossRef] [PubMed]
- Bardos, P.; Stephenson, I.; Menger, P.; Beumer, V. Maximising the value-proposition for soft re-use of brownfields. AquaConsSoil 2015, Session 2.3—Redevelopment of brownfields 1. 2015. Available online: http://www.zerobrownfields.eu/HombreMainGallery/Docs/Bardos%20Session%202.3%20ACS%202015%20v2%20Hombre%20web%20site.pdf (accessed on 3 March 2016).
- Beumer, V.; Bardos, P.; Menger, P. HOMBRE D 5.2: Decision Support System on Soft Reuses. HOMBRE Deliverable D 5-2. Deltares, 2014. Available online: http://www.zerobrownfields.eu/HombreTraining Gallery/HOMBRE_D5.2_final.pdf (accessed on 3 March 2016).
- Cundy, A.; Bardos, P.; Puschenreiter, M.; Witters, N.; Mench, M.; Bert, V.; Friesl-Hanl, W.; Müller, I.; Weyens, N.; Vangronsveld, J. Developing effective decision support for the application of “gentle” remediation options: The GREENLAND project. Remediat. J. 2015, 25, 101–114. [Google Scholar] [CrossRef]
- Contaminated Land: Applications in Real Environments (CL: AIRE). The SuRF-UK Indicator Set for Sustainable Remediation Assessment. Available online: http://www.claire.co.uk/index.php?option=com_content&view=article&id=748:annex-1-surf-uk-indicator-set-for-sustainable-remediation&catid=966&Itemid=78 (accessed on 3 March 2016).
- Cundy, A.B.; Bardos, R.P.; Church, A.; Puschenreiter, M.; Friesl-Hanl, W.; Müller, I.; Neu, S.; Mench, M.; Witters, N.; Vangronsveld, J. Developing principles of sustainability and stakeholder engagement for "gentle" remediation approaches: The European context. J. Environ. Manag. 2013, 129, 283–291. [Google Scholar] [CrossRef] [PubMed]
- Li, Y.Y.; Tan, S.K. Cognition of Residents and Influencing Factors around Wuhan. China Real Estate 2012, 2, 29–37. [Google Scholar]
- Scarce, R. Social Theories of the Environment. 2009. Available online: http://www.skidmore.edu/~rscarce/Soc-Th-Env/Env%20Theory%20PDFs/2009EnvTheorysyllabus.pdf (accessed on 19 March 2016).
- Wikipedia. Available online: https://en.wikipedia.org/wiki/Environmental_sociology (accessed on 19 March 2016).
- Eiser, J.R.; Stafford, T.; Henneberry, J.; Catney, P. Risk perception and trust in the context of urban brownfields. Environ. Hazards 2007, 7, 150–156. [Google Scholar]
- Eiser, J.R.; Stafford, T.; Henneberry, J.; Catney, P. “Trust me, I’m a Scientist (Not a Developer)”: Perceived expertise and motives as predictors of trust in assessment of risk from contaminated land. Risk Anal. 2009, 29, 288–297. [Google Scholar] [CrossRef] [PubMed]
- Vandermoere, F. The process of soil excavation in a community: Site-specific determinants of stress perception. Environ. Behav. 2006, 38, 715–739. [Google Scholar] [CrossRef]
- Scholz, R.W.; Siegrist, M. Low risks, high public concern? The cases of Persistent Organic Pollutants (POPs), heavy metals, and nanotech particles. Hum. Ecol. Risk Assess. 2010, 16, 185–198. [Google Scholar] [CrossRef]
- Alberini, A.; Tonin, S.; Turvani, M. Willingness to pay for contaminated site cleanup policies: Evidence from a conjoint choice study in Italy. Rev. D’économie Polit. 2007, 117, 737–749. [Google Scholar] [CrossRef]
- Alberini, A.; Tonin, S.; Turvani, M.; Chiabai, A. Paying for permanence: Public preferences for contaminated site cleanup. J. Risk Uncertain. 2007, 34, 155–178. [Google Scholar] [CrossRef]
- Dunn, J.R.; Taylor, S.M.; Elliott, S.J.; Walter, S.D. Psychosocial effects of PCB contamination and remediation: The case of Smithville, Ontario. Soc. Sci. Med. 1994, 39, 1093–1104. [Google Scholar] [CrossRef]
- Matthies, E.; Höger, R.; Guski, R. Living on polluted soil: Determinants of stress symptoms. Environ. Behav. 2000, 32, 270–286. [Google Scholar] [CrossRef]
- Vandermoere, F. Hazard perception, risk perception, and the need for decontamination by residents exposed to soil pollution: The role of sustainability and the limits of expert knowledge. Risk Anal. 2008, 28, 387–398. [Google Scholar] [CrossRef] [PubMed]
- Vandermoere, F. Psychosocial health of residents exposed to soil pollution in a Flemish neighborhood. Soc. Sci. Med. 2008, 66, 1646–1657. [Google Scholar] [CrossRef] [PubMed]
- Grasmück, D.; Scholz, R.W. Risk perception of heavy metal soil contamination by high exposed and low-exposed inhabitants: The role of knowledge and emotional concerns. Risk Anal. 2005, 25, 611–622. [Google Scholar] [CrossRef] [PubMed]
- Tonin, S.; Turvani, M.; Alberini, A. Knowledge about, importance of, and attitudes towards industrial brownfield re-use. Sci. Reg. 2011, 10, 97–126. [Google Scholar]
- Feldman, D.L.; Hanahan, R.A. Public perceptions of a radioactively contaminated site: Concerns, remediation preferences, and desired involvement. Environ. Health Perspect. 1996, 104, 1344–1352. [Google Scholar] [CrossRef] [PubMed]
- Turvani, M.; Chiabai, A.; Alberini, A.; Tonin, S. Public Support for Policies Addressing Contaminated Sites: Evidence from a Survey of the Italian Public. 2006. Available online: http://www.researchgate.net/ profile/Aline_Chiabai/publication/23732189_Public_Support_for_Policies_Addressing_Contaminated_Sites_Evidence_From_a_Survey_of_the_Italian_Public/links/0fcfd50752bb23cb6c000000.pdf (accessed on 26 January 2016).
- Turvani, M.; Paccagnan, V.; Tonin, S. Population Preferences towards Risk and Alternative Reuse Policies for Derelict and Contaminated Sites: Results from a Survey of the Italian Public. 2006. Available online: http://www.kent.ac.uk/scarr/events/beijingpapers/Turvanippr.pdf (accessed on 26 January 2016).
- Alberini, A.; Aline, C.; Turvani, M.; Tonin, S. Public Policies for Contaminated Site Cleanup: The Opinions of the Italian. FEEM Working Paper No. 11. 2007. Available online: http://ssrn.com/abstract=962378 (accessed on 26 January 2016).
- Weber, O.; Scholz, R.W.; Bühlmann, R.; Grasmück, D. Risk perception of heavy metal soil contamination and attitudes to decontamination strategies. Risk Anal. 2001, 21, 967–977. [Google Scholar] [CrossRef] [PubMed]
- China Daily. A Bumpy Road to Clean up China’s Contaminated Land. 2015. Available online: http://www.chinadaily.com.cn/china/2015-06/25/content_21099483.htm (accessed on 2 March 2016).
- BBC News. Report: One Fifth of China’s Soil Contaminated. 2014. Available online: http://www.bbc.co.uk/news/world-asia-china-27076645 (accessed on 2 March 2016).
- Everbright Securities (ES). Soil Remediation: 700 billion “Feast” under Policy Approaching. 2013. Available online: http://pg.jrj.com.cn/acc/Res/CN_RES/INDUS/2013/9/3/eb13500d-027d-48e6-854d-667e5f262baf.pdf (accessed on 26 January 2016).
- Li, X.N.; Jiao, W.T.; Xiao, R.B.; Chen, W.P.; Chang, A.C. Soil pollution and site remediation policies in China: A review. Environ. Rev. 2015, 23, 1–12. [Google Scholar] [CrossRef]

| City | Sites | Distribution | Collection | Availability |
|---|---|---|---|---|
| Beijing | A coking plant and Songjiazhuang site | 220 | 206 | 93.6% |
| Chongqing | A steel factory and a chemical factory | 220 | 198 | 90% |
| Hangzhou | A paint factory and a pesticide factory | 220 | 206 | 93.6% |
| Shenyang | A coking plant and a storage battery factory | 220 | 200 | 90.9% |
| Wuhan | A pesticide factory and a dyestuff factory | 220 | 198 | 90% |
| Lanzhou | A petrochemical company | 220 | 202 | 91.8% |
| Shanghai | Disneyland site and a chemical plant | 220 | 201 | 91.4% |
| Guangzhou | A nitrogen fertilizer factory | 220 | 203 | 92.3% |
| Zhuzhou | Qingshuitang site and Liyu site | 220 | 198 | 90% |
| Variables | Options | Percent (%) | Variables | Options | Percent (%) |
|---|---|---|---|---|---|
| Sex | Male | 45.2 | Occupation | Jobless | 9.2 |
| Female | 54.8 | Student | 8.1 | ||
| Age | <23 | 13.9 | Freelancer | 16.2 | |
| 23–35 | 38.5 | Worker | 37.8 | ||
| 35–50 | 28.6 | Employer | 4.7 | ||
| >50 | 19.0 | Professionals | 11.3 | ||
| Education | Below junior high school | 22.8 | Monthly income in RMB (Yuan) | Retiree | 12.7 |
| High school | 31.6 | <3000 | 44.7 | ||
| Junior college | 19.6 | 3000–5000 | 34.7 | ||
| Bachelor | 21.5 | 5000–8000 | 13.1 | ||
| Master or above | 4.4 | >8000 | 7.6 | ||
| Household size | 1 | 1.1 | Residence time (Year) | <1 | 10.6 |
| 2 | 6.3 | 1–3 | 13.7 | ||
| 3 | 49.2 | 3–5 | 16.1 | ||
| 4 | 19.5 | 5–10 | 15.8 | ||
| 5 | 17.5 | >10 | 43.8 | ||
| >5 | 6.4 |
| Question | Preferred Option | City |
|---|---|---|
| I know about soil contamination very well. | Neutral (34.8%–52.4%) | HZ, BJ, CQ, WH, GZ, ZZ, SH |
| Disagree somewhat (35.9%–43.3%) | SY, LZ | |
| I am aware of the contaminated soil on my parcel. | Yes (76.70%–92.70%) | HZ, BJ, CQ, SY, WH, LZ, GZ, ZZ, SH |
| I know the reason for soil contamination. | Yes (61.16%–83.82%) | HZ, BJ, CQ, SY, WH, LZ, GZ, ZZ, SH |
| I think that soil contamination has posed risks for the environment and health. | Yes (97.79%–99.74%) | HZ, BJ, CQ, SY, WH, LZ, GZ, ZZ, SH |
| I have been compensated for soil contamination; if not, the reason. | No, policy (34.65%–47.83%) | HZ, BJ, CQ, SY, WH, LZ, GZ, ZZ, SH |
| I will relocate to unpolluted region. | Neutral (32.01%–40.07%) | HZ, SY, WH, LZ, GZ, ZZ, SH |
| No (37.42%–42.37%) | BJ, CQ |
| Perception | HZ | BJ | CQ | SY | WH | LZ | GZ | ZZ | SH | |
|---|---|---|---|---|---|---|---|---|---|---|
| Enough | Yes | 11.20% | 17.50% | 40.40% | 2.50% | 7.10% | 6.10% | 6.50% | 7.40% | 2.50% |
| No | 63.60% | 42.20% | 19.70% | 63.20% | 69.20% | 64.60% | 64.50% | 62.40% | 67.50% | |
| Neutral | 25.20% | 40.30% | 39.90% | 34.30% | 23.70% | 29.30% | 29.00% | 30.20% | 30.00% | |
| Timeliness | Yes | 7.80% | 3.40% | 23.20% | 3.50% | 6.60% | 5.10% | 7.00% | 6.40% | 2.00% |
| No | 67.50% | 66.50% | 40.90% | 66.20% | 67.70% | 66.70% | 64.50% | 64.90% | 64.00% | |
| Neutral | 24.80% | 30.10% | 35.90% | 30.30% | 25.80% | 28.30% | 28.50% | 28.70% | 34.00% | |
| Credibility | Yes | 21.80% | 7.30% | 22.20% | 28.90% | 23.20% | 32.30% | 20.50% | 27.70% | 32.50% |
| No | 36.40% | 68.90% | 43.90% | 32.80% | 34.30% | 15.20% | 34.00% | 34.20% | 25.10% | |
| Neutral | 41.70% | 23.80% | 33.80% | 38.30% | 42.40% | 52.50% | 45.50% | 38.10% | 42.40% | |
| Frequency | Yes | 3.90% | 2.90% | 12.60% | 3.00% | 3.50% | 7.10% | 8.00% | 7.40% | 6.90% |
| No | 74.80% | 79.60% | 53.00% | 76.60% | 74.20% | 65.20% | 63.00% | 72.30% | 76.80% | |
| Neutral | 21.40% | 17.50% | 34.30% | 20.40% | 22.20% | 27.80% | 29.00% | 20.30% | 16.30% | |
| Convenience | Yes | 5.30% | 3.40% | 5.60% | 3.00% | 5.60% | 4.50% | 6.00% | 9.40% | 3.90% |
| No | 67.50% | 75.20% | 57.60% | 68.70% | 70.20% | 66.70% | 54.00% | 62.40% | 68.50% | |
| Neutral | 27.20% | 21.40% | 36.90% | 28.40% | 24.20% | 28.80% | 40.00% | 28.20% | 27.60% | |
| Reuse Type | Strongly Agree (%) | Acceptable (%) | Reluctance (%) |
|---|---|---|---|
| Agriculture | 1.87 | 1.99 | 27.46 |
| Commercial use | 10.85 | 19.49 | 3.51 |
| Warehouse | 9.73 | 14.02 | 10.51 |
| Transportation | 13.60 | 15.26 | 5.15 |
| Play areas | 9.99 | 15.35 | 5.16 |
| Residential use | 1.07 | 2.06 | 36.92 |
| Nursery | 5.11 | 13.74 | 6.09 |
| School | 4.34 | 14.69 | 4.61 |
| Public park | 43.44 | 3.41 | 0.60 |
| Definition | Variable | Component | |||||
|---|---|---|---|---|---|---|---|
| PC1 | PC2 | PC3 | PC4 | PC5 | PC6 | ||
| Familiarity with policies | X17 | 0.640 | −0.492 | 0.318 | −0.142 | −0.130 | −0.090 |
| Satisfaction with public participation | X16 | 0.572 | 0.308 | 0.011 | −0.273 | 0.283 | −0.023 |
| Popularization or not | X11 | 0.565 | 0.220 | 0.024 | −0.227 | 0.348 | 0.006 |
| Soliciting opinions or not | X14 | 0.552 | 0.274 | 0.004 | −0.286 | 0.316 | −0.048 |
| Willingness to learn about policies | X19 | 0.541 | −0.417 | 0.375 | −0.164 | −0.223 | −0.208 |
| Information disclosure or not | X6 | 0.540 | 0.379 | −0.002 | 0.153 | −0.262 | −0.077 |
| Familiarity with soil pollution | X1 | 0.534 | −0.207 | 0.079 | 0.502 | 0.230 | 0.159 |
| Timeliness of information disclosure | X9 | 0.522 | 0.501 | −0.019 | 0.142 | −0.443 | −0.048 |
| Satisfaction with popularization | X13 | 0.520 | 0.334 | −0.018 | −0.241 | 0.271 | −0.092 |
| Attention on information disclosure | X7 | 0.511 | −0.036 | −0.082 | 0.348 | 0.053 | 0.082 |
| Credibility of information disclosure | X10 | 0.441 | 0.251 | 0.083 | −0.151 | −0.055 | 0.067 |
| Satisfaction with redevelopment | X21 | 0.420 | −0.043 | −0.089 | −0.256 | −0.014 | 0.148 |
| Public participation | X15 | −0.309 | 0.262 | 0.019 | −0.080 | −0.224 | −0.131 |
| Satisfaction with policies | X18 | −0.524 | 0.582 | −0.382 | 0.185 | 0.200 | 0.190 |
| Soil pollution reason | X4 | −0.201 | 0.257 | 0.737 | 0.250 | 0.164 | 0.018 |
| Willingness to relocate | X5 | −0.227 | 0.318 | 0.725 | 0.092 | 0.075 | 0.084 |
| Extent of soil contamination | X3 | 0.568 | −0.232 | −0.574 | 0.168 | 0.008 | −0.040 |
| Soil pollution hazards | X2 | 0.540 | −0.147 | 0.075 | 0.550 | 0.215 | 0.183 |
| Extent of information disclosure | X8 | 0.479 | 0.457 | −0.023 | 0.197 | −0.486 | 0.002 |
| Willingness to purchase | X22 | 0.057 | −0.032 | 0.048 | −0.346 | −0.155 | 0.618 |
| Willingness to pay | X20 | −0.065 | 0.077 | −0.062 | 0.152 | 0.204 | −0.609 |
| Extent of participating popularization | X12 | 0.082 | −0.068 | 0.007 | 0.062 | 0.037 | 0.398 |
| Region | PC1 | Rank | PC2 | Rank | PC3 | Rank | PC4 | Rank | PC5 | Rank | PC6 | Rank | F | Rank |
|---|---|---|---|---|---|---|---|---|---|---|---|---|---|---|
| HZ | −0.365 | 9 | −0.229 | 9 | 0.237 | 1 | 0.108 | 2 | −0.080 | 8 | 0.126 | 3 | −0.126 | 9 |
| BJ | −0.035 | 5 | −0.005 | 5 | −0.299 | 9 | −0.027 | 6 | 0.078 | 2 | 0.045 | 4 | −0.049 | 6 |
| CQ | −0.056 | 6 | −0.097 | 8 | −0.194 | 8 | −0.080 | 7 | 0.246 | 1 | 0.130 | 2 | −0.039 | 5 |
| SY | 0.448 | 1 | 0.135 | 2 | −0.084 | 7 | −0.131 | 8 | −0.073 | 7 | −0.287 | 9 | 0.131 | 2 |
| WH | −0.330 | 8 | −0.051 | 6 | 0.140 | 3 | 0.168 | 1 | −0.049 | 6 | 0.034 | 5 | −0.095 | 7 |
| LZ | 0.026 | 4 | 0.161 | 1 | 0.201 | 2 | 0.093 | 3 | −0.018 | 4 | −0.040 | 6 | 0.072 | 4 |
| GZ | 0.166 | 3 | 0.105 | 3 | 0.036 | 5 | 0.019 | 4 | −0.040 | 5 | −0.076 | 7 | 0.077 | 3 |
| ZZ | −0.185 | 7 | −0.092 | 7 | 0.042 | 4 | −0.011 | 5 | −0.089 | 9 | −0.216 | 8 | −0.109 | 8 |
| SH | 0.332 | 2 | 0.080 | 4 | −0.072 | 6 | −0.135 | 9 | 0.028 | 3 | 0.279 | 1 | 0.141 | 1 |
| City | Site | Pollutant | Remediation Technology | Policy Level | Distance |
|---|---|---|---|---|---|
| Hangzhou | A paint factory | Heavy metals | Ex-site | 1st level | 1000–1500 m |
| A pesticide factory | Organic pollutants | In-site | 1st level | <100 m | |
| Beijing | A coking plant | Organic pollutants | In-site | 1st level | <100 m |
| Songjiazhuang site | Organic pollutants | Ex-site | 1st level | 200–400 m | |
| Chongqing | A chemical factory | Organic pollutants | Ex-site | 1st level | 200–400 m |
| A steel factory | Heavy metals | Ex-site | 1st level | 700–1000 m | |
| Shenyang | A Coking plant | Organic pollutants | Ex-site | 2nd level | 400–500 m |
| A storage battery factory | Heavy metals | Ex-site | 2nd level | 500–700 m | |
| Wuhan | A pesticide factory | Organic pollutants | In-site | 2nd level | 400–500 m |
| A dyestuff factory | Heavy metals | In-site | 2nd level | 200–400 m | |
| Lanzhou | A petrochemical company | Organic pollutants | Ex-site | 2nd level | 200–400 m |
| Guangzhou | A nitrogen fertilizer factory | Organic pollutants | Ex-site | 3rd level | <100 m |
| Zhuzhou | Liyu site | Heavy metals | Ex-site | 3rd level | 200–400 m |
| Qingshuitang site | Heavy metals | In-site | 3rd level | 1000–1500 m | |
| Shanghai | Disneyland site | Heavy metals | Ex-site | 3rd level | 1000–1500 m |
| A chemical plant | Organic pollutants | Ex-site | 3rd level | <100 m |
| Method | Variable | (I) | (J) | Mean Difference (I–J) | Significance |
|---|---|---|---|---|---|
| Tamhane’s T2 | City | Shenyang | Hangzhou | 0.258 * | 0.003 |
| Wuhan | 0.227 * | 0.012 | |||
| Zhuzhou | 0.240 * | 0.003 | |||
| Shanghai | Hangzhou | 0.267 * | 0.001 | ||
| Beijing | 0.190 * | 0.030 | |||
| Wuhan | 0.237 * | 0.005 | |||
| Zhuzhou | 0.250 * | 0.001 | |||
| Policy | 1st level | 2nd level | −0.108 * | 0.013 | |
| 3rd level | −0.108 * | 0.011 | |||
| Distance | 1000–1500 m | <200 m | −0.206 * | 0.000 | |
| LSD | Pollutant | Heavy metal | Organic pollutant | −0.146 * | 0.000 |
| Technology | In-situ | Ex-situ | −0.255 * | 0.000 |
© 2016 by the authors; licensee MDPI, Basel, Switzerland. This article is an open access article distributed under the terms and conditions of the Creative Commons Attribution (CC-BY) license (http://creativecommons.org/licenses/by/4.0/).
Share and Cite
Li, X.; Jiao, W.; Xiao, R.; Chen, W.; Bai, Y. Regional Variations of Public Perception on Contaminated Industrial Sites in China and Its Influencing Factors. Int. J. Environ. Res. Public Health 2016, 13, 410. https://doi.org/10.3390/ijerph13040410
Li X, Jiao W, Xiao R, Chen W, Bai Y. Regional Variations of Public Perception on Contaminated Industrial Sites in China and Its Influencing Factors. International Journal of Environmental Research and Public Health. 2016; 13(4):410. https://doi.org/10.3390/ijerph13040410
Chicago/Turabian StyleLi, Xiaonuo, Wentao Jiao, Rongbo Xiao, Weiping Chen, and Yanying Bai. 2016. "Regional Variations of Public Perception on Contaminated Industrial Sites in China and Its Influencing Factors" International Journal of Environmental Research and Public Health 13, no. 4: 410. https://doi.org/10.3390/ijerph13040410