3.2. Environment Boundary Conditions
Table 5 shows environmental boundary conditions. The light intensity records for this experiment during the flowering and fruiting stage were below the proposed range from about 8600 lux to 17,200 lux [
40]. Low light intensity may lead to flower inhibition or cause flower abscission [
41]. Moreover, low light intensity applied to plants will produce leggy plants growing toward light, which is necessary for photosynthesis [
42].
For the germination stage (
Table 5), the temperature records complied with the optimal temperature for peppers during this phase [
43]. Concerning the vegetative growth stage, the temperature records (
Table 5) for this experiment were higher than the recommended optimum values of between 21 °C and 23 °C [
44]. However, temperature records for this stage complied with the values associated with the highest photosynthesis rate, which can be achieved at temperatures between 24 °C and 29 °C [
45,
46].
Table 5 shows that the relative humidity before and after fruiting was low (37 ± 7.6% and 57 ± 7.8%, respectively). Humidity values below 50% could have a negative impact on the fruit development as humid atmosphere is necessary for flowers to successfully pollinate; otherwise, the unfertilized flowers will drop off as reported elsewhere [
46].
3.3. Sweet Pepper Growth Comparisons
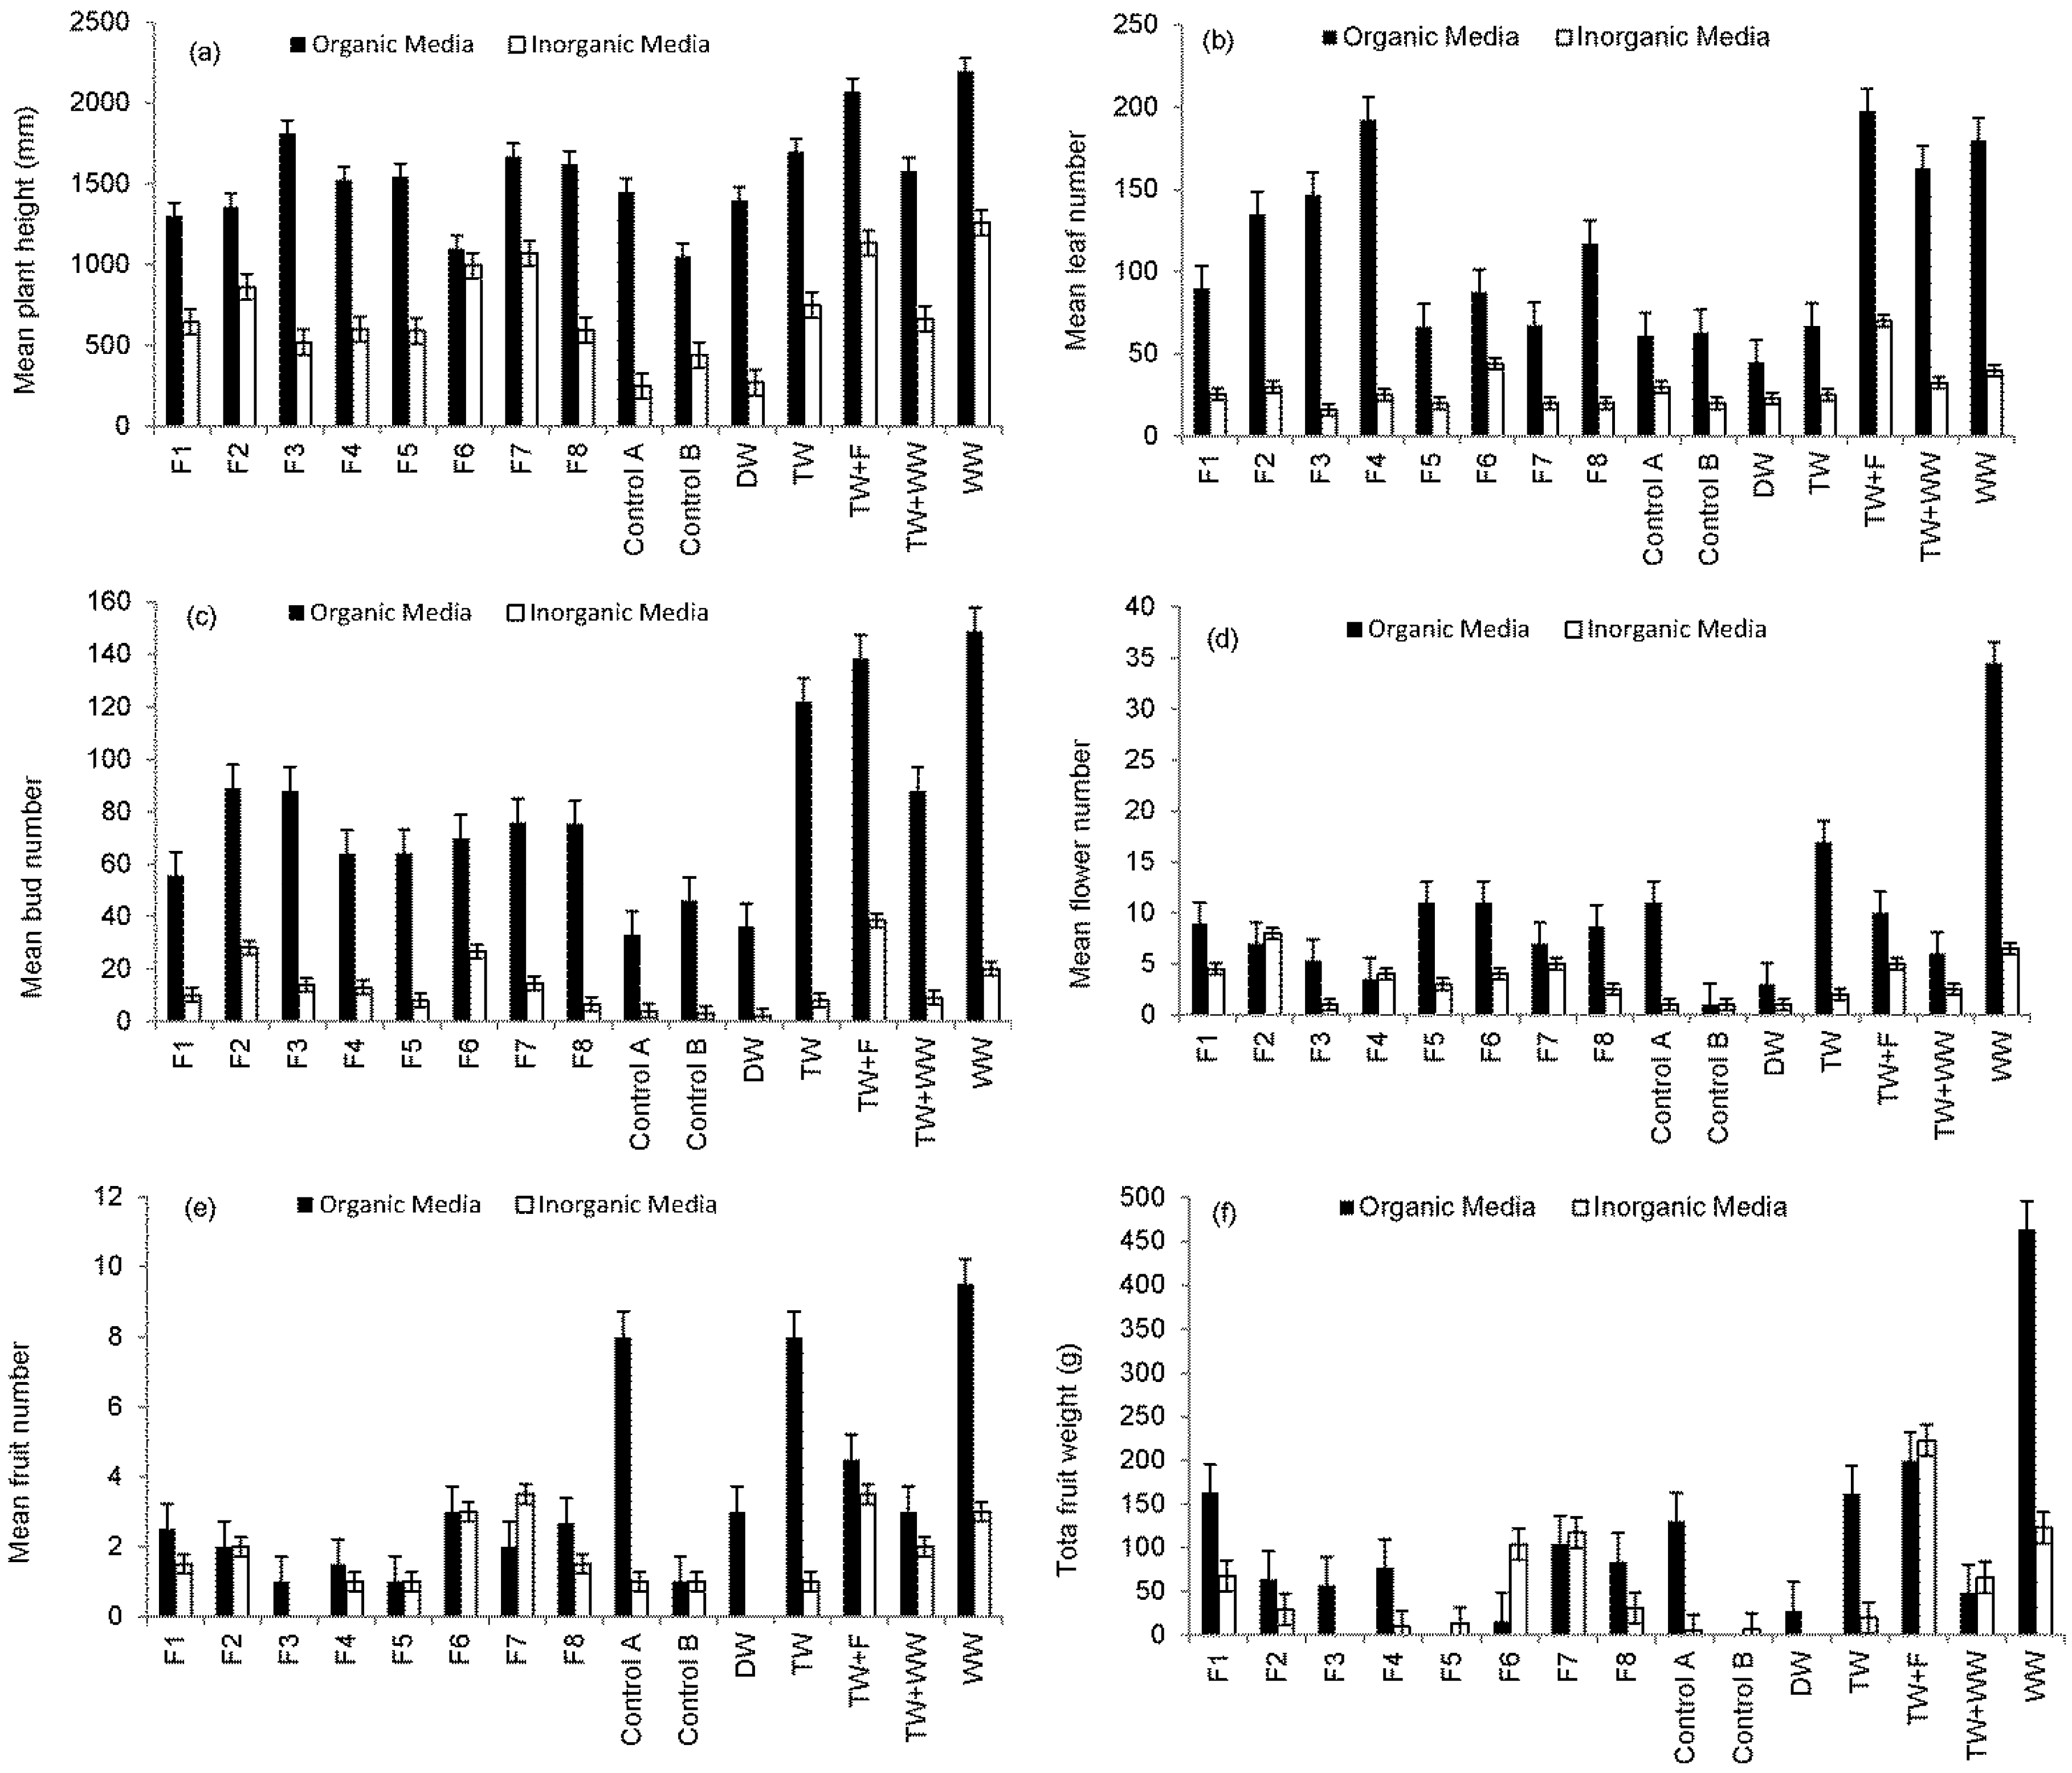
Figure 3a,f shows a growth comparison between pepper plants growing in organic and inorganic media in terms of plant overall height, number of leaves, buds, flowers and total weight of fruits harvested from each treatment. Findings indicate that compost compared to sand is associated with considerably greater plant growth and productivity. This is due to the elevated nutrient availability in the basic compost [
17] compared to sand (
Table 3). Furthermore, organic substrate decomposes, releasing nutrients [
47,
48].
Sweet Pepper prefers light and well-drained soil, which is rich in organic substances with a pH value from 6.5 to 7.5 (
Table 3) [
43]. However, under acid soil conditions (soil pH < 7), heavy metals could be a challenge to Sweet Pepper [
49].
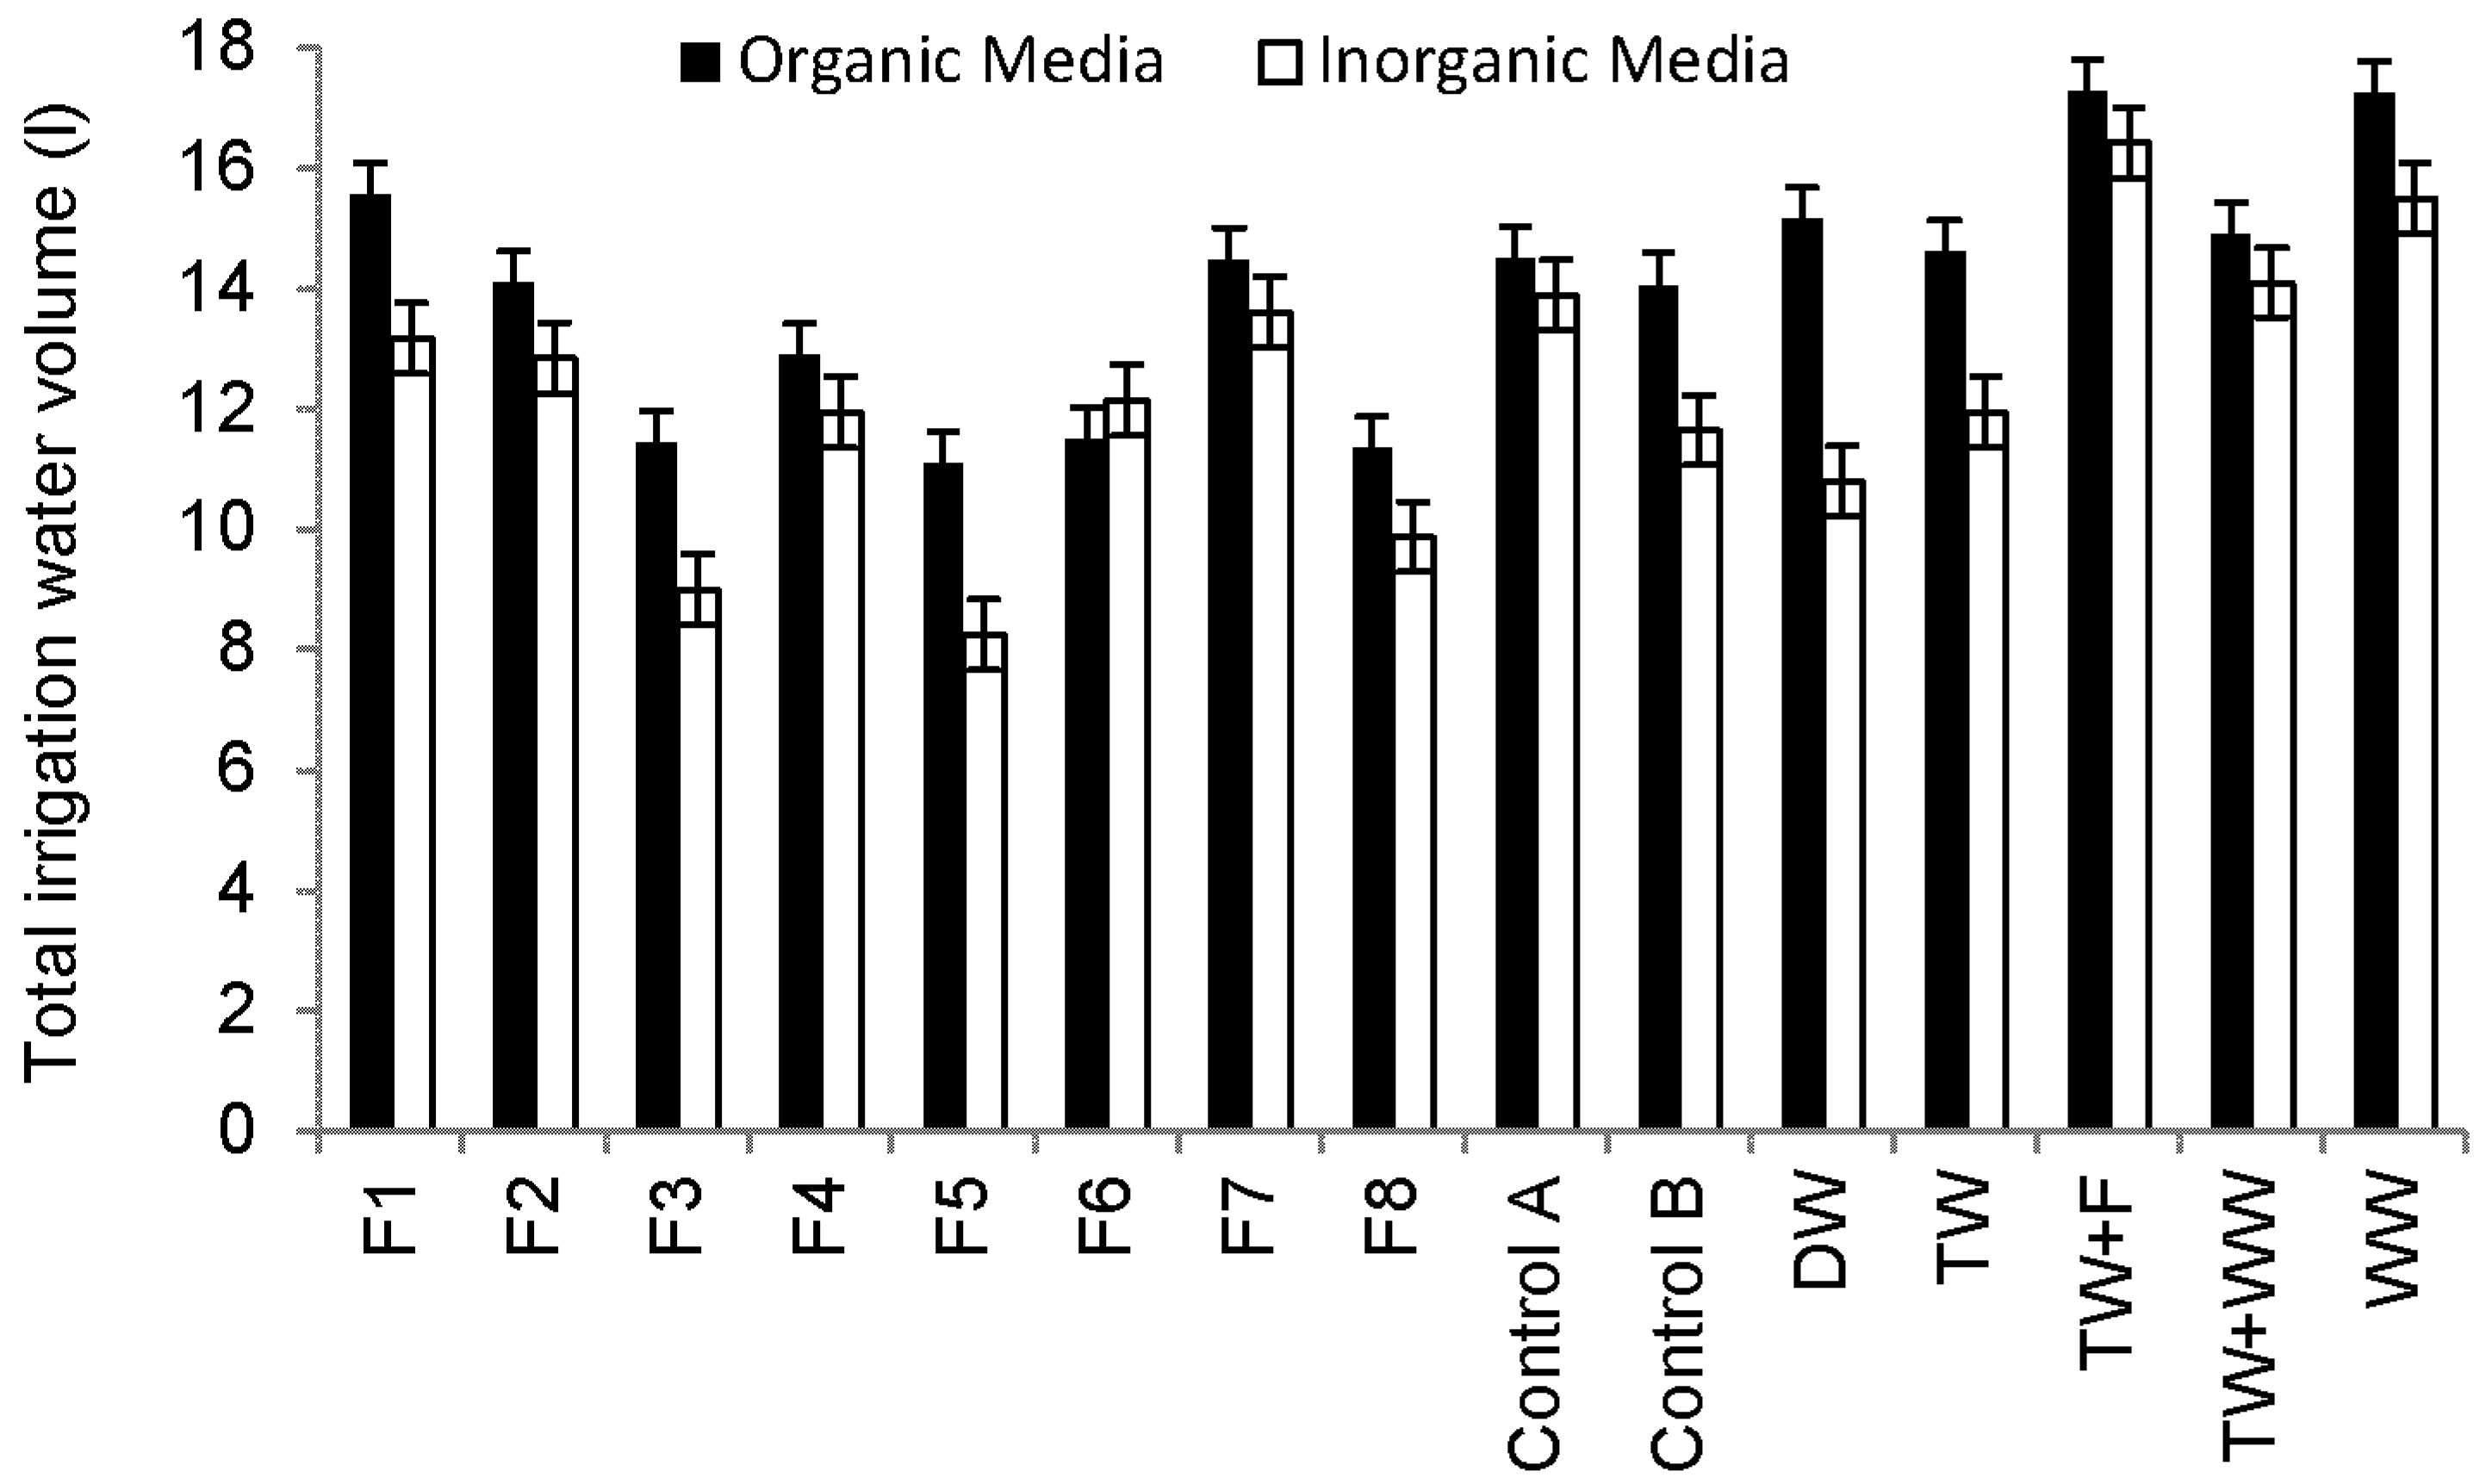
Figure 4 shows that plants grown in compost consume more water than those grown in sand and subsequently increase the nutrient load applied to plants via irrigation water, leading to higher foliage and yield production.
Regarding the overall height of plants growing in organic media,
Figure 3a shows that the maximum height was associated with plants irrigated with raw wastewater followed by those irrigated with tap water spiked with fertilizer. This can be explained by the high nutrient load (
Table 6) applied via irrigation water. Results were statistically significantly different (
p < 0.05) for the overall height of plants irrigated with water harvested from Filter 7 and Control B.
Regarding the total number of leaves (
Figure 3b) linked to peppers grown in organic media, findings indicated that peppers irrigated with tap water spiked by fertilizer produced the highest leave number followed by those plants irrigated with water harvested from Filter 4 and raw wastewater, while the lowest leave numbers were recorded for plants irrigated with deionized water followed by tap water and Controls A and B.
Figure 3.
Comparison in growth of plants grown in different media and subjected to different irrigation water types (harvest between 20 January and 25 September 2014): (a) mean plant height; (b) mean leaf number; (c) mean bud number; (d) mean flower number; (e) mean fruit number; and (f) mean fruit weight.
Table 5.
Overview of environmental boundary conditions associated with the vegetable pots (mean ± standard deviation (number of records)).
Table 5.
Overview of environmental boundary conditions associated with the vegetable pots (mean ± standard deviation (number of records)).
| Parameter | Unit | A a | B b | C c | D d | E e | F f |
|---|
| Illuminance (one-off record during lab visit) | lux | 5587 ± 5501.1 (918) | nm | 4208 ± 2560.5 (36) | 12316 ± 1823.3 (102) | 3682 ± 3246.1 (513) | 5877 ± 9262.2 (267) |
| Temperature (one-off record during lab visit) | °C | 25.4 ± 2.12 (603) | 20.5 ± 1.25 (13) | 24.8 ± 1.17 (48) | 25.0 ± 1.89 (102) | 26.3 ± 2.32 (204) | 25.0 ± 1.83 (236) |
| Temperature (minimum within a 24-hour period) | °C | 20.8 ± 1.97 (75) | nm | nm | 20.3 ± 1.87 (8) | 21.2 ± 2.02 (33) | 20.6 ± 2.05 (34) |
| Temperature (maximum within a 24-hour period) | °C | 26.8 ± 2.59 (75) | nm | nm | 25.3 ± 1.98 (8) | 27.0 ± 2.83 (33) | 26.6 ± 2.26 (34) |
| Relative humidity (one-off record during lab visit) | % | 49 ± 11.7 (488) | nm | nm | 42 ± 5.4 (96) | 37 ± 7.6 (156) | 57 ± 7.8 (236) |
| Relative humidity (minimum within a 24-hour period) | % | 35 ± 7.1 (75) | nm | nm | 36 ± 3.7 (8) | 30 ± 3.5 (33) | 38 ± 8.5 (34) |
| Relative humidity (maximum within a 24-hour period) | % | 55 ± 12.5 (75) | nm | nm | 46 ± 5.6 (8) | 48 ± 10.5 (33) | 63 ± 9.8 (34) |
Figure 3c–f provides summaries of plant developments. Very high numbers of buds were recorded for peppers grown in organic media. Most flowers died before producing any fruits due to the elevated ammonia-nitrogen concentrations supplied to those plants grown in organic media and irrigated by wastewater [
43].
Sweet Peppers grown in sand had less buds compared to those peppers grown in organic media. Most buds reached the fruiting stage (
Figure 3e), because of a better balance in nutrients supplied to those plants by the irrigation water. The potential of a rather moderate diesel spill to function as stimulation for plant growth in clean water becomes apparent when comparing both controls with each other (
Table 1).
Figure 4.
Overview of total irrigation water volumes for Sweet Pepper plants during the whole experiment period (11 October 2013 to 25 September 2014).
Figure 4.
Overview of total irrigation water volumes for Sweet Pepper plants during the whole experiment period (11 October 2013 to 25 September 2014).
Figure 3f summaries a comparison of total weight. Fruits harvested from plants grown in organic media were heavier than those from plants raised in inorganic media. This confirms results obtained by other researchers [
17,
19] showing the impact of various growth media on pepper harvests.
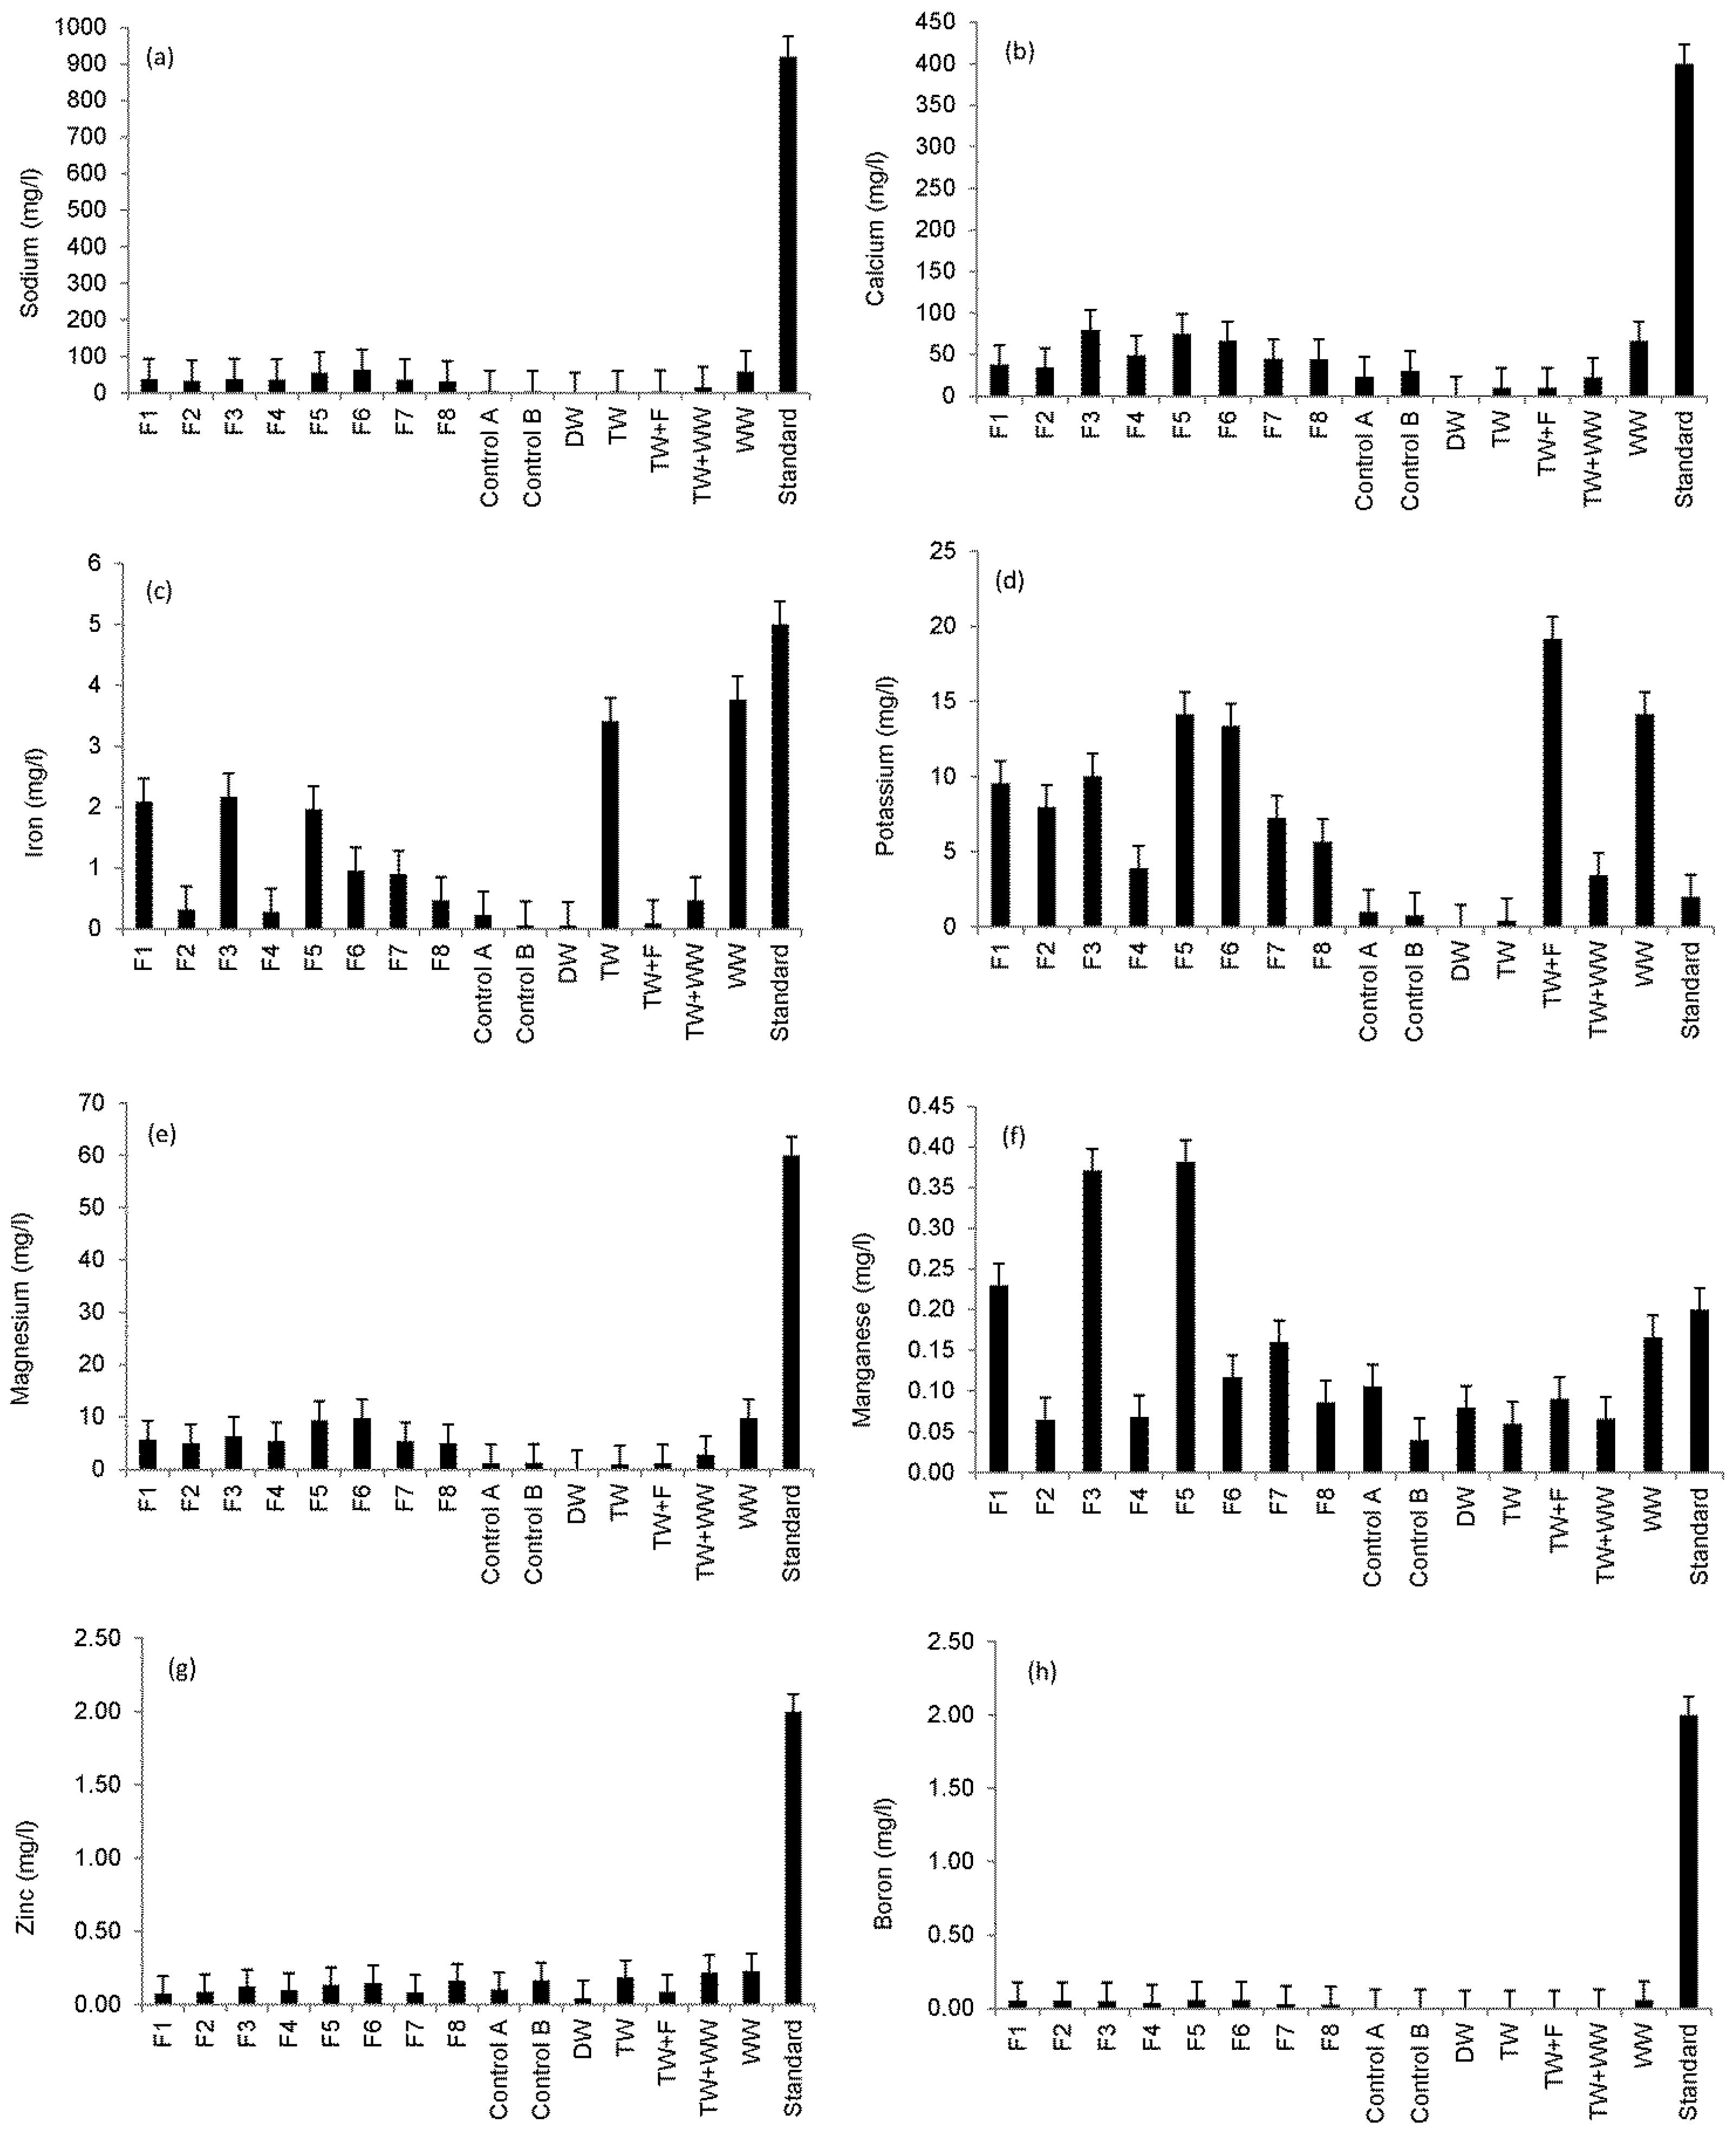
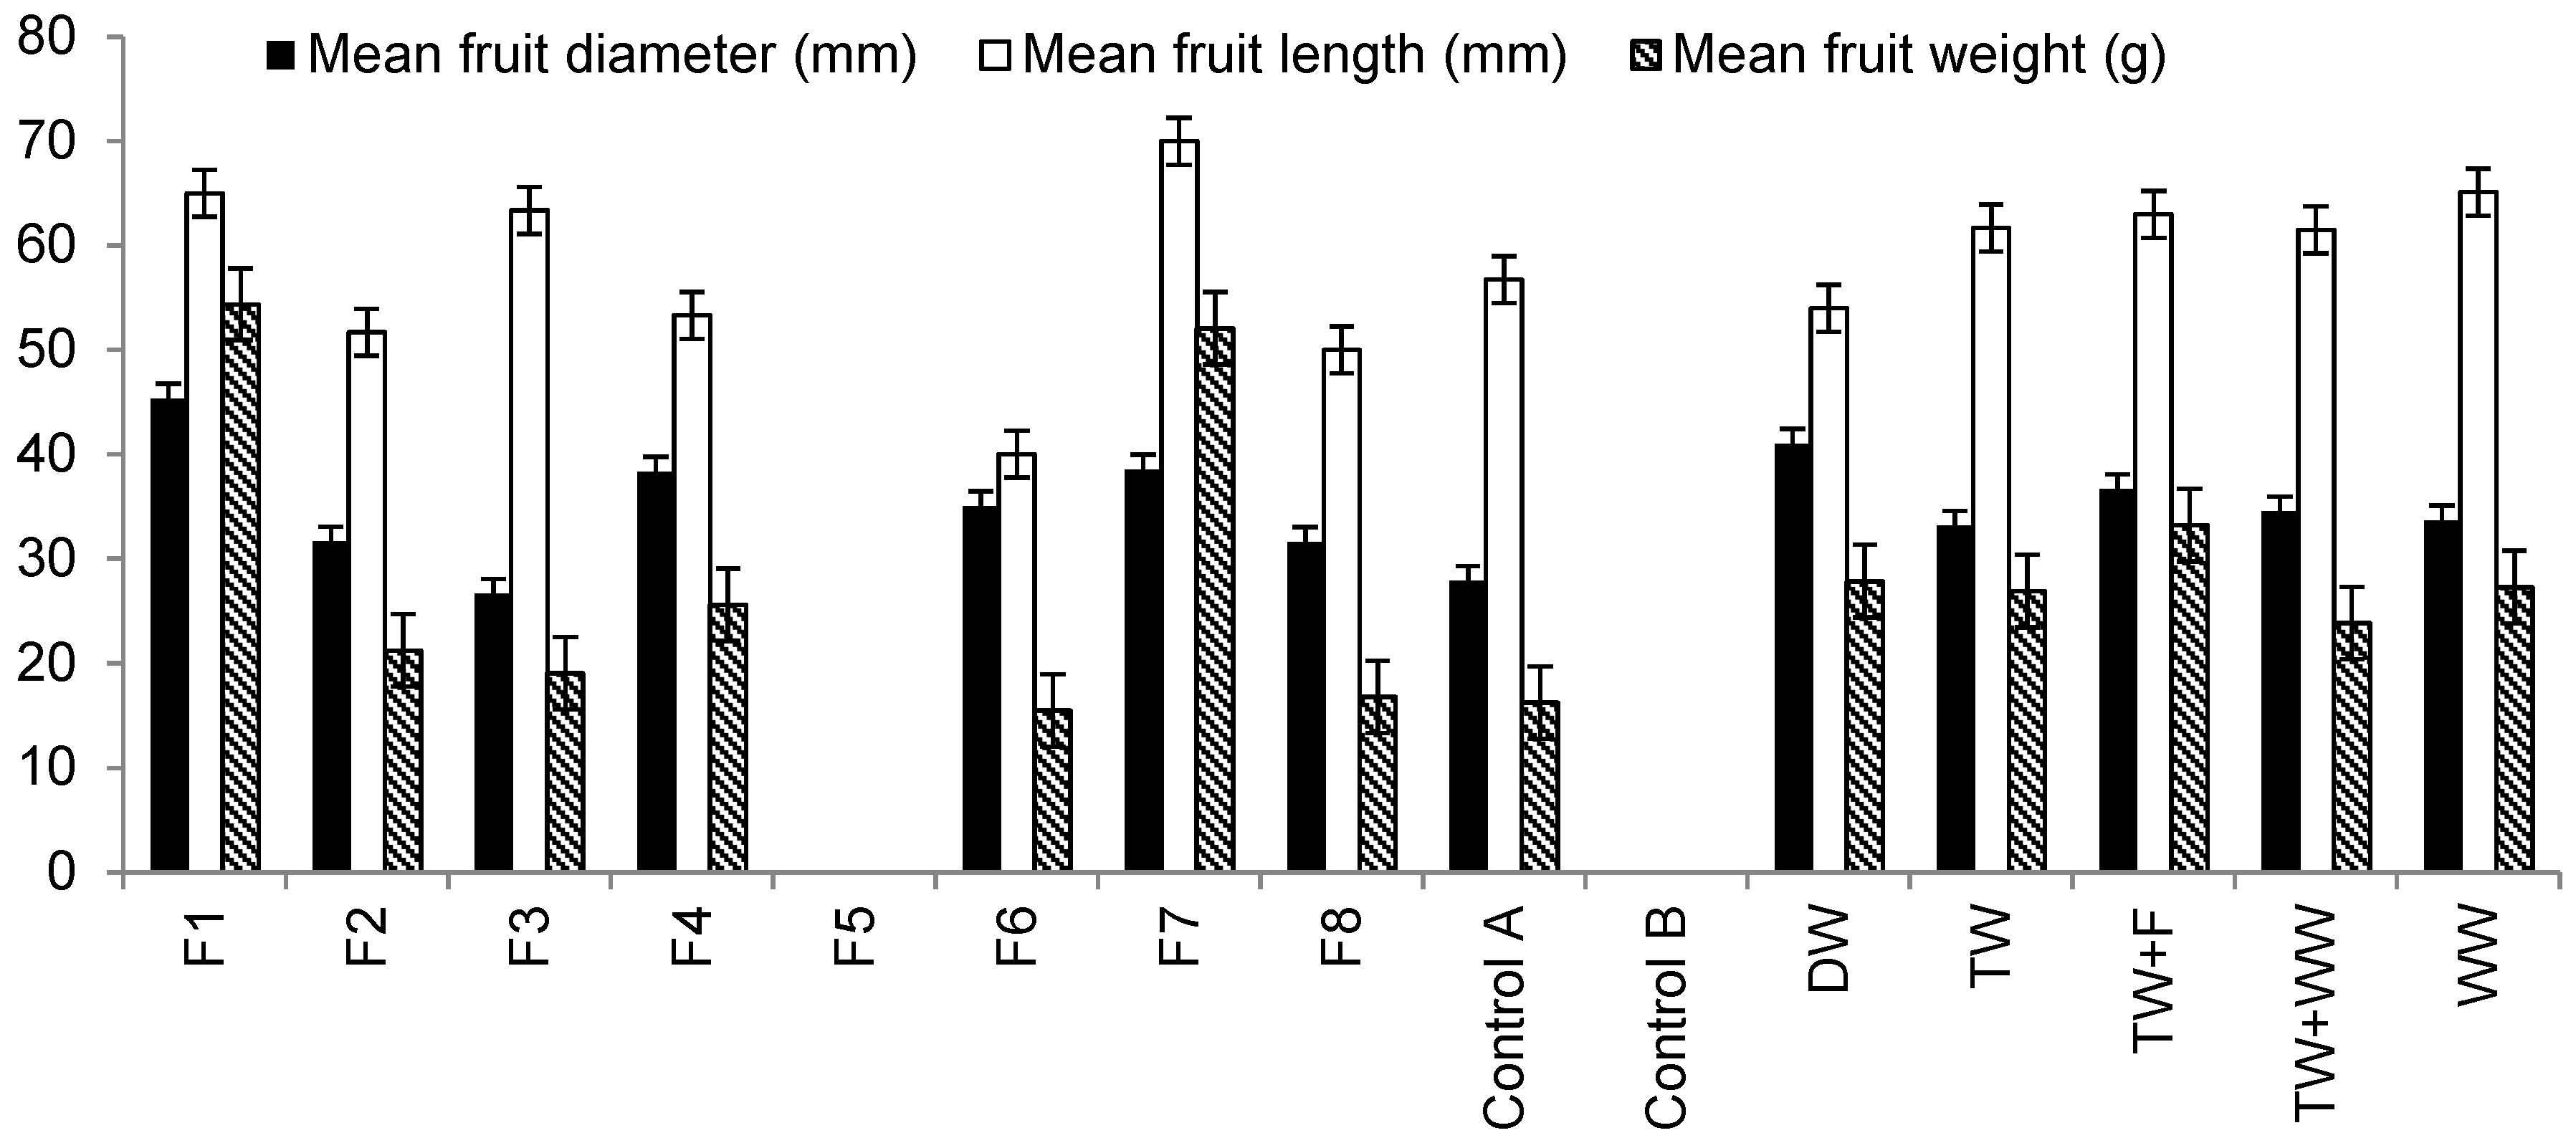
Figure 5 summaries differences in fruit characteristics. Findings show that fruits harvested from plants irrigated with Filter 1 outflow water were greater than those obtained from peppers irrigated with waters from Filter 2 due to high element loads applied to plants associated with Filter 2 compared to Filter 1 (
Table 6). Moreover, fruits belonging to Filter 1 had diameters, which were greater than others indicating the impact of nutrient (mainly nitrogen) and trace element loads provided by irrigation water obtained from Filter 1 compared to the other filters (
Table 6).
Figure 5 shows that there is no statistically significant difference in mean fruit length harvested from plants irrigated with different irrigation water types. However, fruits harvested from plants irrigated with Filter 7 (low contact time) outflow water were the longest followed by those irrigated with water obtained from Filters 1 (large aggregate size) and 3 (small aggregate size), which were contaminated with hydrocarbons. The shortest fruit lengths were observed for those harvested from plants irrigated with Filter 6 (high inflow rate) outflow water.
Regarding mean fruit weight, statistical analysis showed that there are significant differences (
p < 0.05) in fruit mean weight for plants irrigated with water harvested from Filter 6, tap water spiked with fertilizer and raw wastewater.
Figure 5 indicates that Sweet Peppers irrigated with water harvested from Filter 1 produced fruits of the highest mean weight (54 g) followed by those harvested from plants irrigated with Filter 7 outflow water, which produced fruits of 52 g mean weight, while the lowest mean fruit weight was recorded for those plants irrigated with Filter 6 outflow water (16 g), explaining the negative impact of high nutrients and trace elements applied to plant fruit weight (
Table 6).
Table 6.
Overview of element mass applied on plants grown in organic media subjected to different irrigation water types (11 October 2013 to 25 September 2014).
Table 6.
Overview of element mass applied on plants grown in organic media subjected to different irrigation water types (11 October 2013 to 25 September 2014).
| Water Type | Total Applied Mass (mg) |
|---|
| NH4-N a | NO3-N b | PO4-P c | Ca d | Fe e | K f | Mg g | Mn h | Zn i | B j |
|---|
| Filter 1 outflow | 74.8 | 6.2 | 62.3 | 591.9 | 32.6 | 149.0 | 89.0 | 3.6 | 1.2 | 0.8 |
| Filter 2 outflow | 87.5 | 31.0 | 46.5 | 484.3 | 4.6 | 112.7 | 71.1 | 0.9 | 1.3 | 0.7 |
| Filter 3 outflow | 42.4 | 4.6 | 37.8 | 919.3 | 24.9 | 115.1 | 74.1 | 4.2 | 1.4 | 0.6 |
| Filter 4 outflow | 64.5 | 23.2 | 37.4 | 638.7 | 3.7 | 50.6 | 69.8 | 0.9 | 1.3 | 0.5 |
| Filter 5 outflow | 107.7 | 10.0 | 48.9 | 834.9 | 21.8 | 157.2 | 104.2 | 4.2 | 1.5 | 0.6 |
| Filter 6 outflow | 103.7 | 41.5 | 53.0 | 765.8 | 11.0 | 154.1 | 112.5 | 1.3 | 1.7 | 0.7 |
| Filter 7 outflow | 52.2 | 40.6 | 52.2 | 650.8 | 13.1 | 105.0 | 78.9 | 2.3 | 1.2 | 0.4 |
| Filter 8 outflow | 15.9 | 31.8 | 37.5 | 506.8 | 5.4 | 69.4 | 57.6 | 1.0 | 1.8 | 0.3 |
| Control A outflow | 18.9 | 5.8 | 26.1 | 342.7 | 3.4 | 14.5 | 17.2 | 1.5 | 1.5 | 0.1 |
| Control B outflow | 18.3 | 4.2 | 26.7 | 429.8 | 1.0 | 11.1 | 17.8 | 0.6 | 2.3 | 0.1 |
| Deionised water | 1.5 | <0.1 | <0.1 | <0.1 | 1.0 | <0.1 | 1.4 | 1.2 | 0.7 | <0.1 |
| Tap water (100%) | 1.5 | 10.2 | 29.7 | 151.8 | 49.9 | 6.2 | 14.6 | 0.9 | 2.7 | <0.1 |
| Tap water with fertiliser | 276.7 | 153.9 | 257.7 | 179.8 | 1.6 | 331.4 | 20.9 | 1.6 | 1.5 | <0.1 |
| Wastewater (20%); tap water (80%) | 100.0 | 7.5 | 44.8 | 336.6 | 7.0 | 51.2 | 42.1 | 1.0 | 3.3 | 0.1 |
| Wastewater (100%) | 580.3 | 41.4 | 257.3 | 1149.9 | 65.0 | 244.4 | 169.1 | 2.9 | 4.0 | 1.0 |
Figure 5.
Differences in mean fruit diameter, mean fruit length and mean fruit weight linked to harvested plants (20 January to 25 September 2014) irrigated with different water types and grown in organic media. Notes: No fruit harvest has been noted for plants associated with Filter 5 and Control B.
Ammonia-nitrogen has a negative effect on plant fruit, leaf and stem developments [
15,
16]. However, the total yield increases as the nitrate-nitrogen to ammonia-nitrogen ratio increases. This can be explained by a reduction in fruit physiological disorders, which usually reduce fruit mean weight [
15,
16]. Moreover, high phosphorus levels are known to interfere with the normal metabolism of peppers. Also, it is known to promote manganese uptake by plants [
50]. However, researchers [
51] reported that high potassium concentration in irrigation water provides protection against stem damage from low night temperatures. Manganese is an essential trace element for most plants, intervening in several metabolic processes (mainly in photosynthesis). Nevertheless, an excess of this micronutrient is often toxic for plants. Manganese phyto-toxicity is exhibited in a reduction of biomass and photosynthesis, and biochemical disorders including oxidative stress [
50].
Correlation analysis findings indicated that fruit weights were significantly positively correlated with total water volumes used for irrigation (
R = 0.821,
p < 0.001). Since the peppers irrigated with raw wastewater and grown in organic media had the highest number of fruits (
Figure 3e), this helps to explain why the total weight of harvested fruits was associated with plants irrigated with raw urban wastewater (
Figure 3g). The provision of plants with high nutrient and trace element loads leads to increases in the quantity at the expense of quality of yield.


