
Estimation of the Disease Burden Attributable to 11 Risk Factors in Hubei Province, China: A Comparative Risk Assessment


Abstract
:1. Introduction
2. Materials and Methods
2.1. Data Sources
2.2. Methods
3. Results
4. Discussion
5. Conclusions
Acknowledgments
Author Contributions
Conflicts of Interest
Appendix A

| Diseases and Injuries | DALY Rate for Males | DALY Rate for Females | Diseases and Injuries | DALY Rate for Males | DALY Rate for Females |
|---|---|---|---|---|---|
| Esophageal cancer | 380.42 | 81.86 | Lower respiratory infections | 291.17 | 206.84 |
| Stomach cancer | 662.8 | 298.66 | Other chronic respiratory diseases | 57.55 | 62.76 |
| Liver cancer | 1298.37 | 387.02 | Alcoholic cirrhosis | 114.34 | 21.97 |
| Lung cancer | 1390.57 | 463.69 | Pancreatitis | 27.56 | 22.63 |
| Gallbladder cancer | 26.97 | 38.44 | Ischemic heart disease | 1968.47 | 1209.08 |
| Thyroid cancer | 7.94 | 12.23 | Ischemic stroke | 749.2 | 529.25 |
| Colorectal cancer | 294.63 | 227.37 | Hemorrhagic stroke | 2540.38 | 1664.04 |
| Lip and oral cavity cancer | 31.78 | 15.38 | Rheumatic heart disease | 110.85 | 162.91 |
| Nasopharynx cancer | 87.91 | 34.08 | Hypertensive heart disease | 463.2 | 388.84 |
| Larynx cancer | 48.02 | 6.78 | Cardiomyopathy | 74.12 | 62.94 |
| Other pharynx cancer | 14.97 | 3.23 | Atrial fibrillation | 5.65 | 3.66 |
| Breast cancer | 5.01 | 278.08 | Aortic aneurysm | 32.38 | 8.82 |
| Uterine cancer | 0.00 | 65.01 | Peripheral vascular disease | 1.7 | 2.41 |
| Cervical cancer | 0.00 | 153.91 | Endocarditis | 7.01 | 4.14 |
| Ovarian cancer | 0.00 | 87.09 | Other cardiovascular and circulatory diseases | 172.73 | 212.44 |
| Pancreatic cancer | 100.3 | 68.56 | Diabetes | 704.53 | 629.13 |
| Kidney cancer | 36.84 | 19.48 | Diabetes-related CKD | 55.98 | 63.9 |
| Bladder cancer | 66.96 | 17.64 | Hypertensive CKD | 101.7 | 81.94 |
| Leukemia | 174.95 | 121.51 | Glomerulonephritis-related CKD | 106.27 | 92.71 |
| Tuberculosis | 194.89 | 77.25 | Other CKD | 146.65 | 138.5 |
| Otitis media | 20.44 | 18.67 | Road injuries | 1428.94 | 520.92 |
| Asthma | 117.31 | 118.67 | Unintentional injuries | 1682.51 | 667.61 |
| COPD | 1425.93 | 935.55 | Self-harm | 621.06 | 581.59 |
| Pneumoconiosis | 26.14 | 2.31 | Osteoarthritis | 144.04 | 294.39 |
| Interstitial lung disease | 103.7 | 85.7 |
References
- Muka, T.; Imo, D.; Jaspers, L.; Colpani, V.; Chaker, L.; van der Lee, S.J.; Mendis, S.; Chowdhury, R.; Bramer, W.M.; Falla, A.; et al. The global impact of non-communicable diseases on healthcare spending and national income: A systematic review. Eur. J. Epidemiol. 2015, 30, 251–277. [Google Scholar] [CrossRef] [PubMed]
- Yang, G.H.; Wang, Y.; Zeng, Y.X.; Gao, G.F.; Liang, X.F.; Zhou, M.G.; Wan, X.; Yu, S.C.; Jiang, Y.H.; Naghavi, M.; et al. Rapid health transition in China, 1990–2010: Findings from the global burden of disease study 2010. Lancet 2013, 381, 1987–2015. [Google Scholar] [CrossRef]
- Thakur, J.S.; Garg, R.; Narain, J.P.; Menabde, N. Tobacco use: A major risk factor for non communicable diseases in South-East Asia region. Indian J. Public Health 2011, 55, 155–160. [Google Scholar] [CrossRef] [PubMed]
- Parry, C.D.; Patra, J.; Rehm, J. Alcohol consumption and non-communicable diseases: Epidemiology and policy implications. Addiction 2011, 106, 1718–1724. [Google Scholar] [CrossRef] [PubMed]
- Lee, I.M.; Shiroma, E.J.; Lobelo, F.; Puska, P.; Blair, S.N.; Katzmarzyk, P.T. Effect of physical inactivity on major non-communicable diseases worldwide: An analysis of burden of disease and life expectancy. Lancet 2012, 380, 219–229. [Google Scholar] [CrossRef]
- Murray, C.J.; Barber, R.M.; Foreman, K.J.; Ozgoren, A.A.; Abd-Allah, A.; Abera, S.F.; Aboyans, V.; Abraham, J.P.; Abubakar, I.; Abu-Raddadet, L.J.; et al. Global, regional, and national disability-adjusted life years (DALYs) for 306 diseases and injuries and healthy life expectancy (HALE) for 188 countries, 1990–2013: Quantifying the epidemiological transition. Lancet 2015, 386, 2145–2191. [Google Scholar]
- Shen, J.; Jiang, Q. The changing gaps of life expectancy on genders in urban cities of China, from 2005 to 2010. Chin. J. Epidemiool. 2013, 34, 690–695. [Google Scholar]
- Wang, Y.; Li, L. A comparison of life expectancy between the urban and rural residents in China, 1990–2005. Chin. J. Epidemiool. 2008, 29, 262–266. [Google Scholar]
- Ikeda, N.; Inoue, M.; Iso, H.; Ikeda, S.; Satoh, T.; Noda, M.; Mizoue, T.; Imano, H.; Saito, E.; Katanoda, K.; et al. Adult mortality attributable to preventable risk factors for non-communicable diseases and injuries in Japan: A comparative risk assessment. PLoS Med. 2012, 9, e1001160. [Google Scholar] [CrossRef] [PubMed]
- Farzadfar, F.; Danaei, G.; Namdaritabar, H.; Rajaratnam, J.K.; Marcus, J.R.; Khosravi, A.; Alikhani, S.; Murray, C.J.L.; Ezzatiet, M. National and subnational mortality effects of metabolic risk factors and smoking in Iran: A comparative risk assessment. Popul. Health Metr. 2011, 9, 55. [Google Scholar] [CrossRef] [PubMed]
- Single, E.; Robson, L.; Rehm, J.; Xie, X. Morbidity and mortality attributable to alcohol, tobacco, and illicit drug use in Canada. Am. J. Public. Health 1999, 89, 385–390. [Google Scholar] [CrossRef] [PubMed]
- Murray, C.; Lopez, A.D. The Global Burden of Disease: A Comprehensive Assessment of Mortality and Disability from Diseases, Injuries, and Risk Factors in 1990 and Projected in 2020; Cambridge: Boston, MA, USA, 1996; p. 43. [Google Scholar]
- Murray, C.J.; Ezzati, M.; Lopez, A.D.; Rodgers, A.; Vander, H.S. Comparative quantification of health risks conceptual framework and methodological issues. Popul. Health Metr. 2003, 1, 1. [Google Scholar] [CrossRef] [PubMed] [Green Version]
- Lim, S.S.; Vos, T.; Flaxman, A.D.; Danaei, G.; Shibuya, K.; Adair-Rohani, H.; AlMazroa, M.A.; Amann, M.; Anderson, H.R.; Andrews, K.G.; et al. A comparative risk assessment of burden of disease and injury attributable to 67 risk factors and risk factor clusters in 21 regions, 1990–2010: A systematic analysis for the global burden of disease study 2010. Lancet 2012, 380, 2224–2260. [Google Scholar] [CrossRef]
- Zhou, M.G.; Wang, H.D.; Zhu, J.; Chen, W.Q.; Wang, L.H.; Liu, S.W.; Li, Y.C.; Wang, L.J.; Liu, Y.N.; Yin, P.; et al. Cause-specific mortality for 240 causes in China during 1990–2013: A systematic subnational analysis for the global burden of disease study 2013. Lancet 2016, 387, 251–272. [Google Scholar] [CrossRef]
- Forouzanfar, M.H.; Alexander, L.; Anderson, H.R.; Bachman, V.F.; Biryukov, S.; Brauer, M.; Burnett, R.; Casey, D.; Coates, M.M.; Cohen, A.; et al. Global, regional, and national comparative risk assessment of 79 behavioral, environmental and occupational, and metabolic risks or clusters of risks in 188 countries, 1990–2013: A systematic analysis for the global burden of disease study 2013. Lancet 2015, 386, 2287–2323. [Google Scholar] [CrossRef]
- Schneider, M.; Norman, R.; Parry, C.; Bradshaw, D.; Plüddemann, A. Estimating the burden of disease attributable to alcohol use in South Africa in 2000. S. Afr. Med. J. 2007, 97, 664–672. [Google Scholar] [PubMed]
- Maredza, M.; Bertram, M.Y.; Gómez-Olivé, X.F.; Tollman, S.M. Burden of stroke attributable to selected lifestyle risk factors in rural South Africa. Br. Med. Counc. Public Health 2016, 16, 143. [Google Scholar] [CrossRef] [PubMed]
- Xu, A.; Sun, J.; Lu, Z.; Ma, J.; Fu, Z.; Guo, X. Estimation on the mortality and disease burden attributed to selected risk factors in Shandong province. Chin. J. Epidemiol. 2008, 29, 959–964. [Google Scholar]
- Deng, Z.; Li, L.; Yang, Y.; Liu, T. Study on the influence of life expectancy of Ningxia residents. Ningxia Med. J. 2014, 36, 49–51. [Google Scholar]
- Chen, J.; Ma, H.; Tang, J.; Li, J.; Ma, X.; Li, L. An analysis on the disease burden of smoking in Hangzhou City. Zhejiang Prev. Med. 2016, 28, 226–229. [Google Scholar]
- Corrao, G.; Bagnardi, V.; Zambon, A.; Vecchia, C.L. A meta-analysis of alcohol consumption and the risk of 15 diseases. Prev. Med. 2004, 38, 613–619. [Google Scholar] [CrossRef] [PubMed]
- Baliunas, D.O.; Taylor, B.J.; Irving, H.; Roerecke, M.; Patra, J.; Mohapatra, S.; Rehm, J. Alcohol as a risk factor for type 2 diabetes: A systematic review and meta-analysis. Diabetes Care 2009, 32, 2123–2132. [Google Scholar] [CrossRef] [PubMed]
- Zaridze, D.; Brennan, P.; Boreham, J.; Boroda, A.; Karpov, R.; Lazarev, A.; Konobeevskaya, I.; Igitov, V.; Terechova, T.; Boffetta, P.; et al. Alcohol and cause-specific mortality in Russia: A retrospective case-control study of 48,557 adult deaths. Lancet 2009, 373, 2201–2214. [Google Scholar] [CrossRef]
- World Health Organization. Defining and assessing risk to health. In The World Health Report 2002: Reducing Risks, Promoting Healthy Life; Mutangadura, G.B., Ed.; Geneva: Geneva, Switzerland, 2002; pp. 7–24. [Google Scholar]
- World Health Organization. Joint effects of risk factors. In Global Health Risks: Mortality and Burden of Disease Attributable to Selected Major Risks; Geneva: Geneva, Switzerland, 2009; pp. 28–31. [Google Scholar]
- Danaei, G.; Ding, E.L.; Mozaffarian, D.; Taylor, B.; Rehm, J.; Murray, C.J.L.; Ezzati, M. The preventable causes of death in the United States: Comparative risk assessment of dietary, lifestyle, and metabolic risk factors. PLoS Med. 2009, 6, e1000058. [Google Scholar] [CrossRef] [PubMed]
- Ng, M.; Freeman, M.K.; Fleming, T.D.; Robinson, M.; Dwyer-Lindgren, L.; Thomson, B.; Wollum, A.; Sanman, E.; Wulf, S.; Lopez, A.D. Smoking prevalence and cigarette consumption in 187 countries, 1980–2012. J. Am. Med. Assoc. 2014, 311, 183–192. [Google Scholar] [CrossRef] [PubMed]
- Zhang, H.; Cai, B. The impact of tobacco on lung health in China. Respirology 2003, 8, 17–21. [Google Scholar] [CrossRef] [PubMed]
- Wu, Y.; Huxley, R.; Li, L.; Anna, V.; Xie, G.Q.; Yao, C.H.; Woodward, M.; Li, X.; Chalmers, J.; Gao, R.L.; et al. Prevalence, awareness, treatment, and control of hypertension in China: Data from the China national nutrition and health survey 2002. Circulation 2008, 118, 2679–2686. [Google Scholar] [CrossRef] [PubMed]
- Nan, Y.; Xi, Z.; Yang, Y.; Wang, L.; Tu, M.; Wang, J.; Jiang, Y. The 2015 China Adult Tobacco Survey: Exposure to second-hand smoke among adults aged 15 and above and their support to policy on banning smoking in public places. Chin. J. Epidemiol. 2016, 37, 810–815. [Google Scholar]
- Feigin, V.L.; Roth, G.A.; Naghavi, M.; Parmar, P.; Krishnamurthi, R.; Chugh, S.; Mensah, G.A.; Norrving, B.; Shiue, I.; Ng, M.; et al. Global burden of stroke and risk factors in 188 countries, during 1990–2013: A systematic analysis for the global burden of disease study 2013. Lancet Neurol. 2016, 15, 913–924. [Google Scholar] [CrossRef]
- Jaffe, M.G.; Lee, G.A.; Young, J.D.; Sidney, S.; Go, A.S. Improved blood pressure control associated with a large-scale hypertension program. J. Am. Med. Assoc. 2013, 310, 699–705. [Google Scholar] [CrossRef] [PubMed]
- Rehm, J.; Mathers, C.; Popova, S.; Thavorncharoensap, M.; Teerawattananon, Y.; Patraat, J. Global burden of disease and injury and economic cost attributable to alcohol use and alcohol-use disorders. Lancet 2009, 373, 2223–2233. [Google Scholar] [CrossRef]
- Cherpitel, C.J.; Bond, J.; Ye, Y. Alcohol and injury: A risk function analysis from the Emergency Room Collaborative Alcohol Analysis Project (ERCAAP). Eur. Addict. Res. 2006, 12, 42–52. [Google Scholar] [CrossRef] [PubMed]
- Chen, H.; Chen, Q.; Chen, L.; Zhang, G. Analysis of risk factors affecting driver injury and crash injury with drivers under the influence of alcohol (DUI) and non-DUI. Traffic. Inj. Prev. 2016. [Google Scholar] [CrossRef] [PubMed]

| Risk Factor | Disease and Injury Outcomes |
|---|---|
| Smoking | Cancer of the upper digestive tract, liver cancer, stomach cancer, lung cancer, cervical cancer, colorectal cancer, pancreatic cancer, kidney cancer, bladder cancer, leukemia, COPD, pneumoconiosis, interstitial lung disease, tuberculosis, lower respiratory infections, other chronic respiratory diseases, ischemic heart disease, ischemic stroke, hemorrhagic stroke, hypertensive heart disease, atrial fibrillation, aortic aneurysm, peripheral vascular disease, other cardiovascular and circulatory diseases, asthma, diabetes |
| Second hand smoke | Lung cancer, lower respiratory infections, otitis media, ischemic heart disease, ischemic stroke, hemorrhagic stroke |
| Alcohol use | Cancer of the upper digestive tract, liver cancer, breast cancer, colorectal cancer, alcoholic cirrhosis, pancreatitis, tuberculosis, diabetes, ischemic heart disease, ischemic stroke, hemorrhagic stroke, other cardiovascular and circulatory diseases, road injuries, unintentional injuries, self-harm |
| Diet low in vegetables | Ischemic heart disease, ischemic stroke, hemorrhagic stroke |
| Diet low in fruits | Cancer of the upper digestive tract, lung cancer, ischemic heart disease, ischemic stroke, hemorrhagic stroke |
| Diet high in sodium | Stomach cancer, rheumatic heart disease, ischemic heart disease, ischemic stroke, hemorrhagic stroke, hypertensive heart disease, cardiomyopathy, atrial fibrillation, aortic aneurysm, peripheral vascular disease, endocarditis, other cardiovascular and circulatory diseases, diabetes-related CKD, hypertensive CKD, glomerulonephritis-related CKD, other CKD |
| Low physical activity | Breast cancer, colorectal cancer, ischemic heart disease, ischemic stroke, diabetes |
| High body mass index | Esophageal cancer, liver cancer, breast cancer, uterine cancer, ovarian cancer, colorectal cancer, gallbladder cancer, pancreatic cancer, kidney cancer, thyroid cancer, leukemia, ischemic heart disease, ischemic stroke, hemorrhagic stroke, hypertensive heart disease, cardiomyopathy, atrial fibrillation, aortic aneurysm, peripheral vascular disease, endocarditis, other cardiovascular and circulatory diseases, diabetes, diabetes-related CKD, hypertensive CKD, glomerulonephritis-related CKD, other CKD, osteoarthritis |
| High fasting plasma glucose | Ischemic heart disease, ischemic stroke, hemorrhagic stroke, diabetes CKD, hypertensive CKD, glomerulonephritis-related CKD, other CKD |
| High total cholesterol | Ischemic heart disease, ischemic stroke |
| High blood pressure | Rheumatic heart disease, hypertensive heart disease, ischemic heart disease, ischemic stroke, hemorrhagic stroke, cardiomyopathy, atrial fibrillation, aortic aneurysm, peripheral vascular disease, endocarditis, other cardiovascular and circulatory diseases, diabetes-related CKD, glomerulonephritis-related CKD, other CKD |
| Risk Factor | Males | Females | Both Sexes | |||
|---|---|---|---|---|---|---|
| Deaths (%) * | Mortality (Per 100,000) | Deaths (%) * | Mortality (Per 100,000) | Deaths (%) * | Mortality (Per 100,000) | |
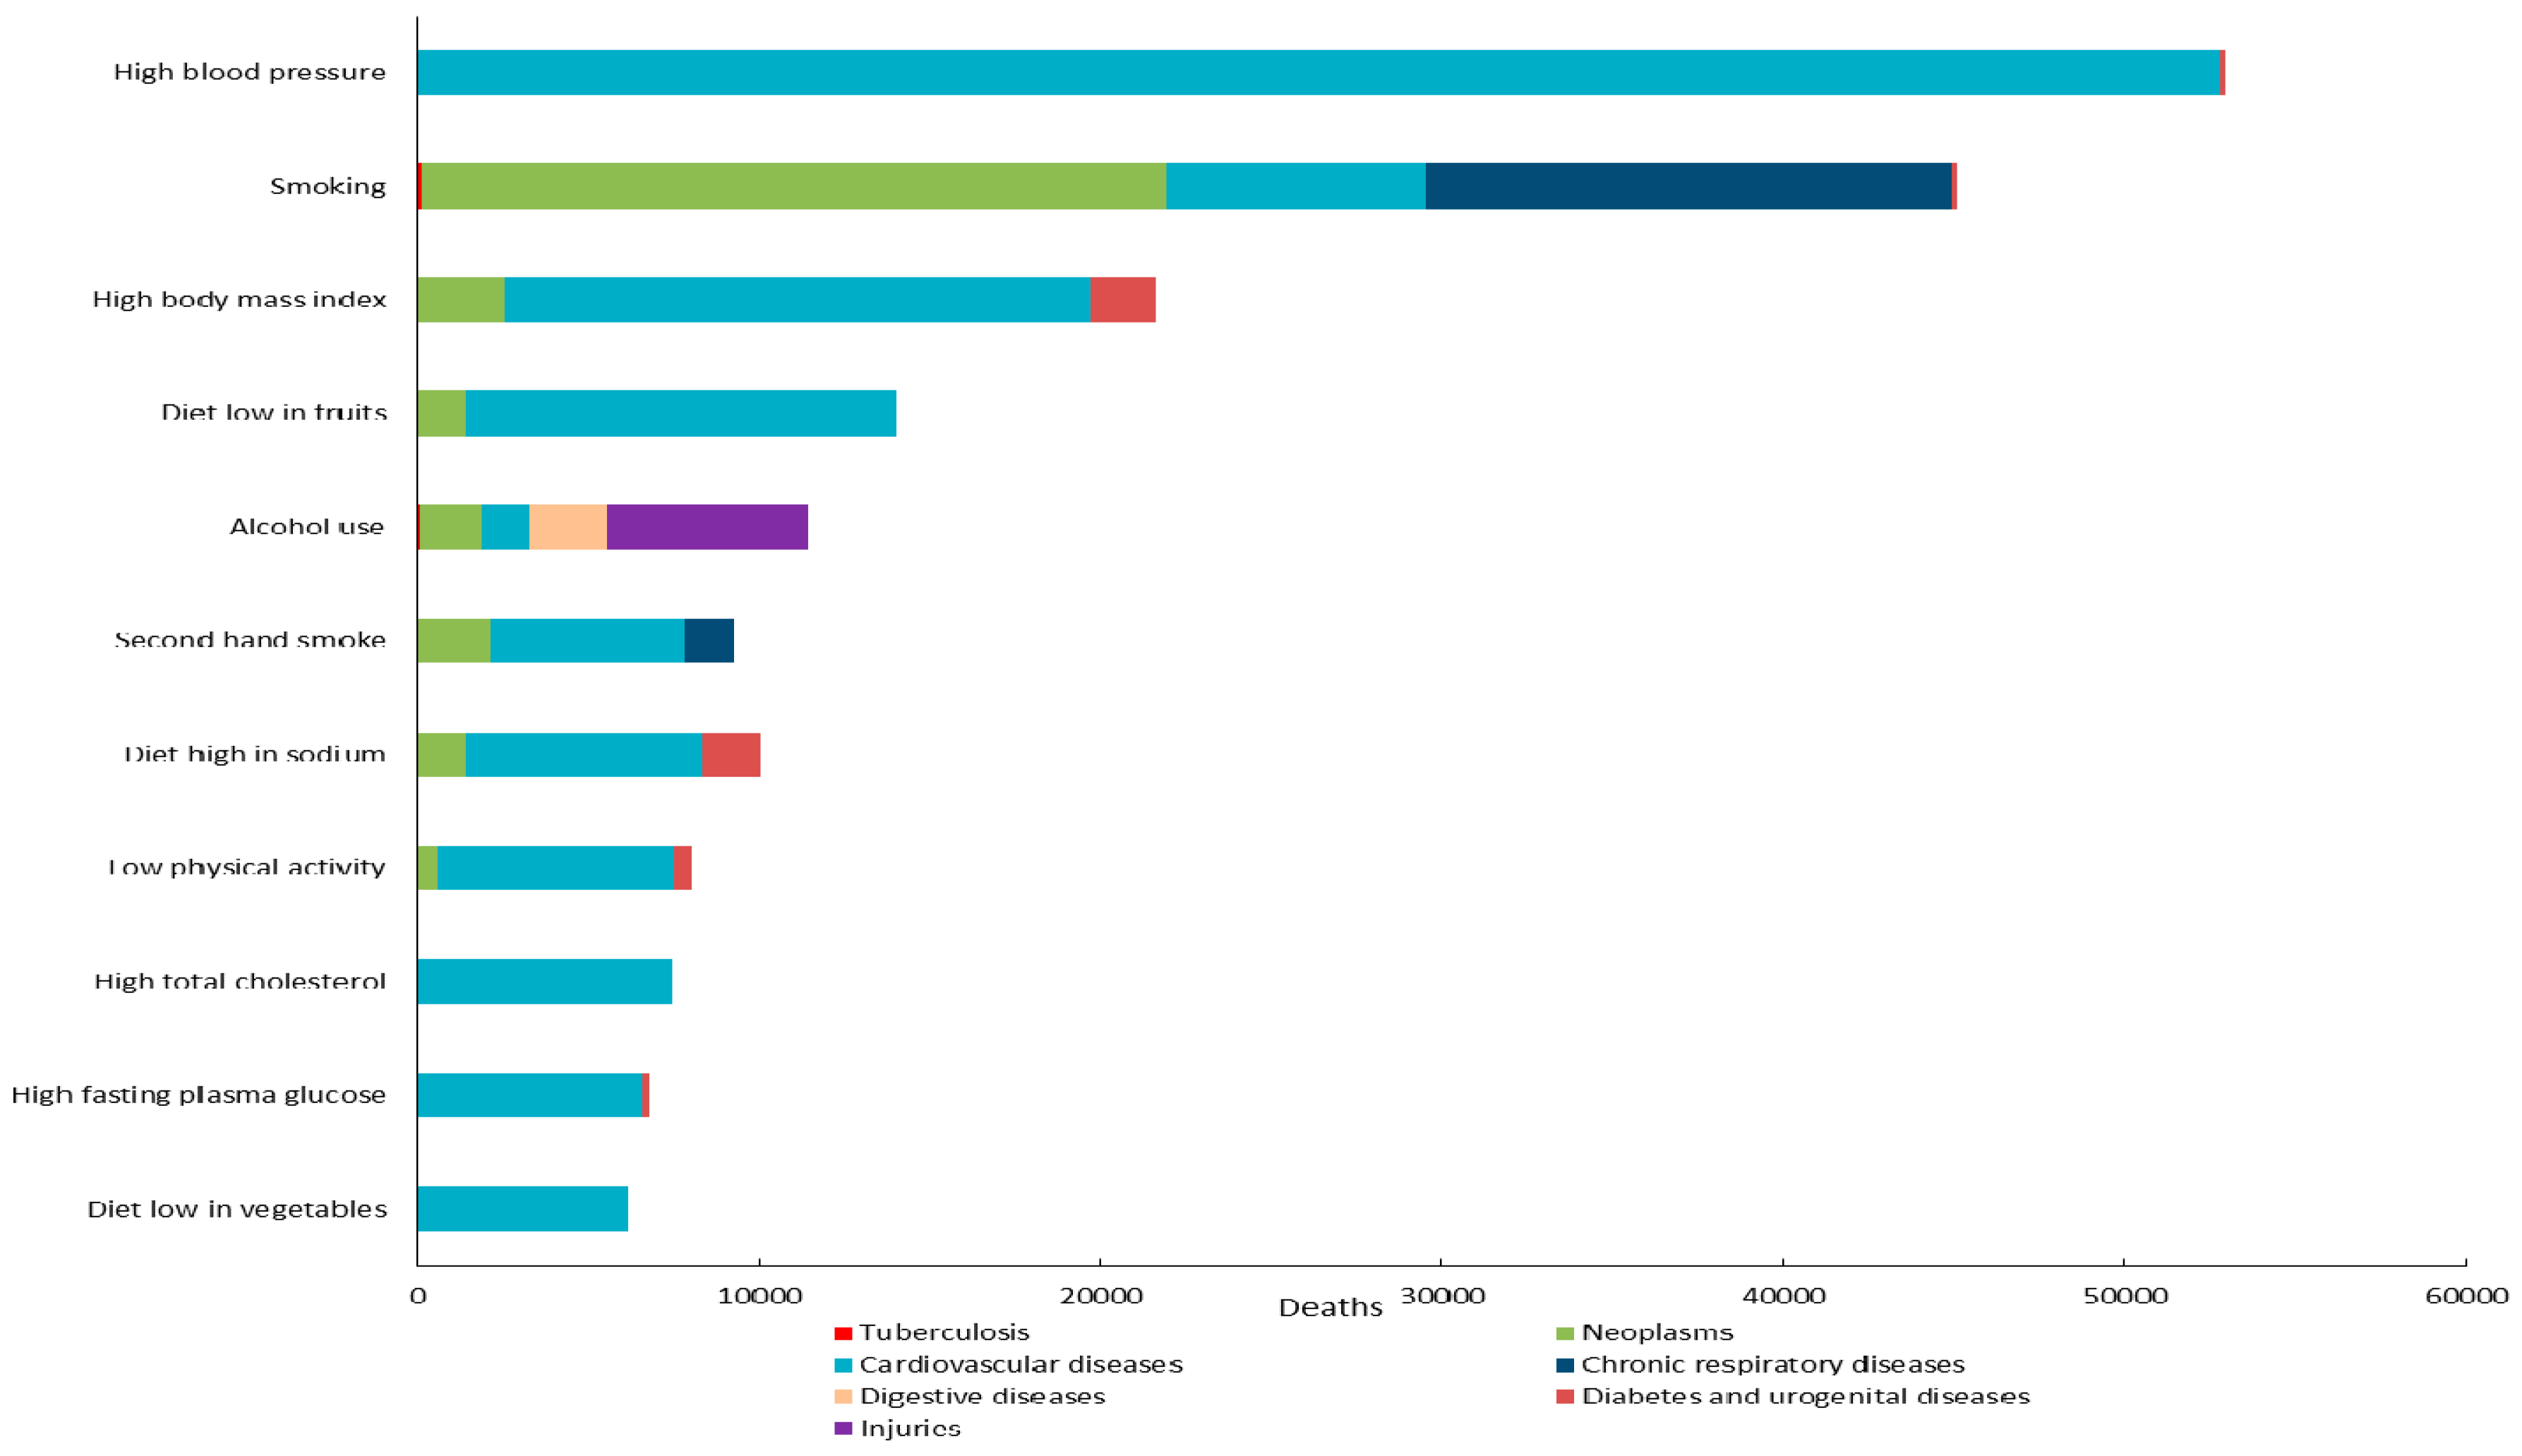
| Smoking | 41,579 (19.71) | 139.90 | 3607 (2.43) | 12.76 | 45,186 (12.57) | 77.92 |
| Second hand smoke | 6452 (3.06) | 21.71 | 2849 (1.92) | 10.08 | 9301 (2.59) | 16.04 |
| Alcohol use | 9963 (4.72) | 33.52 | 1499 (1.01) | 5.30 | 11,462 (3.19) | 19.77 |
| Diet low in vegetables | 3331 (1.58) | 11.21 | 2807 (1.89) | 9.93 | 6138 (1.71) | 10.58 |
| Diet low in fruits | 8629 (4.09) | 29.03 | 5396 (3.63) | 19.09 | 14,026 (3.90) | 24.19 |
| Diet high in sodium | 4799 (2.28) | 16.15 | 3665 (2.47) | 12.96 | 8464 (2.35) | 14.60 |
| Low physical activity | 4560 (2.16) | 15.34 | 3502 (2.36) | 12.39 | 8062 (2.24) | 13.90 |
| High body mass index | 10,623 (5.04) | 35.74 | 11,045 (7.43) | 39.07 | 21,668 (6.03) | 37.37 |
| High fasting plasma glucose | 3735 (1.77) | 12.57 | 3055 (1.89) | 10.81 | 6789 (2.06) | 11.71 |
| High total cholesterol | 4567 (2.17) | 15.37 | 2894 (1.95) | 10.24 | 7461 (2.07) | 12.87 |
| High blood pressure | 31,700 (15.03) | 106.66 | 21,078 (14.18) | 74.56 | 52,778 (14.68) | 91.01 |
| Total | 129,938 (61.61) | 437.21 | 61,397 (41.16) | 217.18 | 191,335 (53.39) | 329.94 |
| Risk Factor | Males | Females | Both Sexes | |||
|---|---|---|---|---|---|---|
| DALYs (%) * | DALY Rate (per 100,000) | DALYs (%) * | DALY Rate (per 100,000) | DALYs (%) * | DALY Rate (per 100,000) | |
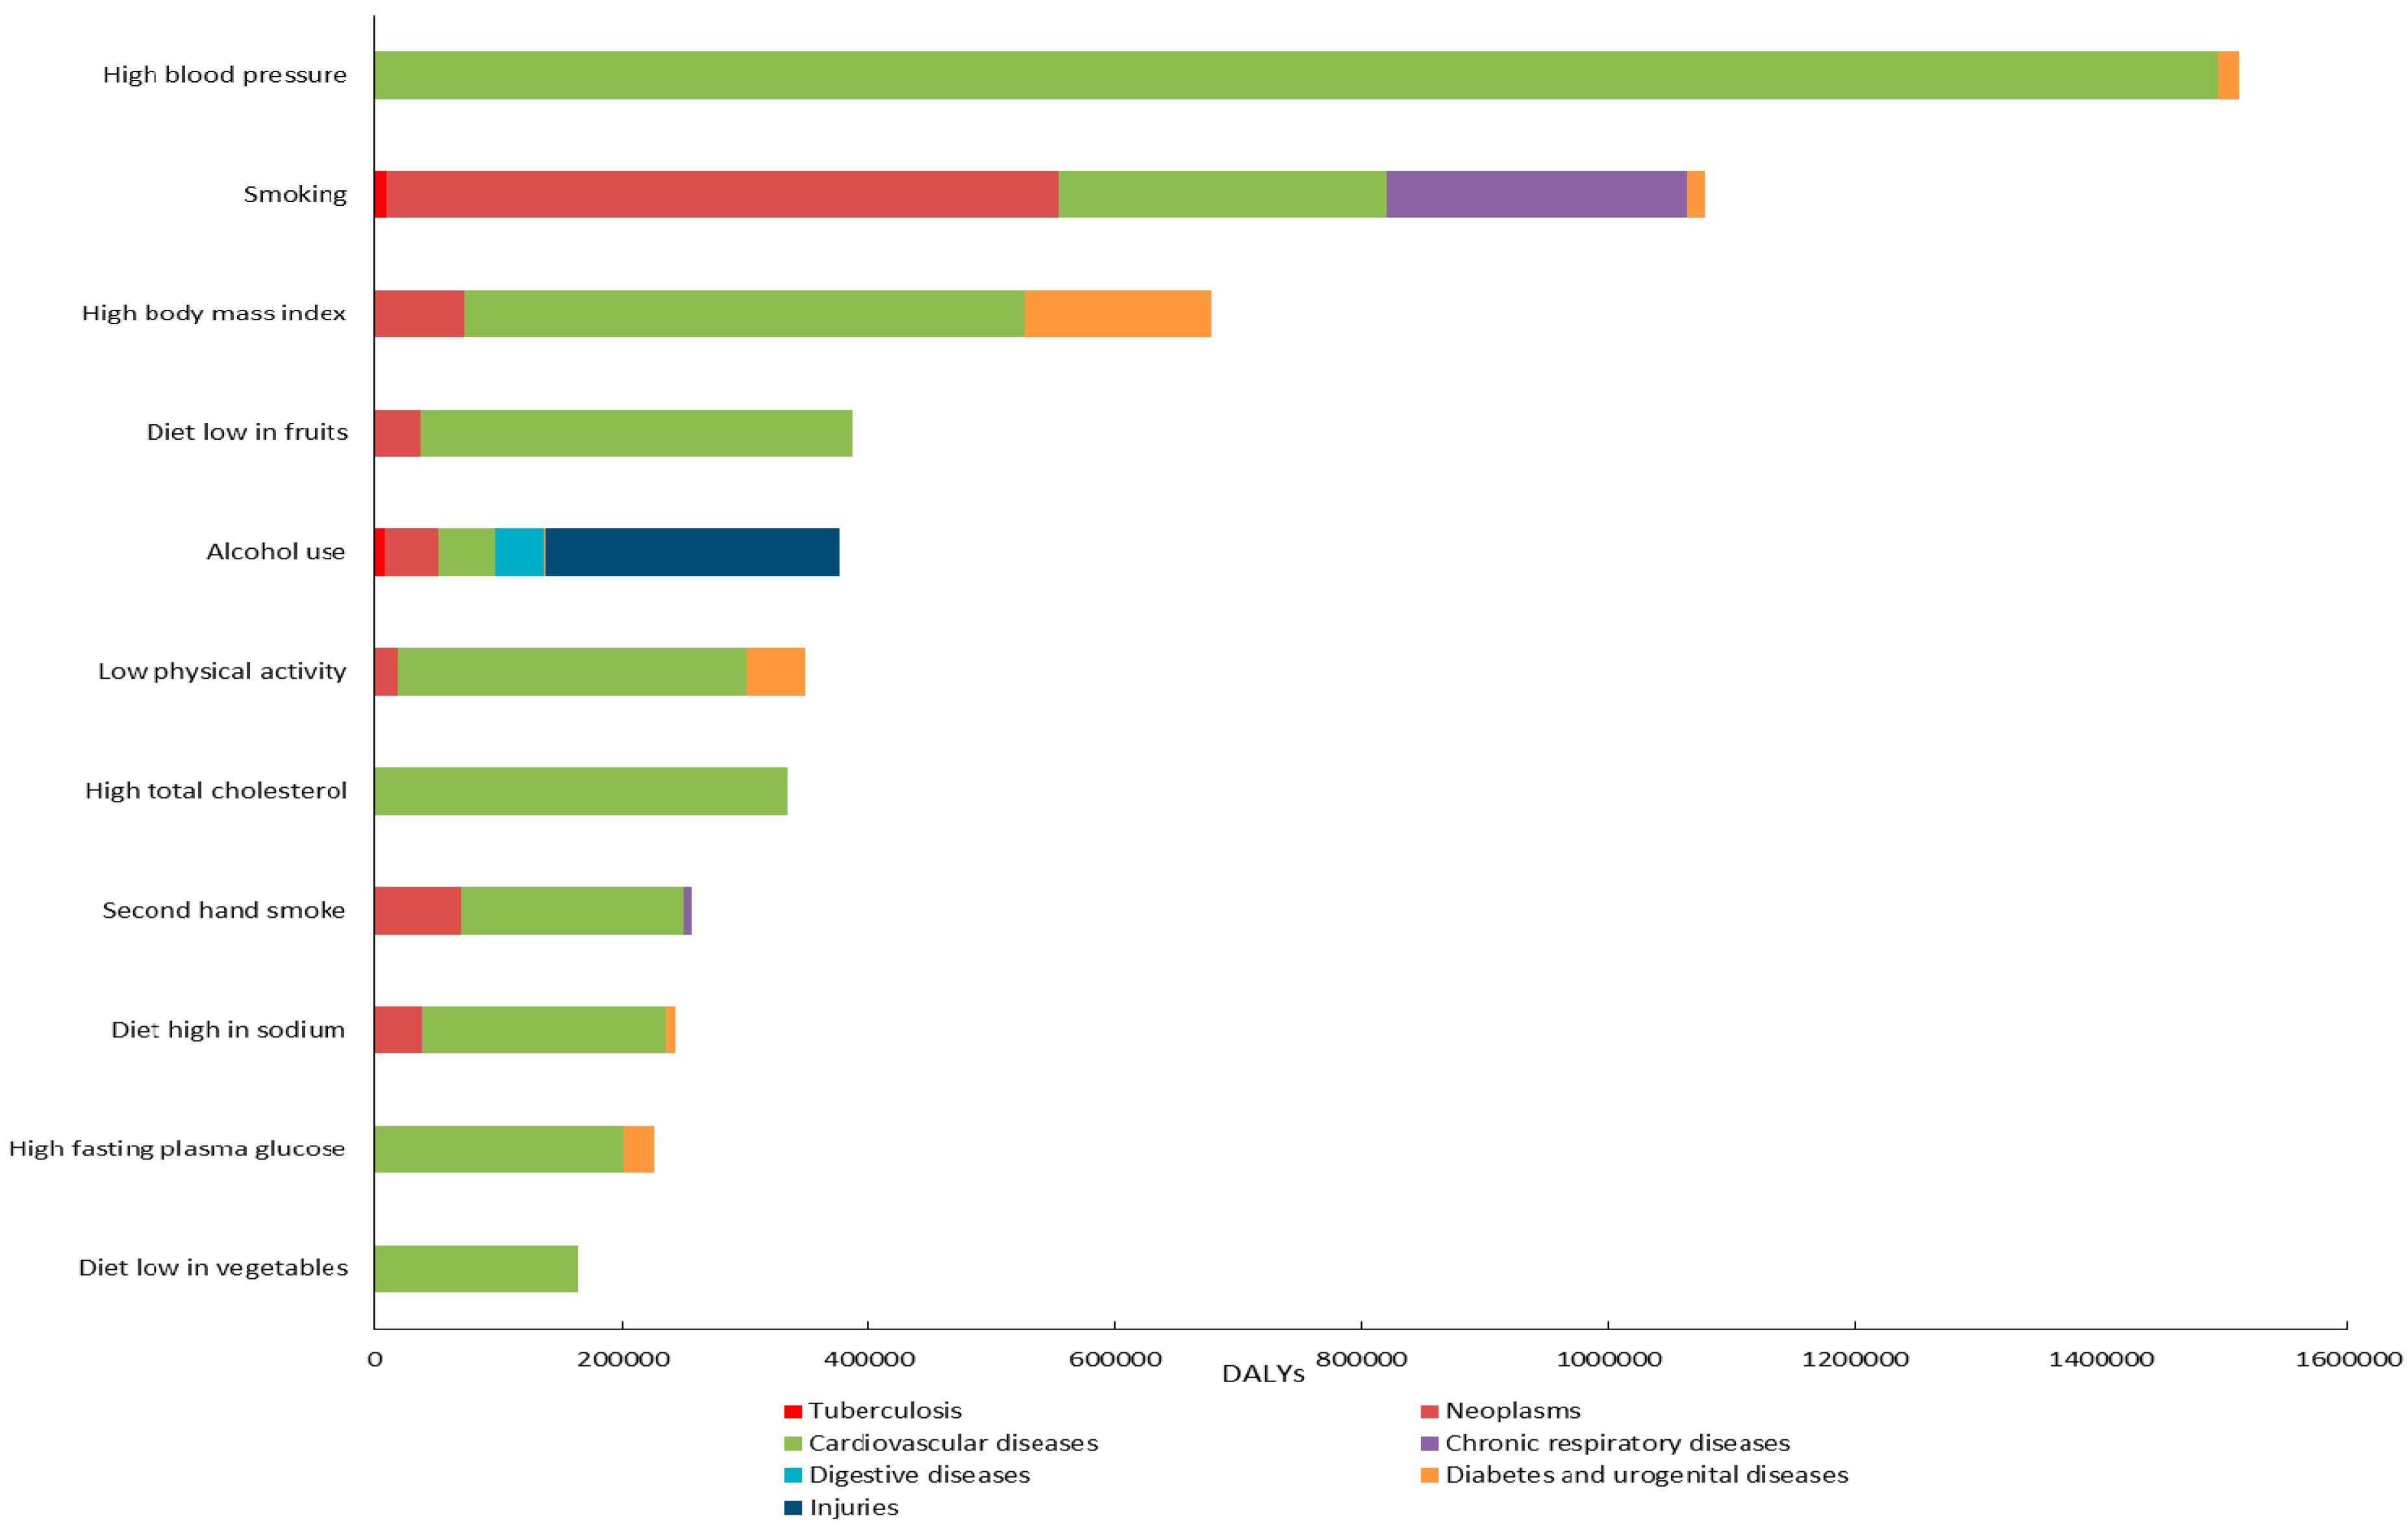
| Smoking | 1,023,480 (11.58) | 3443.75 | 88,748 (1.35) | 313.93 | 1,112,227 (7.22) | 1917.96 |
| Second hand smoke | 185,507 (2.10) | 624.18 | 73,036 (1.12) | 258.35 | 258,543 (1.68) | 445.84 |
| Alcohol use | 367,122 (4.15) | 1235.27 | 8341 (0.13) | 29.50 | 375,463 (2.44) | 647.46 |
| Diet low in vegetables | 98,370 (1.11) | 330.99 | 66,707 (1.02) | 235.96 | 165,077 (1.07) | 284.66 |
| Diet low in fruits | 256,977 (2.91) | 864.66 | 129,266 (1.97) | 457.25 | 386,243 (2.51) | 666.05 |
| Diet high in sodium | 150,498 (1.70) | 506.39 | 92,297 (1.41) | 326.48 | 242,795 (1.58) | 418.68 |
| Low physical activity | 225,961 (2.56) | 760.30 | 122,041 (1.86) | 431.70 | 348,003 (2.26) | 600.11 |
| High body mass index | 344,742 (3.90) | 1159.97 | 337,163 (5.15) | 1192.65 | 681,905 (4.42) | 1175.90 |
| High fasting plasma glucose | 131,753 (1.49) | 443.32 | 94,528 (1.44) | 334.37 | 226,281 (1.47) | 390.21 |
| High total cholesterol | 241,097 (2.73) | 811.23 | 93,260 (1.42) | 329.89 | 334,357 (2.17) | 576.58 |
| High blood pressure | 969,806 (10.97) | 3263.15 | 480,282 (7.33) | 1698.90 | 1,450,087 (9.41) | 2500.58 |
| Total | 3,995,313 (45.20) | 13,443.22 | 1,585,669 (24.20) | 5609.00 | 5,580,981 (36.23) | 9624.04 |
© 2016 by the authors; licensee MDPI, Basel, Switzerland. This article is an open access article distributed under the terms and conditions of the Creative Commons Attribution (CC-BY) license (http://creativecommons.org/licenses/by/4.0/).
Share and Cite
Cui, F.; Zhang, L.; Yu, C.; Hu, S.; Zhang, Y. Estimation of the Disease Burden Attributable to 11 Risk Factors in Hubei Province, China: A Comparative Risk Assessment. Int. J. Environ. Res. Public Health 2016, 13, 944. https://doi.org/10.3390/ijerph13100944
Cui F, Zhang L, Yu C, Hu S, Zhang Y. Estimation of the Disease Burden Attributable to 11 Risk Factors in Hubei Province, China: A Comparative Risk Assessment. International Journal of Environmental Research and Public Health. 2016; 13(10):944. https://doi.org/10.3390/ijerph13100944
Chicago/Turabian StyleCui, Fangfang, Lan Zhang, Chuanhua Yu, Songbo Hu, and Yunquan Zhang. 2016. "Estimation of the Disease Burden Attributable to 11 Risk Factors in Hubei Province, China: A Comparative Risk Assessment" International Journal of Environmental Research and Public Health 13, no. 10: 944. https://doi.org/10.3390/ijerph13100944