Selected characteristics of study participants are shown in
Table 1. African-American women were younger and had higher pre-pregnant BMI comparing to Caucasian or Hispanic women, and Caucasians were about twice as likely to smoke as other gravidas. Other variables including obesity, the sum of skinfolds, and blood pressure were comparable among African American, Hispanic and Caucasian women.
3.1. Comparison of Adipokines among Ethnic Groups
Adiponectin concentration decreased between entry and the 3rd trimester in all women from the cohort as well as for each ethnic group (p < 0.0001 for each) whereas resistin concentrations remained unchanged (p > 0.05 for each).
Significant differences in serum concentrations of adiponectin and resistin were observed among ethnic groups after controlling for several confounding variables including pre-pregnant BMI (
Table 2). A graded pattern of adiponectin was obtained where African American women had the lowest adiponectin level compared to Hispanic and/or Caucasians both at entry and during the 3rd trimester. The difference between Hispanic and Caucasian women was also significant (
p < 0.05) with Hispanics having lower concentrations.
Table 2.
Difference in adiponectin and resistin concentrations by ethnicity a.
Table 2.
Difference in adiponectin and resistin concentrations by ethnicity a.
| Ethnic Group | Adiponectin (µg/mL) | Resistin (ng/mL) |
|---|
| Entry | 3rd Trimester | Entry | 3rd Trimester |
|---|
| All subjects | 17.66 ± 0.21 | 14.75 ± 0.20 | 47.49 ± 0.63 | 48.22 ± 0.62 |
| African American | 16.49 ± 0.36 b,c | 13.23 ± 0.29 b,e | 50.32 ± 1.10 e | 50.35 ± 1.09 c |
| Hispanic | 17.90 ± 0.32 d | 15.16 ± 0.33 d | 45.28 ±1.11 d | 46.61 ± 0.96 |
| Caucasian | 19.34 ± 0.57 | 16.72 ± 0.52 | 49.43 ± 1.73 | 49.24 ± 1.72 |
A different pattern was shown for resistin. Hispanics had the lowest resistin level and African American women had the highest (p < 0.0001 at entry and p < 0.01 at 3rd trimester vs. Hispanics). While levels in African Americans did not differ significantly from levels in Caucasians, entry levels in Hispanics were significantly lower than Caucasians.
3.2. Association of Ethnicity with Low Adiponectin (Lowest Tertile) and High Resistin (Highest Tertile)
After control for potential confounding variables and using Caucasians as reference (
Table 3), African American women were twice as likely to have low adiponectin (lowest tertile) at entry and in the 3rd trimester. The results did not change significantly after controlling for pre-pregnant BMI (model 2). Although Hispanics had lower adiponectin than Caucasians (
Table 2), their likelihood of being in the lowest tertile was not significant except during the 3rd trimester and only when BMI was not controlled (adjusted odds ratio (AOR) 1.43, 95% confidence interval (CI) 1.02, 2.00,
Table 3, model 1).
The results were not statistically significant when testing for ethnic differences in increased resistin (highest tertile) using the Caucasians as the reference group. Because the distribution of resistin among ethnic groups was different from adiponectin, in that Hispanics had the lowest resistin level, we analyzed data by using Hispanics as reference (
Table 4). African American women were more likely to be in the highest resistin tertile compared to Hispanics both at entry and in the 3rd trimester when models were fully controlled (AOR 1.47, 95% CI 1.17, 1.85 for entry; AOR 1.29, 95% CI 1.03, 1.62 for 3rd trimester,
Table 4, model 2). The adjusted odds ratios were not significant comparing Caucasians to Hispanics.
Table 3.
Multiple logistic regression analysis for the associations of decreased adiponectin with ethnicity.
Table 3.
Multiple logistic regression analysis for the associations of decreased adiponectin with ethnicity.
| Low Adiponectin a | Unadjusted n (%) | AOR (95% CI) Model 1 b | AOR (95% CI) Model 2 c |
|---|
| Entry | | | |
| African American | 248 (41.2) | 2.07 (1.48, 2.89) | 1.86 (1.32, 2.63) |
| Hispanic | 235 (30.24) | 1.23 (0.90, 1.74) | 1.15 (0.82, 1.61) |
| Caucasian | 66 (25.88) | Reference | Reference |
| 3rd Trimester | | | |
| African American | 258 (42.86) | 2.61 (1.85, 3.66) | 2.41 (1.70, 3.41) |
| Hispanic | 230 (29.60) | 1.43 (1.02, 2.00) | 1.34 (0.95, 1.89) |
| Caucasian | 59 (23.14) | Reference | Reference |
Table 4.
Multiple logistic regression analysis for the associations of elevated resistin with ethnicity.
Table 4.
Multiple logistic regression analysis for the associations of elevated resistin with ethnicity.
| High Resistin a | Unadjusted n (%) | AOR (95% CI) Model 1 b | AOR (95% CI) Model 2 c |
|---|
| Entry | | | |
| African American | 227 (37.71) | 1.49 (1.18, 1.87) | 1.47 (1.17, 1.85) |
| Hispanic | 228 (29.34) | Reference | Reference |
| Caucasian | 91 (35.64) | 1.18 (0.87, 1.61) | 1.21 (0.89, 1.65) |
| 3rd Trimester | | | |
| African American | 219 (36.38) | 1.31 (1.04, 1.65) | 1.29 (1.03, 1.62) |
| Hispanic | 233 (29.99) | Reference | Reference |
| Caucasian | 94 (36.86) | 1.24 (0.91, 1.69) | 1.28 (0.94, 1.74) |
Seventy three women developed GDM during late pregnancy (
n = 12, 42, 19 for African American, Hispanics and Caucasians, respectively). After excluding women who developed GDM during the 3rd trimester, these results again remained unchanged. For example, the AOR was 2.64 for model 1 (95% CI 1.82, 3.84) and was 2.43 for model 2 (95% CI 1.67, 3.55) in African Americans compared to Caucasians (
Table 3).
In addition, African Americans appeared to have a unique difference in that they had an increased risk of simultaneously having both low adiponectin and high resistin throughout the course of pregnancy compared to Caucasians (AOR 2.23, 95% CI 1.28, 3.87 at entry and AOR 1.70, 95% CI 1.01, 2.89 for the 3rd trimester,
Table 5, model 2) as well as compared to Hispanics (AOR 2.19, 95% CI 1.52, 3.17 at entry and AOR 1.83, 95% CI 1.27, 2.63,
Table 6, model 2).
Table 5.
Association of combination of low adiponectin and high resistin with ethnicity a.
Table 5.
Association of combination of low adiponectin and high resistin with ethnicity a.
| Ethnic Group | Unadjusted | AOR (95% CI) |
|---|
| Entry | n (%) | Model 1 b | Model 2 c |
| African American | 87 (14.45) | 2.55 (1.48, 4.39) | 2.23 (1.28, 3.87) |
| Hispanic | 55 (7.08) | 1.09 (0.62, 1.92) | 1.02 (0.57, 1.80) |
| Caucasian | 18 (7.06) | Reference | Reference |
| 3rd trimester | | | |
| African American | 80 (13.29) | 1.89 (1.12, 3.19) | 1.70 (1.01, 2.89) |
| Hispanic | 58 (7.46) | 1.00 (0.58, 1.72) | 0.93 (0.54, 1.61) |
| Caucasian | 20 (7.84) | Reference | Reference |
Table 6.
Association of combination of low adiponectin and high resistin with ethnicity a.
Table 6.
Association of combination of low adiponectin and high resistin with ethnicity a.
| Ethnic Group | Unadjusted | AOR (95% CI) |
|---|
| Entry | n (%) | Model 1 b | Model 2 c |
| African American | 87 (14.45) | 2.34 (1.63, 3.36) | 2.19 (1.52, 3.17) |
| Hispanic | 55 (7.08) | Reference | Reference |
| Caucasian | 18 (7.06) | 0.92 (0.52, 1.62) | 0.98 (0.56, 1.74) |
| 3rd trimester | | | |
| African American | 80 (13.29) | 1.89 (1.31, 2.71) | 1.83 (1.27, 2.63) |
| Hispanic | 58 (7.46) | Reference | Reference |
| Caucasian | 20 (7.84) | 1.00 (0.58, 1.72) | 1.07 (0.62, 1.86) |
3.3. The Correlation between Adipokine Levels with Maternal Factors
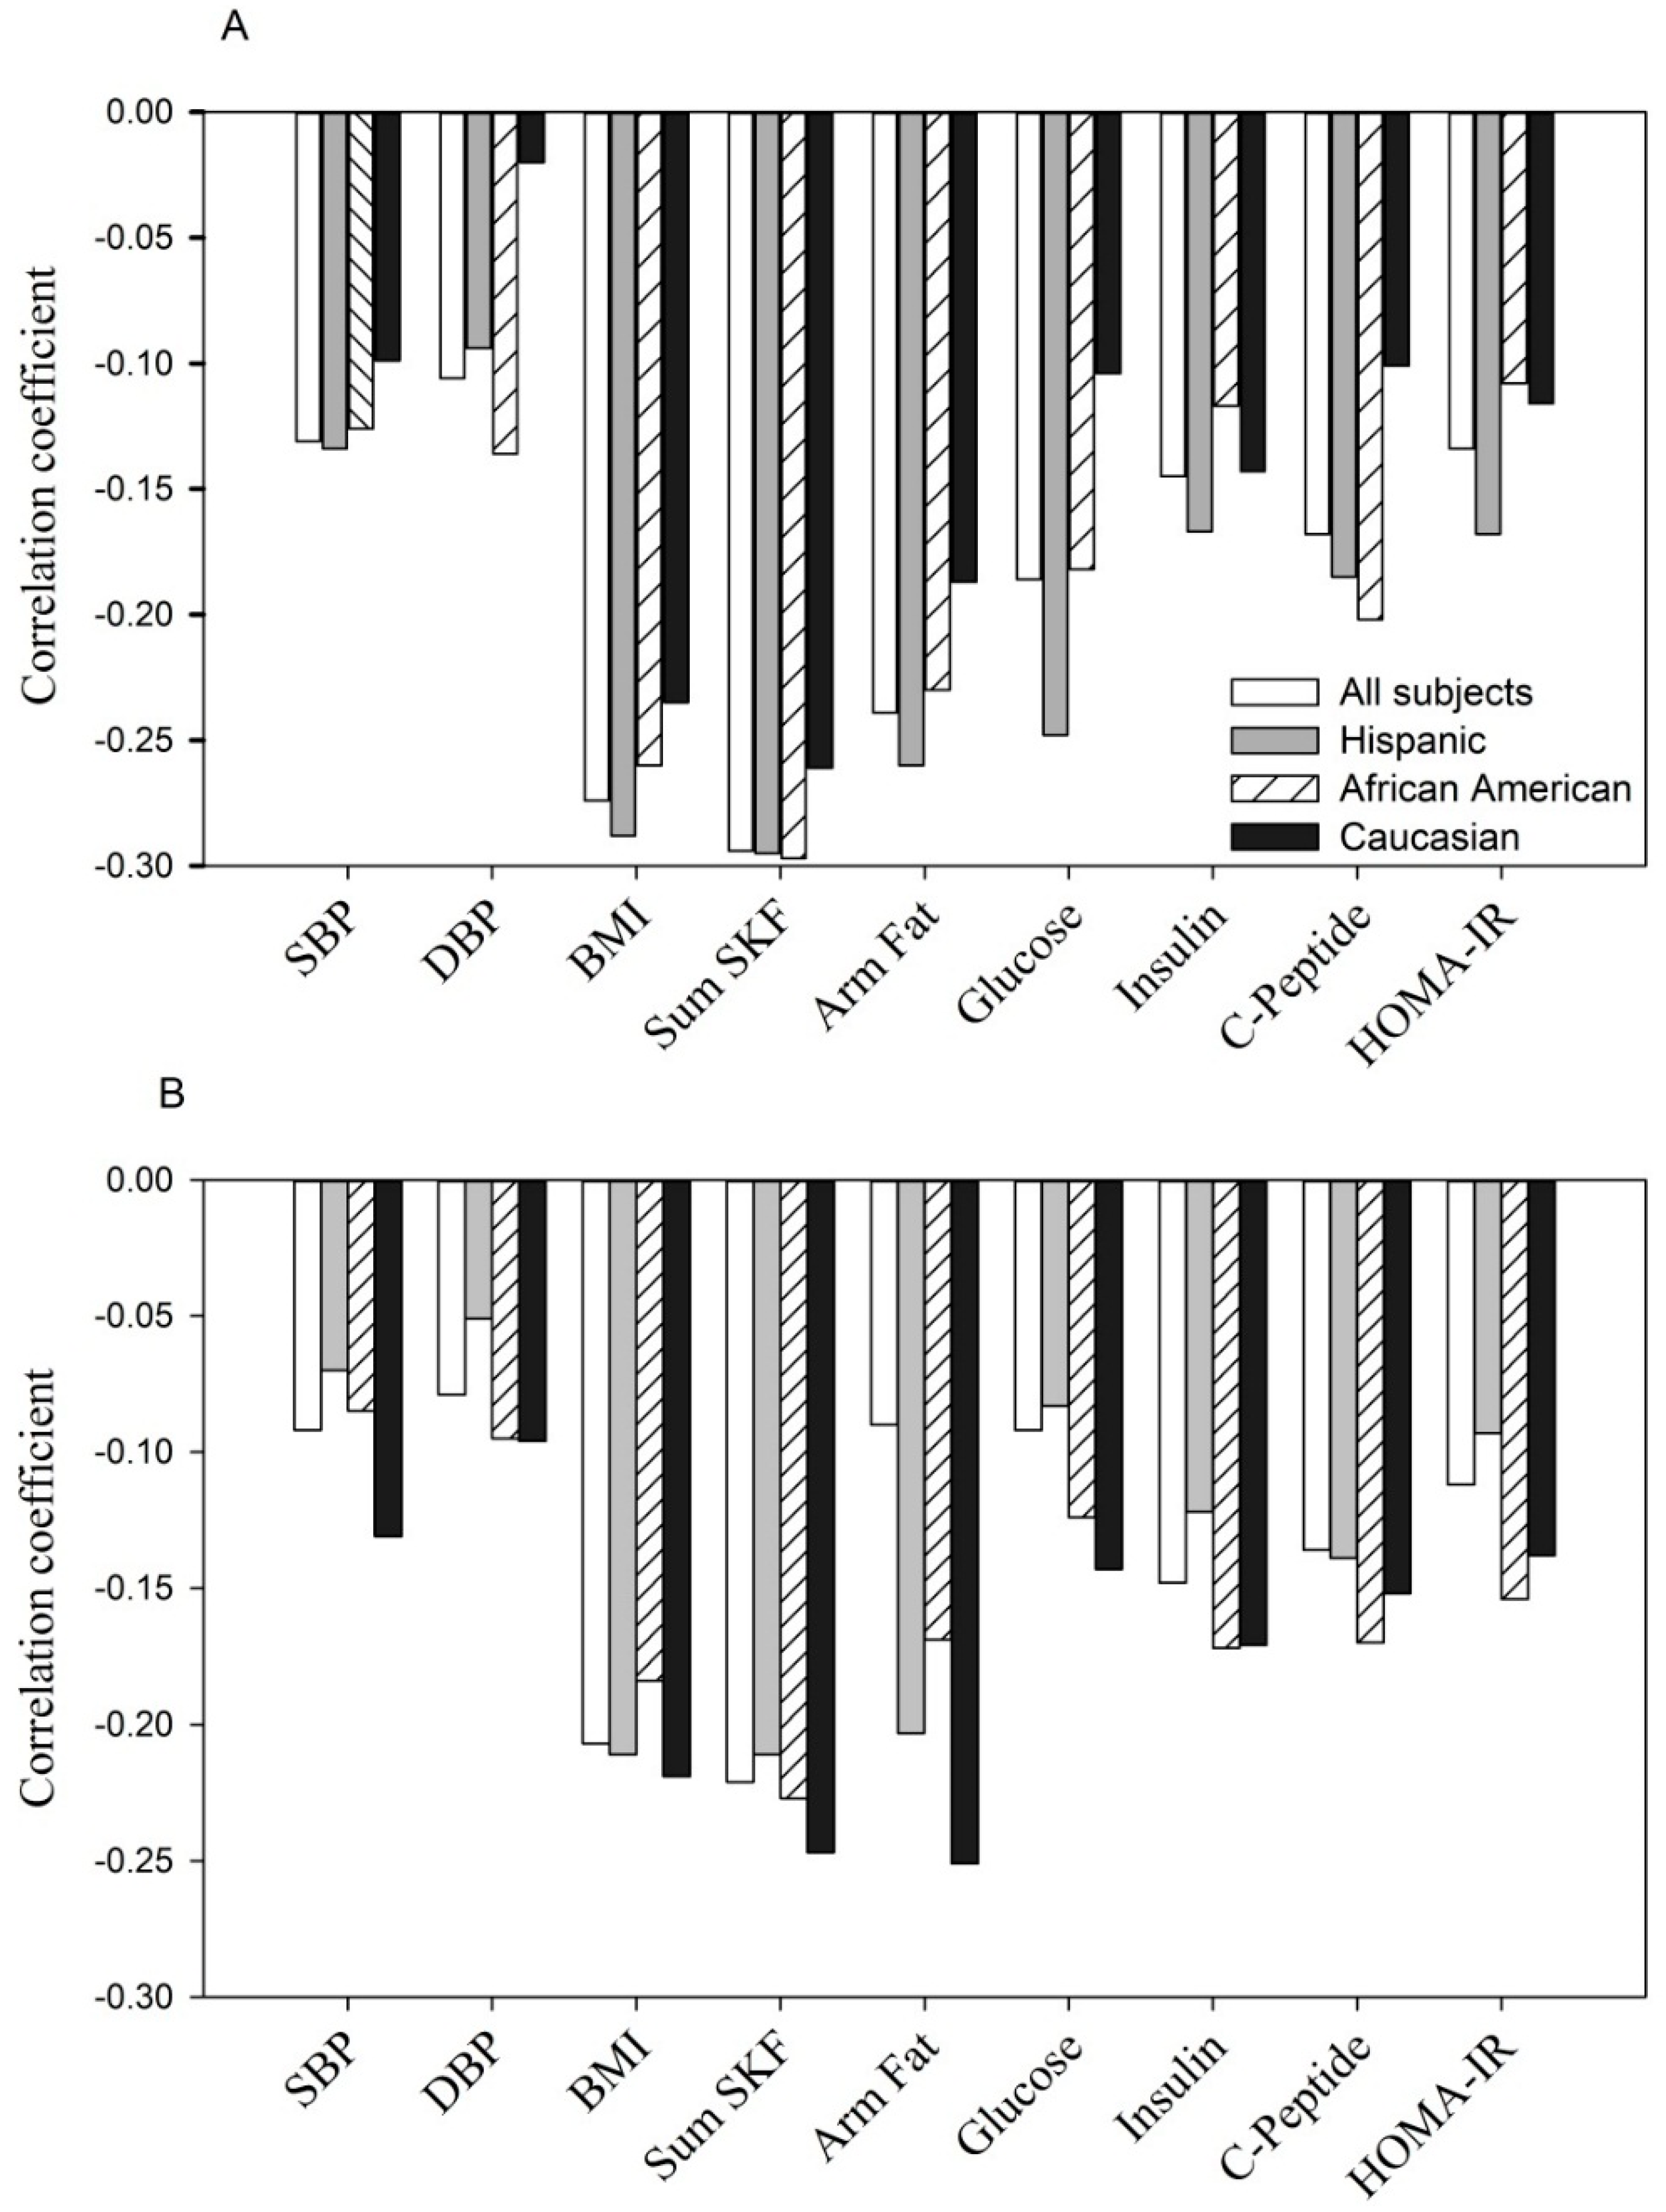
Finally, adiponectin concentrations were significantly and negatively correlated with maternal BMI, sum of skinfolds, arm fat area, systolic and diastolic blood pressure and, glucose homeostasis parameters (fasting glucose, insulin,
C-peptide and HOMA-IR) at entry (
Figure 1A,
p < 0.05 to
p < 0.0001 for
r = −0.11 to
r = −0.30) and during the 3rd trimester (
Figure 1B,
p < 0.05 to
p < 0.0001,
r = −0.10 to
r = −0.27). A similar relationship was observed for each of the ethnic groups.
Shown are Pearson correlation coefficients in all women and by ethnicity. For fasting glucose, insulin and C-peptide (n = 1323).
SBP, systolic blood pressure; DBP, diastolic blood pressure; Sum SKF, sum of skinfolds; Arm fat, upper arm fat area; HOMA-IR, the homeostatic model assessment of insulin resistance (same as in
Figure 2 and
Figure 3).
Negative correlation between adiponectin concentration with selected parameters at entry: p < 0.05 to p < 0.0001 for each of parameters tested in all women, Hispanics and African Americans. In Caucasians, p < 0.05 to p < 0.001 with BMI, sum of skinfolds, arm fat area and insulin; but p > 0.05 for SBP, DBP, C-peptide, glucose and HOMA-IR.
Negative correlation between adiponectin concentration with selected parameters during the 3rd trimester: p < 0.05 to p < 0.0001 for each of parameters tested in all women, Hispanics, African Americans and Caucasians, except for DBP, fasting glucose in Hispanics (p > 0.05) and DBP, glucose and HOMA-IR in Caucasians (p > 0.05).
Figure 1.
(A, at entry; B, during the 3rd trimester). The relationship between serum adiponectin (µg/mL) with anthropometric and glycemic parameters.
Figure 1.
(A, at entry; B, during the 3rd trimester). The relationship between serum adiponectin (µg/mL) with anthropometric and glycemic parameters.
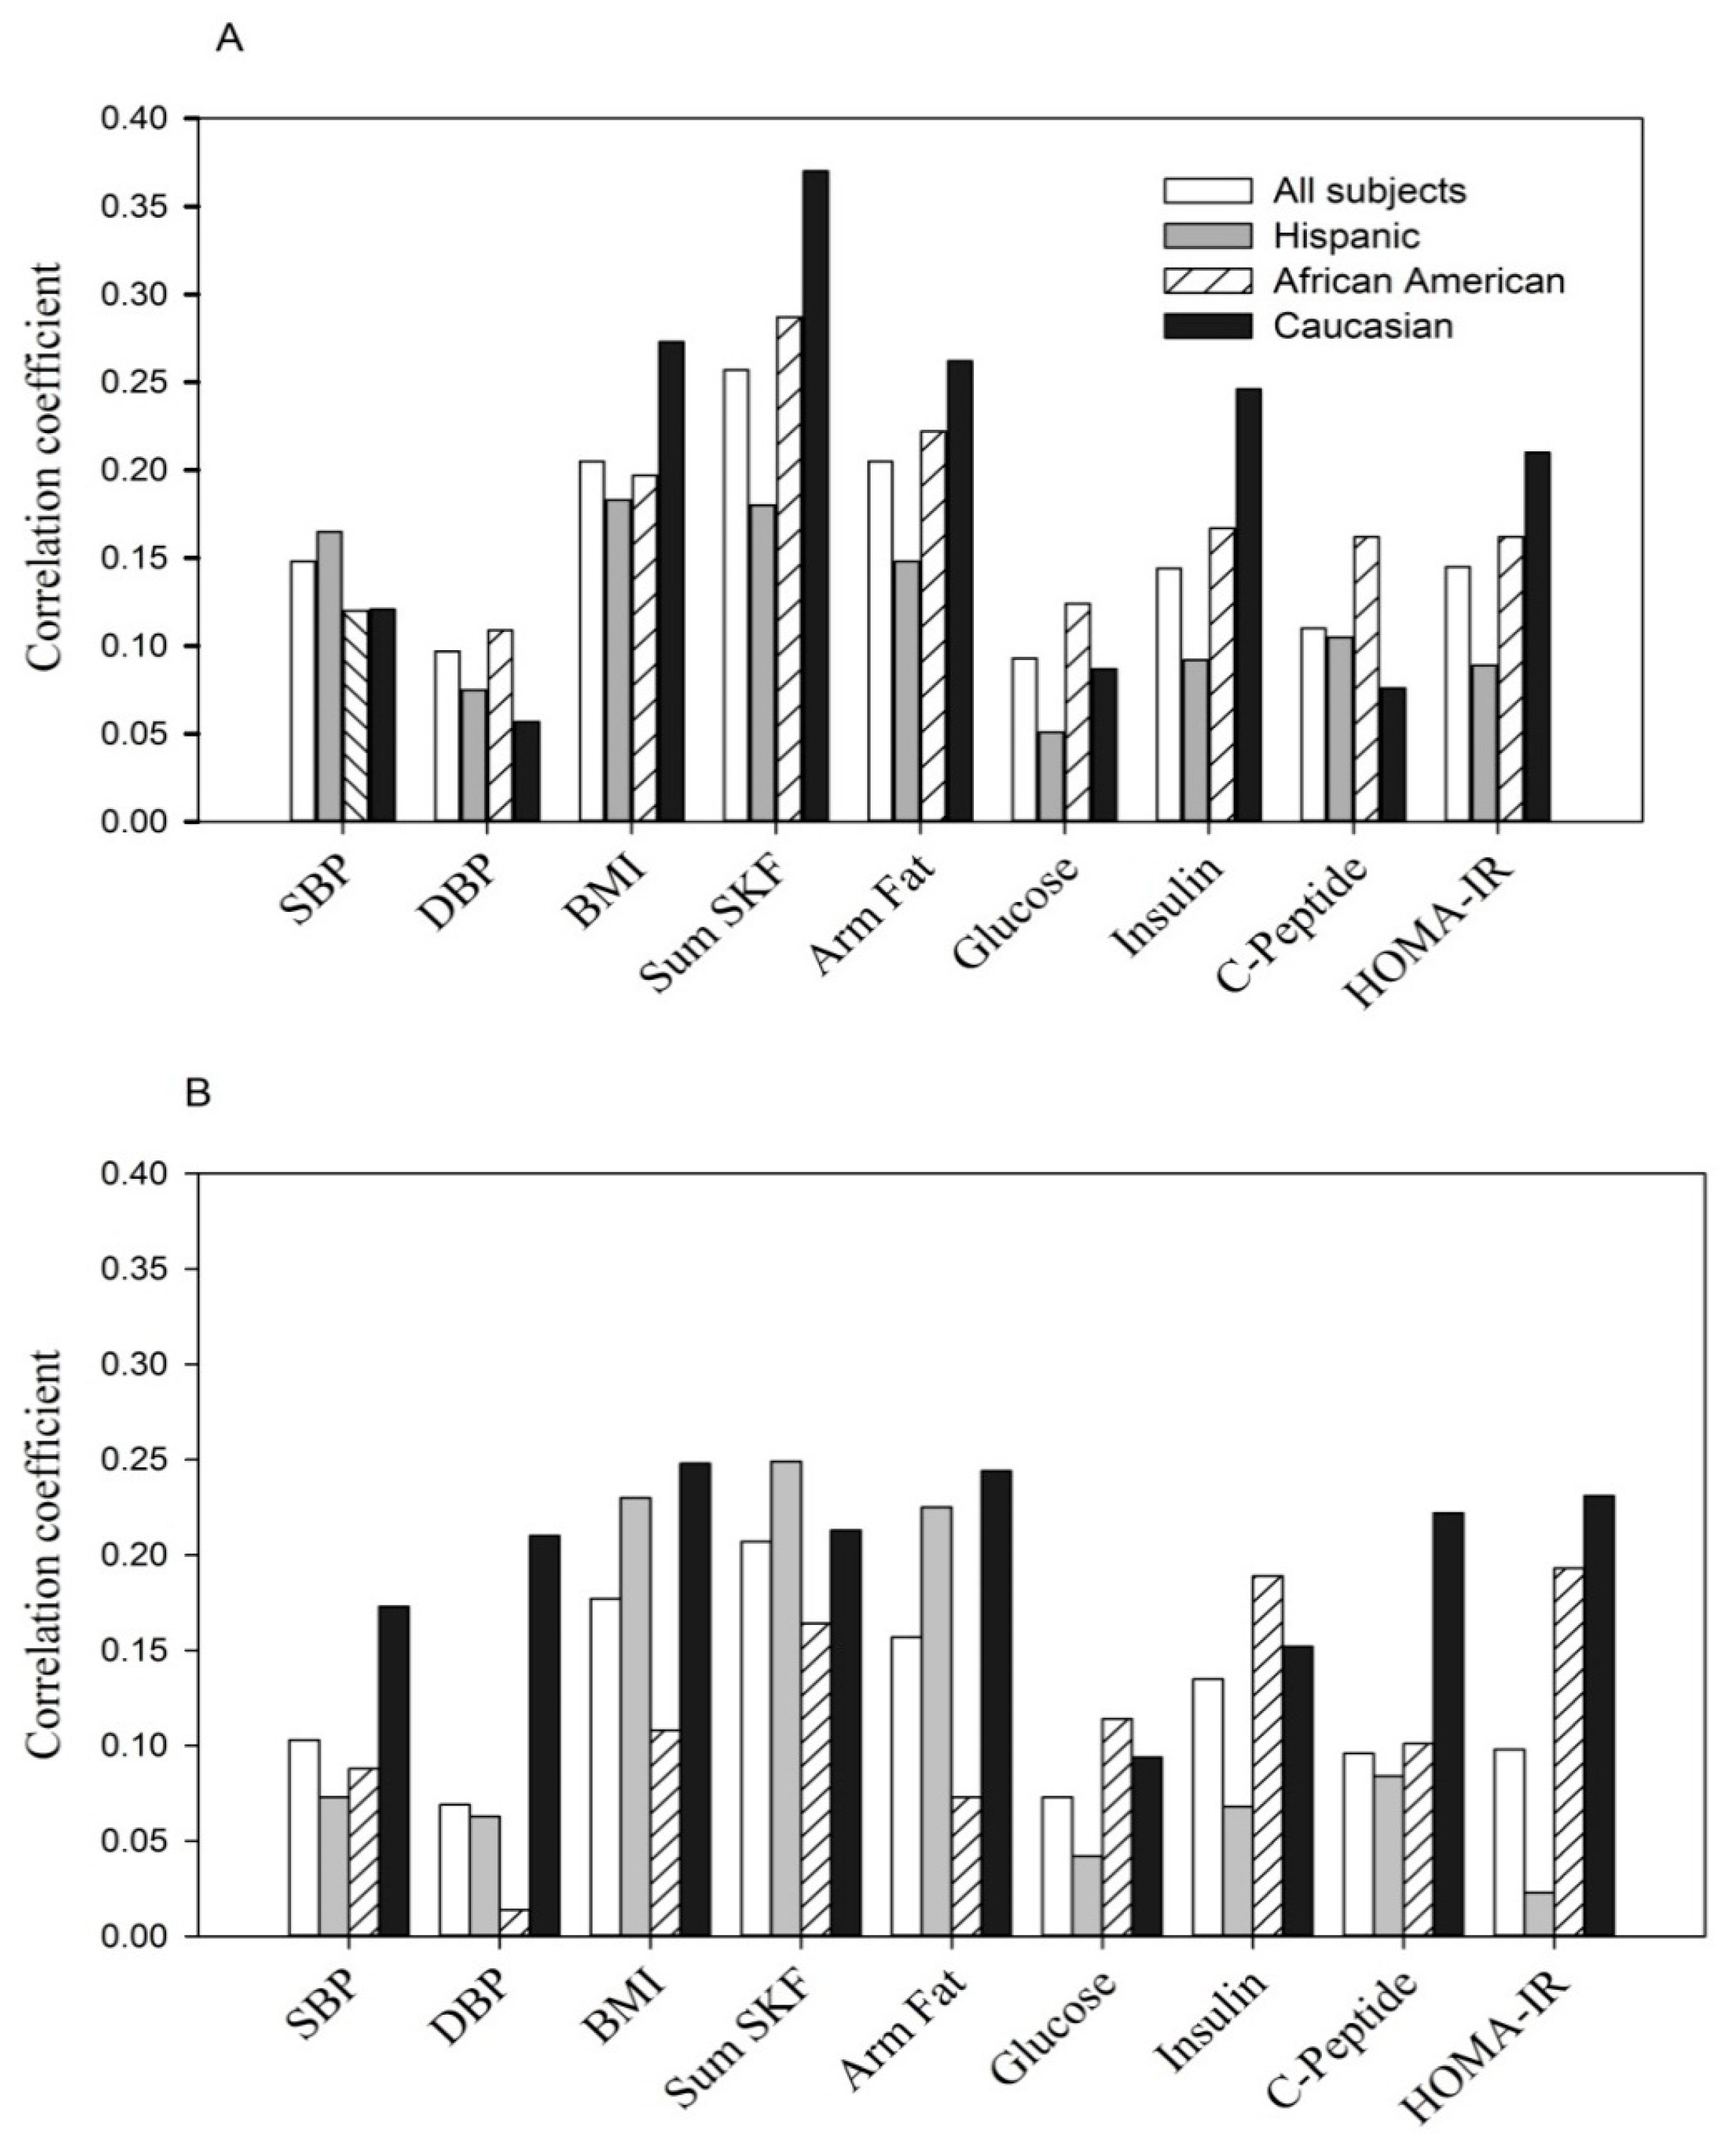
In contrast, the relationship between resistin and the same parameters was weaker and less consistent (
Figure 2). At entry, in all subjects, fasting glucose and diastolic blood pressure were not significantly correlated with resistin while SBP, BMI, sum of skinfolds, arm fat area, fasting
C-peptide, insulin and HOMA-IR were modestly related (
p < 0.05 to
p < 0.0001,
r = +0.07 to
r = +0.15 (
Figure 2A). The pattern of correlation was similar but much weaker when examined by ethnicity. During the 3rd trimester, significant correlations were obtained between resistin and systolic and diastolic blood pressure, sum of skinfolds, arm fat area and BMI in all women (
p < 0.05 to
p < 0.001,
r = +0.08 to
r = +0.20). A similar pattern was observed in Hispanics and Caucasians. In African American women, resistin was correlated only with the sum of skinfolds (
r = +0.12,
p < 0.01). None of the glucose homeostasis parameters reached statistical significance overall or by ethnic groups (
Figure 2B).
Figure 2.
(A, at entry; B, during the 3rd trimester). The relationship between serum resistin (ng/mL) with anthropometric and glycemic parameters.
Figure 2.
(A, at entry; B, during the 3rd trimester). The relationship between serum resistin (ng/mL) with anthropometric and glycemic parameters.
Shown are Pearson correlation coefficients in all women and by ethnicity.
The positive correlation between resistin concentration with selected parameters at entry: p < 0.05 to p < 0.0001 for each parameter tested in all women, Hispanics and Caucasians, except for DBP, fasting glucose in all women and Hispanics (p > 0.05); for SBP, DBP, BMI and fasting glucose in Caucasians (p > 0.05). The correlations were all non-significant in African Americans except for sum of skinfolds (p < 0.01).
The positive correlation between resistin concentration with selected parameters at the 3rd trimester: p < 0.05 to p < 0.0001 for SBP, DBP, BMI, sum of skinfolds and arm fat area in all women and Hispanics; p < 0.01 for sum of skinfolds in African Americans; p < 0.001 and p < 0.05 for sum of skinfolds and arm fat area in Caucasians. Other parameters were all non-significant.
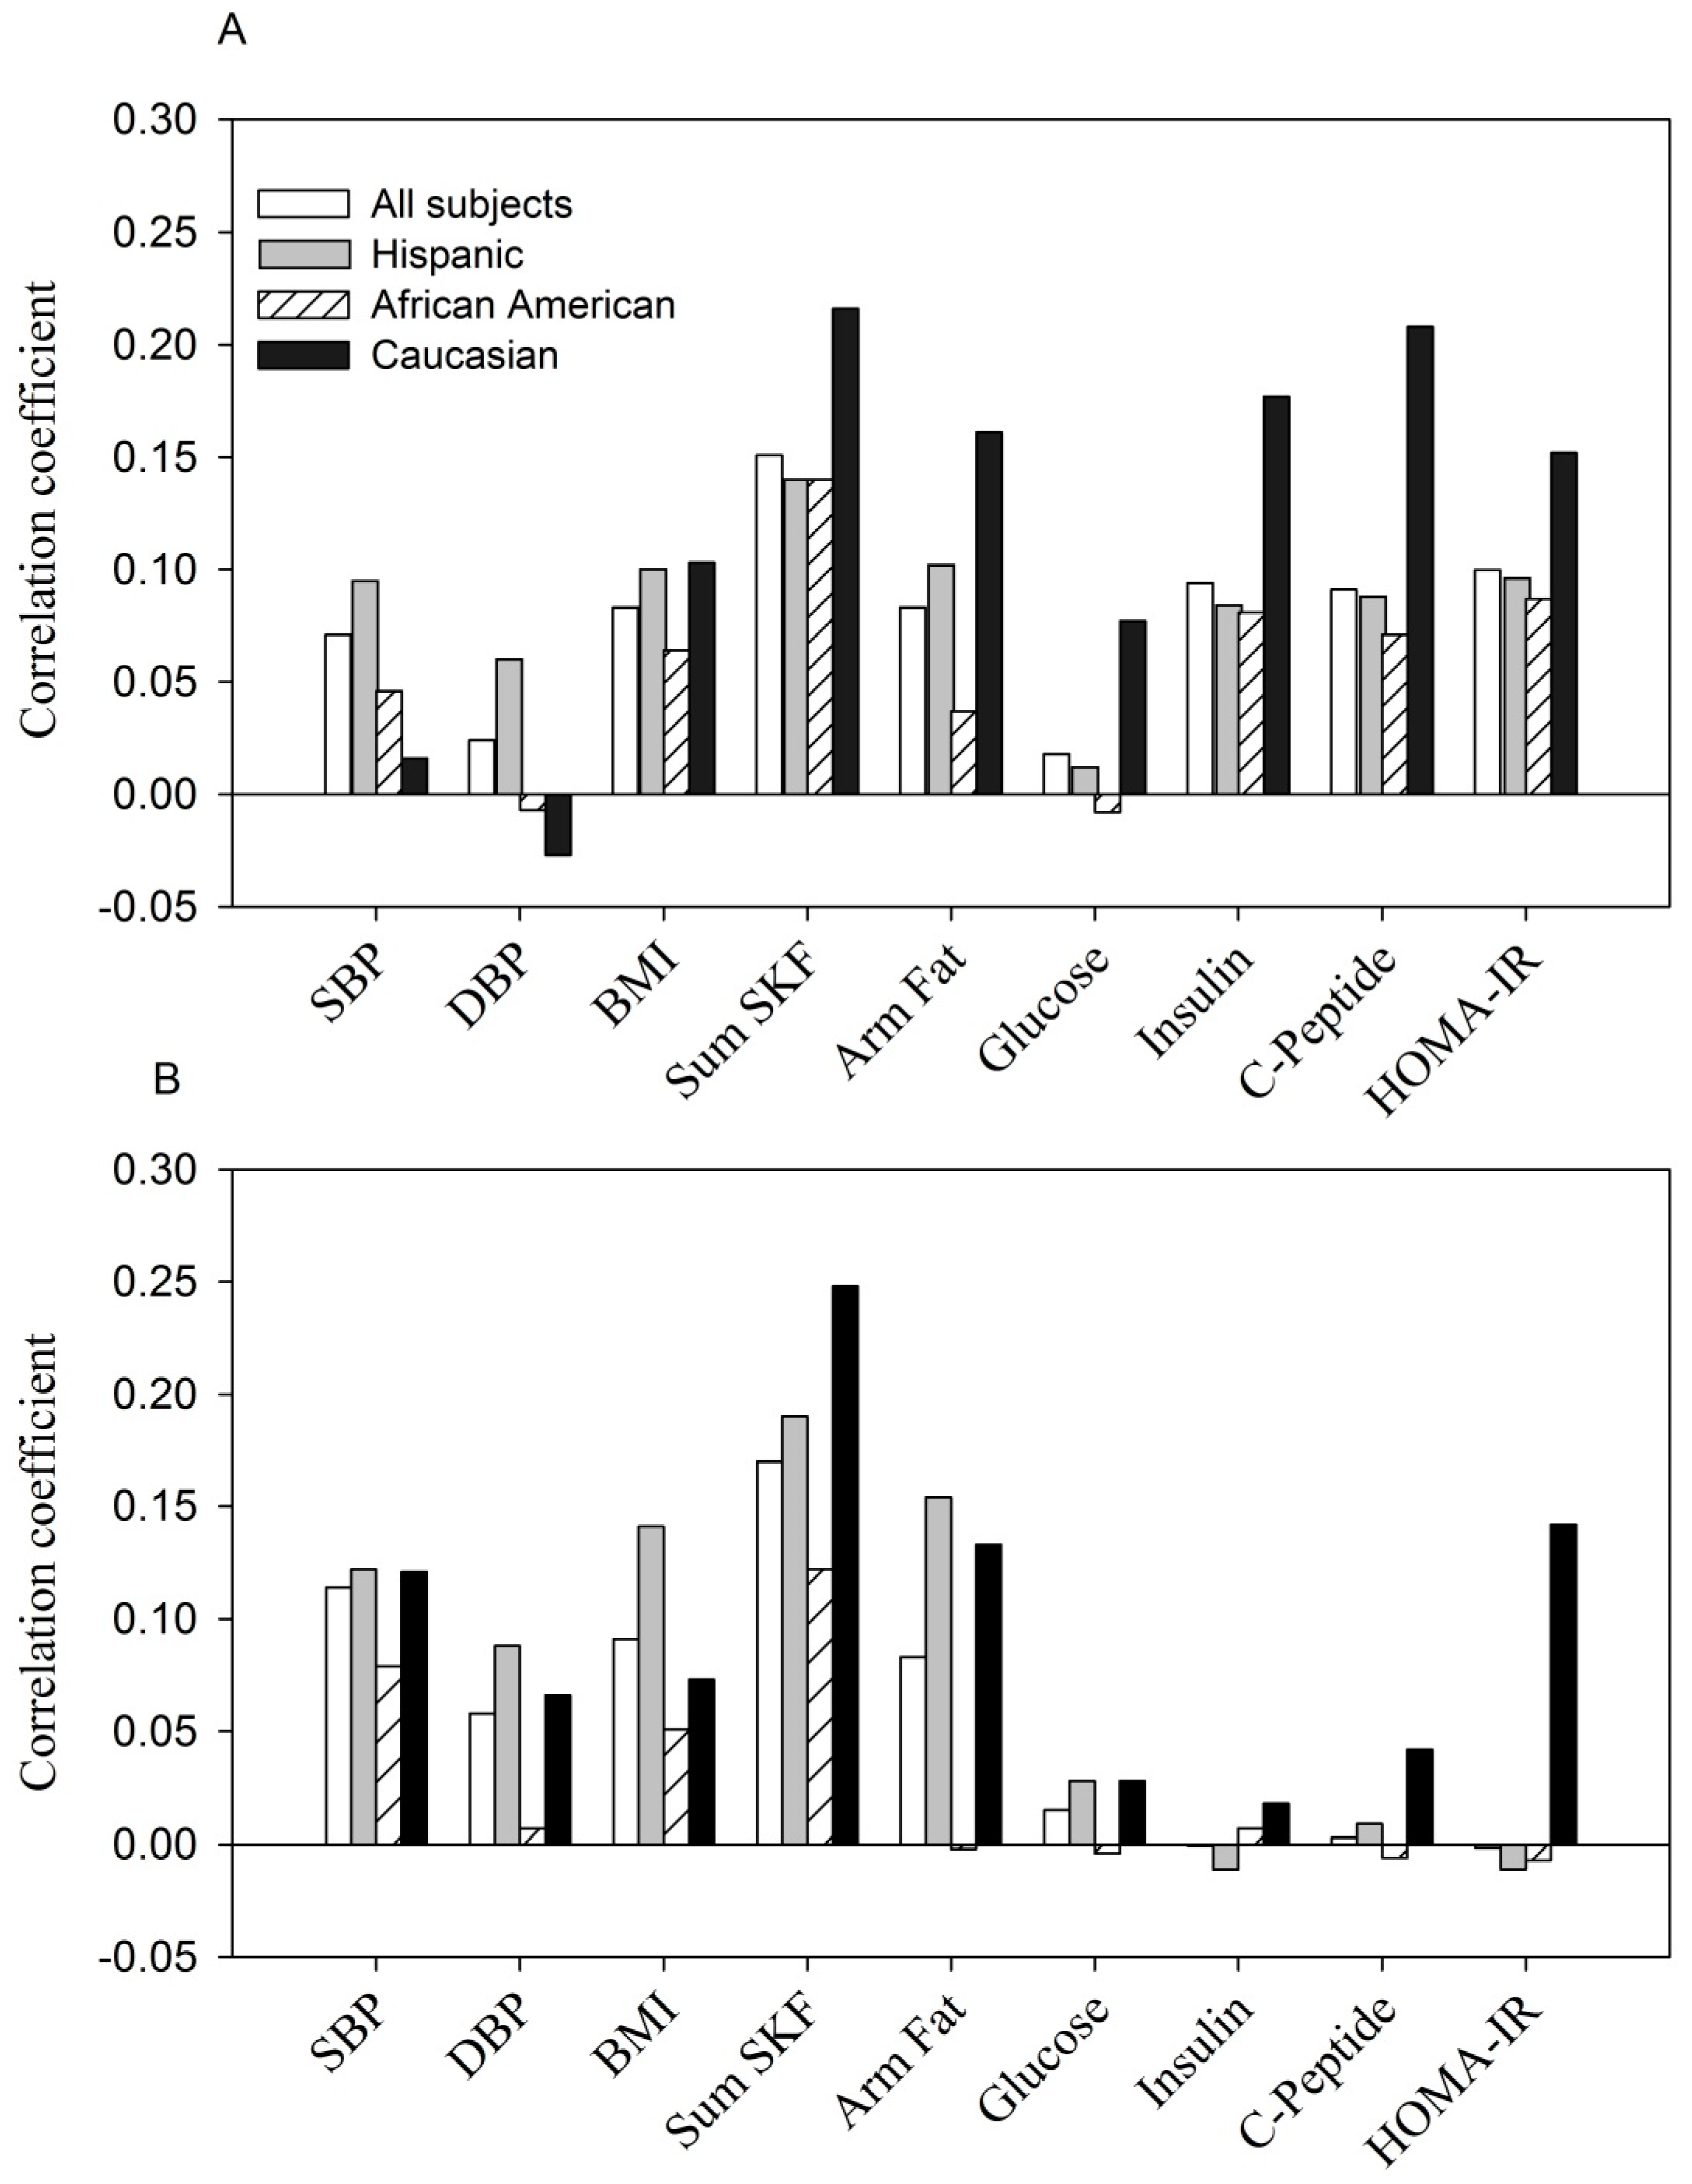
The correlation between the same parameters with the combination of low adiponectin and high resistin (
Figure 3) was consistently positive and observed in all women (
p < 0.05 to
p < 0.0001,
rpb = +0.07 to
rpb = +0.37) as well as by maternal ethnicity.
Figure 3.
(A, at entry; B, during the 3rd trimester). The relationship of variable combined low adiponectin (lowest tertile) with high resistin (highest tertile) to anthropometric and glycemic parameters.
Figure 3.
(A, at entry; B, during the 3rd trimester). The relationship of variable combined low adiponectin (lowest tertile) with high resistin (highest tertile) to anthropometric and glycemic parameters.
Shown are point biserial correlation (
rpb) coefficients in all women and by ethnicity.
The positive correlation at entry: p < 0.05 to p < 0.0001 for each of parameters except fasting glucose in Hispanics (p > 0.05) and DBP, fasting glucose and C-peptide in Caucasians (p > 0.05).
The positive correlation at the 3rd trimester: p < 0.05 to p < 0.0001 for each of parameters with the exception of DBP, fasting glucose and insulin in Hispanics (p > 0.05), DBP and arm fat area in African Americans (p > 0.05) and fasting glucose in Caucasians (p > 0.05).
3.4. Discussion
Our study is unique in that we examined the relation of ethnic variation in two adipokines with multiple parameters of maternal glucose homeostasis, blood pressure and with several anthropometric measures taken in early and later pregnancy. We used data from a large prospective cohort of 1634 normal pregnant women. We found that African American women had decreased adiponectin and increased resistin levels during early and late gestation. Hispanics also had decreased adiponectin, but their resistin levels were lower than African Americans (at both time points) and Caucasians (at entry alone). Thus, African Americans were found to have a higher prevalence of an exceptional pattern of adipokines that coupled low adiponectin with high resistin throughout the course of pregnancy.
While ethnic differences in adiponectin have infrequently been reported during pregnancy they have been described in non-pregnant subjects. Smith
et al. found that healthy African American women had lower adiponectin (
p < 0.01) accompanied by reduced expression of several genes involved in adipose tissue adipogenesis and lipogenesis when compared to Caucasians [
23]. Lower adiponectin concentrations have also been reported in South Asians and Aboriginal Canadians compared to Europeans or Caucasians [
24,
25]. Findings from one of these studies (albeit in males and non-pregnant females) of low adiponectin with increased insulin resistance is similar to what is found in the pregnant state [
25].
In an earlier case-control study, we described lower adiponectin among pregnant African Americans regardless of whether they developed GDM, had hyperglycemia without overt GDM or were normal controls; the difference was especially detectable during 3rd trimester [
14]. In this larger prospective cohort, we confirmed that African American women had significantly decreased mean levels of adiponectin (
versus Hispanics or Caucasians) and a two-fold increase of being in the lowest tertile (
vs. Caucasians) (
Table 2 and
Table 3). These results were independent of several potential confounding variables including BMI. To our knowledge, the current study is the first large scale and prospective demonstration of ethnic differences in serum adiponectin for US pregnant women.
Likewise data describing ethnic differences in resistin during pregnancy are uncommon. The only report of which we are aware showed no ethnic differences in resistin and other inflammatory cytokines including TNF-α and
C-reactive protein in non-pregnant Aboriginals compared to white Canadians [
24].
Among postmenopausal women and other subjects, elevated serum resistin is associated with increased risk of type 2 diabetes, metabolic syndrome and ischemic stroke [
3,
4,
5,
6], but results from pregnancy are conflicting. Small scale studies conducted late in gestation, usually following a diagnosis of gestational diabetes, found resistin to be increased, decreased or unchanged compared to controls [
26,
27,
28]. As far as we are aware, no other investigators have reported the pattern we detected among African Americans: An increased prevalence in the simultaneous combination of low adiponectin with high resistin.
In the current study, adiponectin was significantly and negatively correlated at both time points with all maternal factors examined including BMI, skinfolds, systolic and diastolic blood pressure, fasting levels of glucose, insulin,
C-peptide and HOMA-IR (
Figure 1). When examined by ethnicity, each group showed a similar correspondence between maternal factors and adiponectin.
Apart from positive correlations between resistin and maternal adiposity the association between resistin and the same maternal factors was weak and inconsistent (
Figure 2). No significant correlation was observed between resistin and glucose homeostasis variables during the 3rd trimester for any of the three ethnic groups. Likewise, the Hyperglycemia and Adverse Pregnancy Outcome study showed that resistin was positively related to maternal BMI but not with fasting or 1 or 2 h glucose [
29]. Thus, maternal resistin concentration in non-GDM pregnancy may reflect adipose or fat mass. The role of resistin in normal pregnancy, a condition with dramatic changes in metabolic demand and cardiovascular function, remains poorly defined when compared to the non-pregnant state.
Several studies, none from pregnant women, have shown that ethnic differences in adiponectin parallel ethnic variation in risk factors for CVD such as visceral fat distribution and insulin resistance [
10,
24,
25]. Since adiponectin is protective against inflammation and anthogenesis [
1,
5,
7], we hypothesize that decreased adiponectin in African American pregnant women may prognosticate reduced protection against development of serious complications such as GDM.
Inflammatory mediators including endothelial adhesion molecules have been associated with adverse pregnancy outcomes like preterm delivery [
15,
30,
31]. More research is needed to confirm the extent to which ethnic differences in adipokines and in their pattern contribute to adverse outcomes. Likewise it would be important to examine links between maternal life style and diet to ethnic variation in the adipokines, and to ethnic disparities during pregnancy.


