1. Introduction
According to a growing body of epidemiological evidence traffic-related air pollution has been shown to have adverse health impacts. Fine particulate matters with aerodynamic diameters smaller than 2.5 micrometers (PM
2.5) pose great public health hazards, including higher risks of respiratory diseases, impaired lung function, asthma attacks, cardiovascular diseases, and potentially also premature death [
1].
The particulates generated from combustion are more harmful than those generated from other processes, and traffic emissions are estimated to account for up to 50% of combustion-generated particulates in urban areas in developing countries [
2]. According to the Ministry of Environmental Protection of China, traffic emissions have become the main source of air pollution in Beijing [
3]. Among all air pollutants, PM
2.5 is of special importance in China due to the rapidly growing number of road vehicles in recent years. By collecting and analyzing aerosol samples of PM
2.5 and PM
10 both in summer and winter seasons at different traffic, industrial and residential areas in Beijing, a multisite study found that industrial and motor vehicle emissions, together with coal burning, were the major contributors to the air-borne particulate pollution in Beijing [
4].
Although the Beijing Environmental Protection Bureau started monitoring air pollution in 1984, monitoring of PM
2.5 only started in 2006. Prior to that, PM
2.5 was mainly used for air pollution research purposes [
5]. As a result of increasing demand from the public, since October 2012, Beijing has increased its number of fixed air quality monitoring (AQM) stations from 27 to 35 across the entire municipal area. In addition to carbon dioxide, sulfur dioxide, nitrogen dioxide, ozone and PM
10, PM
2.5 has also been included in the air quality evaluations of these AQM stations. A study found that, while burning of coal for power plants is a major source of air pollution across China, vehicle emissions are one of the biggest sources of PM
2.5 in Beijing, with greater impact than soil dust, fossil fuel combustion, biomass burning and some industrial sources [
6]. Although previous studies have clearly shown that the contribution of traffic emissions to total air pollution varies largely with time and space, they were unable to characterize the spatiotemporal features of the traffic-related PM
2.5 because of limited information on location and time period for air sample collection [
5].
Chemical mass balanced receptor models and source-oriented chemical transport models have been used to estimate the contributions of various sources to PM
2.5, but most of them require the knowledge of the chemical profile of both the emissions of the sources and the air samples of the receptors (
i.e., the impacted locations) [
7,
8]. Although other models such as principal component and factor analyses do not require a priori knowledge of the source profile, application of these models yielded controversial results. For example, the estimated motor-vehicle contribution to PM
2.5 ranged from 6% in Beijing, China to 53% in Barcelona, Spain [
9].
Although traffic emission is the principal source of intra-urban concentration of PM
2.5, one reason that the direct measurement of motor-vehicle emission may not be feasible in epidemiological studies is that it is usually not possible to track all the vehicles and measure corresponding components of the traffic-pollutant mix in the whole study area [
10]. As a result, different surrogates of traffic-related pollution have been used to assess the contribution of road traffic to ambient air pollution. In epidemiological studies, the commonly used surrogate models include geostatistical interpolation [
11], land-use regression [
12], dispersion [
13] and hybrid [
14] models. Hybrid models combine personal activity of residents in the study area and exposure data, and incorporate various measurements, therefore better quantify the contribution of traffic on air pollution, against a background concentration of specific regions. However, none of the models has an ideal surrogate to access the emissions from all sources over time and space, posing a significant challenge in disentangling the contribution of road traffic from other sources.
To improve the assessment of traffic-related contributions to PM
2.5, a promising method is the deployment of a large number of AQM stations in places where concentrations of PM
2.5 are expected to be highly variable, and with available information on temporal and spatial factors [
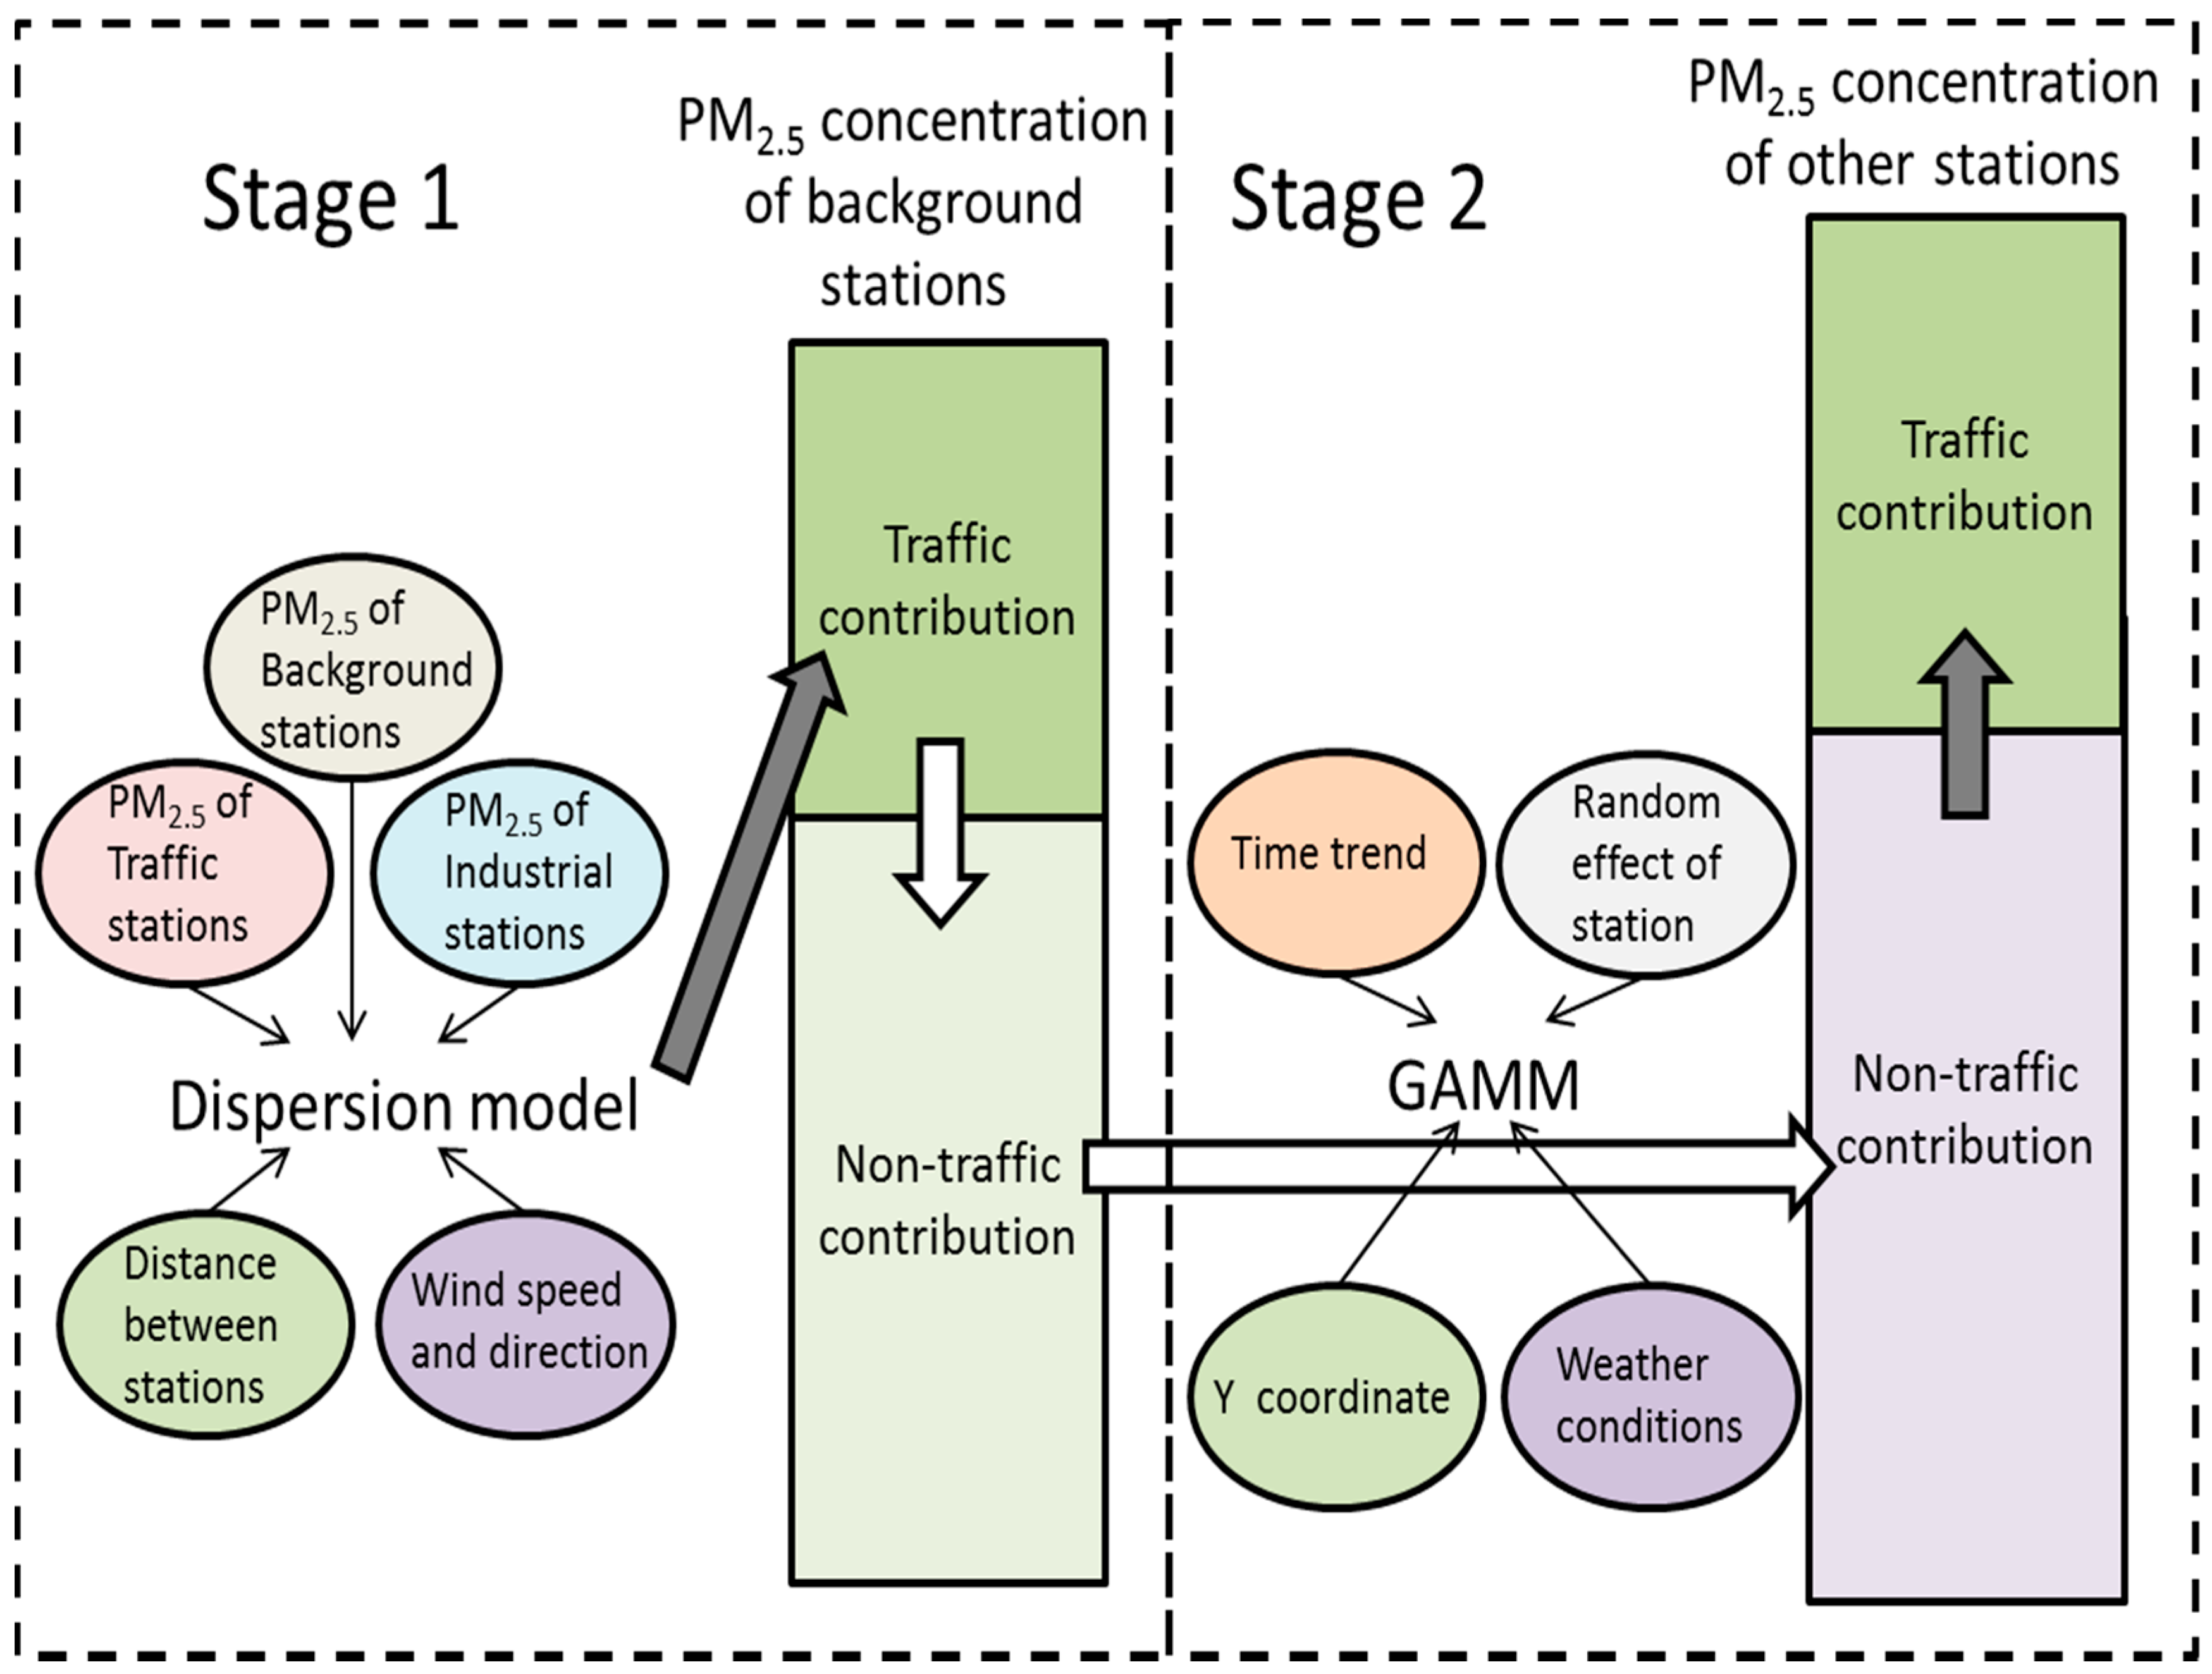
15]. The intensive air quality data that we collected from 35 AQM stations in Beijing, one of the most populous cities in the world, between 2013 and 2014, provided us a unique opportunity to achieve this purpose. In our paper, we presented a two-stage method using dispersion model and generalized additive mixed model (GAMM) to estimate the contribution of road traffic to PM
2.5 concentrations in Beijing. We used different types of the AQM stations (described in Material and Methods section) to distinguish the emission sources of PM
2.5, adjusted for the location of these stations, traffic density and meteorological conditions. In the first stage, a Community Multi-scale Air Quality (CMAQ) based model was built to estimate the contribution of road vehicle emission to PM
2.5 as a result of dispersion and decay in the areas represented by background stations [
16]. In the second stage, a GAMM with meteorological and geographic data was developed to estimate the non-traffic contribution to PM
2.5 at the rest stations. The traffic contribution to PM
2.5 was then calculated by subtracting the total PM
2.5 concentration with non-traffic concentration. The study was approved by the Institutional Review Board of Karolinska Institutet, Sweden.
3. Results
PM
2.5 concentrations from the 35 AQM stations and meteorological conditions during 2013–2014 in Beijing are shown in
Table 1 and
Table 2. The medians of daily PM
2.5 concentration of the 35 stations ranged from 40 to 92 μg/m
3. The means of daily PM
2.5 concentration ranged from 63 to 112 μg/m
3, higher than 55.4 μg/m
3 as reported by Yu
et al. in 2013 [
30]. The average PM
2.5 concentration was almost four times the U.S. Environmental Protection Agency standard (15 μg/m
3) [
31]. In general, background stations had lower whereas traffic stations and industrial stations had higher PM
2.5 concentrations than the other stations located in the same districts.
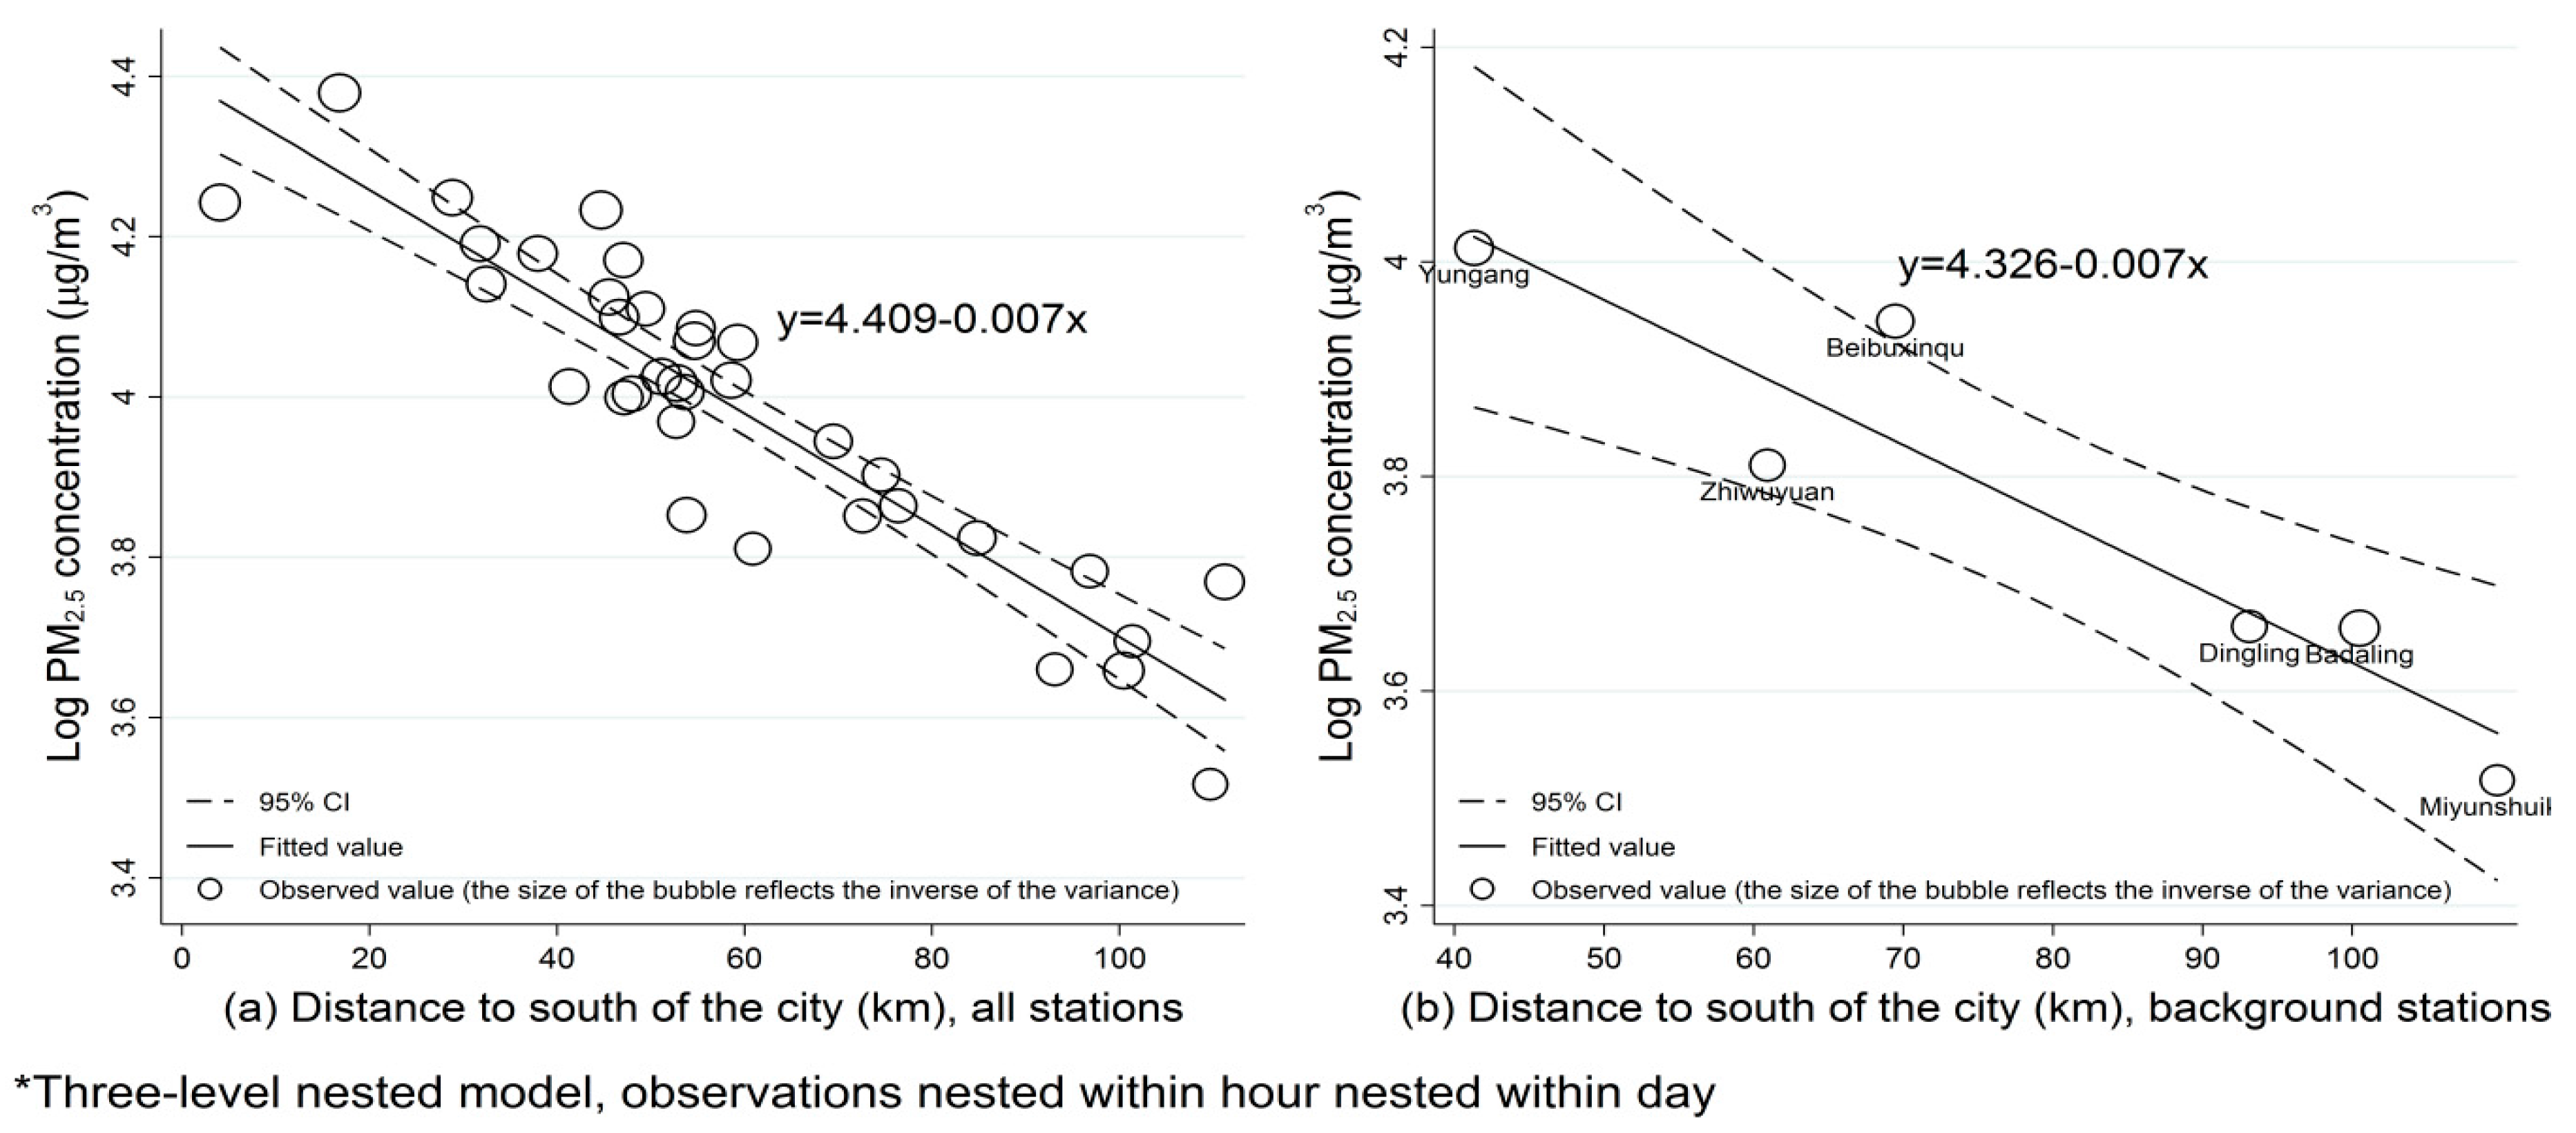
There was a significant linear relationship between Y coordinates and log transformed PM
2.5 concentrations both in all stations and in background stations (
Figure 4), supporting our assumption that PM
2.5 concentration followed an exponential decline function on distance. The Y coordinates could explain more than 80% variation of log transformed annual average PM
2.5 concentrations in all stations. The closer a station was to the south border of the southern industrial area, the heavier the pollution level it had.
The optimal estimation of the parameters and fitness of the model was shown in
Table 3. The dispersion model can explain more than 60% variation of the daily PM
2.5 concentration of the background stations. The unexplained variation might on the other hand be due to temporal trend and meteorological conditions and was modeled in the GAMM later.
Table 1.
PM2.5 concentrations and Y coordinates of 35 AQM stations.
Table 1.
PM2.5 concentrations and Y coordinates of 35 AQM stations.
| Stations | PM2.5 (μg/m3) | Y Coordinate (km) |
|---|
| Mean | P25 | Median | P75 |
|---|
| Background stations | | | | | |
| Badaling | 64.8 | 17.0 | 40.0 | 91.0 | 100.47 |
| Beibuxinqu | 86.5 | 24.2 | 62.0 | 122.7 | 69.47 |
| Dingling | 71.2 | 15.0 | 45.0 | 101.0 | 93.12 |
| Miyunshuiku | 63.4 | 13.0 | 40.3 | 91.0 | 109.68 |
| Yungang | 90.0 | 28.0 | 65.0 | 125.0 | 41.32 |
| Zhiwuyuan | 79.7 | 19.0 | 56.0 | 112.7 | 60.91 |
| Traffic stations | | | | | |
| Dongsihuan | 97.5 | 29.0 | 71.0 | 135.0 | 54.82 |
| Nansanhuan | 106.6 | 36.2 | 81.0 | 147.0 | 44.70 |
| Qianmen | 100.0 | 31.0 | 76.6 | 138.8 | 49.45 |
| Xizhimenbei | 92.8 | 29.0 | 68.3 | 127.2 | 54.66 |
| Yongdingmen | 98.0 | 31.0 | 73.0 | 135.1 | 46.62 |
| Industrial stations | | | | | |
| Liulihe | 122.2 | 44.0 | 92.0 | 169.0 | 16.81 |
| Yufa | 109.6 | 38.0 | 79.8 | 148.0 | 4.06 |
| Other stations | | | | | |
| Aoti | 89.8 | 27.0 | 67.0 | 125.0 | 58.61 |
| Changping | 78.0 | 19.0 | 53.0 | 111.0 | 84.81 |
| Daxing | 106.9 | 35.0 | 79.0 | 147.0 | 31.81 |
| Donggaocun | 79.3 | 22.0 | 58.0 | 113.0 | 72.61 |
| Dongsi | 90.4 | 25.2 | 66.5 | 128.0 | 52.71 |
| Fangshan | 101.2 | 33.0 | 75.8 | 140.8 | 32.43 |
| Fengtaihuayuan | 99.7 | 31.0 | 74.1 | 139.0 | 45.53 |
| Guanyuan | 88.4 | 27.0 | 65.5 | 123.4 | 52.82 |
| Gucheng | 90.0 | 28.0 | 67.5 | 125.0 | 51.16 |
| Huairou | 76.1 | 19.0 | 52.9 | 108.0 | 96.85 |
| Mentougou | 79.2 | 22.0 | 55.4 | 111.0 | 53.85 |
| Miyun | 71.9 | 17.5 | 49.0 | 100.0 | 101.39 |
| Nongzhanguan | 91.3 | 26.4 | 66.0 | 126.0 | 53.63 |
| Pinggu | 80.8 | 23.0 | 57.0 | 111.0 | 76.40 |
| Shunyi | 84.8 | 22.0 | 61.0 | 121.0 | 74.58 |
| Tiantan | 89.0 | 27.0 | 66.4 | 125.2 | 48.00 |
| Tongzhou | 105.7 | 33.2 | 79.3 | 144.0 | 47.08 |
| Wanliu | 93.6 | 29.8 | 69.5 | 130.1 | 59.28 |
| Wanshouxigong | 91.2 | 26.0 | 68.0 | 128.0 | 47.13 |
| Yanqing | 72.0 | 20.0 | 49.5 | 102.0 | 111.24 |
| Yizhuang | 105.3 | 34.2 | 78.9 | 144.0 | 37.93 |
| Yongledian | 111.8 | 38.7 | 81.7 | 149.8 | 28.87 |
| Total | 90.0 | 25.2 | 65.0 | 125.5 | 59.13 |
Table 2.
Meteorological conditions in Beijing.
Table 2.
Meteorological conditions in Beijing.
| Meteorological Conditions | Mean | P25 | Median | P75 |
|---|
| Temperature (°C) | 13.4 | 3.2 | 14.3 | 23.7 |
| Humid (%) | 53 | 38 | 53 | 68 |
| Atmospheric pressure (hPa) | 1012.5 | 1004.2 | 1012.7 | 1021.1 |
| Wind speed (m/s) | 2.1 | 1.5 | 1.9 | 2.5 |
| Hours of light (h) | 6.5 | 2.4 | 7.8 | 9.6 |
| Rain volume (mm)
* | 15.6 | - | - | - |
Figure 4.
Relationship between Y coordinate (distance to the south of the city) and log transformed PM2.5 concentrations at (a) all stations and (b) background stations.
Figure 4.
Relationship between Y coordinate (distance to the south of the city) and log transformed PM2.5 concentrations at (a) all stations and (b) background stations.
Table 3.
Parameters of dispersion model for PM2.5 concentrations.
Table 3.
Parameters of dispersion model for PM2.5 concentrations.
| Parameter | Value |
|---|
| k1 | 0.7553 |
| k2 | 31.6683 |
| k3 | 0.2079 |
| k4 | 14.8340 |
| k5 | 0.1591 |
| Root-mean-square error | 43.4203 |
| R | 0.7981 |
| R-square | 0.6370 |
| Coefficient of determination (adjusted) | 0.6171 |
Based on Equation (6), the road traffic contribution to PM
2.5 concentration of the background stations is shown in
Table 4. The contributions ranged from 17.2% in Yungang to 25.3% in Zhiwuyuan.
Table 4.
Contribution (%) of road traffic to PM2.5 concentrations of background stations.
Table 4.
Contribution (%) of road traffic to PM2.5 concentrations of background stations.
| Station | Mean (%) | 95% Confidence Interval (%) |
|---|
| Badaling | 20.5 | (18.7, 22.2) |
| Beibuxinqu | 19.6 | (18.1, 21.1) |
| Dingling | 20.9 | (19.2, 22.6) |
| Miyunshuiku | 21.8 | (19.5, 24.1) |
| Yungang | 17.2 | (15.5, 18.8) |
| Zhiwuyuan | 25.3 | (23.3, 27.3) |
The estimations of parameters and the approximate test of smoothing of GAMM are shown in
Table 5 and
Table 6. All coefficients of the linear components and the smooth terms are significant at α = 0.05 level. The result is also in line with the fact that increasing pollution dilution was expected to be associated with greater wind speed and rain volume. According to Yu
et al. [
30], average PM
2.5 concentration during the days with wind speed higher than 2 m/s was 13% lower than those during the days with weaker wind. Average PM
2.5 concentration during the rainy days was 21% lower than those during the days without rain. But it is interesting that hours of daylight were negatively associated with the PM
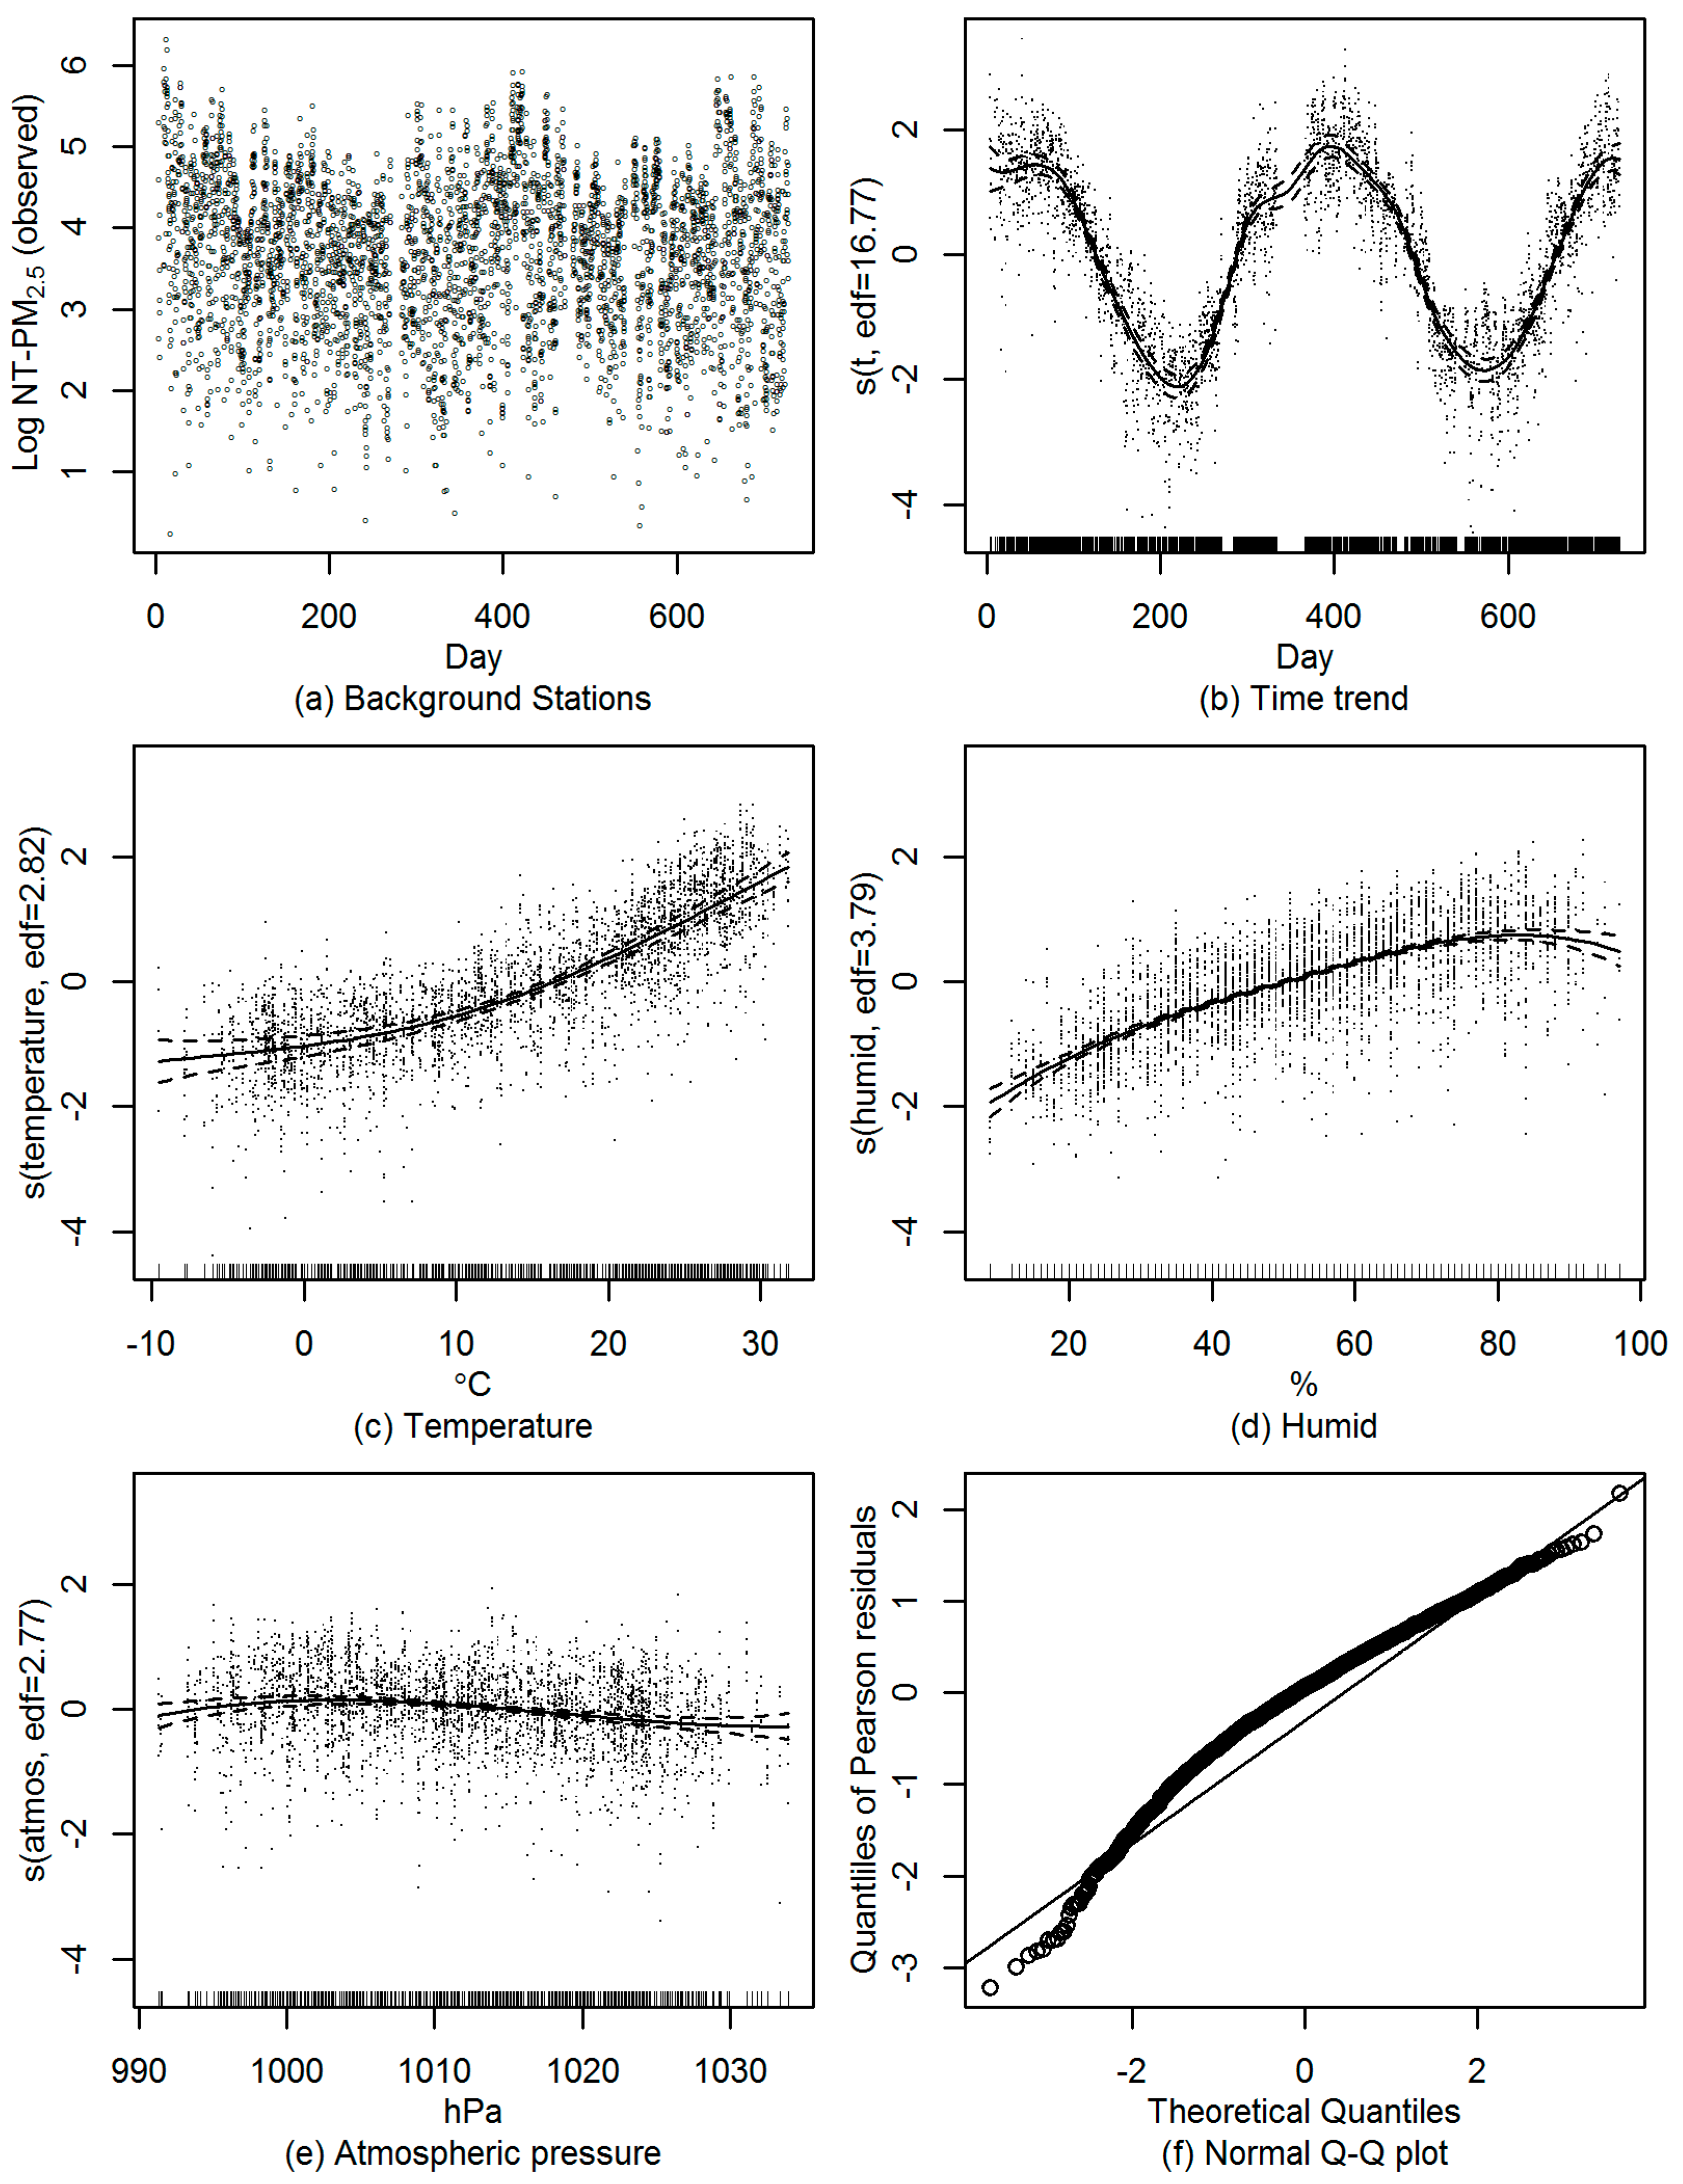
2.5 concentration. This may be partly due to low dispersion rate during days with fewer daylight hours (usually in hazy and cloudy days) and accelerated accumulation of pollutants. The partial regression smooth plots (
Figure 5b–e) and normal Q-Q plot of Pearson residual (
Figure 5f) showed a good fit of GAMM. Based on Equation (9), the traffic contribution to PM
2.5 concentration of other stations is shown in
Table 7. The absolute and relative contributions of road traffic to PM
2.5 concentrations of all stations were summarized in
Figure 6. The average annual contribution of road traffic to PM
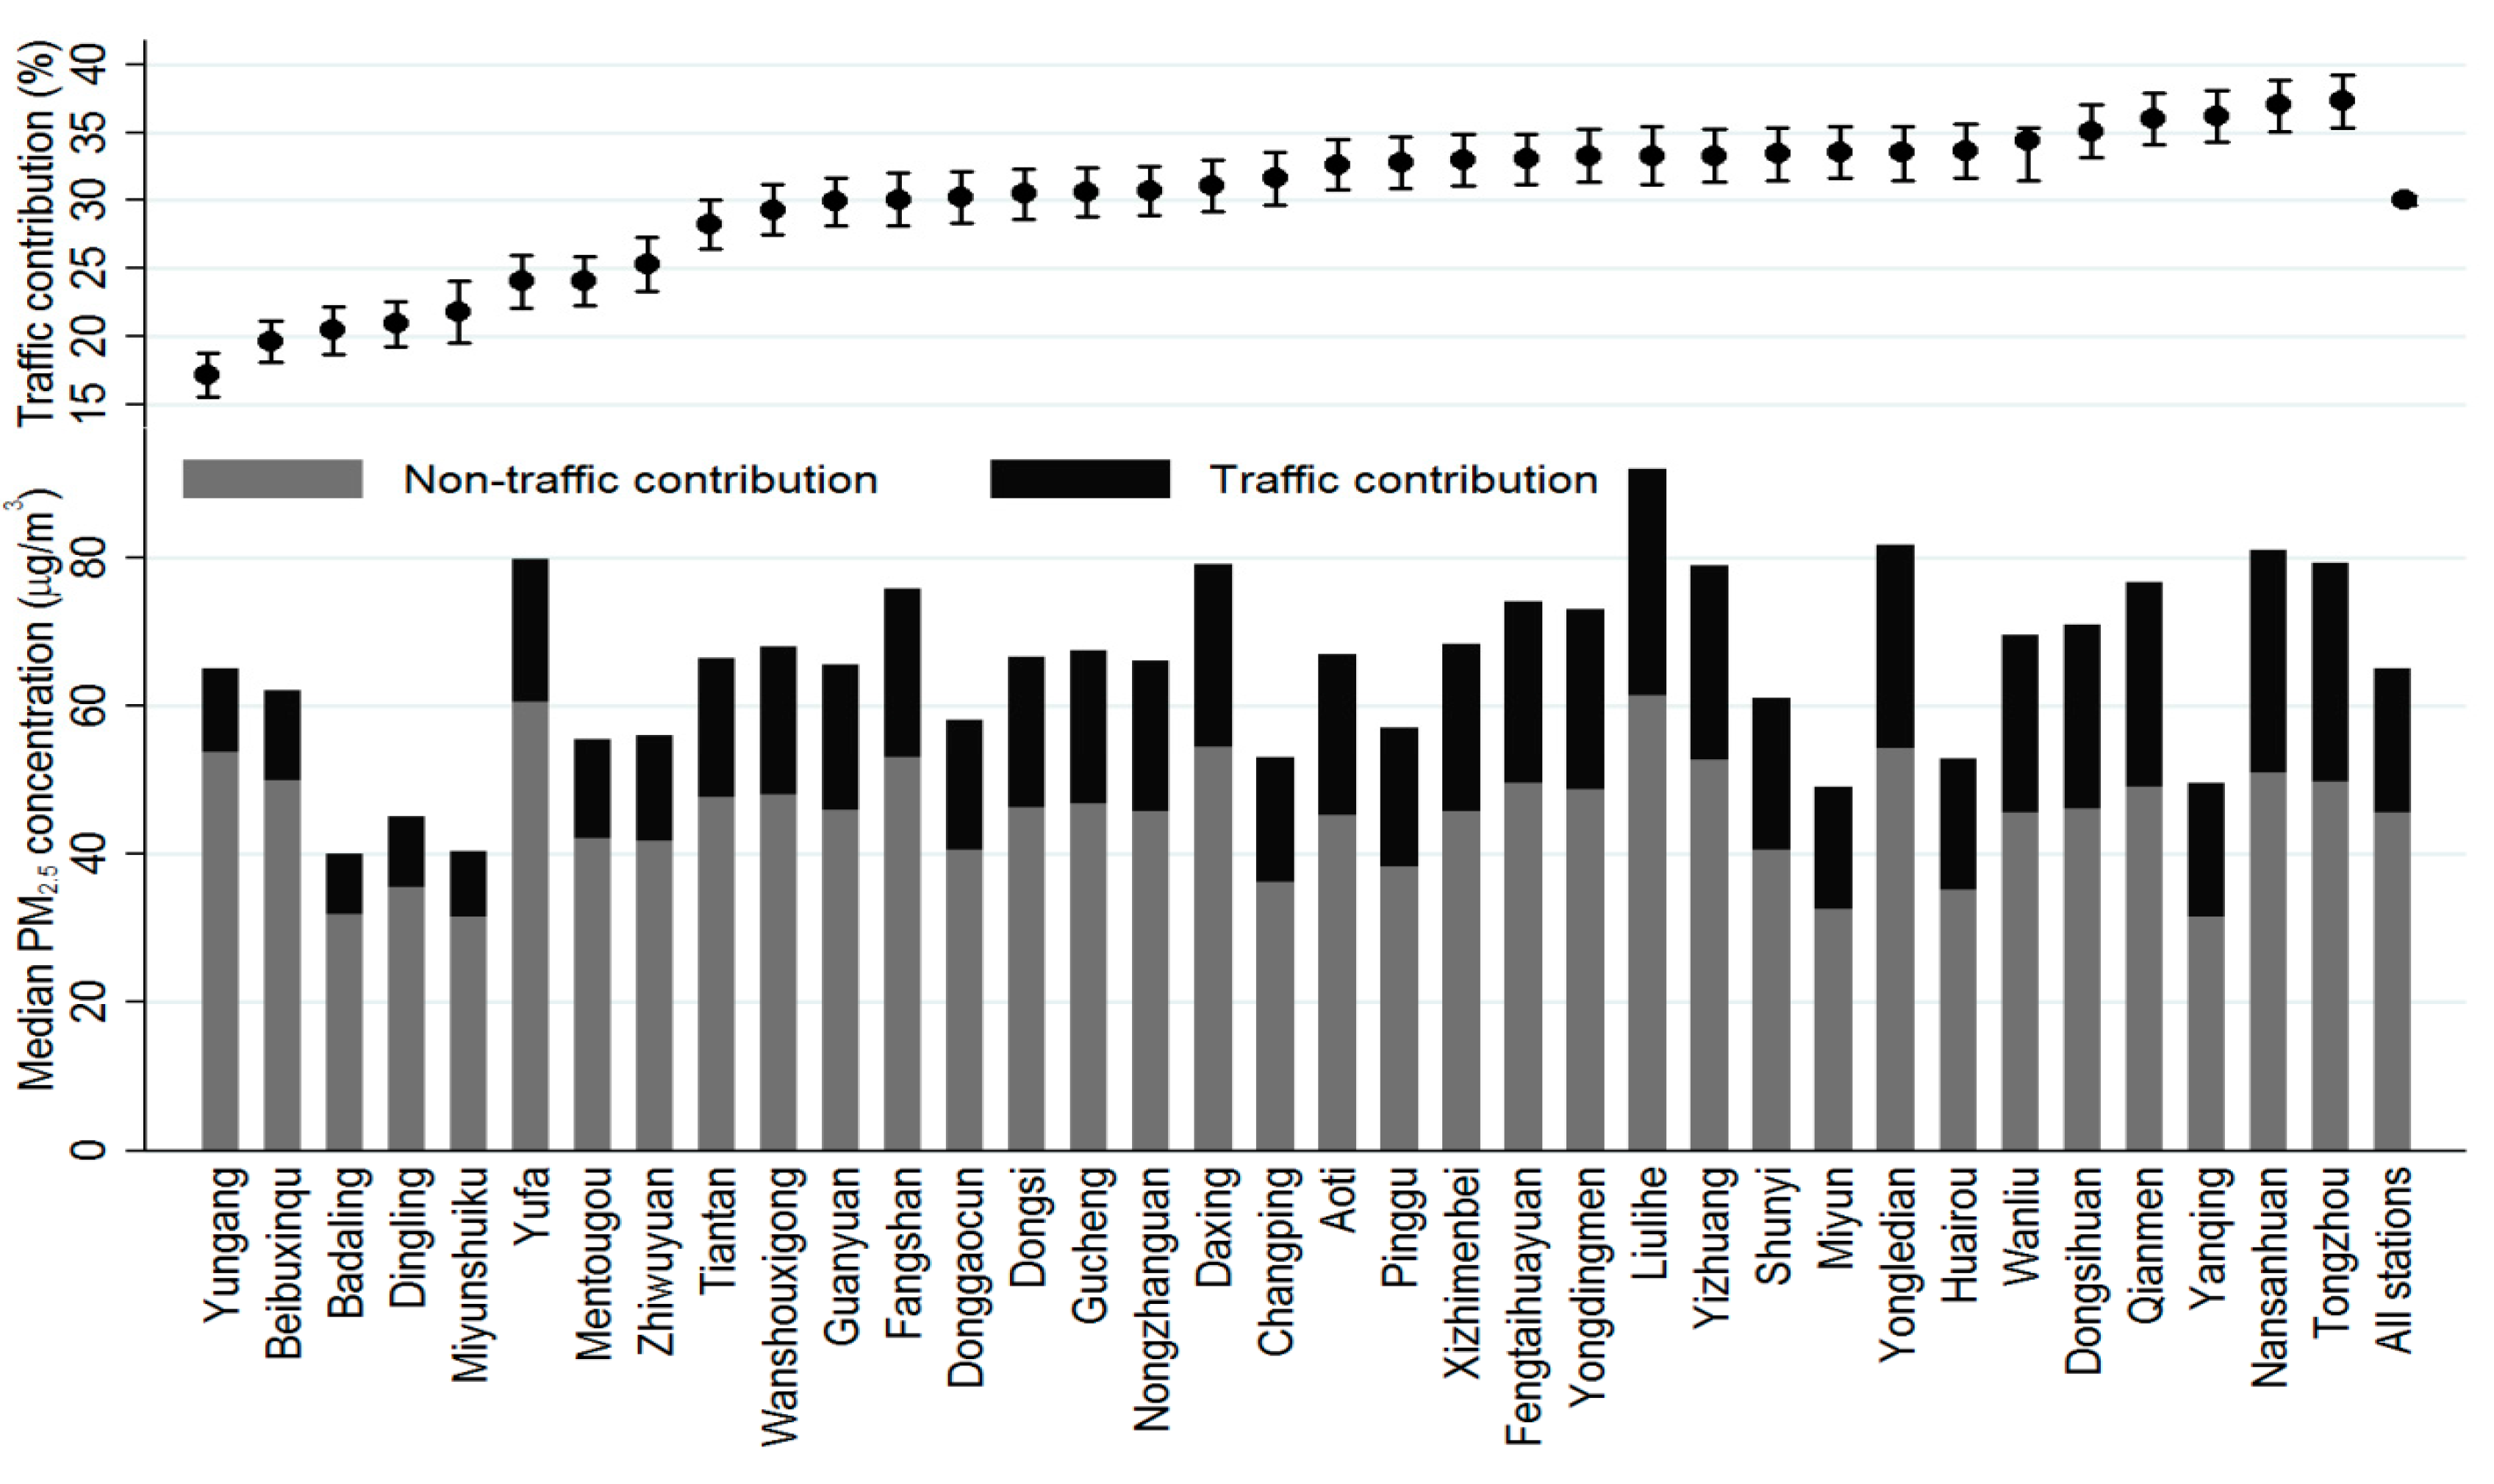
2.5 concentration ranged from 17.2% to 37.3% with a mean contribution 30%. The highest contribution was found in busy road areas, and the contribution in traffic-related stations is about 14% higher than those in rural areas.
Because there were no PM2.5 values lower than one-tenth of the 25% percentile and only 5% values were higher than 10 times the 75% percentile, the estimated contributions changed little when including these abnormal values in sensitivity analysis (results not shown).
Table 5.
Parametric coefficients of GAMM (n = 3593).
Table 5.
Parametric coefficients of GAMM (n = 3593).
| Independent Variable | Estimate | Std. Error | t Value | 95% Confidence Interval |
|---|
| (Intercept)
*** | 4.5353 | 0.1544 | 29.374 | (4.2327, 4.8380) |
| Y coordinate
*** | −0.0063 | 0.0017 | −3.817 | (−0.0096, −0.0031) |
| Wind direction(2)
* | 0.1358 | 0.0646 | 2.103 | (0.0092, 0.2624) |
| Wind direction(3) | 0.0246 | 0.0534 | 0.461 | (−0.0801, 0.1294) |
| Wind direction(4) | −0.0537 | 0.0617 | −0.871 | (−0.1746, 0.0672) |
| Wind direction(5) | 0.0795 | 0.0719 | 1.106 | (−0.0614. 0.2203) |
| Wind direction(6) | −0.0738 | 0.0697 | −1.059 | (−0.2103, 0.0627) |
| Wind direction(7)
* | −0.2143 | 0.0905 | −2.369 | (−0.3917, −0.0370) |
| Wind direction(8) | 0.1302 | 0.1006 | 1.294 | (−0.0669, 0.3272) |
| Wind direction(9) | 0.0547 | 0.0611 | 0.895 | (−0.0651, 0.1745) |
| Wind direction(10)
** | 0.1480 | 0.0520 | 2.845 | (0.0460, 0.2499) |
| Wind direction(11)
*** | 0.2080 | 0.0507 | 4.103 | (0.1086, 0.3073) |
| Wind direction(12)
** | 0.2481 | 0.0805 | 3.084 | (0.0904, 0.4059) |
| Wind direction(13) | 0.0634 | 0.0928 | 0.684 | (−0.1184, 0.2453) |
| Wind direction(14)
* | 0.1632 | 0.0678 | 2.408 | (0.0304, 0.2960) |
| Wind direction(15) | 0.1002 | 0.0688 | 1.456 | (−0.0347, 0.2351) |
| Wind direction(16)
** | 0.1788 | 0.0601 | 2.976 | (0.0611, 0.2965) |
| Day of week (2) | −0.0007 | 0.0405 | −0.017 | (−0.0800, 0.0786) |
| Day of week (3) | 0.0186 | 0.0395 | 0.472 | (−0.0587, 0.0960) |
| Day of week (4) | −0.0009 | 0.0410 | −0.023 | (−0.0813, 0.0794) |
| Day of week (5) | 0.0445 | 0.0408 | 1.091 | (−0.0354, 0.1244) |
| Day of week (6) | 0.0558 | 0.0400 | 1.396 | (−0.0226, 0.1342) |
| Day of week (7) | −0.0366 | 0.0409 | −0.894 | (−0.1168, 0.0437) |
| Wind speed
* | −0.0402 | 0.0175 | −2.290 | (−0.0746, −0.0058) |
| Hour of light
*** | −0.0558 | 0.0039 | −14.404 | (−0.0633, −0.0482) |
| Rain volume
*** | −0.0012 | 0.0002 | −6.406 | (−0.0015, −0.0008) |
Table 6.
Approximate significance of smooth terms.
Table 6.
Approximate significance of smooth terms.
| | Effective Degree of Freedom (EDF) | F |
|---|
| s(t) *** | 16.771 | 64.34 |
| s(temperature) *** | 2.816 | 99.28 |
| s(humid) *** | 3.787 | 263.91 |
| s(atmos) *** | 2.767 | 13.77 |
Figure 5.
Diagnostic plots of GAMM on non-traffic PM2.5 concentrations at background stations: (a) time trend of log transformed non-traffic PM2.5 concentrations; (b) partial regression smooth curve of day with residuals; (c) partial regression smooth curve of temperature with residuals; (d) partial regression smooth curve of humid with residuals; (e) partial regression smooth curve of atmospheric pressure with residuals; (f) Q-Q plot of Pearson residuals.
Table 7.
Contribution (%) of road traffic to PM2.5 concentrations of other stations.
Table 7.
Contribution (%) of road traffic to PM2.5 concentrations of other stations.
| Station | Mean (%) | 95% Confidence Interval (%) |
|---|
| Aoti | 32.6 | (30.8, 34.5) |
| Changping | 31.6 | (29.7, 33.5) |
| Daxing | 31.1 | (29.2, 33.0) |
| Donggaocun | 30.2 | (28.3, 32.1) |
| Dongsi | 30.5 | (28.6, 32.3) |
| Dongsihuan | 35.1 | (33.2, 37.0) |
| Fangshan | 30.0 | (28.1, 32.0) |
| Fengtaihuayuan | 33.1 | (31.2, 34.9) |
| Guanyuan | 29.9 | (28.1, 31.6) |
| Gucheng | 30.6 | (28.8, 32.4) |
| Huairou | 33.6 | (31.6, 35.6) |
| Liulihe | 33.3 | (31.2, 35.4) |
| Mentougou | 24.1 | (22.3, 25.9) |
| Miyun | 33.5 | (31.6, 35.4) |
| Nansanhuan | 37.0 | (35.1, 38.8) |
| Nongzhanguan | 30.7 | (28.9, 32.5) |
| Pinggu | 32.8 | (30.9, 34.7) |
| Qianmen | 36.0 | (34.1, 37.9) |
| Shunyi | 33.4 | (31.5, 35.3) |
| Tiantan | 28.2 | (26.4, 30.0) |
| Tongzhou | 37.3 | (35.3, 39.2) |
| Wanliu | 34.4 | (32.6, 36.2) |
| Wanshouxigong | 29.3 | (27.5, 31.2) |
| Xizhimenbei | 33.0 | (31.1, 34.9) |
| Yanqing | 36.2 | (34.3, 38.1) |
| Yizhuang | 33.3 | (31.4, 35.2) |
| Yongdingmen | 33.3 | (31.5, 35.2) |
| Yongledian | 33.5 | (31.5. 35.4) |
| Yufa | 24.1 | (22.1, 26.0) |
| All stations
* | 30.0 | (29.7, 30.3) |
Figure 6.
Contribution (%) of road traffic to median PM2.5 concentrations by stations in Beijing, 2013–2014.
Figure 6.
Contribution (%) of road traffic to median PM2.5 concentrations by stations in Beijing, 2013–2014.
4. Discussion
Exhaust emissions due to road traffic are known to make a large contribution to total PM
2.5 concentrations in urban areas [
32,
33,
34,
35] and exposure to PM
2.5 from vehicular emissions has been demonstrated to have a negative impact on human health [
36,
37,
38,
39,
40]. An improved understanding of the traffic-related contribution to PM
2.5 is therefore vital for conducting source apportionment and health effect studies. Due to rapid economic and industrial development and urbanization in the past few decades, energy consumption and the number of motor vehicles are rapidly escalating in China [
41]. As the capital of China, Beijing has witnessed a devastating increase in air pollution in the past decades. To develop effective PM
2.5 reduction strategies, major sources of PM
2.5 and contributions from each source need to be understood thoroughly. A recent study claimed that vehicles had limited contribution to atmospheric particulate pollution in Beijing [
42], and had since caused the public to question the governmental policy in limiting car use. The study presented PM
2.5 concentrations in all seasons in Beijing and concluded that vehicle emissions accounted for less than 4% of the total PM
2.5 [
42], much smaller than the previous estimates of the Chinese Environmental Protection Agency or as reported by other studies [
43,
44,
45,
46]. Other studies using the same data sources suggested however that vehicle contribution to PM
2.5 in Beijing could vary between 10% and 50% [
47,
48].
Quantifying traffic-related contribution to PM
2.5 requires the compilation of detailed traffic data according to time and space, including, for example, traffic counts, vehicle types, travel speeds, fuel types, and emission controls [
9]. Receptor models and air-quality dispersion models have been used to assess the contribution of different types of sources, including motor vehicles, to ambient pollution in urban and rural areas [
49]. Traditionally, source apportionment estimation methods [
50] such as chemical mass balance (CMB) [
51] or positive matrix factorization (PMF) have been applied to analyze the contribution of pollutant source. Air mass trajectory analysis is also a useful tool for detecting the direction and location of sources for various air pollutants as a PM
2.5 forecast model [
52]. However, these models heavily rely on the accuracy of source profile information. Some other models were also commonly used, mainly including source apportionment model [
53], land use regression model and Gaussian dispersion model [
54,
55,
56]. However, the limited numbers of roadside monitors have made it difficult to catch the geographical variation in motor-vehicle emissions. Resource requirements for collecting these data can be prohibitive and have led to the use of source-oriented dispersion based models [
57], meteorological-chemical transport based models [
58] and observation-based statistical models [
59].
In our study, we developed a two-stage method to estimate the traffic-related contribution to PM
2.5 concentration that utilized the air-quality data from different types of AQM stations. This method combined atmospheric chemistry dispersion model and statistical GAMM model, and simplified the mathematical algorithm by omitting the detailed traffic-related information, e.g., types, number and density of vehicles, and incorporated the temporal trend of PM
2.5 concentration in a more precise way. We collected hourly PM
2.5 data at 35 monitoring stations to estimate the road traffic contributions to PM
2.5 concentrations. The results revealed that 17.2%–37.3% of PM
2.5 might be attributable to traffic emissions. Compared to the results released by Beijing Municipal Environmental Protection Bureau (22%–30%) [
60], our reported contribution is higher and may partly be due to the rapid increase of traffic volume and decrease of industrial and coal burning emissions in recent years in Beijing [
61].
Usually, the estimation of traffic-related emission relies on the analysis of road side measurements correcting for background concentrations [
62]. In our study, we carefully defined the components of PM
2.5 concentration of background stations from two major sources,
i.e., traffic emission and industrial sources. Considering the complex components of the traffic related PM
2.5 source at the traffic stations and industrial stations, relative to the background stations, we modeled the non-traffic PM
2.5 concentration for all stations using GAMM. The results from previous studies using particulate matter source apportioning and Comprehensive Air Quality Model with Extensions (CAMx) revealed that the maximum level of uncertainty for secondary production was low (6%), hence the application of an additive linear relationship was considered reliable [
63,
64].
In our dispersion model, the coefficients determine the precision of the estimated traffic contribution to PM2.5. We made simulation using different settings for the purpose of sensitivity analysis. The results showed that a 20% deviation in would result in <7% change in the estimated traffic contribution. It indicated that our dispersion model was robust regarding the variation of the estimates of different parameters.
In order to avoid over-fitting or under-fitting, frequent in GAMM, we used penalized B-splines (P-splines). The P-spline approach controls the coefficients of the smooth function for which a certain penalty term is specified. In this approach, the crucial point is the selection of smoothing parameter. We tested the residual of the model and the scatter plots showed a clear homogeneity around smoothing curves with no specific trend (
Figure 5b–e). In our model, the geographical variations were efficiently explained by Y coordinators. A few meteorological variables were selected in the models as previously suggested [
65,
66,
67].
Our study has several strengths. First, most of the previous researches were performed in the United States or Europe, while reliable information from Africa, Asia and South America is lacking. Our study provides important evidence to fill in this information gap and offers an opportunity to develop enhanced methods for quantification of the contribution of traffic emission to air pollution. Second, the two-stage method predicted the background pollution instead of traffic emissions directly. In this case, the residual of the first dispersion model could be further decomposed in the GAMM and the unknown non-linear relationships and temporal autocorrelation were modeled using smoothing functions. Third, although existing dispersion models can give an approximate estimation of traffic emissions based on a big database, they need rich information in terms of vehicle types and fuels, traffic stop-and-go-driving situations, average speed and traffic density,
etc. [
68]. Moreover, the advanced Gaussian dispersion model also requires more complicated 3-dimensional meteorological and location information, making it unfeasible to adapt in less developed countries and regions. Our simplified dispersion model, on the other hand, needs less traffic and geographic data and applies simpler estimation algorithm, and therefore increases flexibility and feasibility of usage. In such context, it is a convenient tool on operational basis for estimating traffic contribution to PM
2.5 over a region with moderate number of AQM stations. Lastly, because of the limited number of AQM stations available, previous estimates of traffic contribution to PM
2.5 were mainly based on GAM that might not precisely reflect the variation between stations and correlation within stations in areas with various land use types [
69]. The results of such studies were consequently very sensitive to the location of monitoring stations. However, the use of widespread AQM stations and intensive air quality data collected in our study made it possible to involve the different type of stations as a random factor in the mixed effect model that may sufficiently reflect the variation of contribution over a wide region.
Our study also had some limitations. Given the complexity of pollution sources and dynamic dispersion mechanisms, our simplified dispersion model only took into account industrial and traffic emissions, whereas it combined all other pollution sources as a whole. As a result, our method might have led to an overestimation of the traffic contribution. Although we examined the influence of daily average vehicle speed on PM
2.5 concentrations at five traffic stations and found no statistically significant association, this variable was not included in the GAMM since such information was not available for other stations. Finally, we did not consider some indirect sources from vehicles, such as tire type and asphalt roads that may also increase PM
2.5 concentration [
70]. Future efforts are needed to compare methods using direct traffic emission measurements with our simplified indirect method. We also admit that the predictability of our models is not high and the accuracy of the estimated contributions needs to be assessed by further studies.


