
Removal Efficiency of Faecal Indicator Organisms, Nutrients and Heavy Metals from a Peri-Urban Wastewater Treatment Plant in Thohoyandou, Limpopo Province, South Africa


Abstract
:1. Introduction
2. Experimental Section
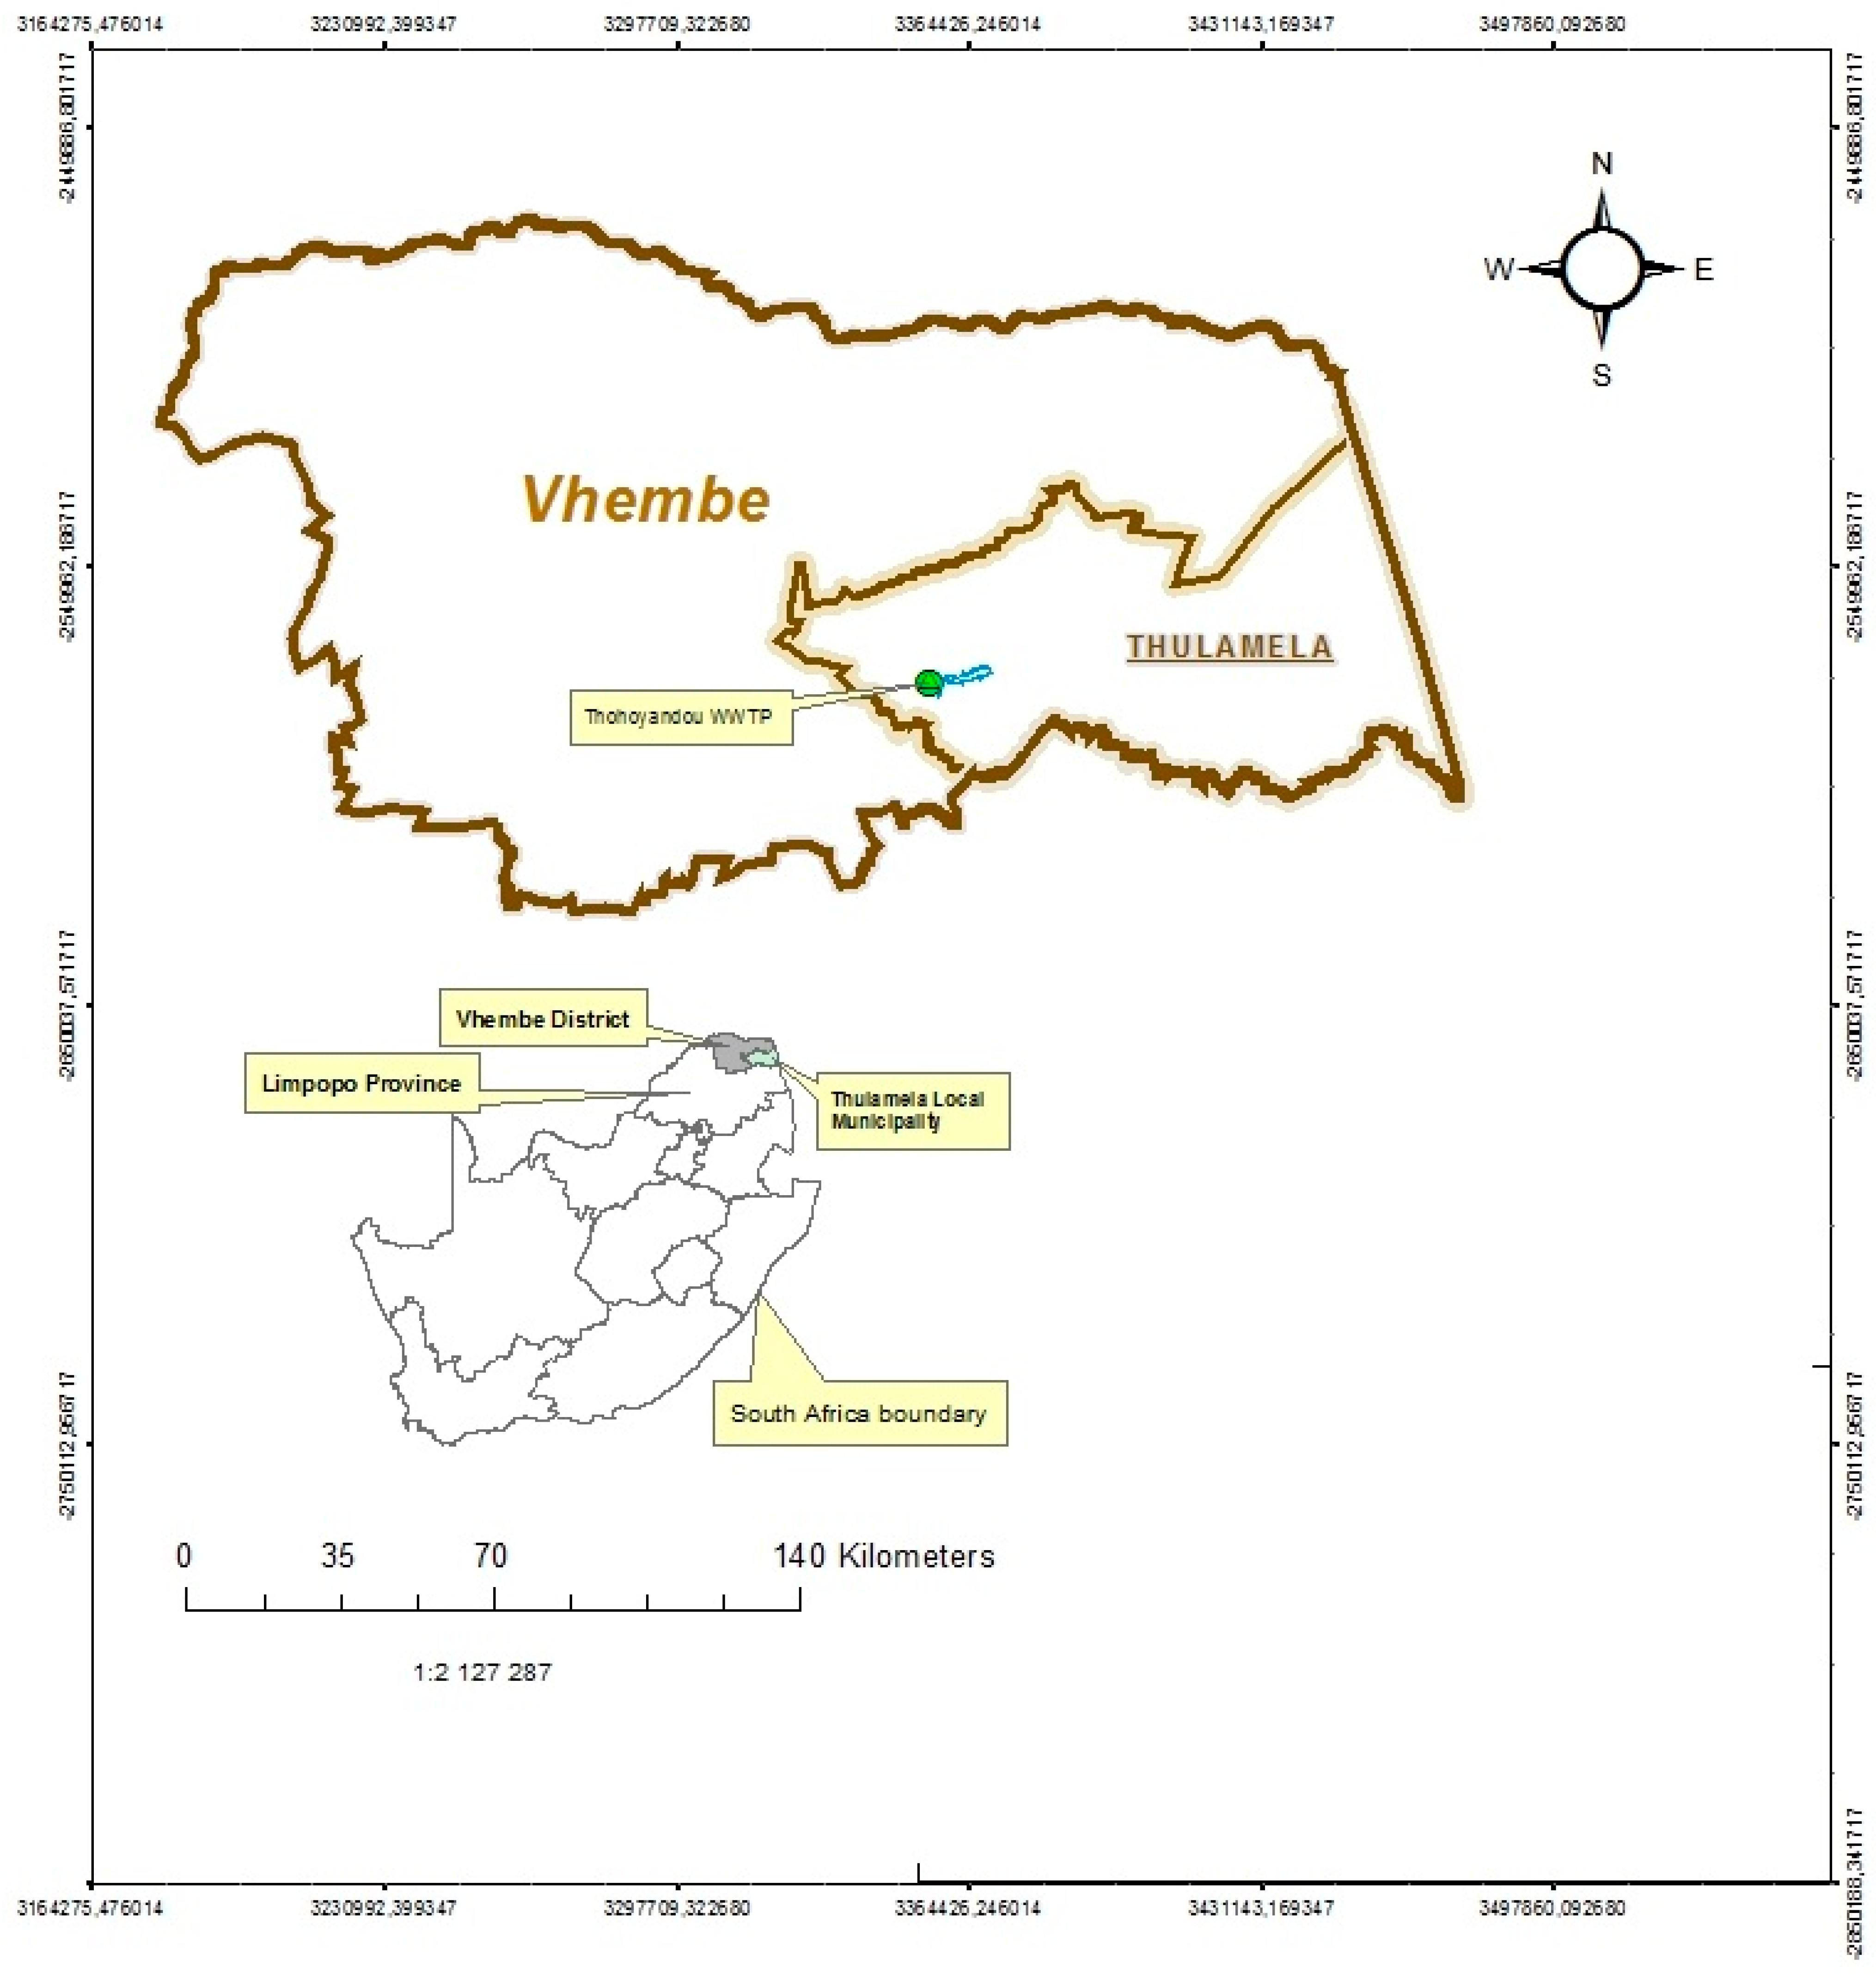
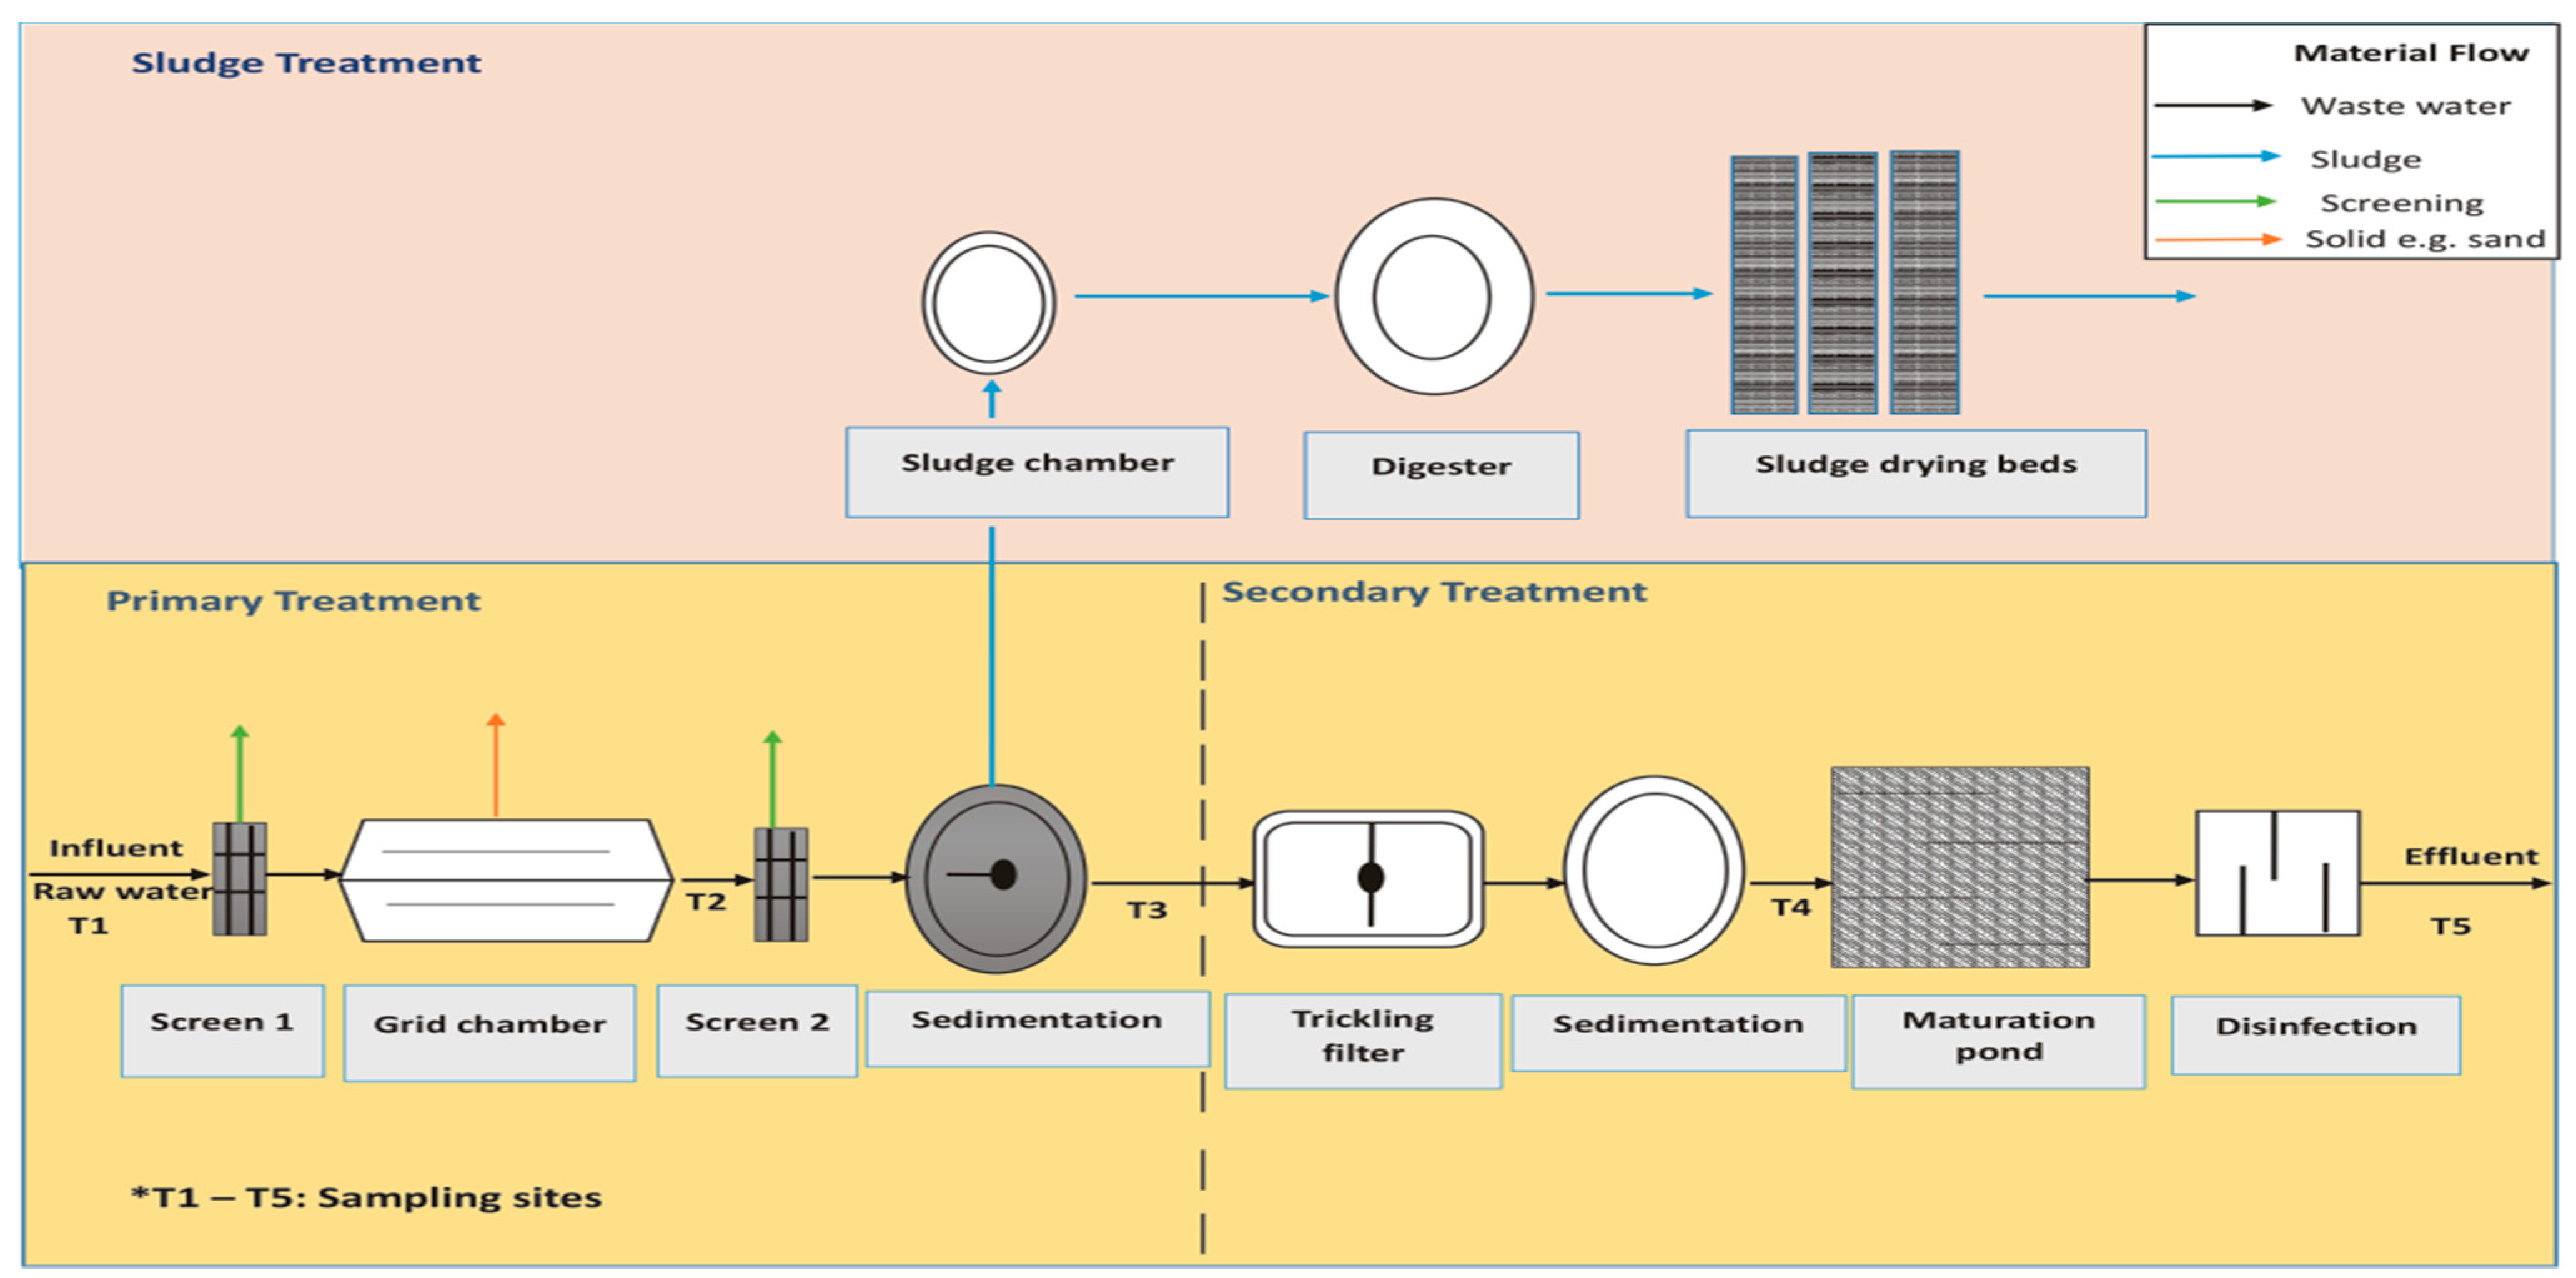
2.1. Plant Description and Study Site
2.2. Sample Collection and Field Measurements
2.3. Chemical Oxygen Demand (COD) Measurement
2.4. Analysis of Microbiological Parameters
2.5. Anion Analysis
2.6. Digestion and Analysis of Water Samples
2.7. Analysis of Heavy Metals
2.8. Compliance Study and Calculation of Percentage Reduction Efficiencies
3. Results and Discussion
3.1. Effect of Sample pH
3.2. Electrical Conductivity

| Parameters | Influent | After screening and lime addition | After primary sedimentation | After secondary sedimentation | Effluent | % Reduction |
|---|---|---|---|---|---|---|
| pH January | 7.1 | 7.0 | 6.9 | 7.4 | 7.2 | NA |
| pH February | 7.6 | 7.4 | 7.3 | 7.2 | 7.1 | NA |
| pH March | 7.7 | 7.3 | 7.2 | 7.2 | 7.2 | NA |
| pH April | 6.9 | 6.8 | 6.9 | 6.8 | 7.2 | NA |
| pH May | 7.2 | 7.3 | 7.3 | 7.5 | 7.4 | NA |
| pH June | 7.3 | 7.5 | 7.4 | 7.4 | 7.5 | NA |
| EC January | 32.3 | 30.7 | 29.1 | 32.3 | 34.0 | - |
| EC February | 35.7 | 37.0 | 43.0 | 35.1 | 35.8 | - |
| EC March | 44.2 | 44.9 | 48.3 | 42.8 | 39.7 | 10 |
| EC April | 60.4 | 63.4 | 66.7 | 46.2 | 39.9 | 34 |
| EC May | 58.2 | 58.7 | 61.1 | 47.9 | 43.1 | 26 |
| EC June | 136.8 | 139.2 | 154.8 | 121.3 | 125.3 | 8 |
| T January | 56.7 | 48.6 | 85.8 | 6.2 | 4.8 | 92 |
| T February | 52.9 | 49.3 | 60.1 | 14.0 | 7.2 | 86 |
| T March | 90.5 | 133.5 | 73.0 | 24 | 10.1 | 89 |
| T April | 114.9 | 125.5 | 68.2 | 14.8 | 6.4 | 94 |
| T May | 180.8 | 134 | 88.5 | 30.2 | 14.6 | 92 |
| T June | 62.6 | 110.6 | 35.7 | 6.0 | 4.3 | 93 |
3.3. Turbidity
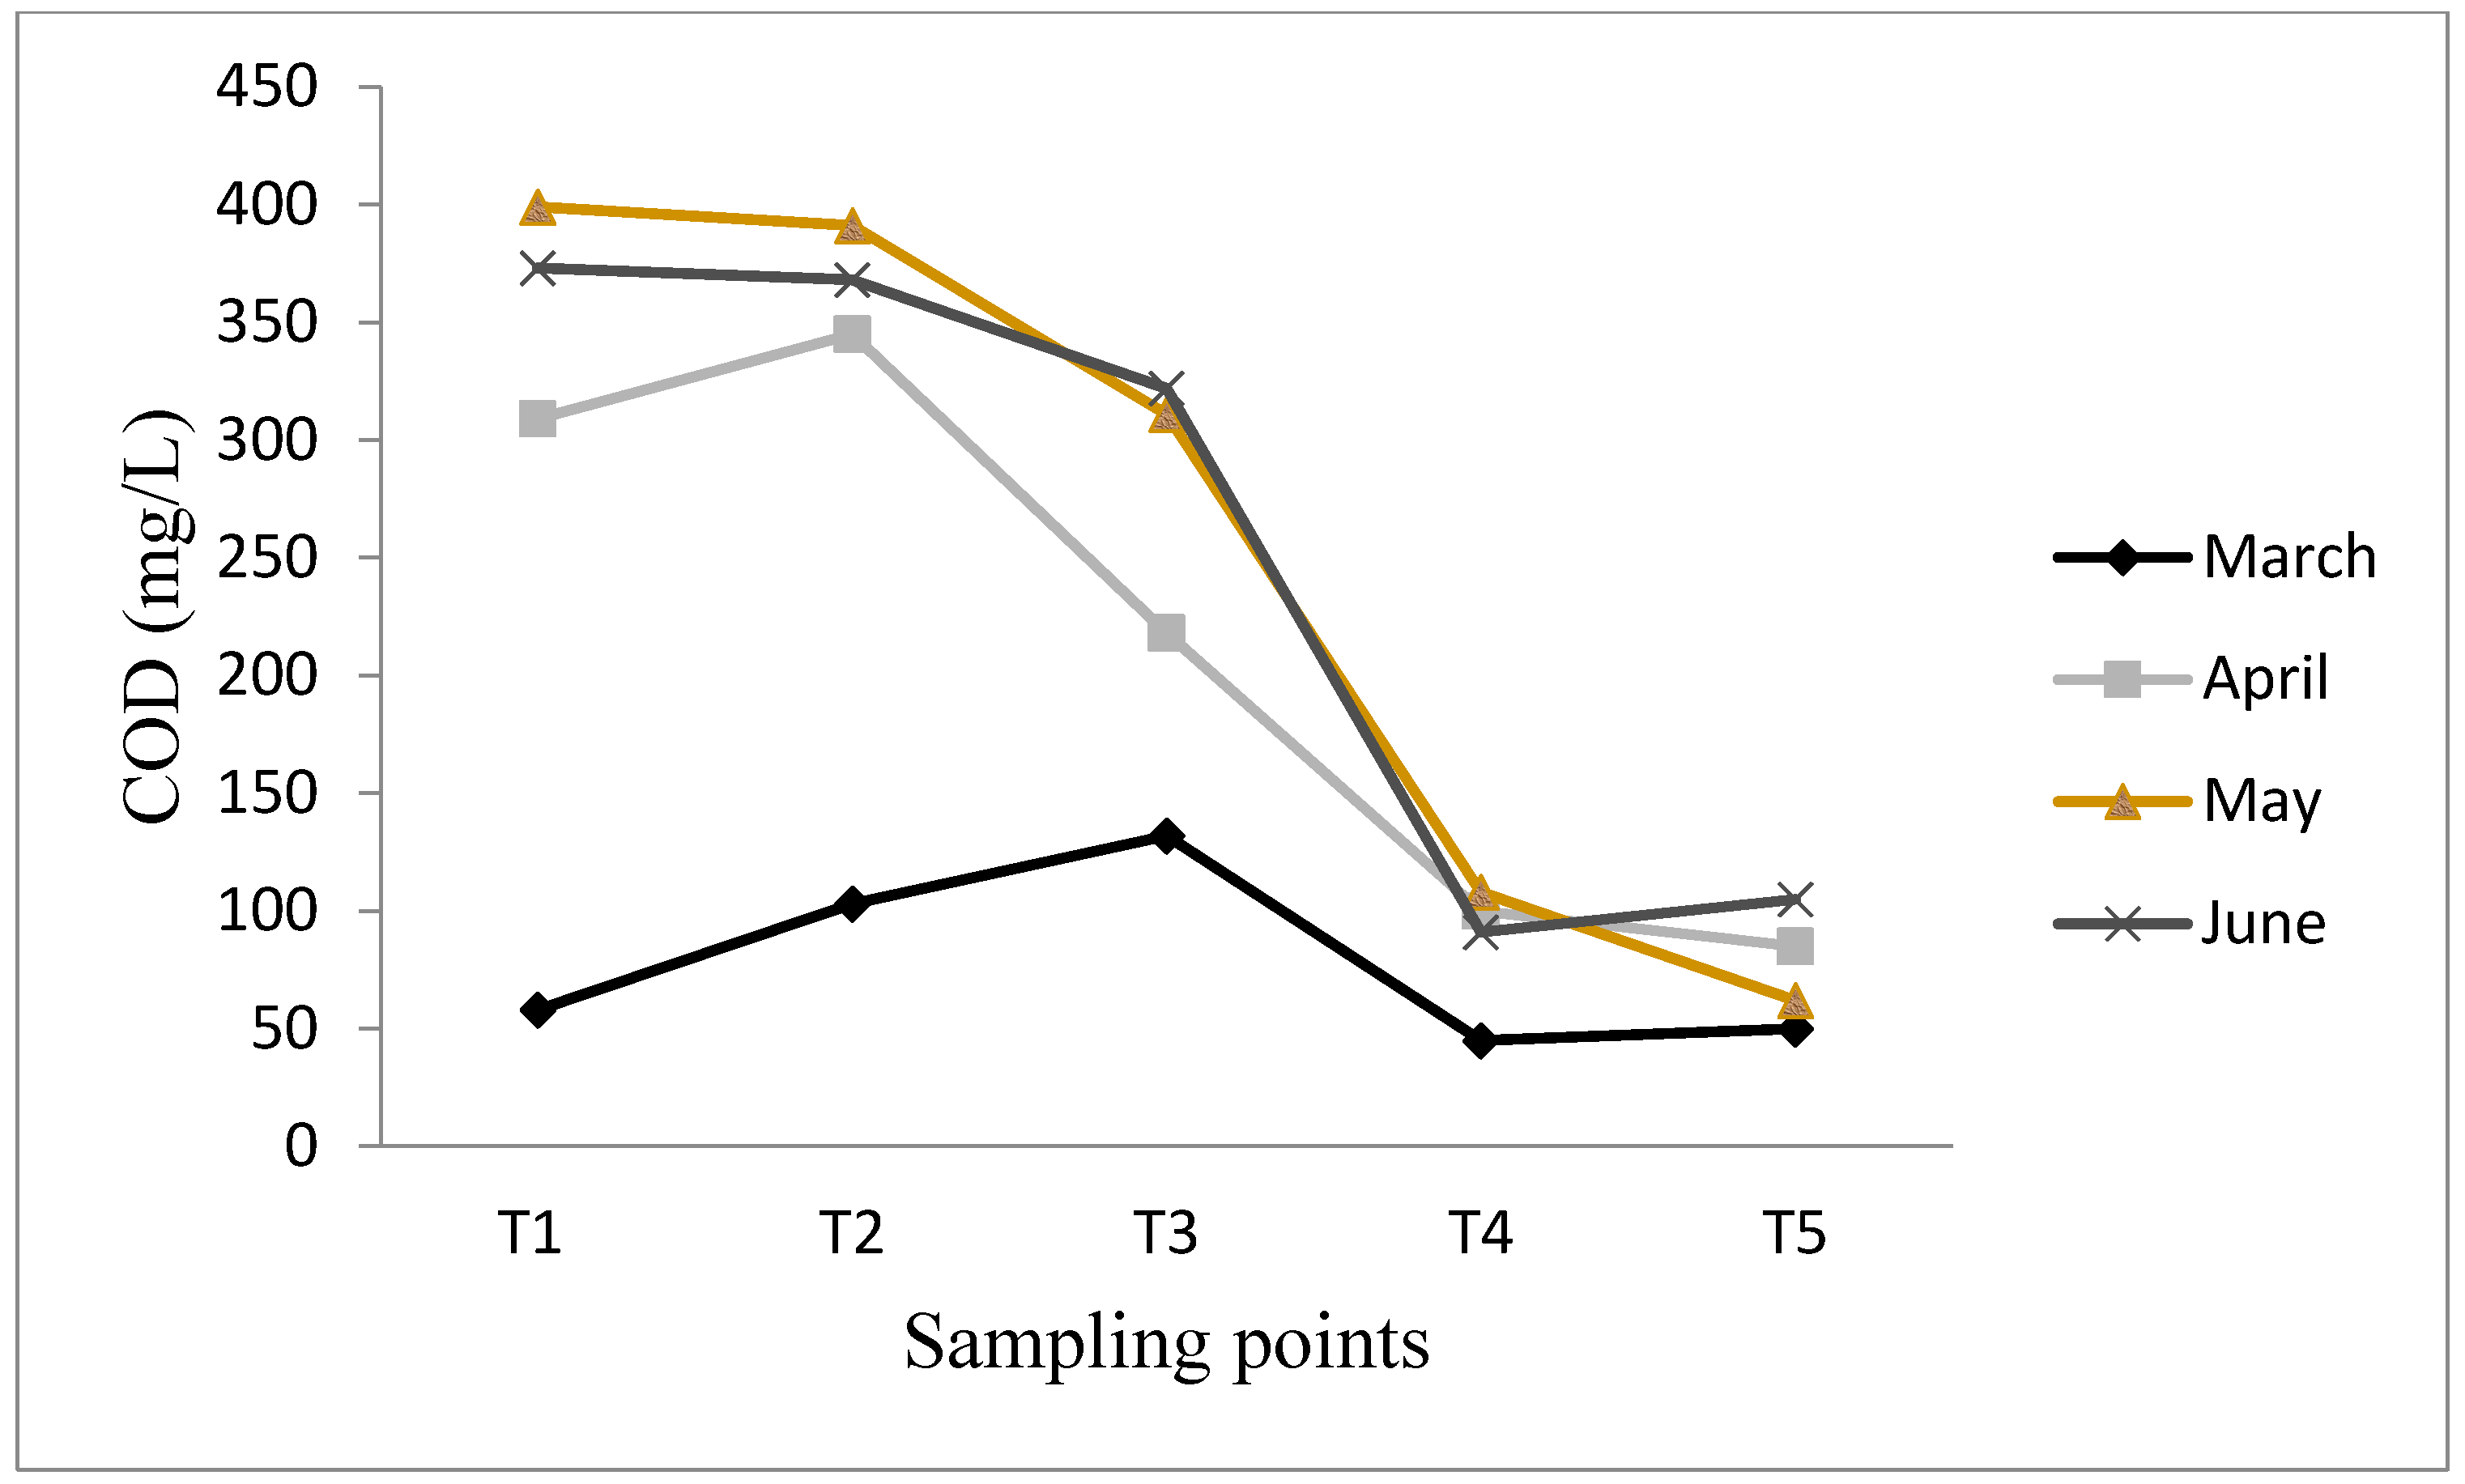
3.4. Chemical Oxygen Demand (COD)
3.5. Concentrations of Anions in the Samples
| Anion concentration (mg/L) | Influent | After screening and lime addition | After primary sedimentation | After secondary sedimentation | Effluent | % Reduction |
|---|---|---|---|---|---|---|
| Fluoride January | 0.152 | 0.140 | 0.146 | 0.145 | 0.143 | 6 |
| Fluoride February | 0.244 | 0.030 | 0.031 | 0.143 | 0.195 | 20 |
| Fluoride March | 0.181 | 0.186 | 0.030 | 0.186 | 0.181 | - |
| Fluoride April | 0.167 | 1.333 | 1.155 | 1.484 | 1.562 | - |
| Fluoride May | 0.051 | 0.051 | 0.066 | 0.063 | 0.344 | - |
| Fluoride June | 1.269 | 0.193 | 0.182 | 0.053 | 0.102 | 92 |
| Chloride January | 18.933 | 15.090 | 13.584 | 14.035 | 15.293 | 19 |
| Chloride February | 25.963 | 25.247 | 28.770 | 25.085 | 25.570 | 2 |
| Chloride March | 38.870 | 38.650 | 36.220 | 31.880 | 28.020 | 28 |
| Chloride April | 50.765 | 47.659 | 43.478 | 53.755 | 56.524 | - |
| Chloride May | 41.024 | 28.534 | 29.092 | 27.008 | 31.151 | 24 |
| Chloride June | 51.971 | 60.365 | 63.066 | 57.318 | 49.116 | 6 |
| NO3- as N January | 0.674 | 0.663 | 0.910 | 14.089 | 14.078 | - |
| NO3- as N February | 0.994 | 0.962 | 1.748 | 13.293 | 7.545 | - |
| NO3- as N March | 2.310 | 3.230 | 1.100 | 17.030 | 12.010 | - |
| NO3- as N April | 0.546 | 2.668 | 3.651 | 8.5170 | 16.398 | - |
| NO3- as N May | 0.499 | 0.787 | 7.211 | 80.961 | 19.413 | - |
| NO3- as N June | 0.978 | 1.220 | 0.122 | 146.72 | 12.367 | - |
| PO43- as P January | 0.552 | 0.685 | 0.665 | 1.387 | 1.572 | - |
| PO43- as P February | 1.220 | 1.240 | 2.970 | 2.700 | 2.220 | - |
| PO43- as P March | 2.330 | 1.960 | 2.730 | 3.270 | 2.940 | - |
| PO43- as P April | 4.388 | 5.379 | 9.136 | 3.745 | 4.836 | - |
| PO43- as P May | 4.265 | 4.085 | 5.295 | 10.489 | 3.255 | 24 |
| PO43- as P June | 2.635 | 2.897 | 2.920 | 2.947 | 2.500 | 5 |
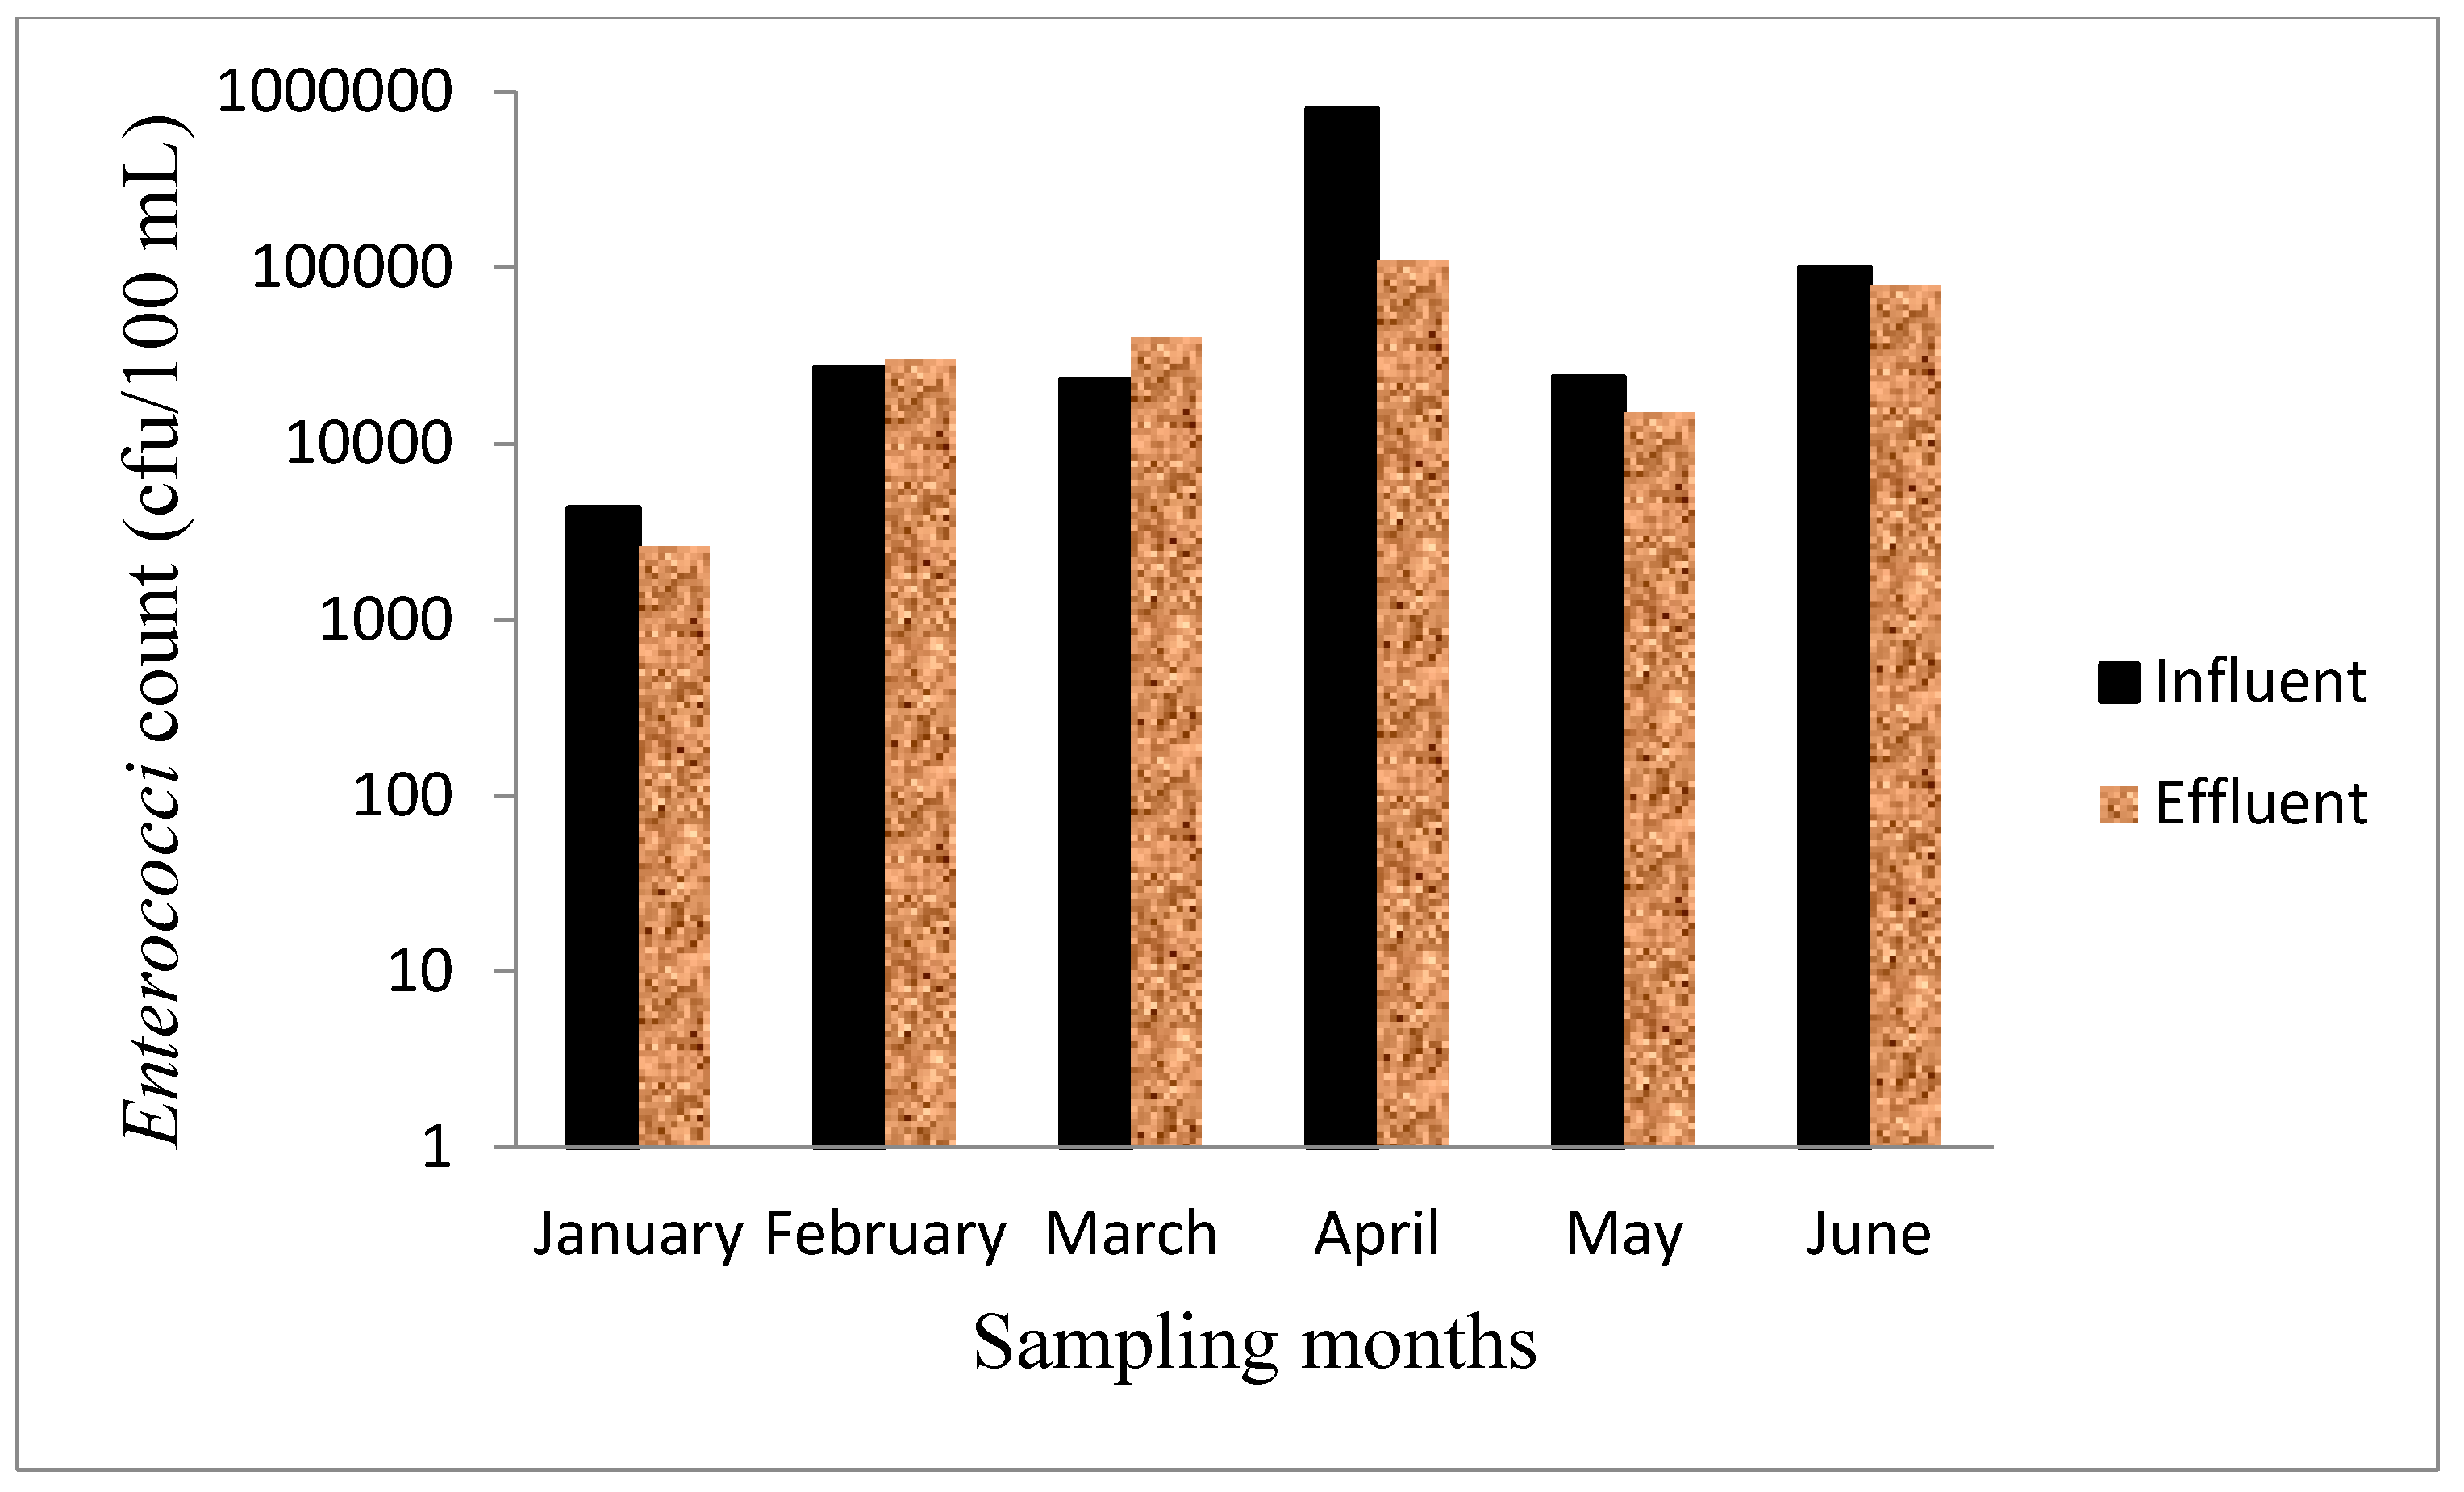
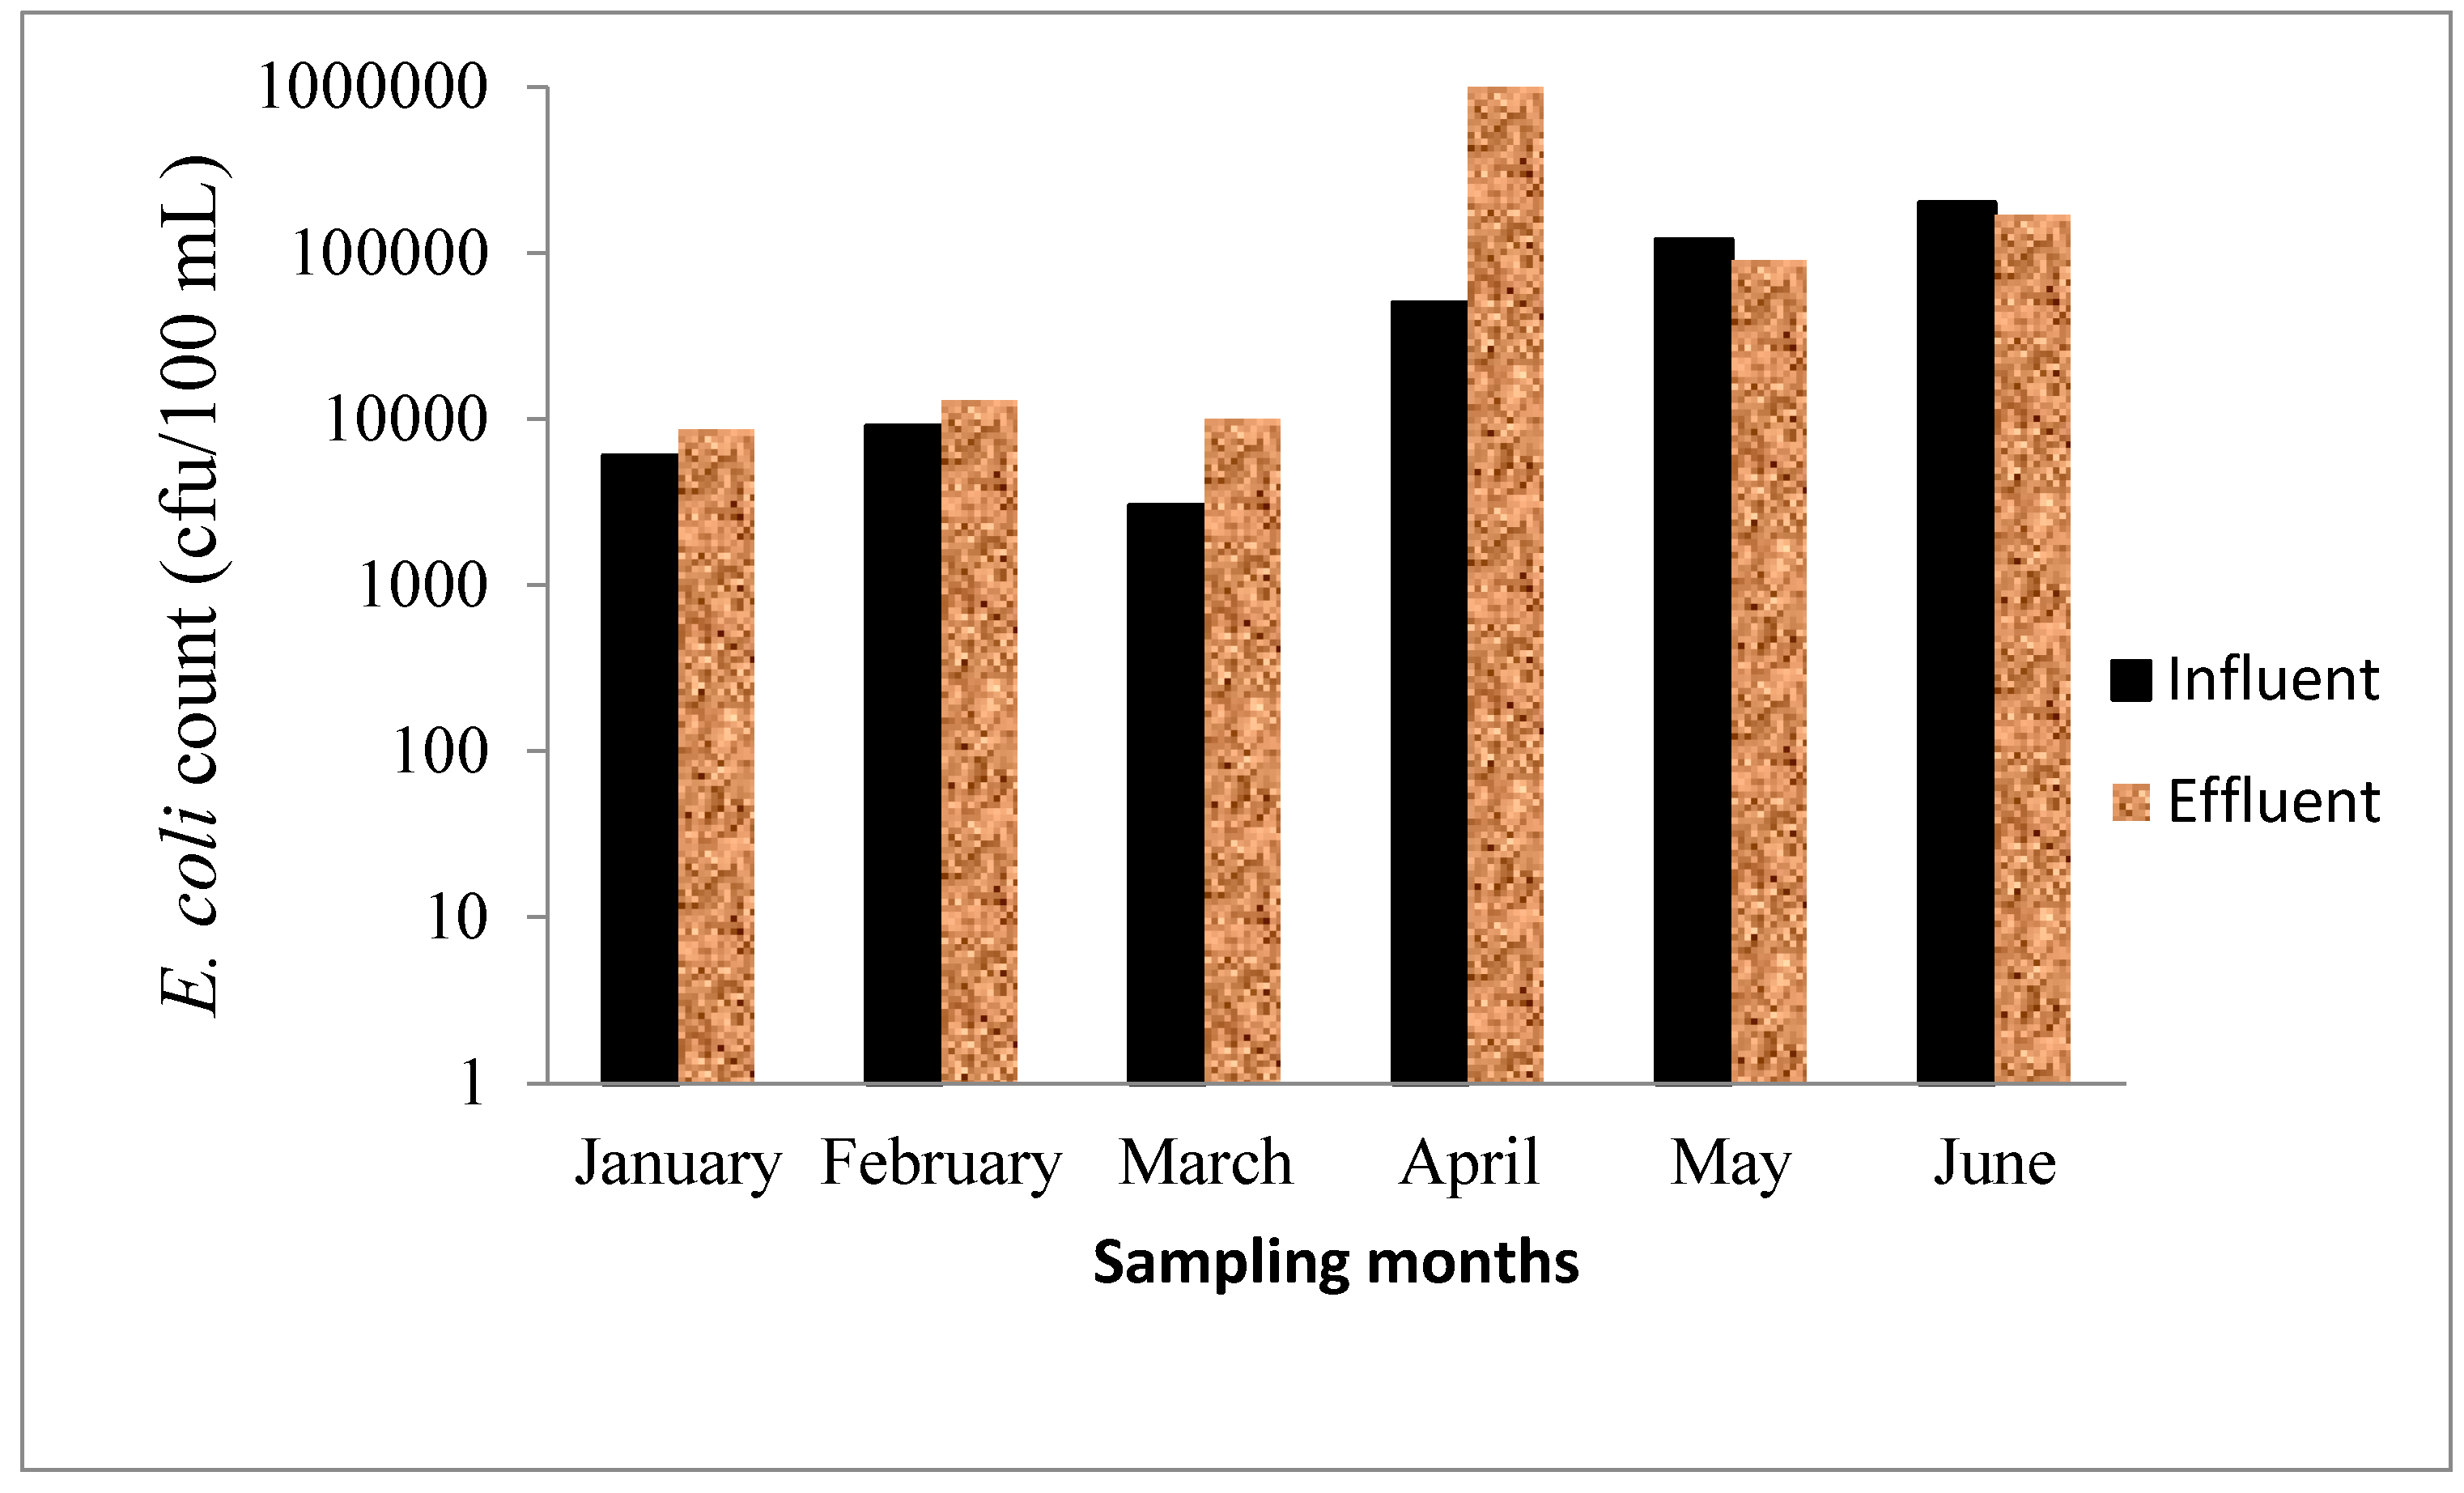
3.6. Microbiological Test

3.7. Metals in the Wastewater Samples
| Heavy metals concentration (mg/L) | Influent | After screening and lime addition | After primary sedimentation | After secondary sedimentation | Effluent | % Reduction |
|---|---|---|---|---|---|---|
| Al January | 1.604 | 1.487 | 1.669 | 1.168 | 2.483 | - |
| Al February | 1.915 | 0.427 | 0.367 | 0.627 | 0.501 | 74 |
| Al March | 2.271 | 1.931 | 2.602 | 1.259 | 0.739 | 68 |
| Al April | 3.903 | 4.296 | 3.283 | 1.419 | 1.780 | 54 |
| Al May | 3.833 | 2.974 | 3.316 | 3.418 | 2.126 | 45 |
| Al June | 2.522 | 6.037 | 2.184 | 1.409 | 1.706 | 32 |
| Fe January | 1.129 | 0.920 | 1.073 | 1.282 | 1.329 | - |
| Fe February | 0.744 | 0.635 | 0.537 | 0.522 | 0.485 | 35 |
| Fe March | 0.916 | 0.801 | 0.951 | 0.831 | 0.746 | 18 |
| Fe April | 0.815 | 1.016 | 1.034 | 0.885 | 0.772 | 5 |
| Fe May | 1.374 | 1.116 | 1.134 | 3.401 | 1.284 | 7 |
| Fe June | 0.760 | 2.160 | 0.624 | 0.530 | 0.843 | - |
| Zn January | 0.121 | 0.091 | 0.121 | 0.146 | 0.217 | - |
| Zn February | 0.071 | 0.060 | 0.068 | 0.045 | 0.052 | 27 |
| Zn March | 0.091 | 0.097 | 0.099 | 0.105 | 0.051 | 44 |
| Zn April | 0.130 | 0.109 | 0.129 | 0.043 | 0.072 | 45 |
| Zn May | 0.344 | 0.245 | 0.193 | 0.126 | 0.202 | 41 |
| Zn June | 0.776 | 0.068 | 0.085 | 0.032 | 0.046 | 94 |
| Cr January | 0.476 | 0.206 | 0.501 | 0.455 | 0.329 | 31 |
| Cr February | 0.221 | 0.265 | 0.250 | 0.248 | 0.241 | - |
| Cr March | 0.299 | 0.254 | 0.283 | 0.282 | 0.301 | - |
| Cr April | 0.035 | 0.018 | 0.050 | 0.038 | 0.043 | - |
| Cr May | 0.422 | 0.360 | 0.249 | 0.384 | 0.422 | - |
| Cr June | 0.030 | 0.037 | 0.033 | 0.012 | 0.030 | - |
| Cu January | 0.048 | 0.080 | 0.058 | 0.118 | 0.267 | - |
| Cu February | 0.017 | 0.036 | 0.045 | 0.014 | 0.021 | - |
| Cu March | 0.032 | 0.025 | 0.031 | 0.030 | 0.029 | 9 |
| Cu April | 0.048 | 0.070 | 0.061 | 0.041 | 0.087 | - |
| Cu May | 0.055 | 0.042 | 0.055 | 0.066 | 0.035 | 36 |
| Cu June | 0.029 | 0.125 | 0.040 | 0.050 | 0.068 | - |
| Mn January | 0.098 | 0.045 | 0.091 | 0.068 | 0.067 | 32 |
| Mn February | 0.303 | 0.293 | 0.246 | 0.043 | 0.042 | 86 |
| Mn March | 0.225 | 0.197 | 0.235 | 0.251 | 0.227 | - |
| Mn April | 0.280 | 0.418 | 0.278 | 0.497 | 0.345 | - |
| Mn May | 0.276 | 0.221 | 0.265 | 0.331 | 0.899 | - |
| Mn June | 0.167 | 0.582 | 0.251 | 0.213 | 0.277 | - |
| Pb January | 0.003 | 0.006 | 0.005 | 0.008 | 0.008 | - |
| Pb February | ND | 0.002 | ND | ND | ND | - |
| Pb March | 0.002 | ND | 0.001 | 0.002 | ND | - |
| Pb April | 0.072 | 0.022 | 0.030 | 0.029 | 0.042 | 42 |
| Pb May | 0.005 | 0.007 | 0.012 | 0.068 | 0.010 | - |
| Pb June | 0.011 | 0.014 | 0.008 | 0.001 | 0.011 | - |
| Variables | pH | EC | T | F | Cl | N | P | Al | Fe | Zn | Cr | Cu | Mn | Pb | E. coli | Ent |
|---|---|---|---|---|---|---|---|---|---|---|---|---|---|---|---|---|
| pH | 1 | 0.801 | 0.113 | −0.208 | 0.403 | 0.453 | 0.029 | 0.451 | 0.391 | 0.105 | −0.182 | −0.122 | 0.574 | 0.048 | −0.063 | 0.178 |
| EC | 1 | −0.385 | −0.248 | 0.510 | −0.093 | −0.108 | 0.099 | −0.089 | −0.370 | −0.597 | −0.144 | 0.030 | −0.001 | −0.031 | 0.426 | |
| T | 1 | −0.054 | −0.188 | 0.488 | 0.258 | −0.066 | 0.249 | 0.311 | 0.690 | −0.511 | 0.789 | −0.201 | −0.202 | −0.370 | ||
| F- | 1 | 0.677 | 0.414 | 0.893* | 0.155 | −0.156 | −0.143 | −0.470 | −0.042 | 0.174 | 0.943** | 0.974** | 0.706 | |||
| Cl− | 1 | 0.252 | 0.772 | 0.035 | −0.330 | −0.521 | −0.823* | −0.361 | 0.245 | 0.759 | 0.800 | 0.954** | ||||
| N | 1 | 0.501 | 0.751 | 0.730 | 0.616 | 0.219 | 0.159 | 0.820* | 0.517 | 0.376 | 0.051 | |||||
| P | 1 | 0.007 | −0.206 | −0.268 | −0.393 | −0.399 | 0.453 | 0.813* | 0.870* | 0.731 | ||||||
| Al | 1 | 0.887* | 0.776 | 0.096 | 0.694 | 0.381 | 0.399 | 0.189 | −0.105 | |||||||
| Fe | 1 | 0.927** | 0.517 | 0.617 | 0.472 | 0.022 | −0.185 | −0.489 | ||||||||
| Zn | 1 | 0.677 | 0.614 | 0.394 | −0.046 | −0.235 | −0.658 | |||||||||
| Cr | 1 | 0.091 | 0.323 | −0.580 | −0.641 | −0.908* | ||||||||||
| Cu | 1 | −0.354 | 0.123 | −0.025 | −0.286 | |||||||||||
| Mn | 1 | 0.210 | 0.126 | −0.028 | ||||||||||||
| Pb | 1 | 0.976** | 0.749 | |||||||||||||
| E. coli | 1 | 0.827* | ||||||||||||||
| ENT | 1 |
4. Conclusions
Acknowledgments
Author Contributions
Conflicts of Interest
References
- Phuntsho, S.; Shon, H.K.; Vigneswaran, S.; Ngo, H.H.; Kandasamy, J. Performance of Waste Stabilization Ponds: Experience from cold climatic conditions of Bhutan. In Proceedings of 8th IWA specialized Conference on Small Water and Wastewater Systems and 2nd Specialized Conference on Decentralized Water and Wastewater International Network, Coimbatore, India, 6–9 February 2008; pp. 1–12.
- Klinch, B.A.; Stuart, M.E. Human Health Risk in Relation to Landfill Leachate Quality; British Geological Survey, Technical Report; Overseas Series; British Geological Survey: Key Worth, Notteningham, UK, 1999; pp. 1–55. [Google Scholar]
- Muthukumaran, N.; Ambujam, N.K. Wastewater Treatment and Management in Urban Areas—A Case Study of Tiruchirappalli City, Tamil Nadu, India. In Proceedings of the Third International Conference on Environment and Health, Chennai, India, 15–17 December 2003; pp. 284–289.
- Mekala, G.D.; Davidson, B.; Samad, M.; Boland, A. A Framework for Efficient Wastewater Treatment and Recycling Systems; IWMI Working Paper 129; International Water Management Institute: Colombo, Sri Lanka, 2008; p. 23. Available online: http://ageconsearch.umn.edu/bitstream/46387/2/WOR129.pdf (accessed on 4 March 2015).
- Gumbo, J.R.; Malaka, E.M.; Odiyo, J.O.; Nare, L. The health implications of wastewater reuse in vegetable irrigation: A case study from Malamulele, South Africa. Int. J. Environ. Health Res. 2010, 20, 201–211. [Google Scholar] [CrossRef] [PubMed]
- DWA. Green Drop Report; 2009. Available online: https://www.dwaf.gov.za/Documents/Green DropReport2009_ver1_web.pdf (accessed on 4 March 2015).
- CSIR. A CSIR Perspective on Water in South Africa. CSIR Report No. CSIR/NRE/PW/IR/2011/0012/A. 2010. Available online: http://www.csir.co.za/nre/docs/CSIR%20Perspective%20on%20Water_2010.PDF (accessed on 4 March 2015).
- Munnick, V. Sewerage shapes up as next crisis. Cape Times, 2008 March 18. [Google Scholar]
- Potgieter, N.; Becker, P.J.; Ehlers, M.M. Evaluation of the CDC safe water-storage intervention to improve the microbiological quality of point-of-use drinking water in rural communities in South Africa. Water SA 2009, 35, 505–516. [Google Scholar]
- Saving Water SA. Over half of wastewater treatment plants well below standard. Available online: http://www.savingwater.co.za/tag/wastewater-treatment-plants (accessed on 9 August 2012).
- Wall, K. An investigation of the franchising option for water services operation in South Africa. Water SA 2006, 32, 265–268. [Google Scholar]
- Burtscher, M.M.; Zibuschka, F.; Mach, R.L.; Lindner, G.; Farnleitner, A.H. Heterotrophic plate count vs. in situ bacterial 16S rRNA gene amplicon profiles from drinking water reveal completely different communities with distinct spatial and temporal allocations in a distribution network. Water SA 2009, 35, 495–504. [Google Scholar]
- Osode, A.N.; Okoh, A.I. Impact of discharged wastewater final effluent on the physicochemical qualities of a receiving watershed in a sub-urban community of the Eastern Cape Province. Clean Soil Air Water 2009, 37, 938–944. [Google Scholar] [CrossRef]
- Momba, M.N.B.; Osode, A.N; Sibewu, M. The impact of inadequate wastewater treatment on the receiving water bodies—Case study: Buffalo City and Nkokonbe Municipalities of the Eastern Cape Province. Water SA 2006, 32, 687–692. [Google Scholar] [CrossRef]
- Newmarch, J. Sewage works in parlous state. Available online: http://allafrica.com/stories/201004280012.html (accessed on 2 February 2013).
- Ogola, J.S.; Chimuka, L.; Maina, D. Occurrence and fate of trace metals in and around treatment and disposal facilities in Limpopo Province, South Africa: A case of two areas. In Proceeding of the IASTED International Conference on Environmental Management and Engineering, Banff, Alberta, Canada, 6–8 July 2009; pp. 92–97.
- Mema, V. Impact of poorly maintained waste water and sewage treatment plants: Lessons from South Africa. Pretoria: Council for Scientific and Industrial Research. Available online: http://www.ewisa.co.za/literature/files/335_269%20Mema.pdf (assessed on 21 March 2012).
- Akpor, O.B.; Muchie, M. Environmental and public health implications of wastewater quality African. J. Biotechnol. 2011, 10, 2379–2387. [Google Scholar]
- Toze, S. Microbial Pathogens in Wastewater. Literature Review for Urban Waste Systems in Multi-Divisional Research Program; CSIRO Report No 1997; CSIRO: Pretoria, South Africa, 1997. [Google Scholar]
- Ashbolt, N.J.; Dorsch, M.R.; Cox, P.T.; Banens, B. Blooming E. coli, what do they mean? In Coliforms and E. coli, Problem or Solution; Royal Society of Chemistry: Cambridge, UK, 1995; pp. 78–85. [Google Scholar]
- DWA. Blue Drop Report; Geographical overview of water and wastewater treatment works. Available online: http//www.ewisa.co.za/ewisawaterworks/misc/municipalcontacts/…/VhembeDM2.jpg (accessed on 18 March 2015).
- APHA. Standard methods for the examination of water and wastewater. Available online: ftp://ftpurgell.upc.es/quimica/E.Boada/Quimica_Analitica_Medi_Ambient%20(OPT%20antiga%20)/Metalls.PDF (accessed on 7 April 2013).
- US EPA. Acid digestion of sediments, sludges, and soils method 3050B. Available online: http://www.epa.gov/osw/hazard/testmethods/sw846/pdfs/3050b.pdf (accessed on 21 March 2013).
- US EPA. Determination of Metals and Trace Elements in Water and Wastes by Inductively Coupled Plasma-Atomic Emission; Spectrometry Method 200.7; Martin, T.D., Brockhoff, C.A., Creed, J.T., EMMC Methods Work Group, Eds.; US EPA: Cincinnati, OH, USA, 1994; pp. 1–58. [Google Scholar]
- Brand, T. The importance of pH in wastewater treatment. Available online: http://advancedchemsys.com/importance-ph-wastewater-treatment/©Advanced Chemical Systems (accessed on 5 March 2015).
- Barakat, M.A. New trends in removing heavy metals from industrial wastewater. Arabian J. Chem. 2011, 4, 361–377. [Google Scholar] [CrossRef]
- Alwan, G.M. pH-control Problems of wastewater treatment plants. Al-Khwarizmi Eng. J. 2008, 4(2), 37–45. [Google Scholar]
- Latif, W. Microbiological role of pH in domestic wastewater treatment technology and its importance of NEQs in monitoring domestic wastewater and its discharge requirements. Available online: http://environmental-realm.blogspot.com/2012/04/microbiological-role-of ph-in-domestic.html (accessed on 18 March 2015).
- DWA. Wastewater Risk Abatement Plan: A guideline to plan and manage towards safe and compliant wastewater collection and treatment in South Africa. Available online: https://www.dwa.gov.za/dir_ws/GDS/Docs/.../DownloadSiteFiles.aspx?id (accessed on 21 March 2014).
- Environment Canada. Management of wastewater treatment systems, EG318–6. Available online: http//www.casc.csc.gc.ca/text/play/doc/318–6-gl_e.pdf (accessed on 16 March 2015).
- Metcalf Eddy. Wastewater Engineering, Treatment and Reuse,, 4th ed.; Tchobanoglous, G., Burton, F.L., Stensel, H.D., Eds.; McGraw-Hill: New York, NY, USA, 2004; pp. 27–78. [Google Scholar]
- Igbinosa, E.O.; Okoh, A.I. Impact of discharge wastewater effluents on the physico-chemical qualities of a receiving watershed in a typical rural community. Int. J. Environ. Sci. Technol. 2009, 6, 175–182. [Google Scholar] [CrossRef]
- Morrison, G.; Fatoki, O.S.; Persson, L.; Ekberg, A. Assessment of the impact of point source pollution from the Keiskammahoek Sewage Treatment Plant on the Keiskamma River—pH, electrical conductivity, oxygen-demanding substance (COD) and nutrients. Water SA 2001, 27, 475–480. [Google Scholar] [CrossRef]
- DWA. Wastewater limit values applicable to discharge of wastewater into a river resource. National Water Act, Government Gazzette No 20528. Available online: http://hwt.co.za/downloads/NWA%20General%20and%20Special%20Authorisations.pdf (accessed on 4 March 2015).
- Bernet, N.; Habouzit, F.; Moletta, R. Use of an industrial effluent as a carbon source for denitrification of a high-strength wastewater. Appl. Microbiol. Biotechnol. 1996, 46, 92–97. [Google Scholar] [CrossRef]
- Bernet, N.; Delgenes, N.; Akunna, J.C.; Delgenes, J.P.; Moletta, R. Combined anaerobic-aerobic SBR for the treatment of piggery wastewater. Wat. Res. 2000, 34, 611–619. [Google Scholar] [CrossRef]
- Breisha, G.Z. Bio-removal of nitrogen from wastewaters—A review. Nat. Sci. 2010, 8, 212–228. [Google Scholar]
- Fernández-Nava, Y.; Marañón, E.; Soons, J.; Castrillón, L. Denitrification of wastewater containing high nitrate and calcium concentrations. Bioresour. Technol. 2008, 99, 7976–7981. [Google Scholar] [CrossRef] [PubMed]
- Palaniappan, M.; Gleick, P.H.; Allen, L.; Cohen, M.J.; Christian-Smith, J.; Smith, C. Clearing the Waters A Focus on Water Quality Solutions United Nations Environment Programme; UNON, Publishing Services Section: Nairobi, Kenya, 2010; pp. 42–47. [Google Scholar]
- Correll, D.L. The Role of Phosphorus in the Eutrouphication of Receiving Waters: A Review. J. Environ. Qual. 1998, 27, 261–266. [Google Scholar] [CrossRef]
- Roelofs, J.G.M.; Schuurkes, J.A.A.R.; Smits, A.J.M. Impact of Acidification and Eutrouphication on Macrophyte Communities in Soft Waters. II. Experimental studies. Aquatic Botany 1984, 18, 489–411. [Google Scholar] [CrossRef]
- DWAF. Aquatic Ecosystems. In South African Water Quality Guidelines, 2nd ed.; Pretoria: South Africa, 1996; Volume 7, p. 161. [Google Scholar]
- Igbinosa, E.O.; Okoh, A.I. Emerging Vibrio species: An unending threat to public health in developing countries. Res. Microbiol. 2008, 159, 495–506. [Google Scholar] [CrossRef] [PubMed]
- Okoh, A.I.; Odjadjare, E.E.; Igbinosa, E.O.; Osode, A.N. Wastewater treatment plants as a source of microbial pathogens in receiving watersheds. Afr. J. Biotechnol. 2007, 6, 2932–2944. [Google Scholar]
- US EPA. Test Methods for Escherichia coli and Enterococci in Water by the Membrane Filter Procedure; EPA-600/4–85/076; Environmental Monitoring and Support Laboratory: Cincinnati, OH, USA, 1985. [Google Scholar]
- WHO. Health Criteria and Other Supporting Information. In Guidelines for Drinking Water Quality, 2nd ed.; WHO: Geneva, Switzerland, 1996; Volume 2. [Google Scholar]
- Weber, S.; Khan, S.; Hollender, J. Human risk assessment of organic contaminants in reclaimed wastewater used for irrigation. Desalination 2006, 187, 53–64. [Google Scholar] [CrossRef]
- Chipasa, K.B. Accumulation and fate of selected heavy metals in a biological wastewater treatment system. Waste Manage. 2003, 23, 135–143. [Google Scholar] [CrossRef]
- Firfilionis, G.; Paraskevopoulou, V.; Vilioti, G.; Dassenakis, M. The removal of trace metals at the wastewater treatment plant of Psyttalia. Mediterr. Mar. Sci. 2004, 5, 71–81. [Google Scholar] [CrossRef]
- Karvelas, M.; Katsoyiannis, A.; Samara, C. Occurrence and fate of heavy metals in the wastewater treatment process. Chemosphere 2003, 53, 1201–1210. [Google Scholar] [CrossRef]
- Carletti, G.; Fatone, F.; Bolzonella, D.; Cecchi, F. Occurrence and fate of heavy metals in large wastewater treatment plants treating municipal and industrial wastewaters. Water Sci. Technol. 2008, 57, 1329–1336. [Google Scholar] [CrossRef] [PubMed]
- Kang, D.; Tang, H.; Xie, D.; Ke, P. Adsorption abilities by heavy metals and inorganic particles and activated sludge in domestic wastewater treatment plant. J. Chem. Pharm. Res. 2014, 6, 2918–2926. [Google Scholar]
- Veglio, F.; Beolchini, F. Removal of metals by biosorption: A review. Hydrometallurgy 1997, 44, 301–316. [Google Scholar] [CrossRef]
© 2015 by the authors; licensee MDPI, Basel, Switzerland. This article is an open access article distributed under the terms and conditions of the Creative Commons Attribution license (http://creativecommons.org/licenses/by/4.0/).
Share and Cite
Edokpayi, J.N.; Odiyo, J.O.; Msagati, T.A.M.; Popoola, E.O. Removal Efficiency of Faecal Indicator Organisms, Nutrients and Heavy Metals from a Peri-Urban Wastewater Treatment Plant in Thohoyandou, Limpopo Province, South Africa. Int. J. Environ. Res. Public Health 2015, 12, 7300-7320. https://doi.org/10.3390/ijerph120707300
Edokpayi JN, Odiyo JO, Msagati TAM, Popoola EO. Removal Efficiency of Faecal Indicator Organisms, Nutrients and Heavy Metals from a Peri-Urban Wastewater Treatment Plant in Thohoyandou, Limpopo Province, South Africa. International Journal of Environmental Research and Public Health. 2015; 12(7):7300-7320. https://doi.org/10.3390/ijerph120707300
Chicago/Turabian StyleEdokpayi, Joshua N., John O. Odiyo, Titus A. M. Msagati, and Elizabeth O. Popoola. 2015. "Removal Efficiency of Faecal Indicator Organisms, Nutrients and Heavy Metals from a Peri-Urban Wastewater Treatment Plant in Thohoyandou, Limpopo Province, South Africa" International Journal of Environmental Research and Public Health 12, no. 7: 7300-7320. https://doi.org/10.3390/ijerph120707300