
Modelling Anopheles gambiae s.s. Population Dynamics with Temperature- and Age-Dependent Survival

Abstract
:1. Introduction
2. Methods
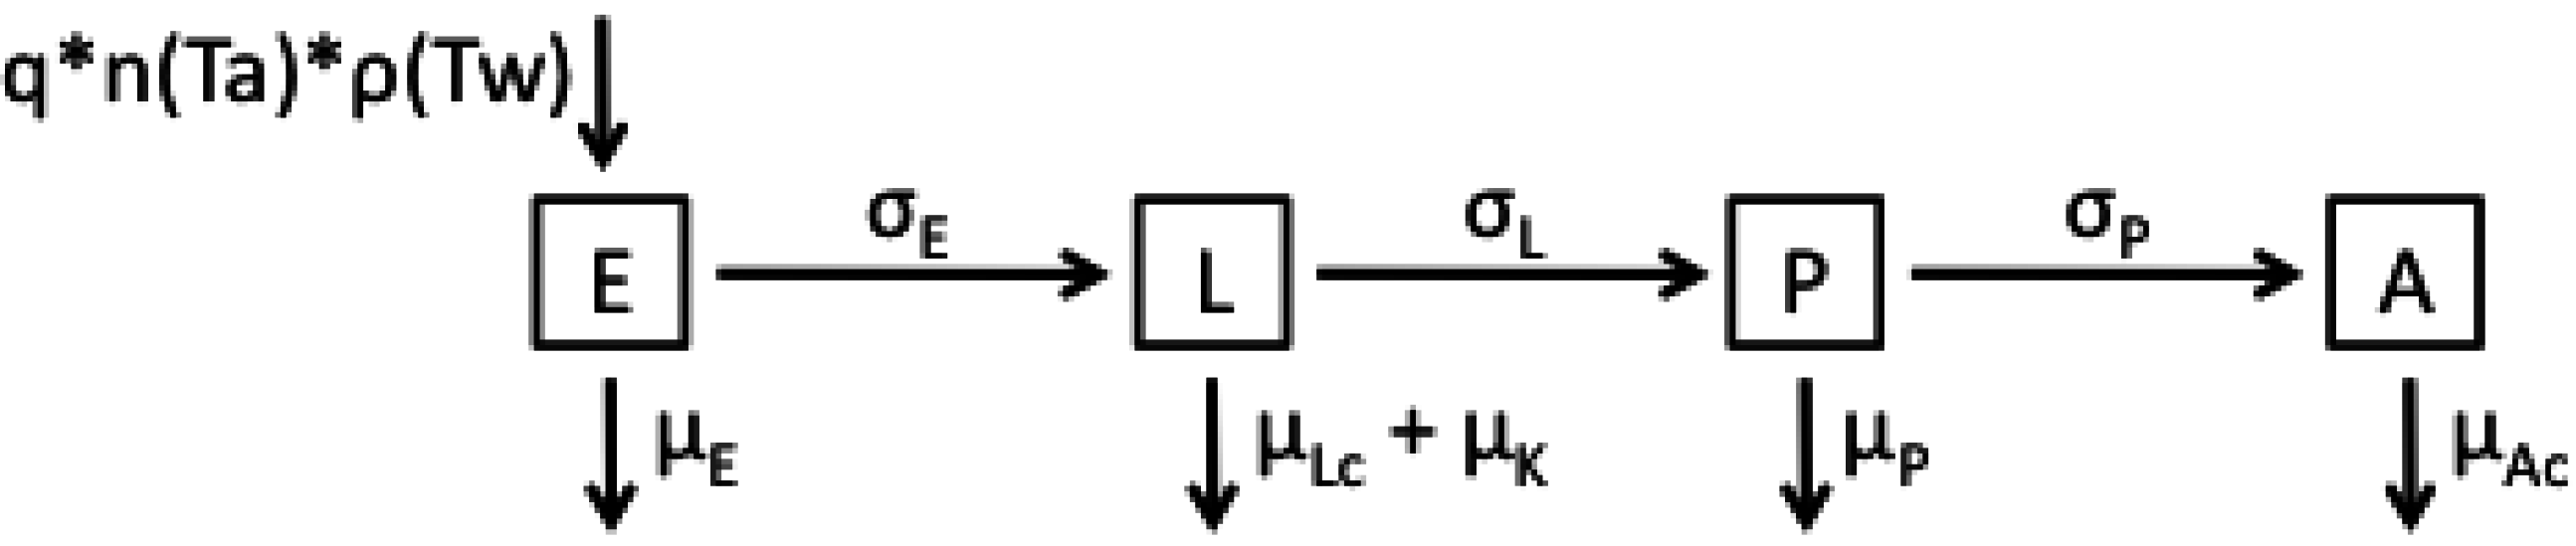
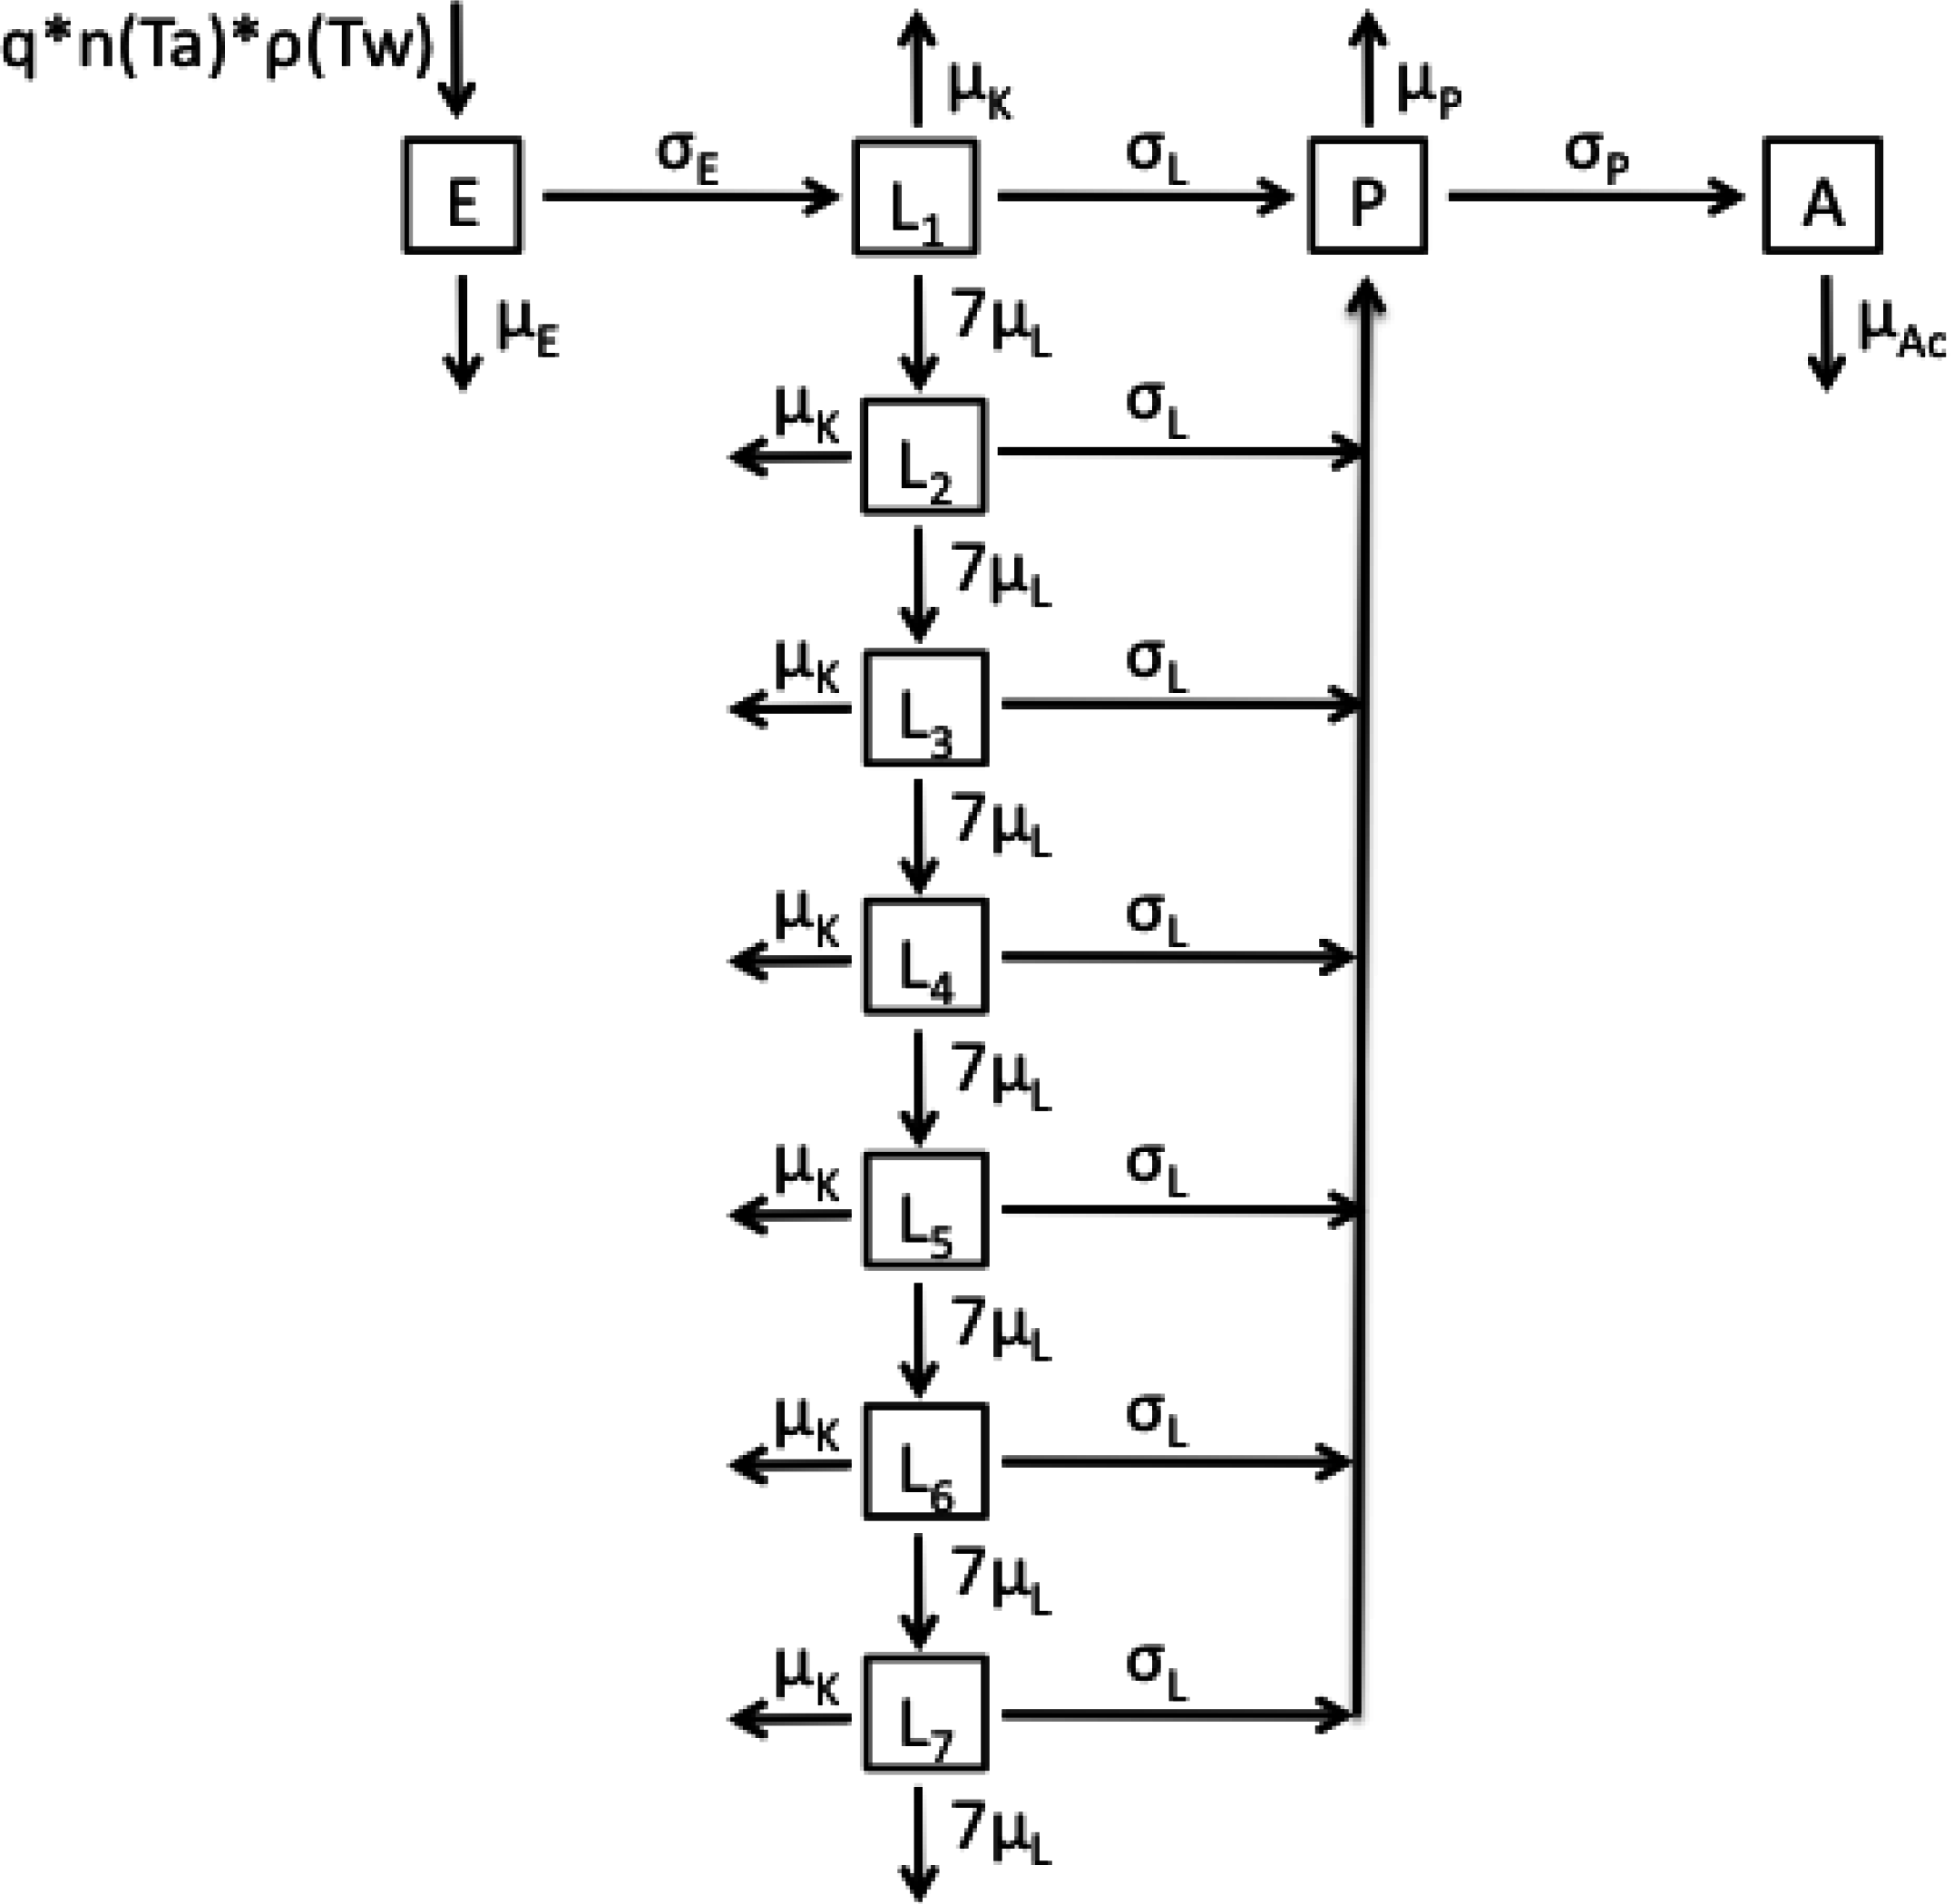
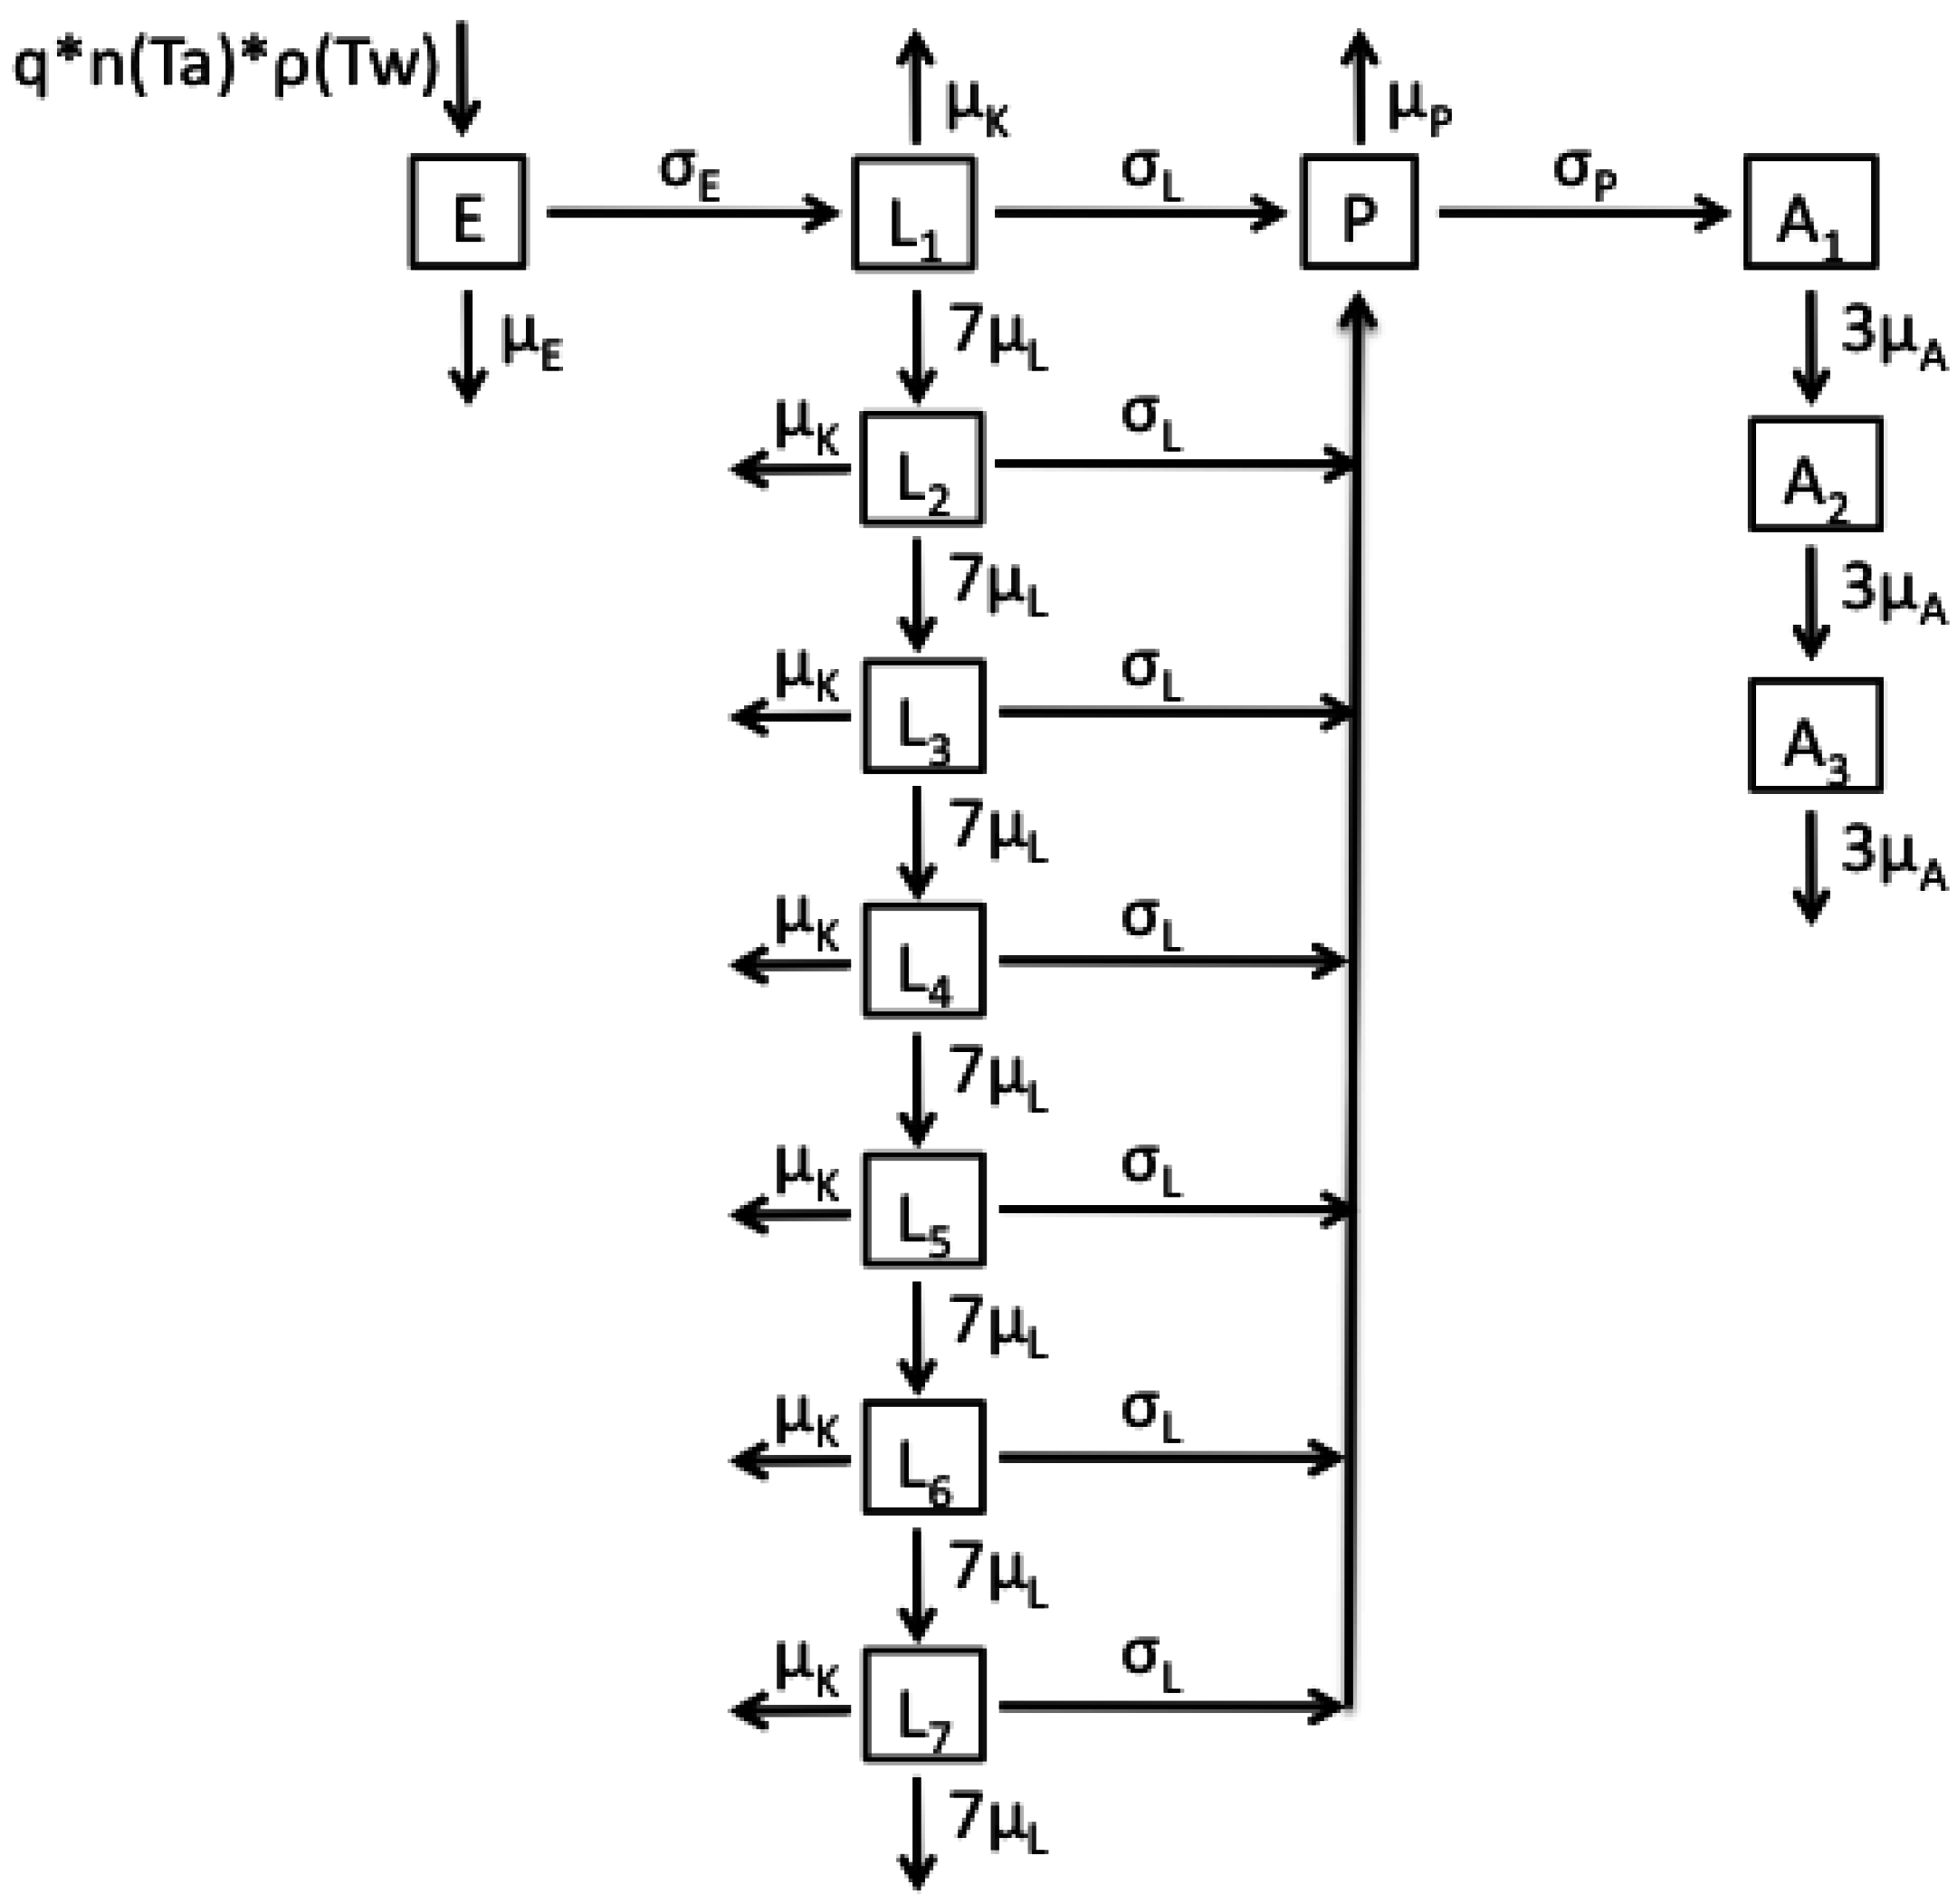
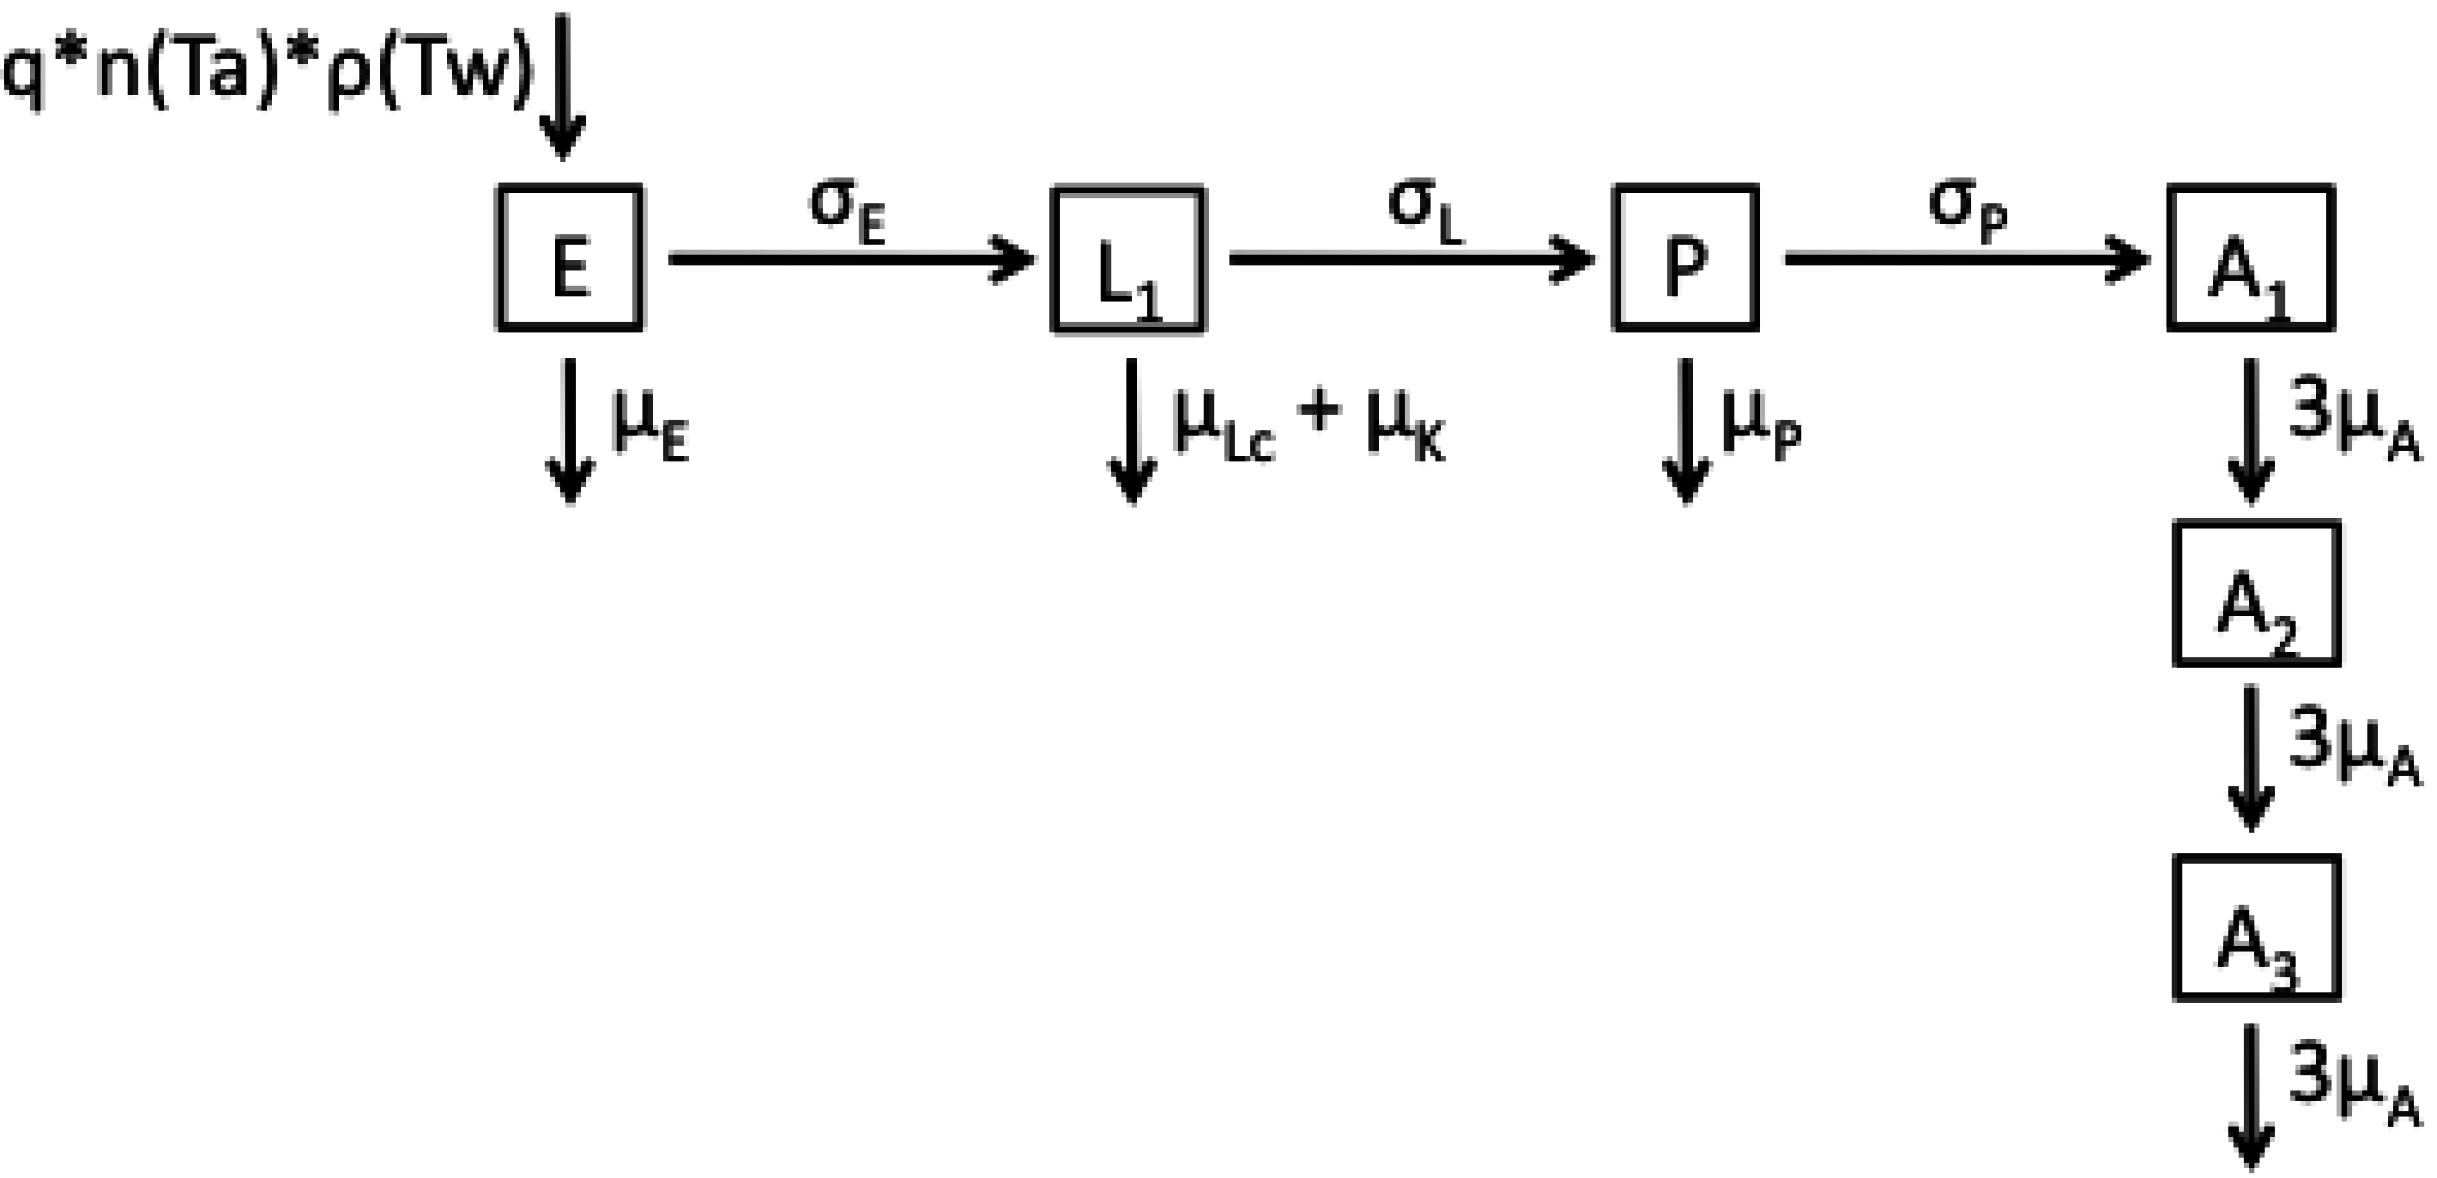
2.1. Model Structures and Parameterisation

| Parameter | Functional Form for Average Stage Duration |
|---|---|
| dE (eggs) | |
| dL (larvae) | |
| dP (pupae) |
| Parameter | Definition | Unit | Prior | Posterior |
|---|---|---|---|---|
| q | Proportion of adult females laying eggs | − | 0.61 − 0.85 [65] | * |
| n(Ta) | Number of eggs laid per female | − | −1.1057 Ta2 + 56.208 Ta – 662.1 [65] | |
| ρ(Tw) | Proportion of eggs hatching | − | −0.0034 Tw2 + 0.1719 Tw – 1.248 [65] | |
| μE | Per capita egg mortality rate | days−1 | 0.32 − 0.8 [10,70] | * |
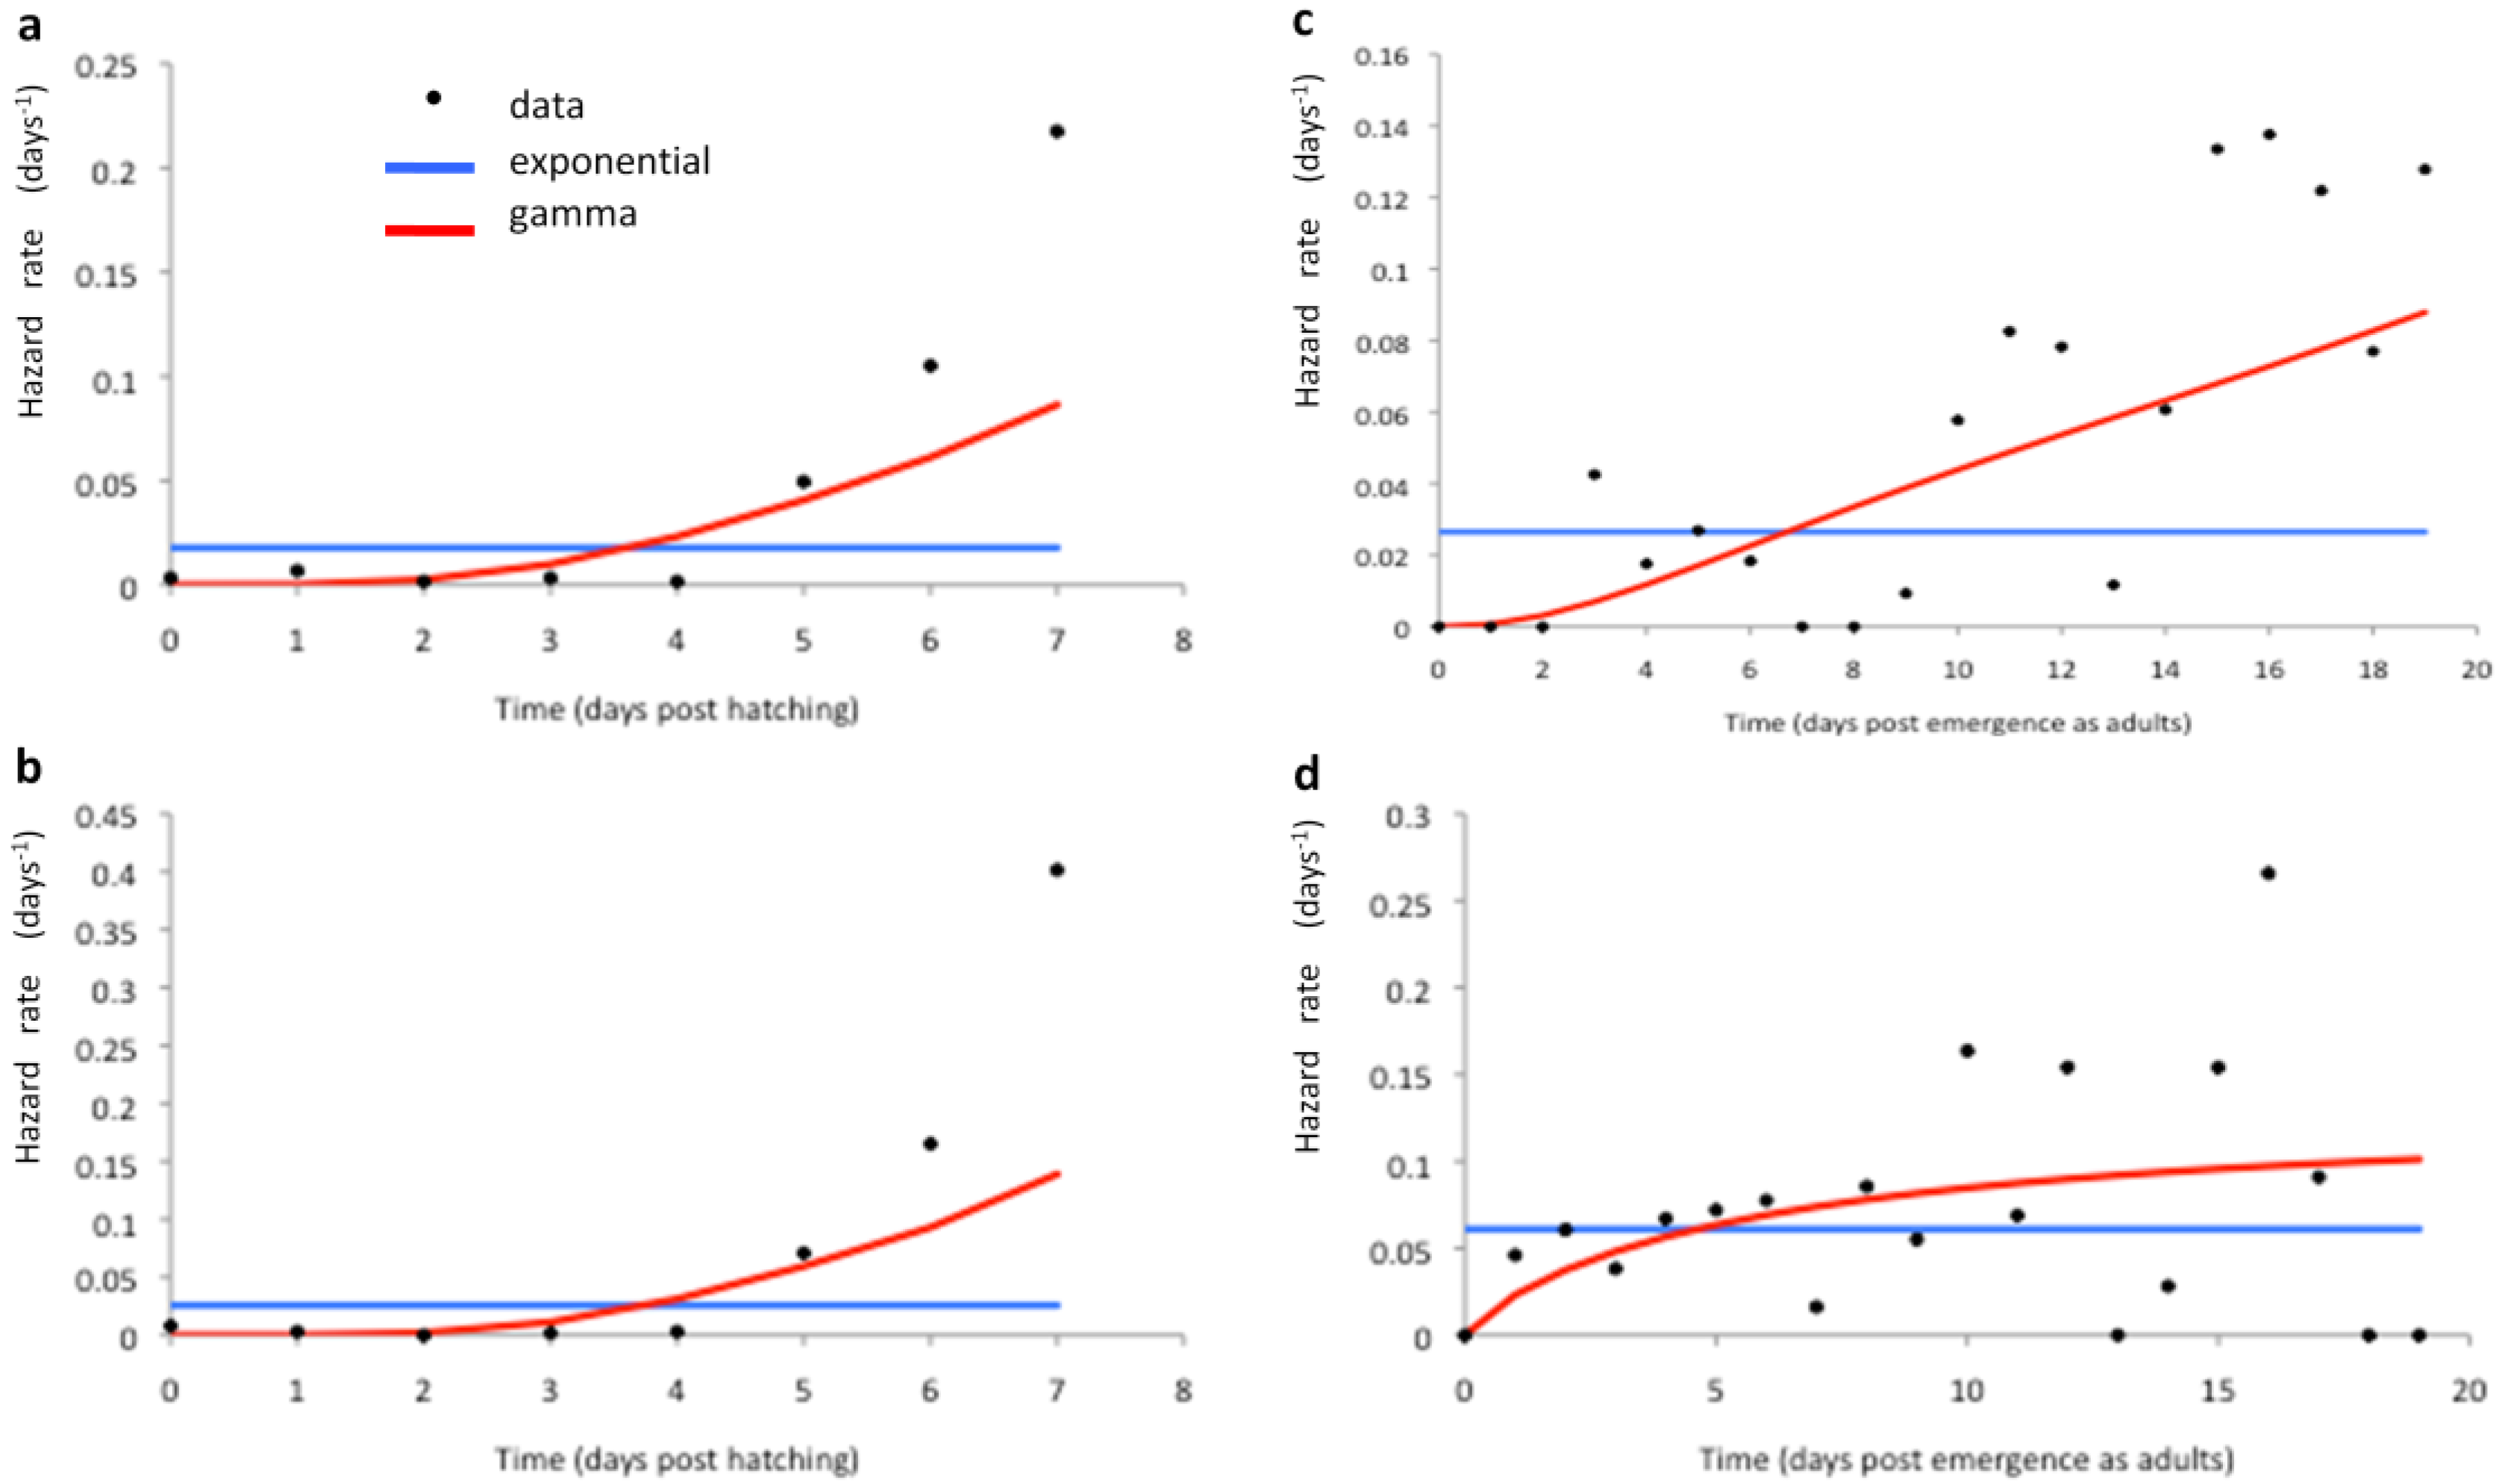
| μL | Per capita age-dependent larval mortality rate | days−1 | 1/αLβL | |
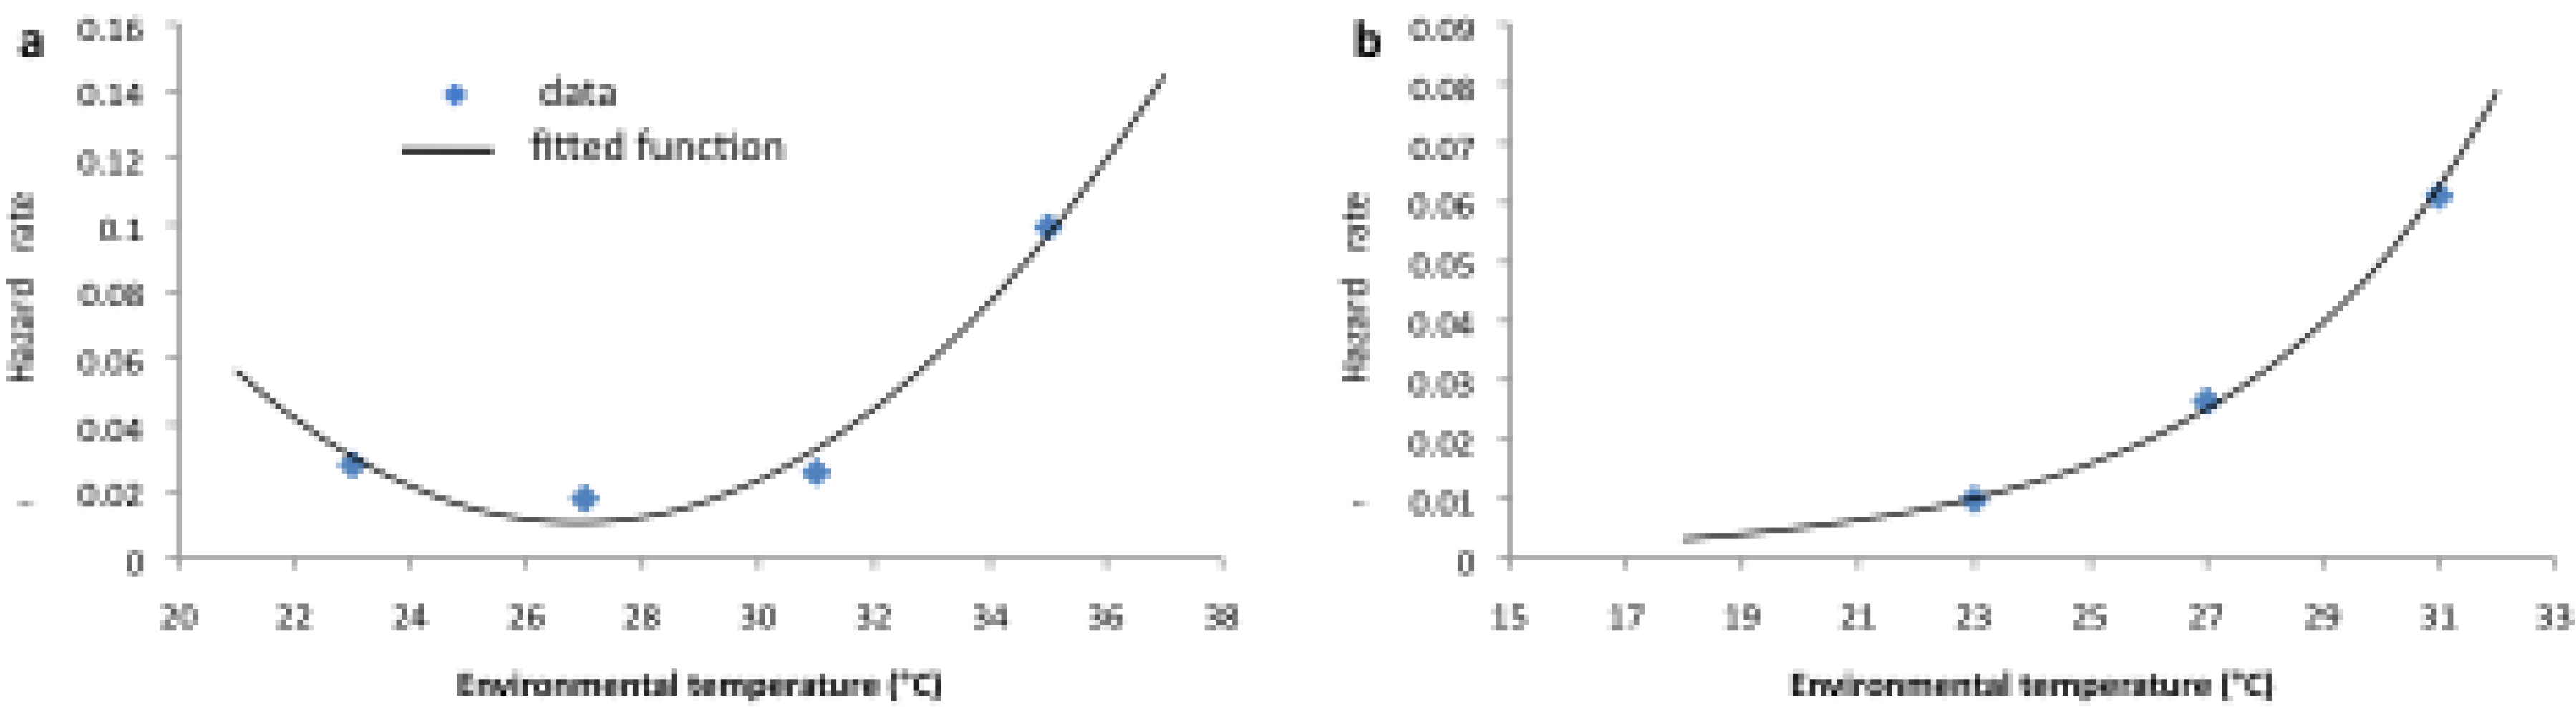
| μLC | Per capita age-independent larval mortality rate | days−1 | 0.0013 Tw2 − 0.0704 Tw + 0.9581 | |
| μP | Per capita pupal mortality rate | days−1 | 0.25 [11] | |
| μA | Per capita age-dependent adult mortality rate | days−1 | 1/αAβA | |
| μAC | Per capita age-independent adult mortality rate | days−1 | (5.37 × 10⁻⁵) e 0.228Ta | |
| μK | Per capita density- (and rainfall-) dependent larval mortality rate | days−1 | [11] | |
| μC | Constant | days−1 | 0–10,000 | * |
| K | Carrying capacity | − | [11] | |
| τ | Days of rainfall contributing to carrying capacity | days | <10 [11] | * |
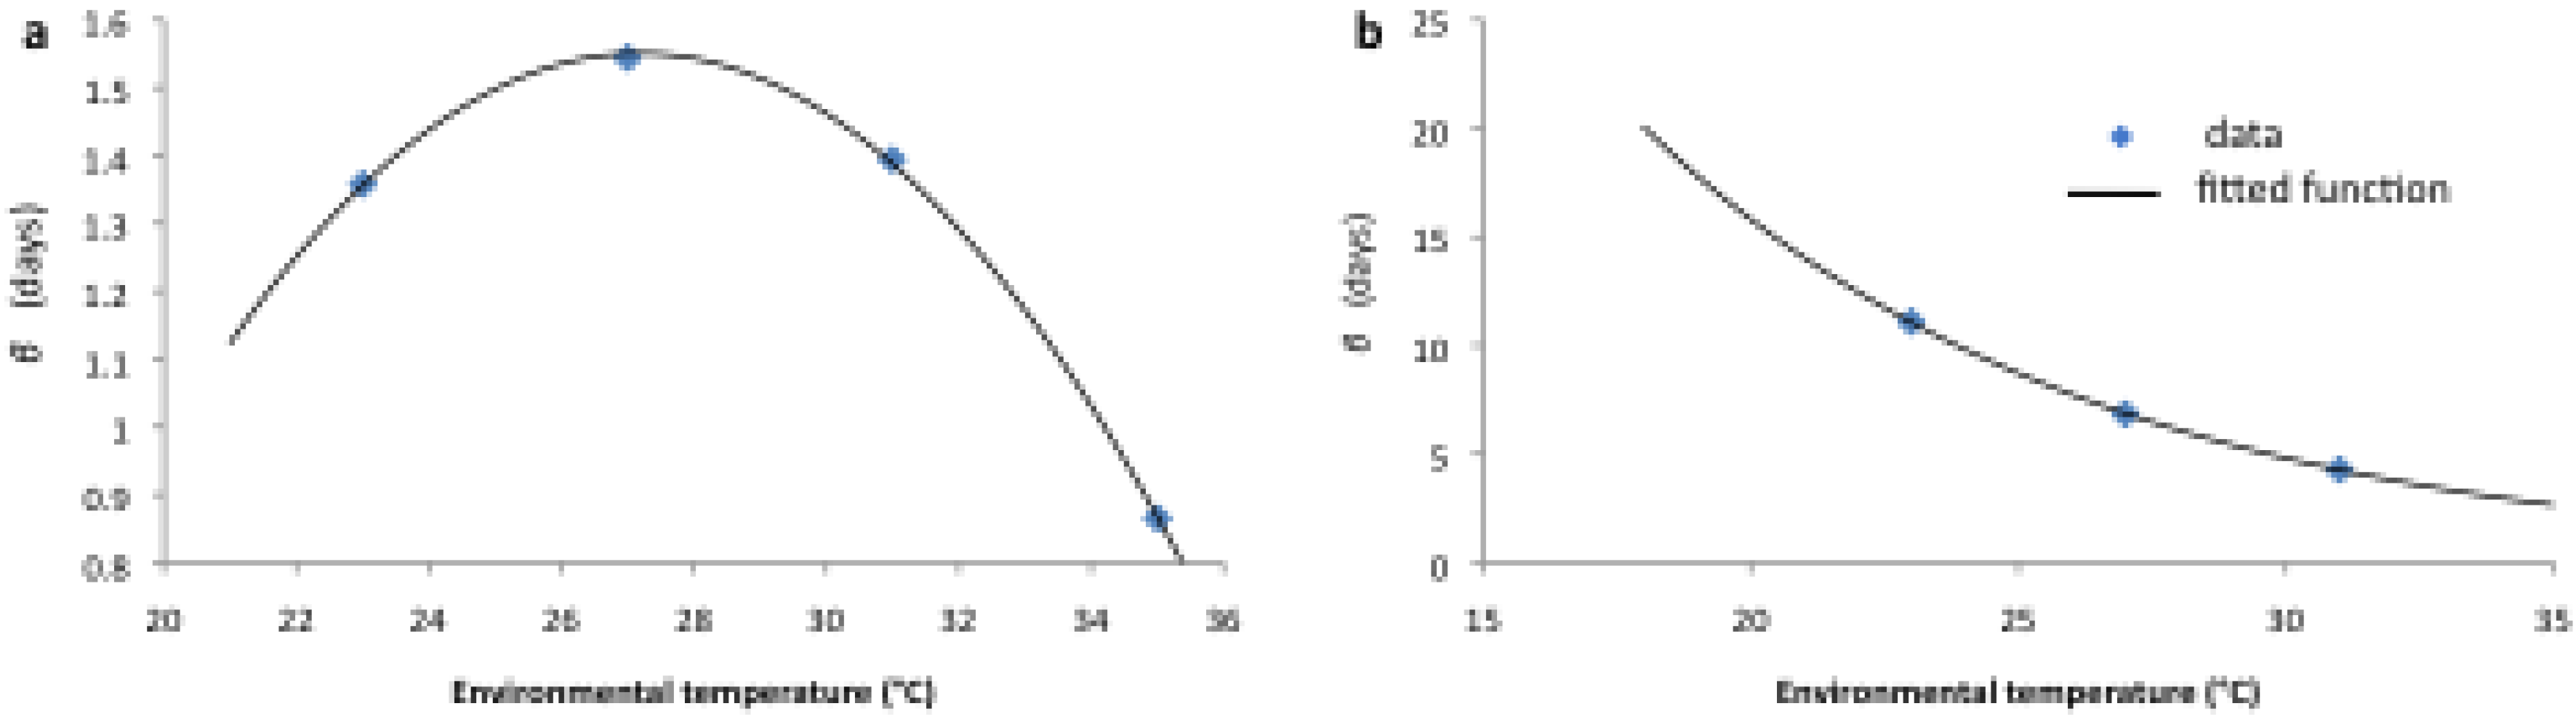
| αL | Shape parameter of larval gamma hazard function | − | ||
| βL | Scale parameter of larval gamma hazard function | days | −0.0112 Tw2 + 6.0775 Tw – 6.709 | |
| αA | Shape parameter of adult gamma hazard function | − | 3 | |
| βA | Scale parameter of adult gamma hazard function | days | 171.26 e−0.1191Ta | |
| σE | Per capita egg development rate | days−1 | 1/dE [68] | |
| σL | Per capita larval development rate | days−1 | 1/dL [68] | |
| σP | Per capita pupal development rate | days−1 | 1/dP [68] | |
| σA | Per capita adult development rate | days−1 | 1/dA [68] | |
| ΔT | Difference between environmental air and water temperature | °C | 2.9 − 7.6 [71] | * |


2.2. Longitudinal Data for Model Fitting
2.3. Model Fitting
3. Results and Discussion
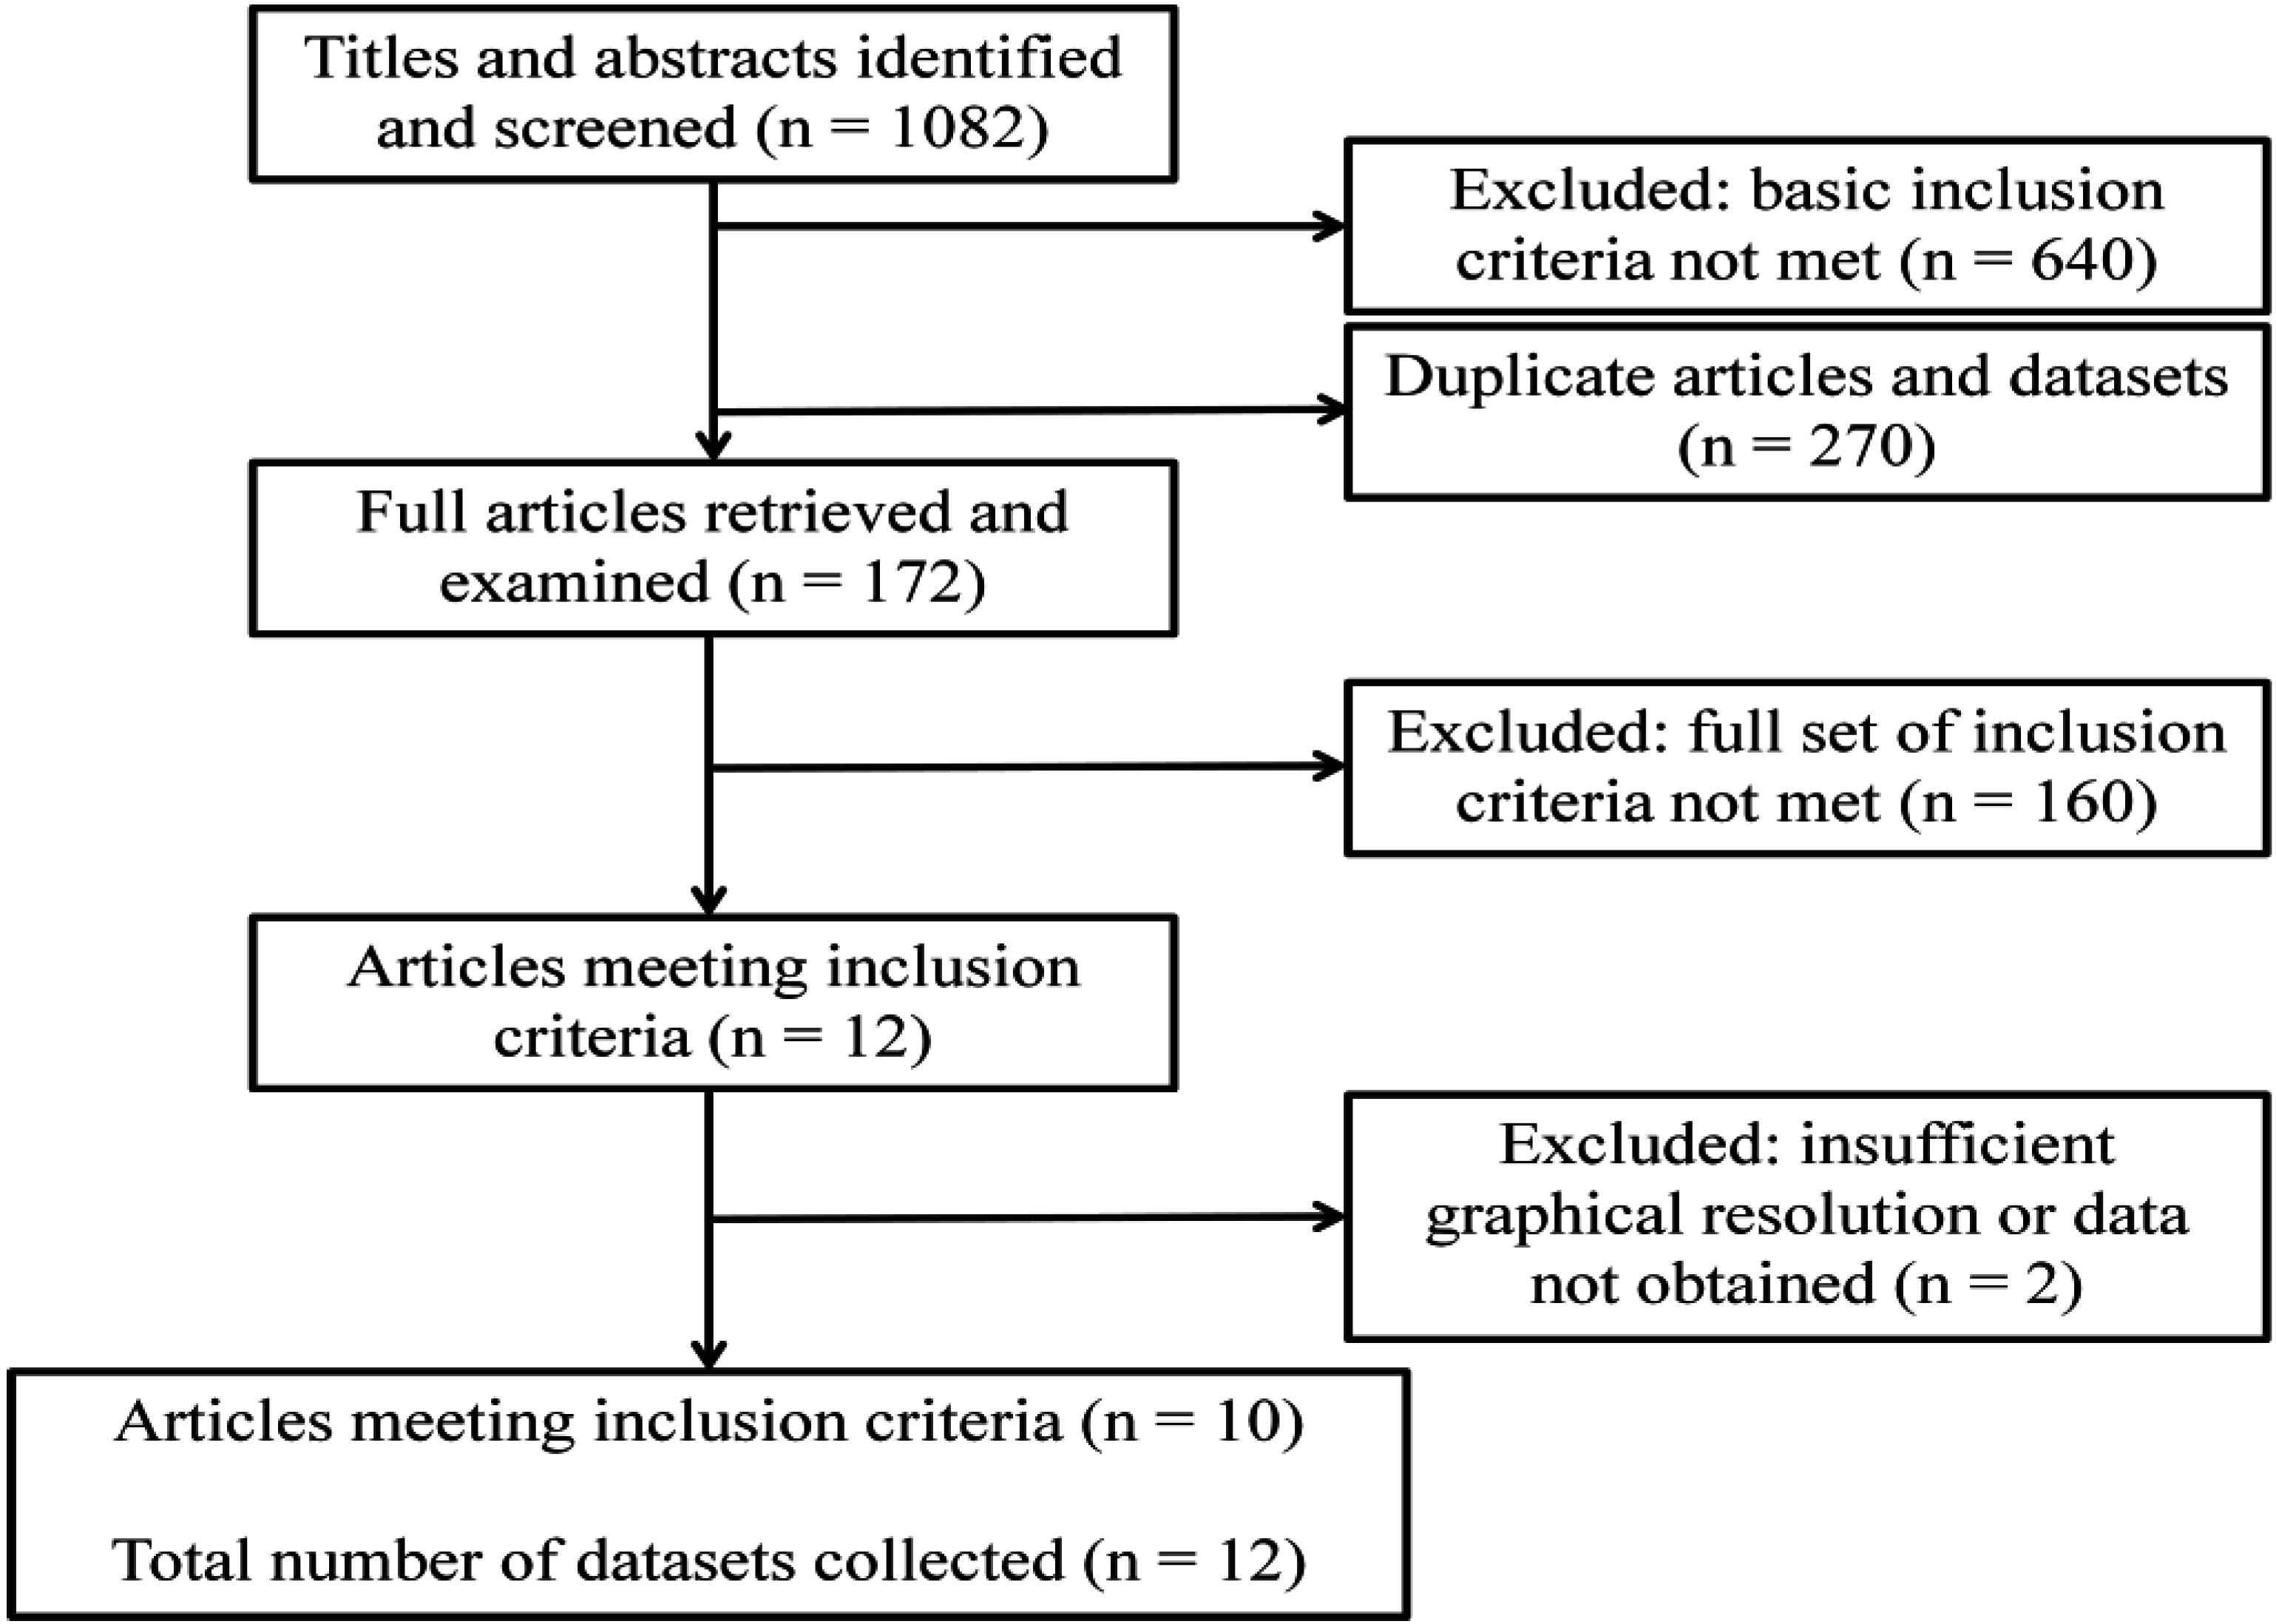
3.1. Datasets of An. gambiae Abundance

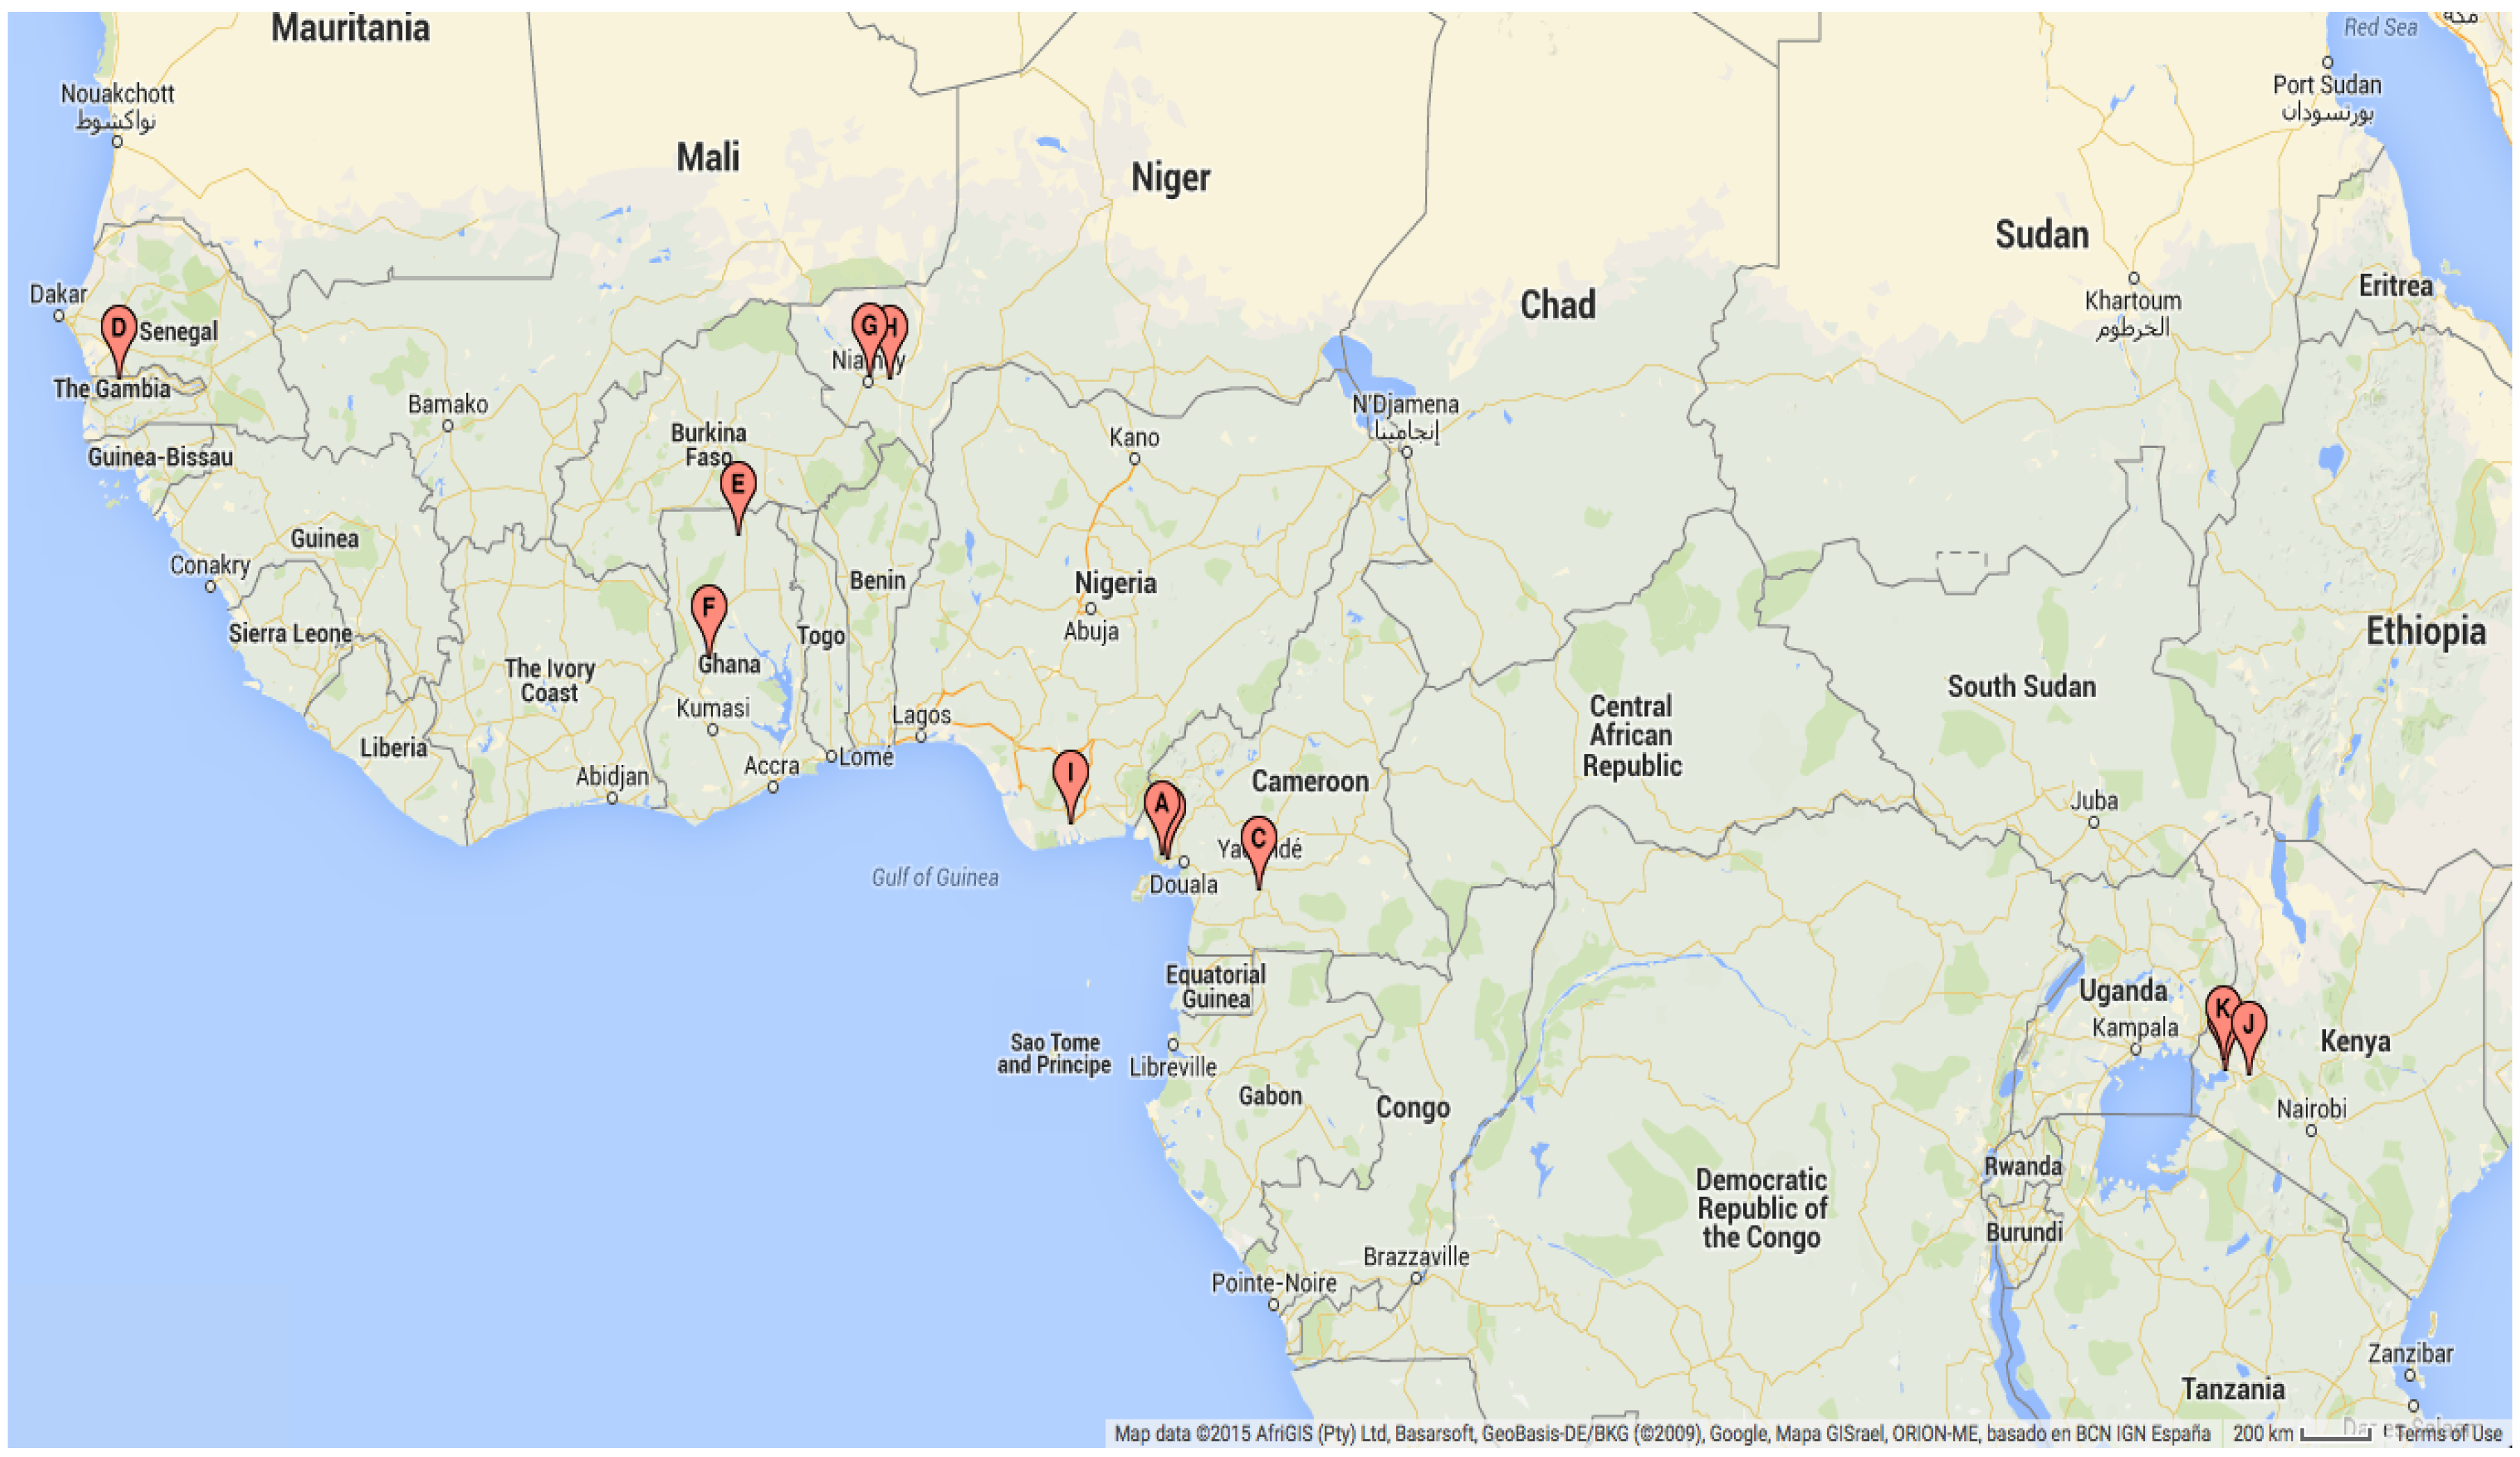
| Map Ref | Geographical Location | Study Dates | Study Duration (Months) | Mosquito Species and Stage |
|---|---|---|---|---|
| A | Likoko, Cameroon | October 2002–September 2003 | 12 | An. gambiae s.l. adults |
| B | Mutengene, Cameroon [91] | October 2004–September 2005 | 12 | An. gambiae s.s. adults |
| C | Ekombitié, Cameroon [92] | January 2007–December 2007 | 12 | An. gambiae s.l. adults |
| D | Njabakunda, The Gambia [93] | April 2007–March 2009 | 24 | An. gambiae s.s. adults |
| E | Kassena, Ghana [94] | November 2001–October 2004 | 36 | An. gambiae s.s. adults |
| F | Kintampo, Ghana [95] | November 2003–November 2005 | 25 | An. gambiae s.s. adults |
| G | Banizoumbou, Niger [96] | May 2005–December 2006 | 20 | An. gambiae s.l. adults |
| H | Zindarou, Niger [97] | July 2005–December 2006 | 18 | An. gambiae s.l. adults |
| I | Ogbakiri, Nigeria [98] | September 2005–August 2006 | 12 | An. gambiae s.l. adults |
| J | Fort Ternan, Kenya [99] | March 2006–March 2008 | 25 | An. gambiae s.l. larvae |
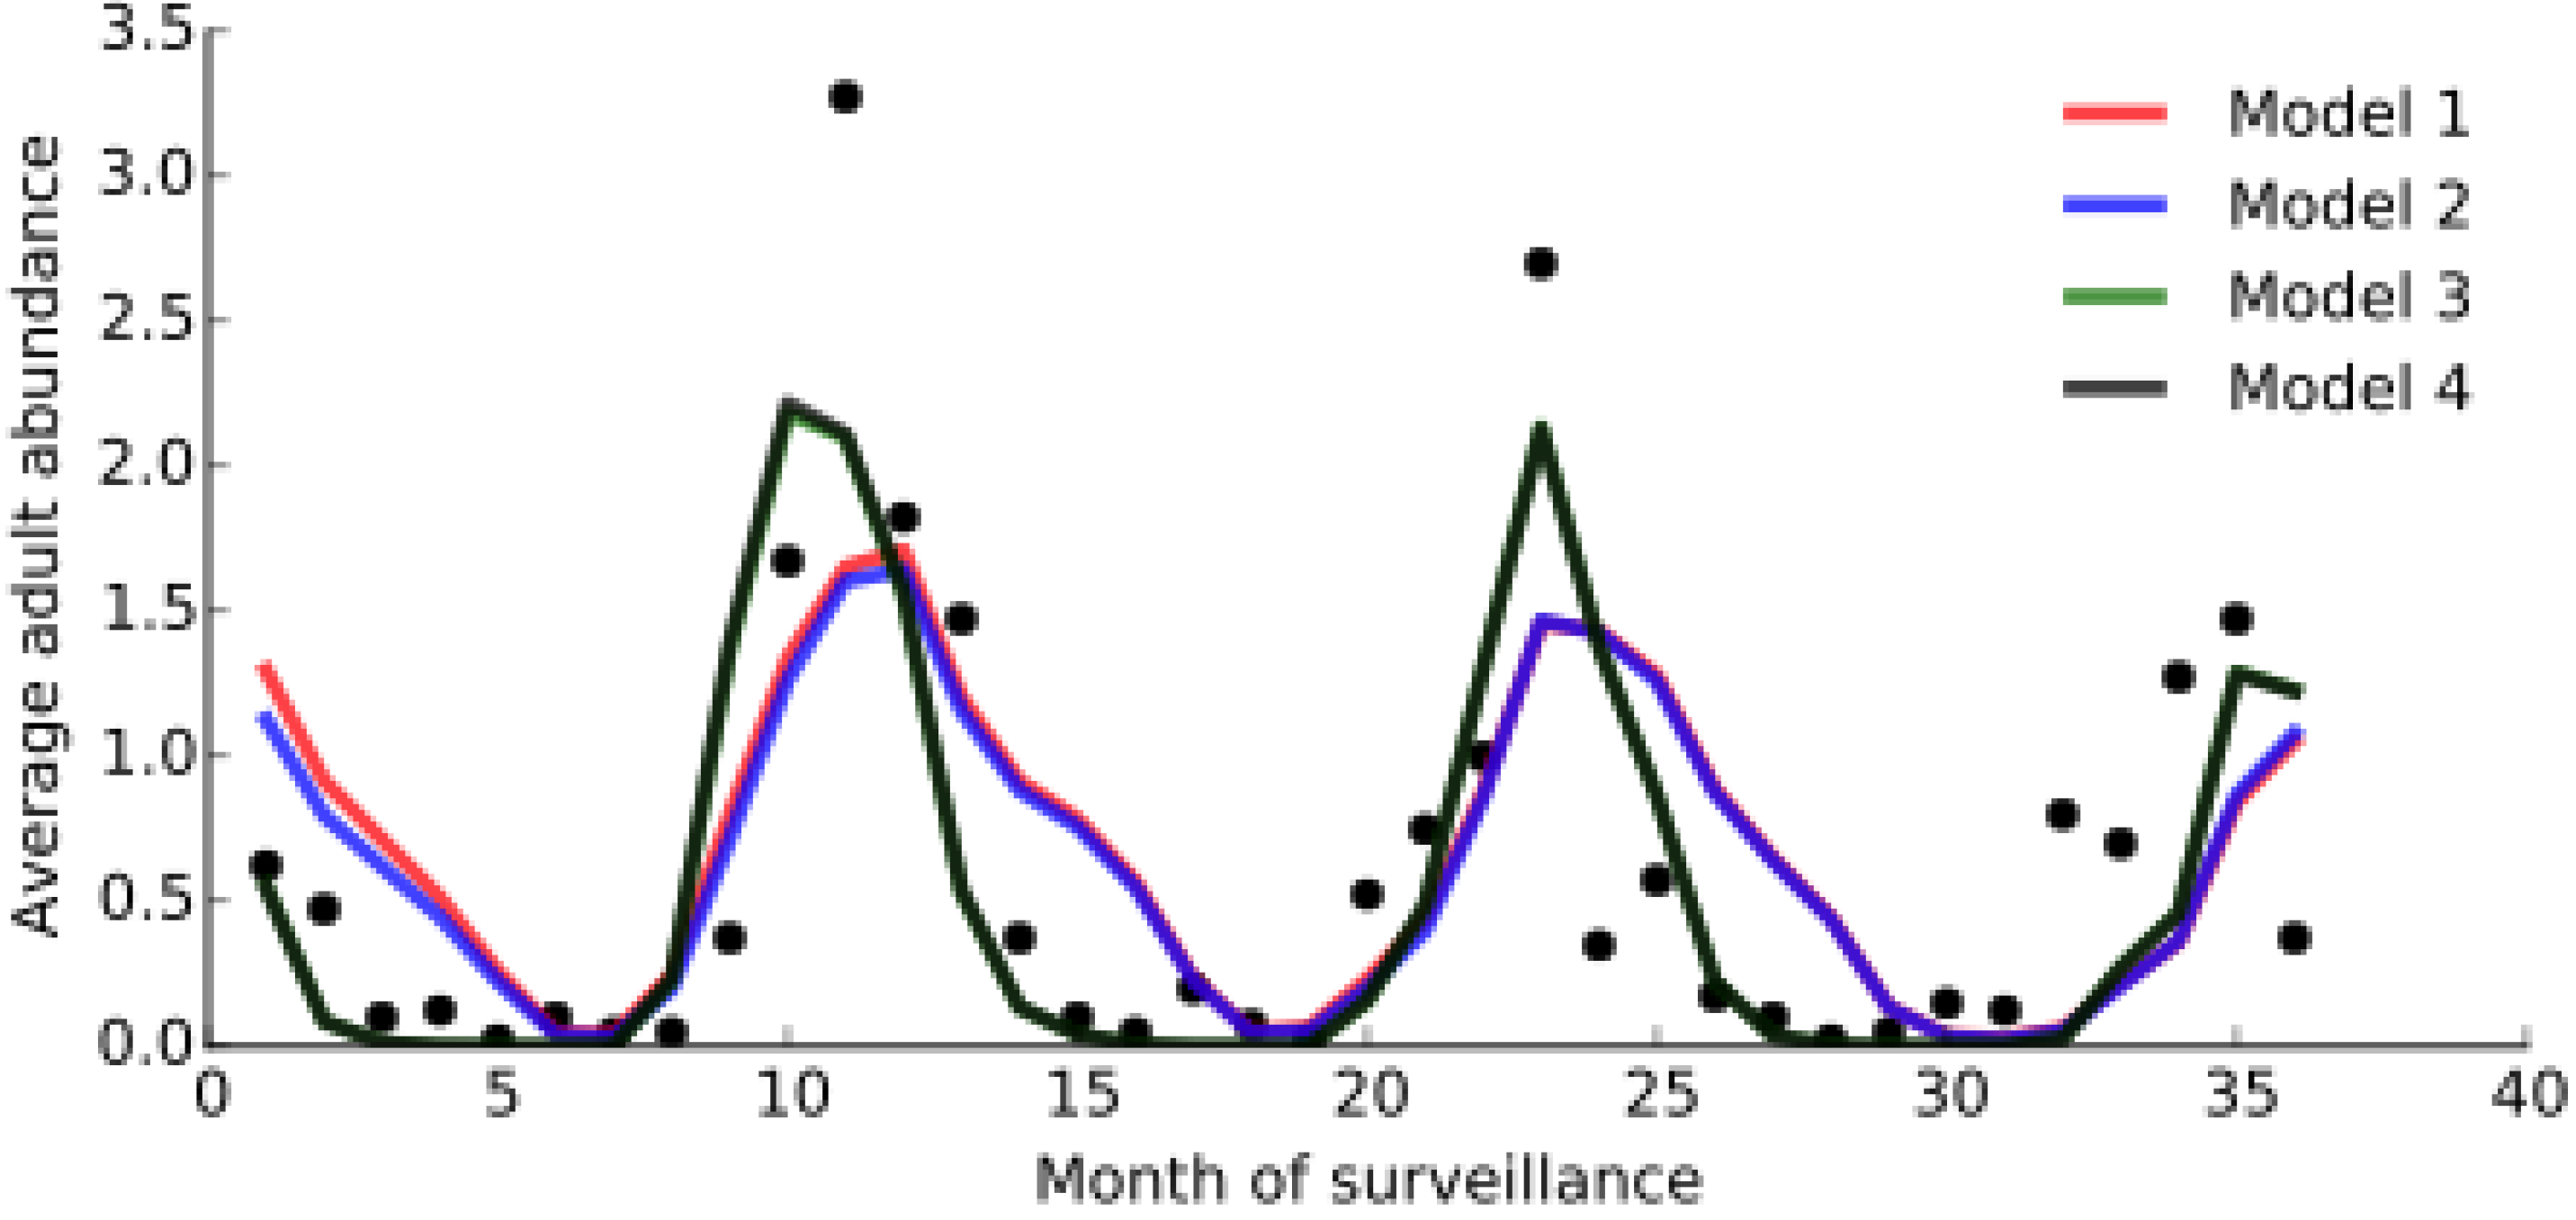
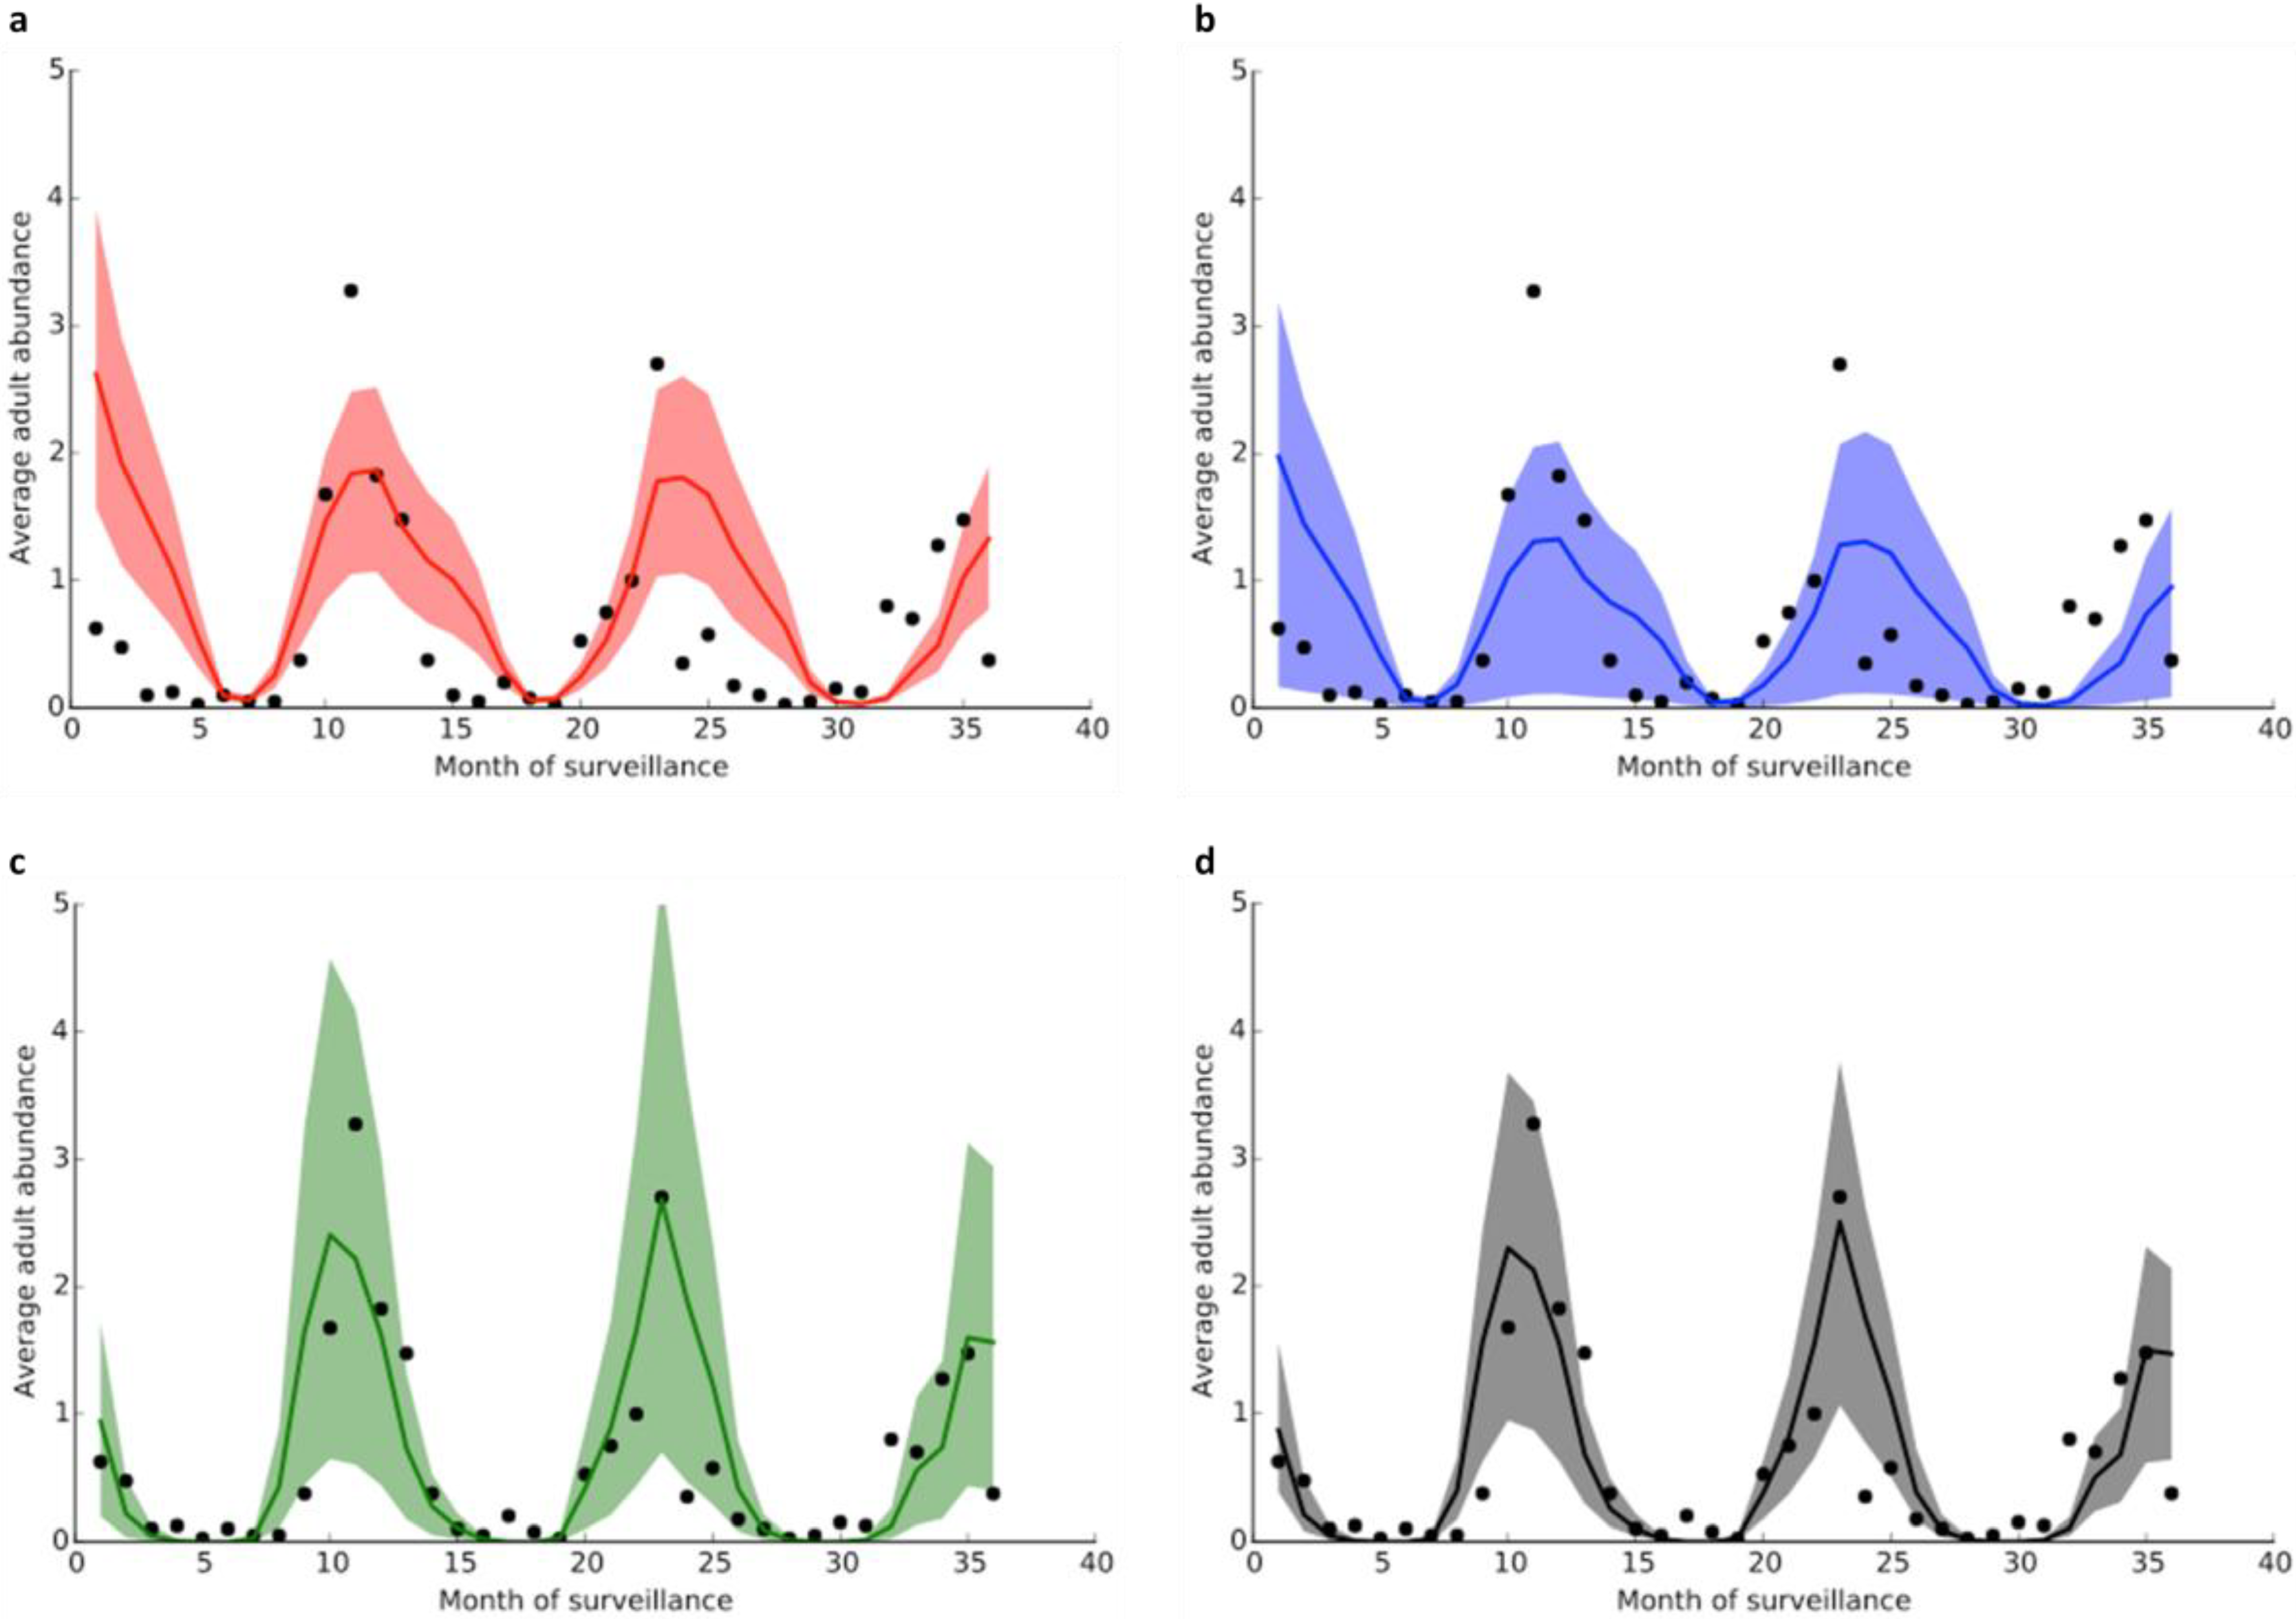
3.2. Model Fitting
| Model | Parameters | |||||
|---|---|---|---|---|---|---|
| τ | ΔT | |||||
| 1 | 0.466 | 0.636 | 0.481 | 266.915 | 0.472 | 3.066 |
| 2 | 0.026 | 0.613 | 0.485 | 16.153 | 0.689 | 7.165 |
| 3 | 34.308 | 0.72 | 0.501 | 5886.43 | 0.087 | 7.196 |
| 4 | 11.453 | 0.656 | 0.533 | 1753.52 | 0.095 | 7.092 |
| Variables | Model 1 | Model 2 | Model 3 | Model 4 |
|---|---|---|---|---|
| BIC | 174.22 | 174.18 | 173.82 | 173.82 |
| r | 0.65 | 0.66 | 0.81 | 0.81 |
4. Conclusions
Supplementary Files
Supplementary File 1Acknowledgments
Author Contributions
Abbreviations
| AIC | Akaike Information Criterion |
| An. gambiae s.s. | Anopheles gambiae sensu stricto |
| BIC | Bayesian Information Criterion |
| CI | Credible Interval |
| DD | Degree-day |
| EMAC | ECHAM5/MESSy2 Atmospheric Chemistry |
| IRS | Indoor Residual Spraying |
| LSM | Larval Source Management |
| MAP | maximum a posteriori |
| MLE | Maximum Likelihood Estimation |
| MTD | Minimum Temperature for Development |
| ODE | Ordinary Differential Equation |
| RH | Relative Humidity |
| sst | sea-surface temperature |
| sic | sea-ice coverage |
| VBD | Vector-Borne Disease |
| °C | degrees Celsius |
Conflicts of Interest
References
- Eckhoff, P.; Bever, C.; Gerardin, J.; Wenger, E. Fun with maths: Exploting implications of mathematical models for malaria eradication. Malar. J. 2014, 13, 486–491. [Google Scholar] [CrossRef] [PubMed]
- Smith, T.; Killeen, G.; Maire, N.; Ross, A.; Molineaux, L.; Tedioso, F.; Hutton, G.; Utzinger, J.; Dietz, K.; Tanner, M.; et al. Mathematical modeling of the impact of malaria vaccines on the clinical epidemiology and natural history of Plasmodium falciparum malaria: Overview. Amer. J. Trop. Med. Hyg. 2006, 75, 1–10. [Google Scholar]
- Koella, J.C. On the use of mathematical models of malaria transmission. Acta Trop. 1991, 49, 1–25. [Google Scholar] [CrossRef]
- Reiner, R.; Perkins, T.; Barker, C.; Niu, T.; Chaves, L.; Ellis, A.; George, D.; Menach, A.; Pulliam, J.; Bisanzio, D.; et al. A systematic review of mathematical models of mosquito-borne pathogen transmission: 1970–2010. J. R. Soc. Interface 2013, 10. [Google Scholar] [CrossRef] [PubMed] [Green Version]
- Pandey, A.; Mubayi, A.; Medlock, J. Comparing vector-host and SIR models for dengue transmission. Math. Biosci. 2013, 246, 252–259. [Google Scholar] [CrossRef] [PubMed]
- Martens, P. Malaria prevalence. In Health and Climate Change: Modelling the Impacts of Global Warming and Ozone Depletion; Earthscan Publications Ltd.: London, UK, 1998; p. 176. [Google Scholar]
- Rogers, D. The modelling of vector dynamics in disease research. In Modelling vector-borne and other parasitic diseases; International Laboratory for Research on Animal Diseases: Nairobi, Kenya, 1994. [Google Scholar]
- Struchiner, C.; Luz, P.; Codeço, C.; Coelho, F.; Massad, E. Current research issues in mosquito-borne diseases modeling. In Mathematical Studies on Human Disease Dynamics: Emerging Paradigms and Challenges: AMS-IMS-SIAM Joint Summer Research Conference on Modeling the Dynamics of Human Diseases: Emerging Paradigms and Challenges; American Mathematical Society: Snowbird, UT, USA, 2006. [Google Scholar]
- Beck-Johnson, L.M.; Nelson, W.A.; Paaijmans, K.P.; Read, A.F.; Thomas, M.B.; Bjørnstad, O.N. The effect of temperature on Anopheles mosquito population dynamics and the potential for malaria transmission. PLoS One 2013. [Google Scholar] [CrossRef] [PubMed]
- Lutambi, A.; Penny, M.; Smith, T.; Chitnis, N. Mathematical modelling of mosquito dispersal in a heterogeneous environment. Math. Biosci. 2013, 241, 198–216. [Google Scholar] [CrossRef] [PubMed] [Green Version]
- White, M.T.; Griffin, J.T.; Churcher, T.S.; Ferguson, N.M.; Basáñez, M.-G.; Ghani, A.C. Modelling the impact of vector control interventions on Anopheles gambiae population dynamics. Parasites Vectors 2011, 4, 153–153. [Google Scholar] [CrossRef] [PubMed]
- Hoshen, M.B.; Morse, A.P. A weather-driven model of malaria transmission. Malar. J. 2004, 3. [Google Scholar] [CrossRef] [PubMed] [Green Version]
- Depinay, J.-M.O.; Mbogo, C.M.; Killeen, G.; Knols, B.; Beier, J.; Carlson, J.; Dushoff, J.; Billingsley, P.; Mwambi, H.; Githure, J.; et al. A simulation model of African Anopheles ecology and population dynamics for the analysis of malaria transmission. Malar. J. 2004, 3. [Google Scholar] [CrossRef] [PubMed] [Green Version]
- Githeko, A.K.; Lindsay, S.W.; Confalonier, U.E.; Patz, J.A. Climate change and vector-borne diseases: A regional analysis. Bull. WHO. 2000, 78, 1136–1147. [Google Scholar] [PubMed]
- Brower, V. Vector-borne diseases and global warming: Are both on an upward swing? EMBO Rep. 2001, 2, 755–757. [Google Scholar] [CrossRef] [PubMed]
- Lipp, E.K.; Huq, A.; Colwell, R.R. Effects of global climate on infectious disease: The cholera model. Clin. Microbiol. Rev. 2002, 15, 757–770. [Google Scholar] [CrossRef] [PubMed]
- Sutherst, R.W. Global change and human vulnerability to vector-borne diseases. Clin. Microbiol. Rev. 2004, 17, 136–173. [Google Scholar] [CrossRef] [PubMed]
- Parham, P.; Christiansen-Jucht, C.; Pople, D.; Michael, E. Understanding and Modelling the Impact of Climate Change on Infectious Diseases—Progress and Future Challenges. In Climate Change—Socioeconomic Effects; Blanco, J., Kheradmand, H., Eds.; InTech: Rijeka, Croatia, 2011. [Google Scholar]
- Thomson, M. Emerging Infectious Diseases, Vector-Borne Diseases, and Climate Change. In Global Environmental Change; Freedman, B., Ed.; Handbook of Global Environmental Pollution; Springer: Dordrecht, Netherlands, 2014; pp. 623–628. [Google Scholar]
- Guo, C.; Yang, L.; Ou, C.-Q.; Li, L.; Zhuang, Y.; Yang, J.; Zhou, Y.-X.; Qian, J.; Chen, P.-Y.; Liu, Q.-Y.; et al. Malaria incidence from 2005–2013 and its associations with meteorological factors in Guangdong, China. Malar. J. 2015, 14, 116–141. [Google Scholar] [CrossRef] [PubMed]
- Parham, P.; Waldock, J.; Christophides, G.; Hemming, D.; Agusto, F.; Evans, K.; Fefferman, N.; Gaff, H.; Gumel, A.; LaDeau, S.; et al. Climate, environmental, and socio-economic change: Weighing up the balance in vector-borne disease transmission. Philos. Trans. R. Soc. B 2015. [Google Scholar] [CrossRef] [PubMed]
- Gullan, P.; Cranston, P. Chapter 6: Insect development and life histories. In The Insects: An Outline of Entomology; Wiley-Blackwell: Oxford, UK, 2010; pp. 151–188. [Google Scholar]
- Gutierrez, A.; Ponti, L.; d’Oultremont, T.; Ellis, C. Climate change effects on poikilotherm tritrophic interactions. Clim. Chang. 2008, 87, 167–192. [Google Scholar] [CrossRef]
- Lee, S.H.; Nam, K.W.; Jeong, J.Y.; Yoo, S.J.; Koh, Y.-S.; Lee, S.; Heo, S.T.; Seong, S.-Y.; Lee, K.H. The effects of climate change and globalization on mosquito vectors: Evidence from Jeju Island, South Korea on the potential for Asian tiger mosquito (Aedes albopictus) influxes and survival from Vietnam rather than Japan. PLoS One 2013. [Google Scholar] [CrossRef] [PubMed]
- Lyons, C.; Coetzee, M.; Chown, S. Stable and fluctuating temperature effects on the development rate and survival of two malaria vectors, Anopheles arabiensis and Anopheles funestus. Parasites Vectors 2013, 6. [Google Scholar] [CrossRef] [PubMed]
- Couret, J.; Benedict, M. A meta-analysis of the factors influencing development rate variation in Aedes aegypti (Diptera: Culicidae). BMC Ecol. 2014, 14. [Google Scholar] [CrossRef] [PubMed]
- Chang, L.-H.; Hsu, E.-L.; Teng, H.-J.; Ho, C.-M. Differential survival of Aedes aegypti and Aedes albopictus (Diptera: Culicidae) larvae exposed to low temperatures in Taiwan. J. Med. Entomol. 2007, 44, 205–210. [Google Scholar] [CrossRef] [PubMed]
- Farjana, T.; Tuno, N.; Higa, Y. Effects of temperature and diet on development and interspecies competition in Aedes aegypti and Aedes albopictus. Med. Vet. Entomol. 2012, 26, 210–217. [Google Scholar] [CrossRef] [PubMed]
- Mills, J.N.; Gage, K.L.; Khan, A.S. Potential influence of climate change on vector-borne and zoonotic diseases: A review and proposed research plan. Environ Health Perspect. 2010, 118, 1507–1514. [Google Scholar] [CrossRef] [PubMed]
- Mourya, D.T.; Yadav, P.; Mishra, A.C. Effect of temperature stress on immature stages and susceptibility of Aedes aegypti mosquitoes to Chikungunya virus. Amer. J. Trop. Med. Hyg. 2004, 70, 346–350. [Google Scholar]
- Moller-Jacobs, L.; Murdock, C.; Thomas, M. Capacity of mosquitoes to transmit malaria depends on larval environment. Parasites Vectors 2014, 7, 593–604. [Google Scholar] [CrossRef] [PubMed]
- Lambrechts, L.; Paaijmans, K.; Fansiri, T.; Carrington, L.; Kramer, L.; Thomas, M.; Scott, T. Impact of daily temperature fluctuations on dengue virus transmission by Aedes aegypti. Proc. Natl. Acad. Sci. USA 2011, 108, 7460–7465. [Google Scholar] [CrossRef] [PubMed]
- Ciota, A.T.; Matacchiero, A.C.; Kilpatrick, A.M.; Kramer, L.D. The Effect of temperature on life history traits of Culex mosquitoes. J. Med. Entomol. 2014, 51, 55–62. [Google Scholar] [CrossRef] [PubMed]
- Christiansen-Jucht, C.; Parham, P.E.; Saddler, A.; Koella, J.C.; Basáñez, M.-G. Temperature during larval development and adult maintenance influences the survival of Anopheles gambiae s.s. Parasites Vectors 2014, 7. [Google Scholar] [CrossRef]
- Macdonald, G. Epidemiological basis of malaria control. Bull. WHO. 1956, 15, 613–626. [Google Scholar] [PubMed]
- Garrett-Jones, C.; Shidrawi, G.R. Malaria vectorial capacity of a population of Anopheles gambiae. Bull. WHO. 1969, 40, 531–545. [Google Scholar] [PubMed]
- Kurtenbach, K.; Hanincová, K.; Tsao, J.I.; Margos, G.; Fish, D.; Ogden, N.H. Fundamental processes in the evolutionary ecology of Lyme borreliosis. Nat. Rev. Microbiol. 2006, 4, 660–669. [Google Scholar] [CrossRef] [PubMed]
- Brady, O.J.; Johansson, M.A.; Guerra, C.A.; Bhatt, S.; Golding, N.; Pigott, D.M.; Delatte, H.; Grech, M.G.; Leisnham, P.T.; Maciel-de-Freitas, R.; et al. Modelling adult Aedes aegypti and Aedes albopictus survival at different temperatures in laboratory and field settings. Parasites Vectors 2013, 6. [Google Scholar] [CrossRef] [PubMed] [Green Version]
- Gage, K.L.; Burkot, T.R.; Eisen, R.J.; Hayes, E.B. Climate and vectorborne diseases. Amer. J. Prev. Med. 2008, 35, 436–450. [Google Scholar] [CrossRef] [PubMed]
- Morin, C.W.; Comrie, A.C. Regional and seasonal response of a west Nile virus vector to climate change. Proc. Natl. Acad. Sci. USA 2013, 110, 15620–15625. [Google Scholar] [CrossRef] [PubMed]
- Talla, C.; Diallo, D.; Dia, I.; Ba, Y.; Ndione, J.-A.; Sall, A.A.; Morse, A.; Diop, A.; Diallo, M. Statistical modeling of the abundance of vectors of West African Rift Valley Fever in Barkédji, Senegal. PLoS One 2014. [Google Scholar] [CrossRef] [PubMed]
- Azil, A.H.; Long, S.A.; Ritchie, S.A.; Williams, C.R. The development of predictive tools for pre-emptive dengue vector control: A study of Aedes aegypti abundance and meteorological variables in north Queensland, Australia. Trop. Med. Int. Health 2010, 15, 1190–1197. [Google Scholar] [CrossRef] [PubMed]
- Roiz, D.; Ruiz, S.; Soriguer, R.; Figuerola, J. Climatic effects on mosquito abundance in Mediterranean wetlands. Parasites Vectors 2014, 7. [Google Scholar] [CrossRef] [PubMed]
- Tran, A.; L’Ambert, G.; Lacour, G.; Benoît, R.; Demarchi, M.; Cros, M.; Cailly, P.; Aubry-Kientz, M.; Balenghien, T.; Ezanno, P.; et al. A rainfall- and temperature-driven abundance model for Aedes albopictus populations. Int. J. Environ. Res. Public Health 2013, 10, 1698–1719. [Google Scholar] [CrossRef] [PubMed] [Green Version]
- Lunde, T.; Bayoh, M.; Lindtjørn, B. How malaria models relate temperature to malaria transmission. Parasites Vectors 2013, 6. [Google Scholar] [CrossRef] [PubMed]
- Bessell, P.R.; Searle, K.R.; Auty, H.K.; Handel, I.G.; Purse, B.V.; deC Bronsvoort, B.M. Epidemic potential of an emerging vector borne disease in a marginal environment: Schmallenberg in Scotland. Sci. Rep. 2013, 3. [Google Scholar] [CrossRef] [PubMed]
- Gething, P.; van Boeckel, T.; Smith, D.; Guerra, C.; Patil, A.; Snow, R.; Hay, S. Modelling the global constraints of temperature on transmission of Plasmodium falciparum and P. vivax. Parasites Vectors 2011, 4. [Google Scholar] [CrossRef] [PubMed]
- Hollingsworth, T.; Pulliam, J.; Funk, S.; Truscott, J.; Isham, V.; Lloyd, A. Seven challenges for modelling indirect transmission: Vector-Borne diseases, macroparasites and neglected tropical diseases. Epidemics 2015, 10, 16–20. [Google Scholar] [CrossRef] [PubMed]
- Smith, D.; Battle, K.; Hay, S.; Barker, C.; Scott, T.; McKenzie, F. Ross, macdonald, and a theory for the dynamics and control of mosquito-transmitted pathogens. PLoS Pathog. 2012, 8. [Google Scholar] [CrossRef] [PubMed]
- Chabot-Couture, G.; Nigmatulina, K.; Eckhoff, P. An environmental data set for vector-borne disease modeling and epidemiology. PLoS One 2014, 9. [Google Scholar] [CrossRef] [PubMed]
- Rumisha, S.F.; Smith, T.; Abdulla, S.; Masanja, H.; Vounatsou, P. Modelling heterogeneity in malaria transmission using large sparse spatio-temporal entomological data. Glob. Health Action 2014, 7. [Google Scholar] [CrossRef] [PubMed]
- Crespo-Pérez, V.; Dangles, O.; Régnière, J.; Chuine, I. Modeling temperature-dependent survival with small datasets: Insights from tropical mountain agricultural pests. Bull. Entomol. Res. 2013, 103, 336–343. [Google Scholar] [CrossRef] [PubMed]
- Harrington, L.; Françoisevermeylen; Jones, J.; Kitthawee, S.; Sithiprasasna, R.; Edman, J.; Scott, T. Age-dependent survival of the dengue vector Aedes aegypti (Diptera: Culicidae) demonstrated by simultaneous release-recapture of different age cohorts. J. Med. Entomol. 2008, 45, 307–313. [Google Scholar] [CrossRef] [PubMed]
- Styer, L.; Minnick, S.; Sun, A.; Scott, T. Mortality and reproductive dynamics of Aedes aegypti (Diptera: Culicidae) fed human blood. Vector-Borne Zoonotic Dis. 2007, 7, 86–98. [Google Scholar] [CrossRef] [PubMed]
- Styer, L.; Carey, J.; Wang, J.-L.; Scott, T. Mosquitoes do senesce: Departure from the paradigm of constant mortality. Amer. J. Trop. Med. Hyg. 2007, 76, 111–117. [Google Scholar]
- Sylvestre, G.; Gandini, M.; Maciel-de-Freitas, R. Age-dependent effects of oral infection with dengue virus on aedes aegypti (Diptera: Culicidae) feeding behavior, survival, oviposition success and fecundity. PLoS ONE 2013, 8. [Google Scholar] [CrossRef] [PubMed]
- MacDonald, G. The analysis of the sporozoite rate. Trop. Bull. 1952, 49, 569–586. [Google Scholar]
- Alto, B.W.; Richards, S.L.; Anderson, S.L.; Lord, C.C. Survival of West Nile virus-challenged Southern house mosquitoes, Culex pipiens quinquefasciatus, in relation to environmental temperatures. J. Vector Ecol. 2014, 39, 123–133. [Google Scholar] [CrossRef] [PubMed]
- Bellan, S.E. The importance of age dependent mortality and the extrinsic incubation period in models of mosquito-borne disease transmission and control. PLoS ONE 2010, 5. [Google Scholar] [CrossRef] [PubMed]
- Arifin, S.N.; Zhou, Y.; Davis, G.J.; Gentile, J.E.; Madey, G.R.; Collins, F.H. An agent-based model of the population dynamics of Anopheles gambiae. Malar. J. 2014, 13, 1–20. [Google Scholar] [CrossRef] [PubMed]
- Clements, A.; Paterson, G. The analysis of mortality and survival rates in wild populations of mosquitoes. J. Appl. Ecol. 1981, 18, 373–399. [Google Scholar] [CrossRef]
- Dawes, E.J.; Churcher, T.S.; Zhuang, S.; Sinden, R.E.; Basáñez, M.-G. Anopheles mortality is both age- and Plasmodium-density dependent: Implications for malaria transmission. Malar. J. 2009, 8. [Google Scholar] [CrossRef] [PubMed]
- Hancock, P.; Thomas, M.; Godfray, H.C. An age-structured model to evaluate the potential of novel malaria-control interventions: A case study of fungal biopesticide sprays. Proc. R. Soc. B. Biol. Sci. 2009, 276, 71–80. [Google Scholar] [CrossRef] [PubMed]
- Takken, W.; Koenraadt, C.J.M. Ecology of Parasite-Vector Interactions; Springer: Dordrecht, Netherlands, 2013. [Google Scholar]
- Christiansen-Jucht, C.; Parham, P.; Saddler, A.; Koella, J.; Basáñez, M.-G. Temperature during larval development and adult maintenance influences the survival of Anopheles gambiae s.s. Parasite Vector 2014. Available online: http://www.biomedcentral.com/content/pdf/s13071-014-0489-3.pdf (accessed 13 February 2015). [Google Scholar]
- Bukhari, T.; Takken, W.; Koenraadt, C.J.M. Biological tools for control of larval stages of malaria vectors—A review. Biocontrol Sci. Technol. 2013, 23, 987–1023. [Google Scholar] [CrossRef]
- Yamana, T.; Eltahir, E. Incorporating the effects of humidity in a mechanistic model of Anopheles gambiae mosquito population dynamics in the Sahel region of Africa. Parasites Vectors 2013, 6. [Google Scholar] [CrossRef] [PubMed]
- Warrell, D.; Gilles, H. Essential Malariology, 4th ed.; Hodder Arnold: London, UK, 2002. [Google Scholar]
- Parham, P.; Pople, D.; Christiansen-Jucht, C.; Lindsay, S.; Hinsley, W.; Michael, E. Modeling the role of environmental variables on the population dynamics of the malaria vector Anopheles gambiae sensu stricto. Malar. J. 2012. [Google Scholar] [CrossRef] [PubMed] [Green Version]
- Okogun, G.R.A. Life-table analysis of Anopheles malaria vectors: generational mortality as tool in mosquito vector abundance and control studies. J. Vector Borne Dis. 2005, 42, 45–53. [Google Scholar] [PubMed]
- Paaijmans, K.P.; Jacobs, A.F.G.; Takken, W.; Heusinkveld, B.G.; Githeko, A.K.; Dicke, M.; Holtslag, A.A.M. Observations and model estimates of diurnal water temperature dynamics in mosquito breeding sites in western Kenya. Hydrol. Process. 2008, 22, 4789–4801. [Google Scholar] [CrossRef]
- Wearing, H.J.; Rohani, P.; Keeling, M.J. Appropriate models for the management of infectious diseases. PLoS Med. 2005, 2. [Google Scholar] [CrossRef] [PubMed] [Green Version]
- Lloyd, A. Realistic distributions of infectious periods in epidemic models: Changing patterns of persistence and dynamics. Theor. Popul. Biol. 2001, 60, 59–71. [Google Scholar] [CrossRef] [PubMed]
- Kirby, M.J.; Lindsay, S.W. Effect of temperature and inter-specific competition on the development and survival of Anopheles gambiae sensu stricto and An. arabiensis larvae. Acta Trop. 2009, 109, 118–123. [Google Scholar] [CrossRef] [PubMed]
- Gilpin, M.E.; McClelland, G.A. Systems analysis of the yellow fever mosquito Aedes aegypti. Fortschr. Zool. 1979, 25, 355–388. [Google Scholar] [PubMed]
- Legros, M.; Lloyd, A.L.; Huang, Y.; Gould, F. Density-dependent intraspecific competition in the larval stage of Aedes aegypti (Diptera: Culicidae): Revisiting the current paradigm. J. Med. Entomol. 2009, 46, 409–419. [Google Scholar] [CrossRef] [PubMed]
- Molineaux, L.; Gramiccia, G. The Garki Project; World Health Organization: Geneva, Switzerland, 1980. [Google Scholar]
- Zwiefelhofer, D. Find Latitude and Longitude. Available online: http://www.findlatitudeandlongitude.com (accessed on 13 February 2015).
- Batch Geo LLC. Available online: http://batchgeo.com/ (accessed on 13 February 2015).
- Collett, D. Modelling survival data in medical research, 2nd ed.; Chapman and Hall/CRC: London, UK, 2003. [Google Scholar]
- Kass, R.; Raftery, A. Bayes factors. J. Amer. Stat. Assoc. 1995, 90, 773–795. [Google Scholar] [CrossRef]
- Bolker, B. Chapter 6: Likelihood and all that. In Ecological Models and Data in R; Princeton University Press: Princeton, NJ, USA, 2008; p. 408. [Google Scholar]
- Kirk, P.; Thorne, T.; Stumpf, M.P.H. Model selection in systems and synthetic biology. Curr. Opin. Biotechnol. 2013, 24, 767–774. [Google Scholar] [CrossRef] [PubMed]
- Brooks, S.; Gelman, A.; Jones, G.; Meng, X.-L. Handbook of Markov Chain Monte Carlo, 1st ed.; Chapman and Hall/CRC: London, UK, 2011. [Google Scholar]
- Gutenkunst, R.N.; Waterfall, J.J.; Casey, F.P.; Brown, K.S.; Myers, C.R.; Sethna, J.P. Universally sloppy parameter sensitivities in systems biology models. PLoS Comput. Biol. 2007, 3. [Google Scholar] [CrossRef] [PubMed]
- Erguler, K.; Stumpf, M.P.H. Practical limits for reverse engineering of dynamical systems: A statistical analysis of sensitivity and parameter inferability in systems biology models. Mol. Biosyst. 2011, 7, 1593–1602. [Google Scholar] [CrossRef] [PubMed]
- Roeckner, E.; Bäuml, G.; Bonaventura, L.; Brokopf, R.; Esch, M.; Giorgetta, M.; Hagemann, S.; Kirchner, I.; Kornblueh, L.; Manzini, E.; et al. Part I: Model Description. The Atmospheric General Circulation Model ECHAM5; Max Planck Institut für Meteorologie: Hamburg, Germany, 2003; p. 127. [Google Scholar]
- Jöckel, P.; Tost, H.; Pozzer, A.; Brühl, C.; Buchholz, J.; Ganzeveld, L.; Hoor, P.; Kerkweg, A.; Lawrence, M.G.; Sander, R.; et al. The atmospheric chemistry general circulation model ECHAM5/MESSy1: Consistent simulation of ozone from the surface to the mesosphere. Atmos. Chem. Phys. 2006, 6, 5067–5104. [Google Scholar] [CrossRef]
- Proestos, Y.; Christophides, G.K.; Ergüler, K.; Tanarhte, M.; Waldock, J.; Lelieveld, J. Present and future projections of habitat suitability of the Asian tiger mosquito, a vector of viral pathogens, from global climate simulation. Philos. Trans. R. Soc. Lond. B Biol. Sci. 2015, 370. [Google Scholar] [CrossRef] [PubMed]
- Taylor, K.; Williamson, D.; Zwiers, F. The Sea Surface Temperature and Sea-Ice Concentration Boundary Conditions for AMIP II Simulations; Climate and Global Dynamics Division, UCAR: Boulder, Co, USA, 2000; p. 25. [Google Scholar]
- Tanga, M.C.; Ngundu, W.I.; Tchouassi, P.D. Daily survival and human blood index of major malaria vectors associated with oil palm cultivation in Cameroon and their role in malaria transmission. Trop. Med. Int. Health 2011, 16, 447–457. [Google Scholar] [CrossRef] [PubMed]
- Fils, E.; Ntonga, P.; Belong, P.; Messi, J. Contribution of mosquito vectors in malaria transmission in an urban district of southern Cameroon. J. Entomol. Nematol. 2010, 2, 13–17. [Google Scholar]
- Nwakanma, D.C.; Neafsey, D.E.; Jawara, M.; Adiamoh, M.; Lund, E.; Rodrigues, A.; Loua, K.M.; Konate, L.; Sy, N.; Dia, I.; et al. Breakdown in the process of incipient speciation in anopheles gambiae. Genetics 2013, 193, 1221–1231. [Google Scholar] [CrossRef] [PubMed]
- Kasasa, S.; Asoala, V.; Gosoniu, L.; Anto, F.; Adjuik, M.; Tindana, C.; Smith, T.; Owusu-Agyei, S.; Vounatsou, P. Spatio-temporal malaria transmission patterns in Navrongo demographic surveillance site, northern Ghana. Malar. J. 2013, 12. [Google Scholar] [CrossRef] [PubMed] [Green Version]
- Dery, D.B.; Brown, C.; Asante, K.P.; Adams, M.; Dosoo, D.; Amenga-Etego, S.; Wilson, M.; Chandramohan, D.; Greenwood, B.; Owusu-Agyei, S.; et al. Patterns and seasonality of malaria transmission in the forest-savannah transitional zones of Ghana. Malar. J. 2010, 9. [Google Scholar] [CrossRef] [PubMed]
- Gianotti, R.L.; Bomblies, A.; Dafalla, M.; Issa-Arzika, I.; Duchemin, J.-B.; Eltahir, E.A. Efficacy of local neem extracts for sustainable malaria vector control in an African village. Malar. J. 2008, 7. [Google Scholar] [CrossRef] [PubMed]
- Bomblies, A.; Duchemin, J.-B.; Eltahir, E.A. A mechanistic approach for accurate simulation of village scale malaria transmission. Malar. J. 2009, 8. [Google Scholar] [CrossRef] [PubMed]
- Uttah, E.C.; Ibe, D.; Wokem, G.N. Filariasis control in coastal Nigeria: Predictive significance of baseline entomological indices of Anopheles. gambiae s.l. (Diptera: Culicidae). Int. Sch. Res. Not. 2013, 2013. [Google Scholar] [CrossRef]
- Imbahale, S.S.; Paaijmans, K.P.; Mukabana, W.R.; van Lammeren, R.; Githeko, A.K.; Takken, W. A longitudinal study on Anopheles mosquito larval abundance in distinct geographical and environmental settings in western Kenya. Malar. J. 2011, 10. [Google Scholar] [CrossRef] [PubMed]
- Churcher, T.S.; Trape, J.-F.; Cohuet, A. Human-to-mosquito transmission efficiency increases as malaria is controlled. Nat. Commun. 2015, 6. [Google Scholar] [CrossRef] [PubMed]
- Tebaldi, C.; Knutti, R. The use of the multi-model ensemble in probabilistic climate projections. Philos. Trans. R. Soc. Lond. Math. Phys. Eng. Sci. 2007, 365, 2053–2075. [Google Scholar] [CrossRef] [PubMed]
- Webster, M.; Sokolov, A. Quantifying the Uncertainty in Climate Predictions; Joint Program on the Science and Polocy of Global Change, Massachusetts Institute of Technology: Boston, MA, USA, 1998. [Google Scholar]
- Bilcke, J.; Beutels, P.; Brisson, M.; Jit, M. Accounting for methodological, structural, and parameter uncertainty in decision-analytic models. Med. Decis. Mak. 2011, 31, 675–692. [Google Scholar] [CrossRef] [PubMed]
- Olayemi, I.K.; Ande, A.T. Life table analysis of Anopheles gambiae (Diptera: Culicidae) in relation to malaria transmission. J. Vector Borne Dis. 2009, 46, 295–298. [Google Scholar] [PubMed]
- Bayoh, M.N.; Lindsay, S.W. Effect of temperature on the development of the aquatic stages of Anopheles gambiae sensu stricto (Diptera: Culicidae). Bull. Entomol. Res. 2003, 93, 375–381. [Google Scholar] [CrossRef] [PubMed]
- Bayoh, M.; Lindsay, S. Temperature-related duration of aquatic stages of the Afrotropical malaria vector mosquito Anopheles gambiae in the laboratory. Med. Vet. Entomol. 2004, 18, 174–179. [Google Scholar] [CrossRef] [PubMed]
- Nisbet, R.M.; Gurney, W.S.C. The systematic formulation of population models for insects with dynamically varying instar duration. Theor. Popul. Biol. 1983, 23, 114–135. [Google Scholar] [CrossRef]
- Eckhoff, P. A malaria transmission-directed model of mosquito life cycle and ecology. Malar. J. 2011, 10. [Google Scholar] [CrossRef] [PubMed]
- Young, L.; Young, J. Degree-day models. In Statistical Ecology: A Population Perspective; Kluwer Academic Publishers: Boston, MA, USA, 2002; pp. 421–439. [Google Scholar]
- Ahumada, J.A.; Lapointe, D.; Samuel, M.D. Modeling the population dynamics of Culex quinquefasciatus (Diptera: Culicidae), along an elevational gradient in Hawaii. J. Med. Entomol. 2004, 41, 1157–1170. [Google Scholar] [CrossRef] [PubMed]
- Jones, V.; Brunner, J. Degree-day models. In Orchard Pest Management; Washington State University: Washington, DC, USA, 2015. [Google Scholar]
- Egizi, A.; Fefferman, N.H.; Fonseca, D.M. Evidence that implicit assumptions of “no evolution” of disease vectors in changing environments can be violated on a rapid timescale. Philos. Trans. R. Soc. Lond. B Biol. Sci. 2015, 370. [Google Scholar] [CrossRef] [PubMed]
- Sinka, M.; Bangs, M.; Manguin, S.; Coetzee, M.; Mbogo, C.; Hemingway, J.; Patil, A.; Temperley, W.; Gething, P.; Kabaria, C.; et al. The dominant Anopheles vectors of human malaria in Africa, Europe and the Middle East: Occurrence data, distribution maps and bionomic précis. Parasites Vectors 2010, 3. [Google Scholar] [CrossRef] [PubMed]
© 2015 by the authors; licensee MDPI, Basel, Switzerland. This article is an open access article distributed under the terms and conditions of the Creative Commons Attribution license (http://creativecommons.org/licenses/by/4.0/).
Share and Cite
Christiansen-Jucht, C.; Erguler, K.; Shek, C.Y.; Basáñez, M.-G.; Parham, P.E. Modelling Anopheles gambiae s.s. Population Dynamics with Temperature- and Age-Dependent Survival. Int. J. Environ. Res. Public Health 2015, 12, 5975-6005. https://doi.org/10.3390/ijerph120605975
Christiansen-Jucht C, Erguler K, Shek CY, Basáñez M-G, Parham PE. Modelling Anopheles gambiae s.s. Population Dynamics with Temperature- and Age-Dependent Survival. International Journal of Environmental Research and Public Health. 2015; 12(6):5975-6005. https://doi.org/10.3390/ijerph120605975
Chicago/Turabian StyleChristiansen-Jucht, Céline, Kamil Erguler, Chee Yan Shek, María-Gloria Basáñez, and Paul E. Parham. 2015. "Modelling Anopheles gambiae s.s. Population Dynamics with Temperature- and Age-Dependent Survival" International Journal of Environmental Research and Public Health 12, no. 6: 5975-6005. https://doi.org/10.3390/ijerph120605975