Article

Investigation of the Effects of Perfluorooctanoic Acid (PFOA) and Perfluorooctane Sulfonate (PFOS) on Apoptosis and Cell Cycle in a Zebrafish (Danio rerio) Liver Cell Line

Chinese Academy of Inspection and Quarantine, Beijing 100123, China
*
Author to whom correspondence should be addressed.
Int. J. Environ. Res. Public Health 2015, 12(12), 15673-15682; https://doi.org/10.3390/ijerph121215012
Submission received: 9 June 2015 / Revised: 19 October 2015 / Accepted: 26 November 2015 / Published: 9 December 2015

Abstract

:
This study aimed to explore the effects of perfluorooctanoic acid (PFOA) and perfluorooctane sulfonate (PFOS) on apoptosis and cell cycle in a zebrafish (Danio rerio) liver cell line (ZFL). Treatment groups included a control group, PFOA-IC50, PFOA-IC80, PFOS-IC50 and PFOS-IC80 groups. IC50 and IC80 concentrations were identified by cellular modeling and MTT assays. mRNA levels of p53, Bcl-2, Bax, Caspase-3 and NF-κB p65 were detected by qPCR. Cell apoptosis and cell cycle were detected by flow cytometry and the protein levels of p53, Bcl-2, Bax, Caspase-3 and NF-κB p65 were determined by western blotting. Both PFOA and PFOS inhibited the growth of zebrafish liver cells, and the inhibition rate of PFOS was higher than that of PFOA. Bcl-2 expression levels in the four groups were significantly higher than the control group and Bcl-2 increased significantly in the PFOA-IC80 group. However, the expression levels of Bax in the four treatment groups were higher than the control group. The percentage of cell apoptosis increased significantly with the treatment of PFOA and PFOS (p < 0.05). Cell cycle and cell proliferation were blocked in both the PFOA-IC80 and PFOS-IC80 groups, indicating that PFOA-IC80 and PFOS-IC50 enhanced apoptosis in ZFL cells.

1. Introduction

Multicellular animals dispose of unneeded or damaged cells in an ordered fashion by apoptosis [1]. Apoptosis is a programmed cell death pathway that removes damaged cells to protect the body, and it is especially important in vertebrate embryonic development [2]. The relationship between stress-induction and apoptosis during the development has been confirmed by experimental studies using zebrafish (Danio rerio) embryos, and researches on apoptotic genes, including the Bcl-2 gene family, p53, and the caspase family, are still under the spotlight [3,4,5,6]. Many apoptosis related genes in mammals were first identified in zebrafish, which implies the high degree of conservation within the apoptosis pathway across species [7]. Accordingly, zebrafish is considered to be an effective animal model to reveal the relationship between stress-induction and apoptosis.
Perfluorinated chemicals (PFCs) are synthesized fluorinated compounds composed of a carbon backbone that is typically 4–14 atoms in length and a charged moiety, primarily a carboxylate or sulfonate. Perfluorooctanoic acid (PFOA) and perfluorooctane sulfonate (PFOS) are two of the most widely used PFCs. PFOA and PFOS have already been considered as emerging persistent organic pollutants [8]. The distribution of PFOA and PFOS in the environment has increased universally in recent years [9] and their accumulation and toxic effects have become serious issues to be addressed [10]. PFOS and PFOA are important PFCs with hydrophobic and oleophobic properties [11], which are widely used in carpet, leather, paper, and fiber manufacture, as well as the textile industry and other consumer products.
Previous studies have reported on the toxicology of PFOA and PFOS. PFOA and PFOS can be found in the liver, serum and other tissues of humans and animals [12]. For rats chronic exposure to PFOA and PFOS is associated with tumor development in the liver, pancreas and testis [13,14,15]. Furthermore, PFOS has been reported to induce in vivo hepatocellular hypertrophy, lipid vacuolation, loss of body weight, and lower serum total cholesterol in monkeys [16]. Guruge et al. found that gene regulation related with cell communication, growth and apoptosis, and fatty acid metabolisms in rats after exposure to PFOA [17]. In addition, PFOA had a toxic effect on the liver, not on the kidney, in mice exposed to PFOA in their drinking water [18].
Mechanistically, some reports showed that PFOA induced apoptosis in a dose- and time-dependent manner in hepatoma HepG2 cells [19,20]. Moreover, genotoxic risk and oxidative DNA damage was reported in HepG2 cells exposed to PFOA [21]. Similarly, Liu et al. demonstrated that PFOA and PFOS were individually able to produce oxidative stress and induce apoptosis through the involvement of caspases in primary cultured tilapia (Oreochromis niloticus) hepatocytes [22].
However, there has been no investigation into the effects of PFOA and PFOS on apoptosis in the zebrafish liver cell line (ZFL). In this study, accordingly, we aimed to detect the mRNA and protein levels of apoptosis related genes in ZFL and to explore the mechanisms how PFOA and PFOS mediate apoptosis in ZFL.

2. Materials and Methods

2.1. ZFL Culture

ZFL was obtained from American Type Culture Collection (ATCC, Rockville, MD, USA). The cell line was cultured in a medium consisted of 50% Leibovitz L-15 (Gibco BRL Co. Ltd. Gaithersburg, MD, USA), 15% Ham F-12 (Gibco) and 35% Dulbecco’s modified eagle medium (DMEM; Gibco), supplemented with 50 ng/mL epidermal growth factor (EGF; Gibco), 0.01 mg/mL insulin (Sigma), 15 mM 4-(2-hydroxyethyl)-1-piperazineethanesulfonic acid (HEPES; Gibco) and 5% fetal bovine serum (FBS; Gibco) at 37 °C and saturated with 5% CO2 in a humidified atmosphere. Next, 10% dimethyl sulfoxide (DMSO) and 90% FBS were suspended as cell freezing medium. All the ZFL cells were recovered in a conventional method and observed [23]. The ZFL cells were seeded on 96-well plates with a cell density of 1 × 10⁴ per well and incubated overnight to achieve a 85% confluence, and then the cells were sub-cultured and frozen.

2.2. Cellular Modeling and MTT Assay

50% inhibitory concentration (IC50) and 80% inhibitory concentration (IC80) were measured by MTT assays. ZFL cells were treated with 100, 50, 25, 12.5, 6.25, 3.125, 1.062, 0.53, 0.2605, 0.130, 0.065 and 0 μg/mL of PFOA or PFOS for 48 h, respectively. Cells were incubated for 4 h after 100 μL serum-free medium and 10 μL MTT were added. ODs were detected at 490 nm after the 100-μL solubilization buffer (10% SDS + 0.01M HCl) was added.

2.3. Quantitative Real Time-Polymerase Chain Reaction (qPCR)

Total RNA was extracted using a RNA Extraction Kit according to the manufacturer’s instructions (CWbio, Beijing, China). Reverse transcription was performed by HiFi-MMLVcDNA (KITCWbio. Co. Ltd., Beijing, China). The PCR conditions were as follows: 45 cycles at 95 °C for 10 min, 95 °C for 15 s and 60 °C for 60 s successively. β-Actin was used as an internal control in the experiment. All reactions were completed in triplicate using independently-extracted RNA and the relative expression levels were detected by fluorescence ratio PCR instrument (ABI 7500) and calculated using the 2−ΔΔCt comparative CT method. Gene-specific primers for qPCR are listed in Table 1.

2.4. Flow Cytometry of Cell Apoptosis Detection

Annexin V-FITC-PI kit (Beijing 4A Biotech Co., Ltd., Beijing, China) was used for detecting cell apoptosis by flow cytometry. Annexin V is a Ca2+-dependent phospholipid-binding protein that has a high affinity for phospholipid phosphatidylserine (PS), and is useful for identifying apoptotic cells with exposed PS. Propidium iodide (PI) is a standard flow cytometric viability probe and is used to distinguish viable from nonviable cells, as intact membranes of viable cells exclude PI while membranes of dead or damaged cells are permeable to PI. Briefly, single-cell suspension of 1 × 10⁶ cells was added into a 1.5-mL centrifuge tube, centrifuged at 300× g for 5 min, and the supernatant was discarded. Afterwards, 1 mL of PBS was added to the cell pellet, and the samples were centrifuged at 300× g. This above washing procedure was repeated twice. Subsequently, 100 μL of binding buffer, 5 μL Annexin V-FITC and 10 μL PI were added and the samples were incubated at room temperature for 15 min, ensuring no exposure to light. Finally, 400 μL binding buffer was added to the samples and cell apoptosis was detected by flow cytometry. A software package called Cellquest was used to analyze cell apoptosis.
Table 1. Primer sequences for RT-PCR.
PrimerSequences (5′ to 3′)PCR Fragments (bp)
P53 forward primerCCACCATGAGAGAACACCTGAT144
P53 reverse primerGCTGAGGAGCTTCATAGAGAACC
Bcl-2 forward primerTGGGCTCATCTCCTTCTCC178
Bcl-2 reverse primerTCTCCTCACAGCTCCACATC
Bax forward primerGGAGGCGATACGGGCAGT151
Bax reverse primerTTGCGAATCACCAATGCTGTG
Caspase-3 forward primerACTGATGGTTCTGTGGAGC200
Caspase-3 reverse primerCGCATAGAGGAAGTCTGCTT
NFKBNF-κB p65 forward primerAAGATGAGAACGGAGACACGC404
NFKBNF-κB p65 reverse primerTACCAGCAATCGCAAACAACG
B-actin forward primerCAGGGCGTGATGGTGGGGAT226
β-actin reverse primerGGTTGGCTTTGGGGTTGAG
GAPDH forward primerAGTTGTAAGCAATGCCTCCTG191
GAPDH reverse primerCTGGGATGATGTTCTGACTGG
B2M forward primerGCACTCATCACTTTTGCACTTC135
B2M reverse primerGCTCACATAGCAGATCAGGGT

2.5. Cell Cycle Analysis

4 × 10⁵ cells were seeded into 6-well plates, synchronized by serum starvation for 24 h, and re-entered into the cell cycle by an exchange of a medium with 10% FBS DMEM for 24 h. Both adherent and non-adherent cells were harvested and fixed in 70% ethanol at 4 °C overnight. Cells were incubated with RNase A at 37 °C for 30 min and then stained with PI. Cell cycle status was measured by flow cytometry.

2.6. Western Blot Assay

Cells were lysed with RIPA buffer and the proteins lysates were separated using 12% SDS-PAGE. The proteins were transferred onto a PVDF membrane for 1 h and then the membrane was incubated with primary antibody overnight at 4 °C after being blocked with 3% BSA-TBST solution for 30 min. The membrane was washed with TBST solution three times, 10 min each time. Then the membrane was incubated with secondary antibody (Beijing TDY Biotech Co., Ltd., Beijing, China) for 2 h at room temperature. Finally, the membrane was developed after being washed again with TBST solution three times, 10 min each time. The protein expressions of p53 (Beijing TDY Biotech Co., Ltd.), Caspase 3 (Abcam, Cambridge, UK) and Bcl-2 (Beijing TDY Biotech Co., Ltd.) were detected by western blotting. GAPDH (Beijing TDY Biotech Co., Ltd.) and B2M (Beijing TDY Biotech Co., Ltd.) were used as an internal control for the experiment.

2.7. Statistical Analysis

Statistical analysis was performed using the software package SPSS 13.0 (SPSS, Inc., Chicago, IL, USA) Data are represented as the mean value and statistical significance was determined by one-way ANOVA. Differences were considered significant at p < 0.05.

3. Results

3.1. Detection of IC50 and IC80 Concentrations
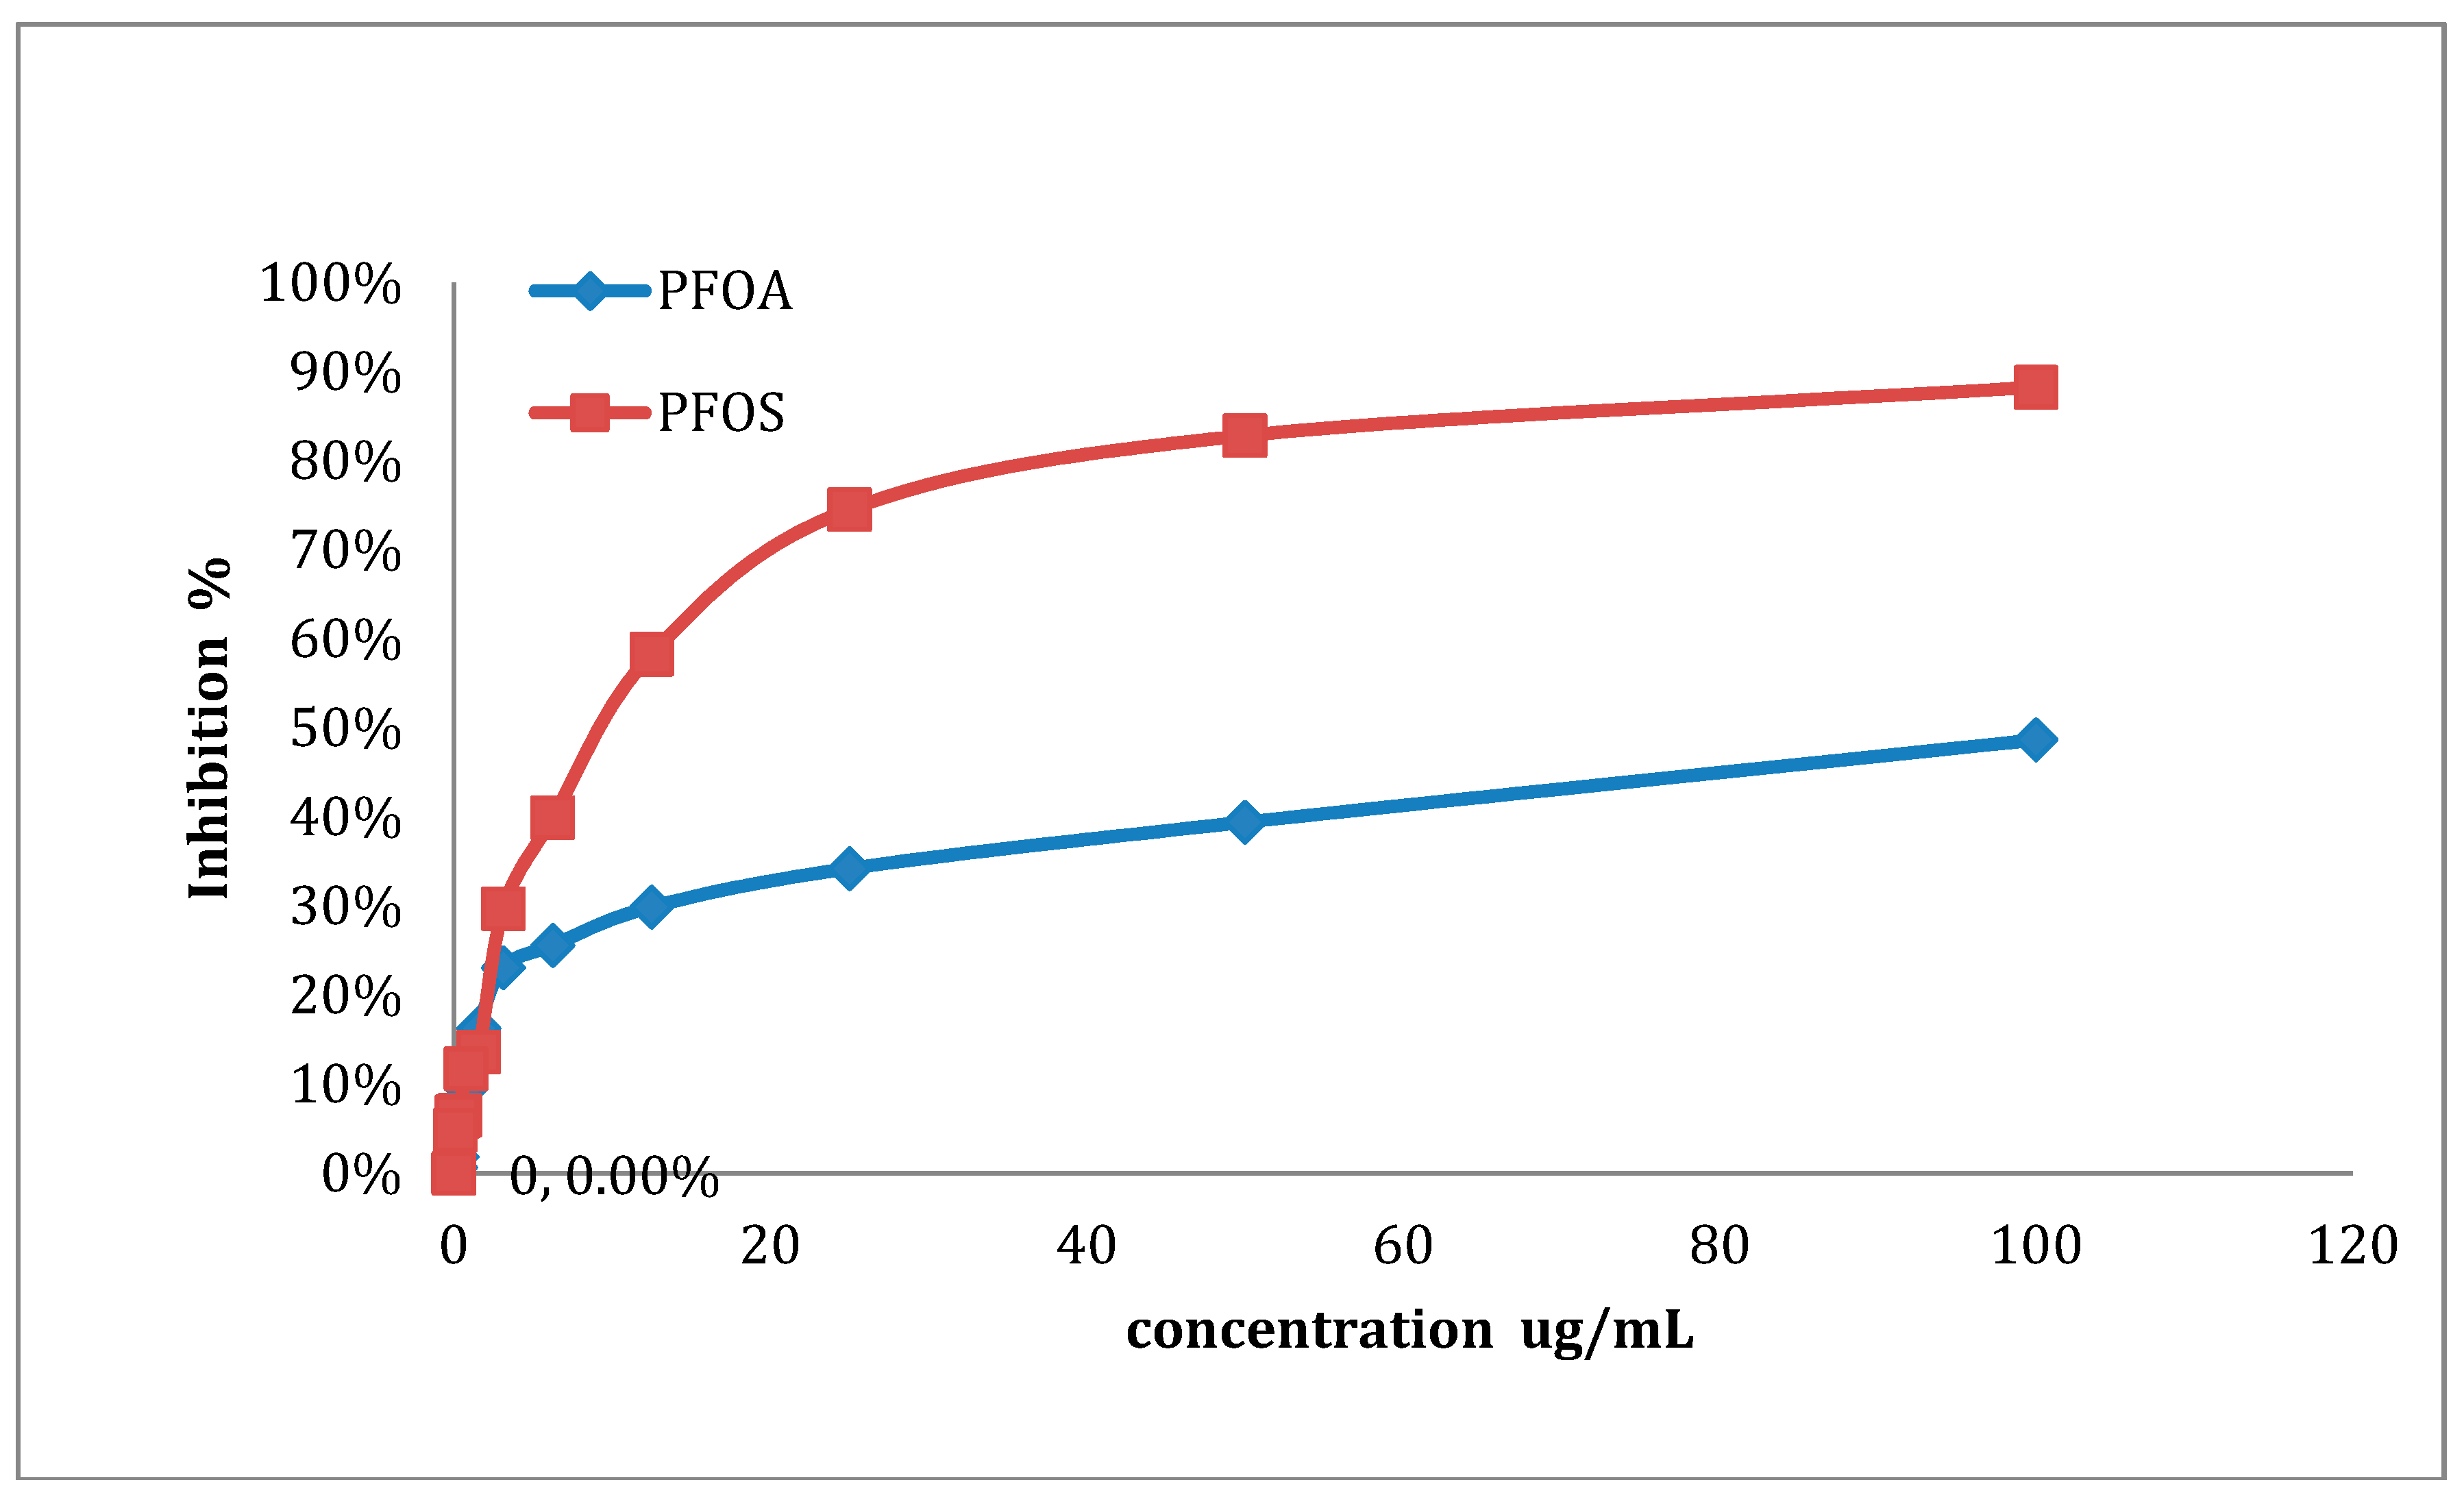
To determine the IC50 and IC80 concentrations of PFOA and PFOS, ZFL cells were treated with different concentrations of PFOA or PFOS, and the inhibition rate was determined by an MTT assay (see Figure 1). As shown in Figure 1, both PFOA and PFOS could inhibit zebrafish liver cells. Moreover, the inhibition rate of PFOS was higher than that of PFOA. As summarized in Table 2, the IC50 and IC80 concentrations of PFOA were 84.76 μg/mL and 150.97 μg/mL, respectively (the IC80 for PFOA was extrapolated) The IC50 and IC80 concentrations of PFOS were 27.92 μg/mL and 56.77 μg/mL, respectively. The subsequent experiments were performed on IC50 and IC80 samples of PFOA and PFOS.
Figure 1. Inhibition rate of PFOS and PFOA in ZFL cells. ZFL cells were treated with 100 μg/mL, 50, 25, 12.5, 6.25, 3.125, 1.062, 0.53, 0.2605, 0.130, 0.065 or 0 μg/mL of either PFOA or PFOS for 48 h. The inhibition rate was determined by MTT assay.
Ijerph 12 15012 g001
Table 2. IC50 and IC80 of PFOA and PFOS.
SubstancesIC50IC80
PFOA (μg/mL)84.76150.97
PFOS (μg/mL)27.9256.77

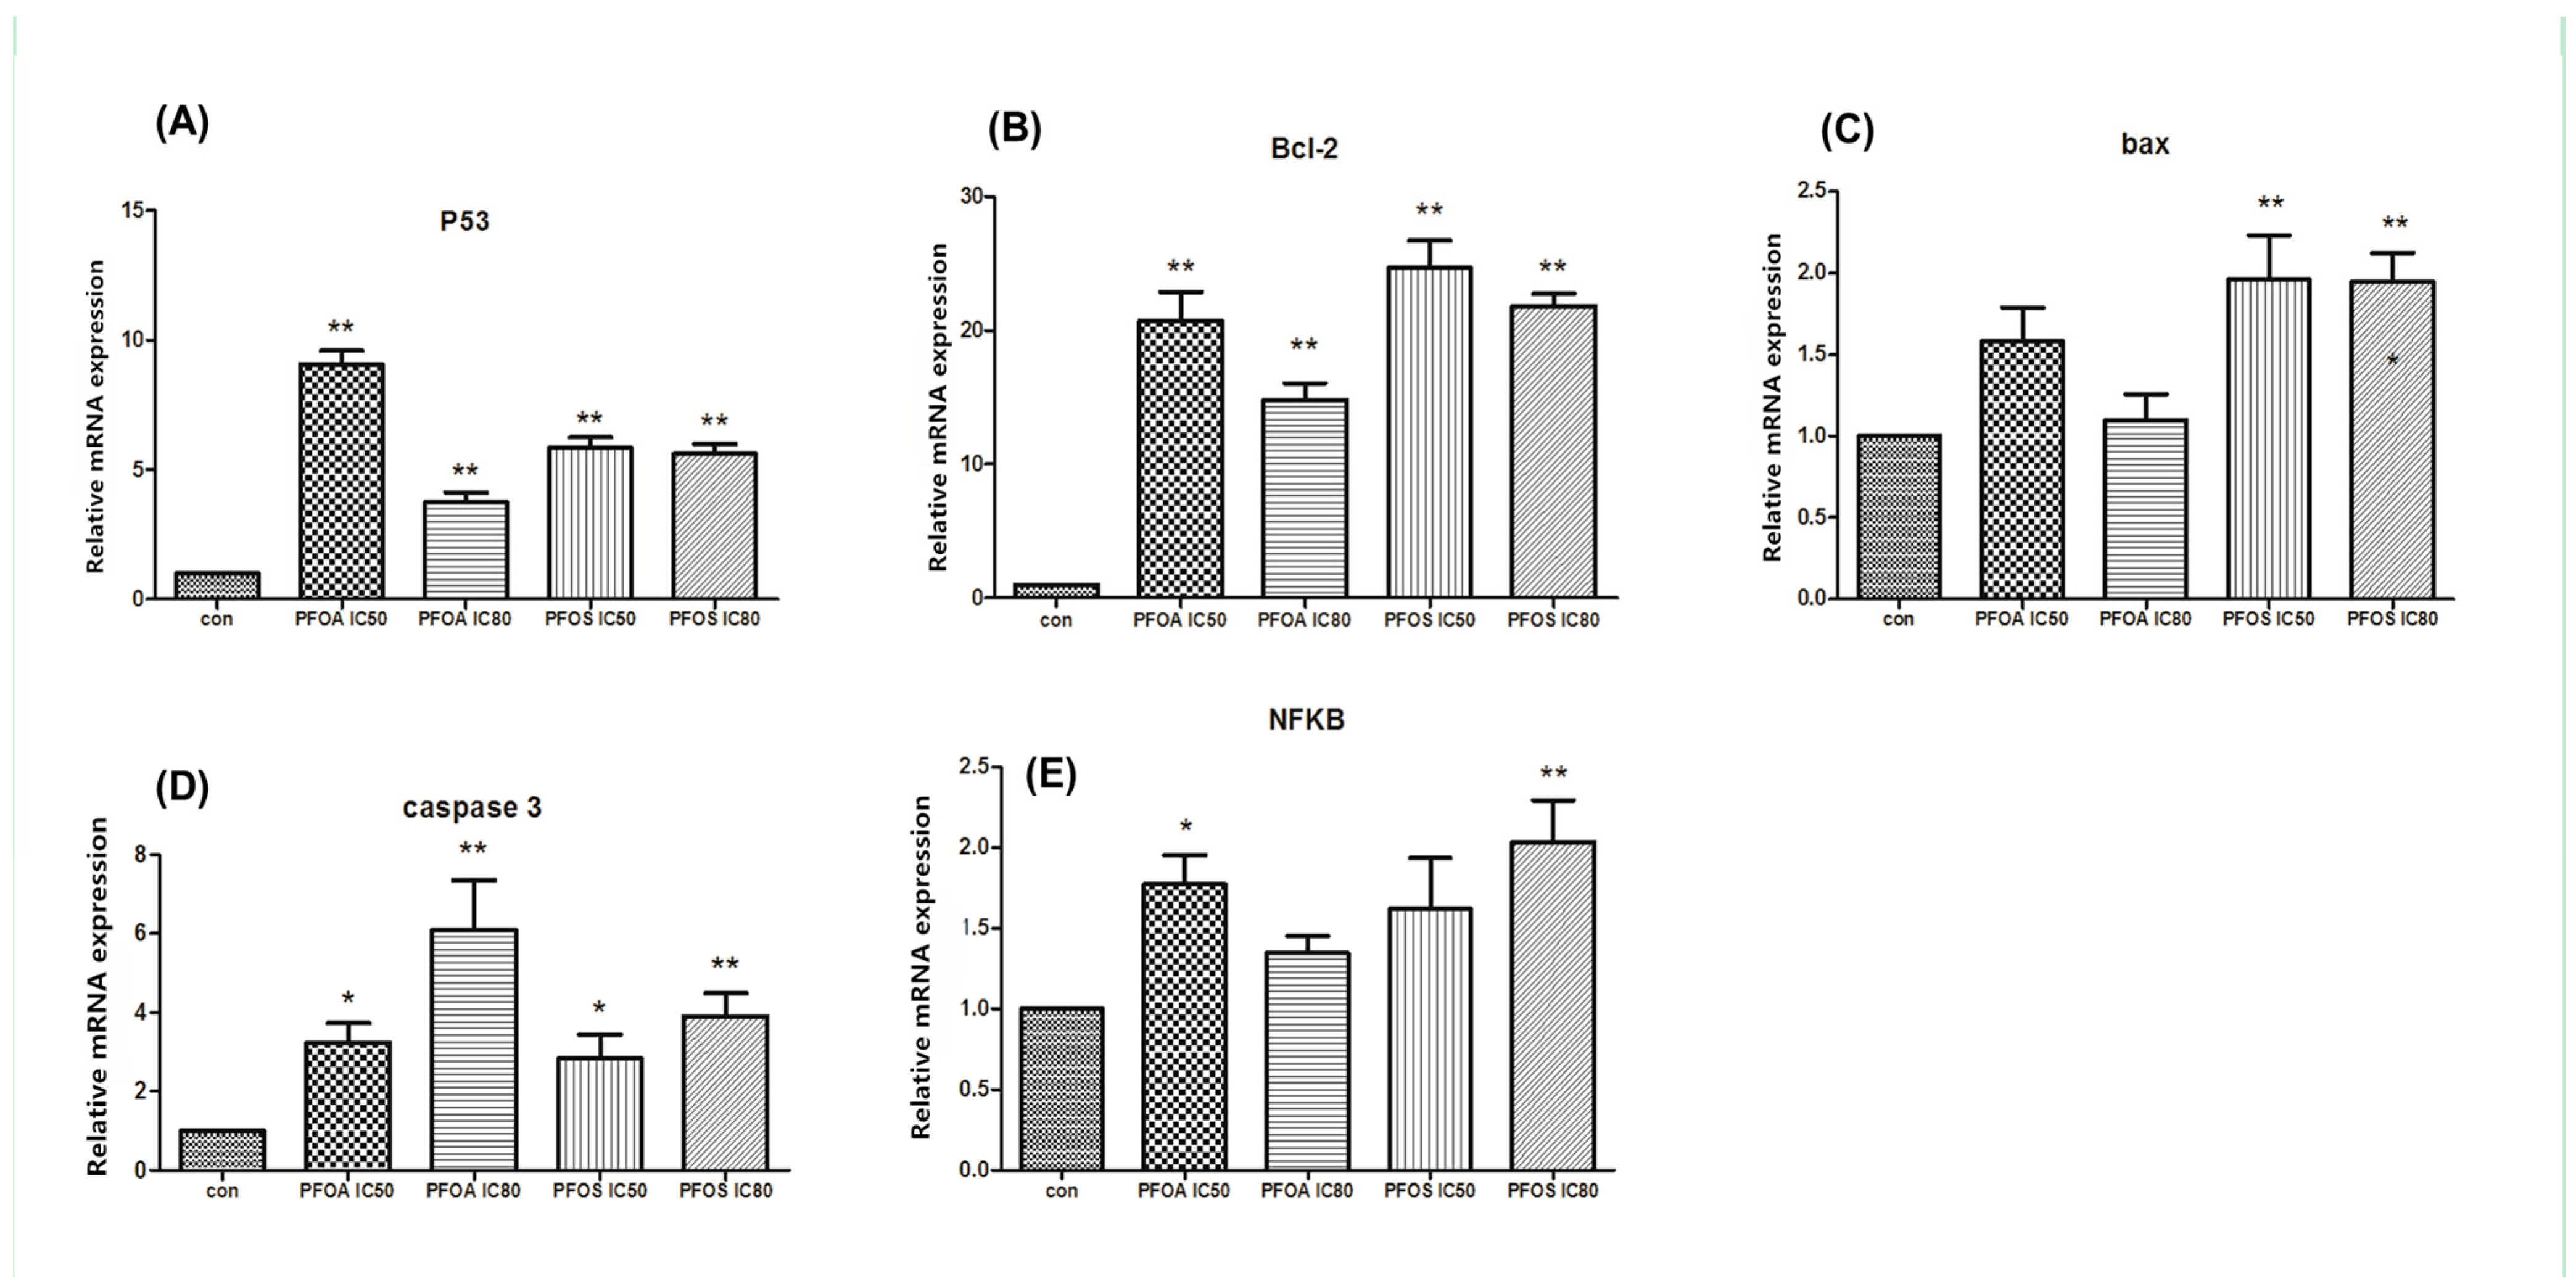
3.2. Relative Expression of p53, Bcl-2, Bax, Caspase-3 and NFκB p65

qPCR was performed to determine whether PFOA and PFOS treatment affected the expression of apoptosis-related genes, such as p53, Bcl-2, Bax, Caspase-3 and NF-κB p65,. As shown in Figure 2, different relative levels of p53, Bcl-2, Bax, Caspase-3 and NF-κB p65 mRNA levels were induced upon treatment with PFOA-IC50, PFOA-IC80, PFOS-IC50 and PFOS-IC80 in ZFL cells. Bcl2 expression increased compared to the control group after PFOA and PFOS treatment, with the PFOS-IC50 group exhibiting the highest induction. p53 had the highest expression in the PFOA-IC50 group with an 8.709-fold induction. The mRNA level of Bax was induced with the treatment of PFOS, but was not induced with treatment of PFOA, and the PFOS-IC50 and PFOS-IC80 groups exhibited comparable induction of Bax. For Caspase-3, the highest expression level was induced in the PFOA-IC80 group. NF-κB p65 expression level was induced in all groups except the PFOA-IC80 group. These results showed that PFOA and PFOS treatment could affect the expression of apoptosis related genes, including p53, Bcl-2, Bax, Caspase-3 and NF-κB p65.
Figure 2. Relative gene expression of p53, Bcl-2, Bax, Caspase-3 and NF-κB p65. ZFL cells were treated with PFOA or PFOS at IC50 or IC80 concentrations for 48 h. β-actin was used as internal control. The experiment was repeated three times. * p < 0.05, ** p < 0.01.
Ijerph 12 15012 g002

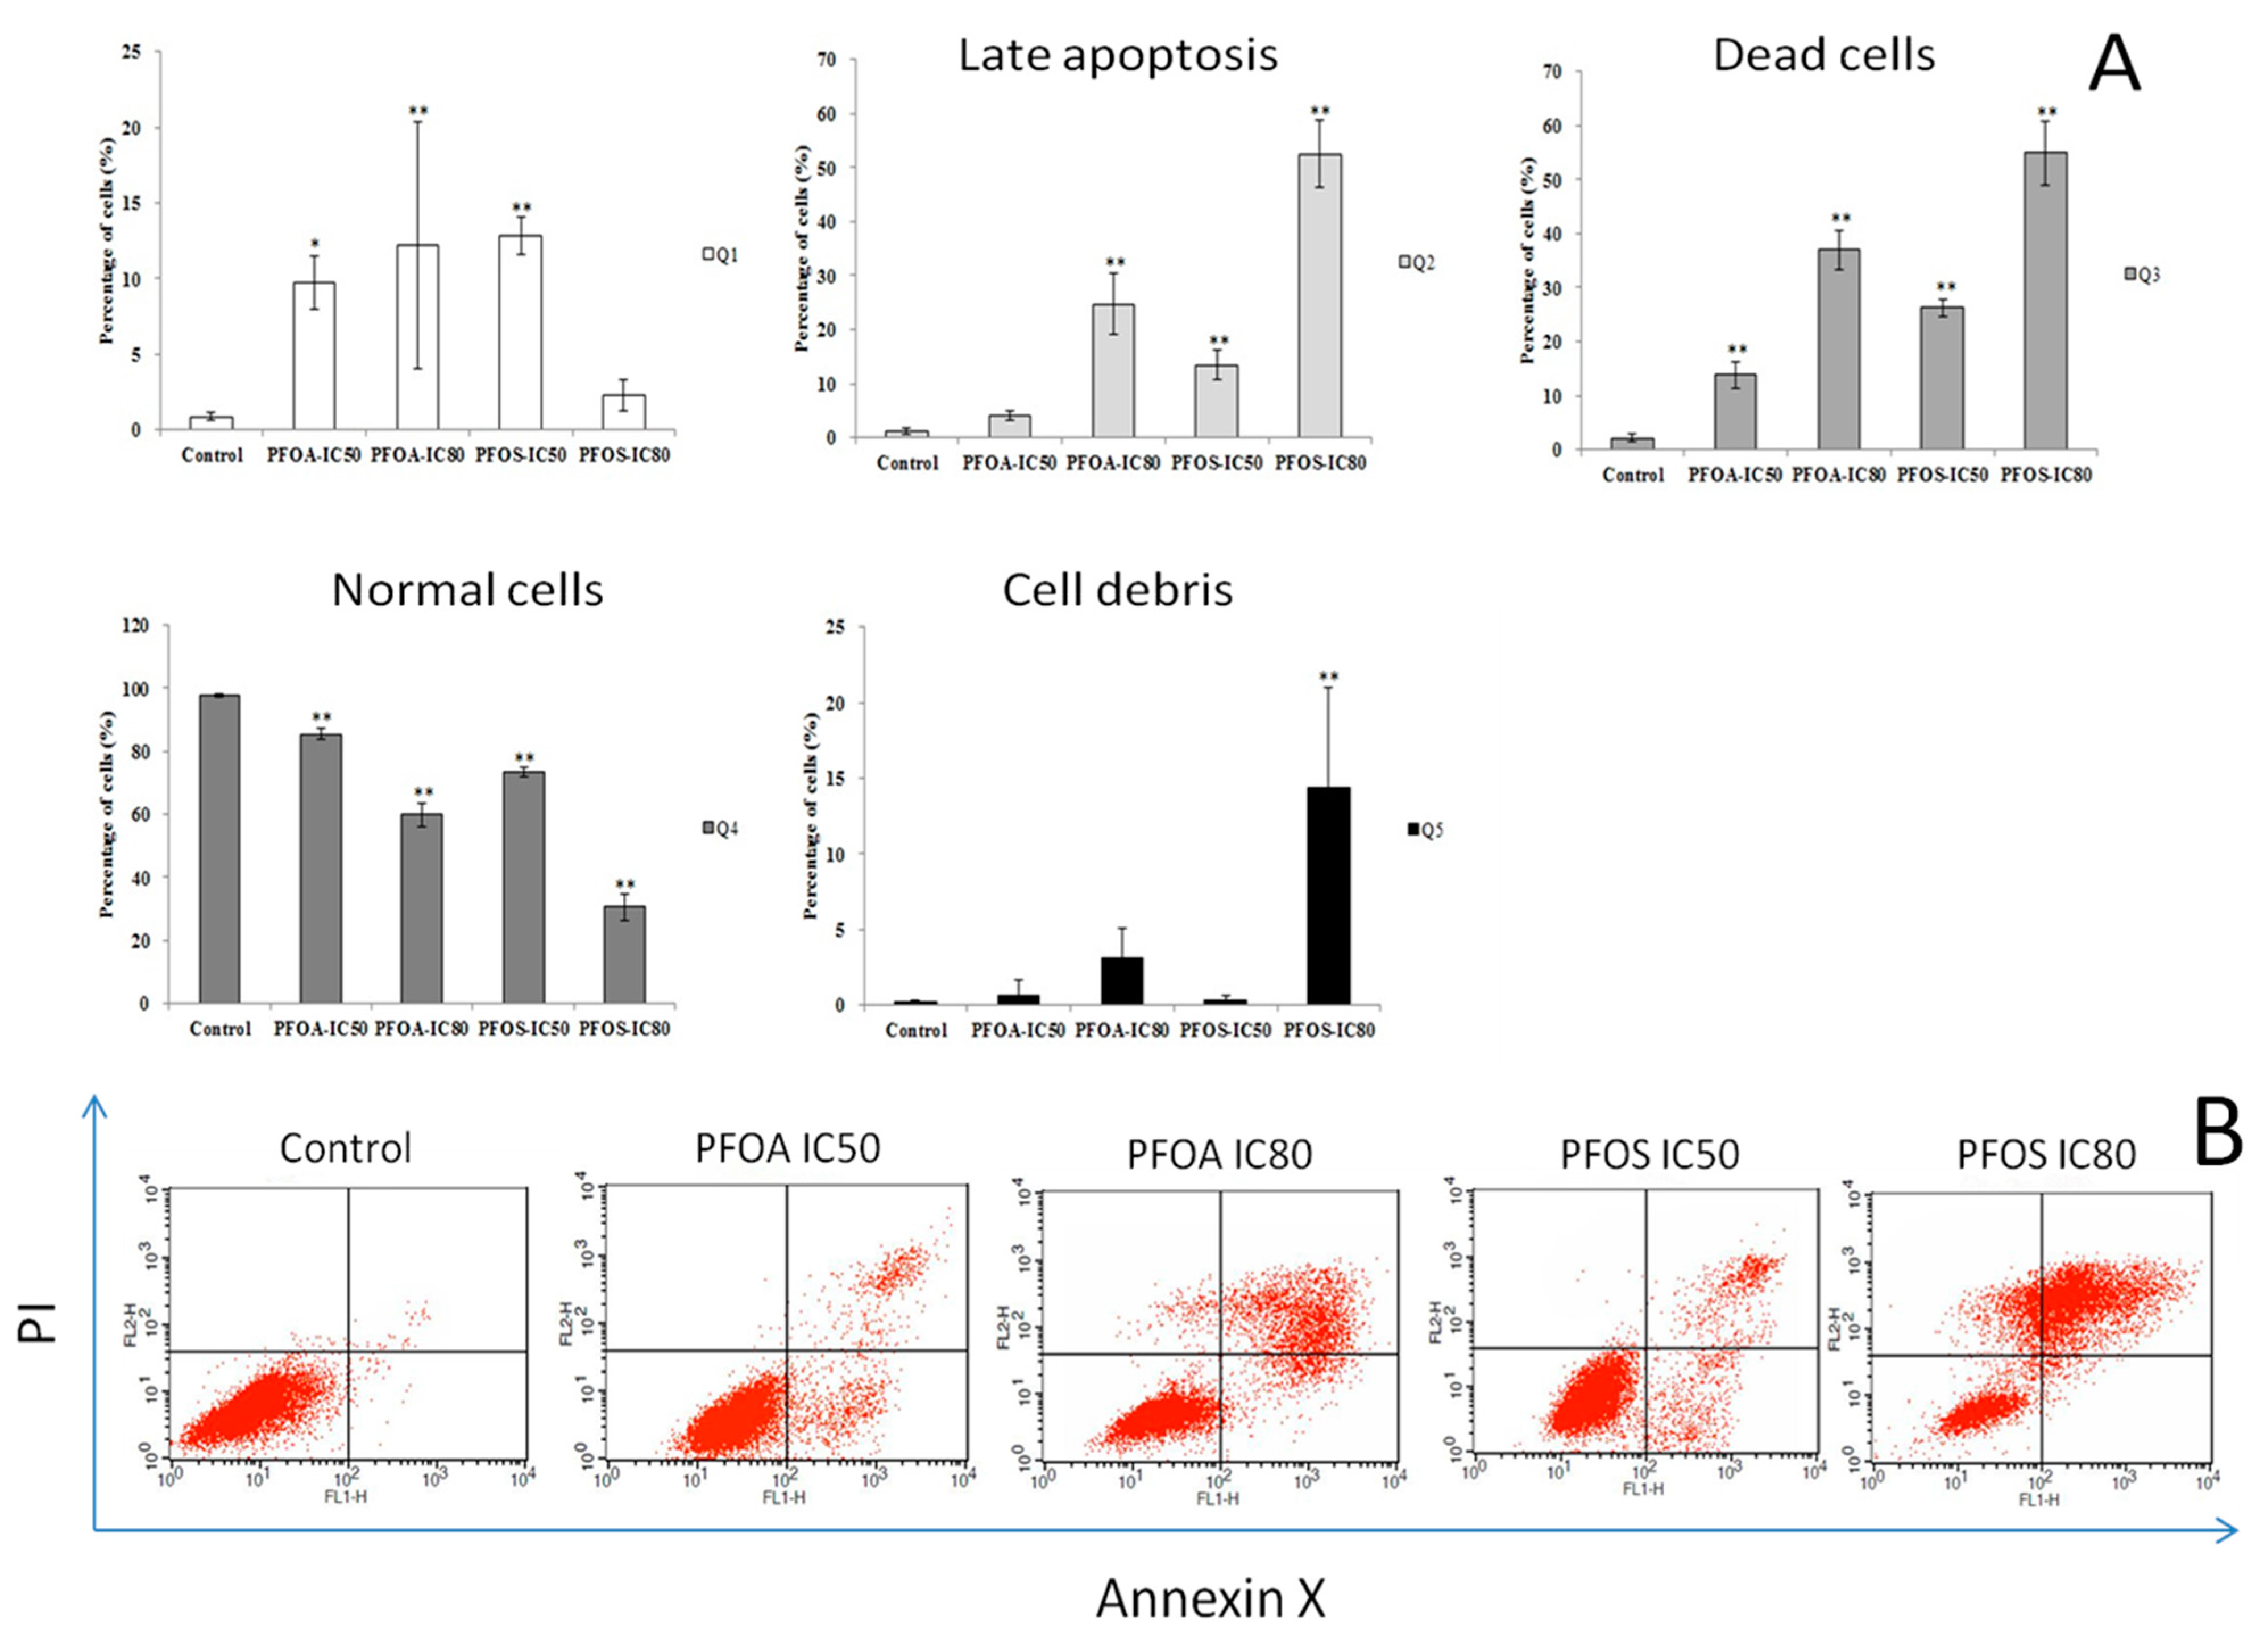
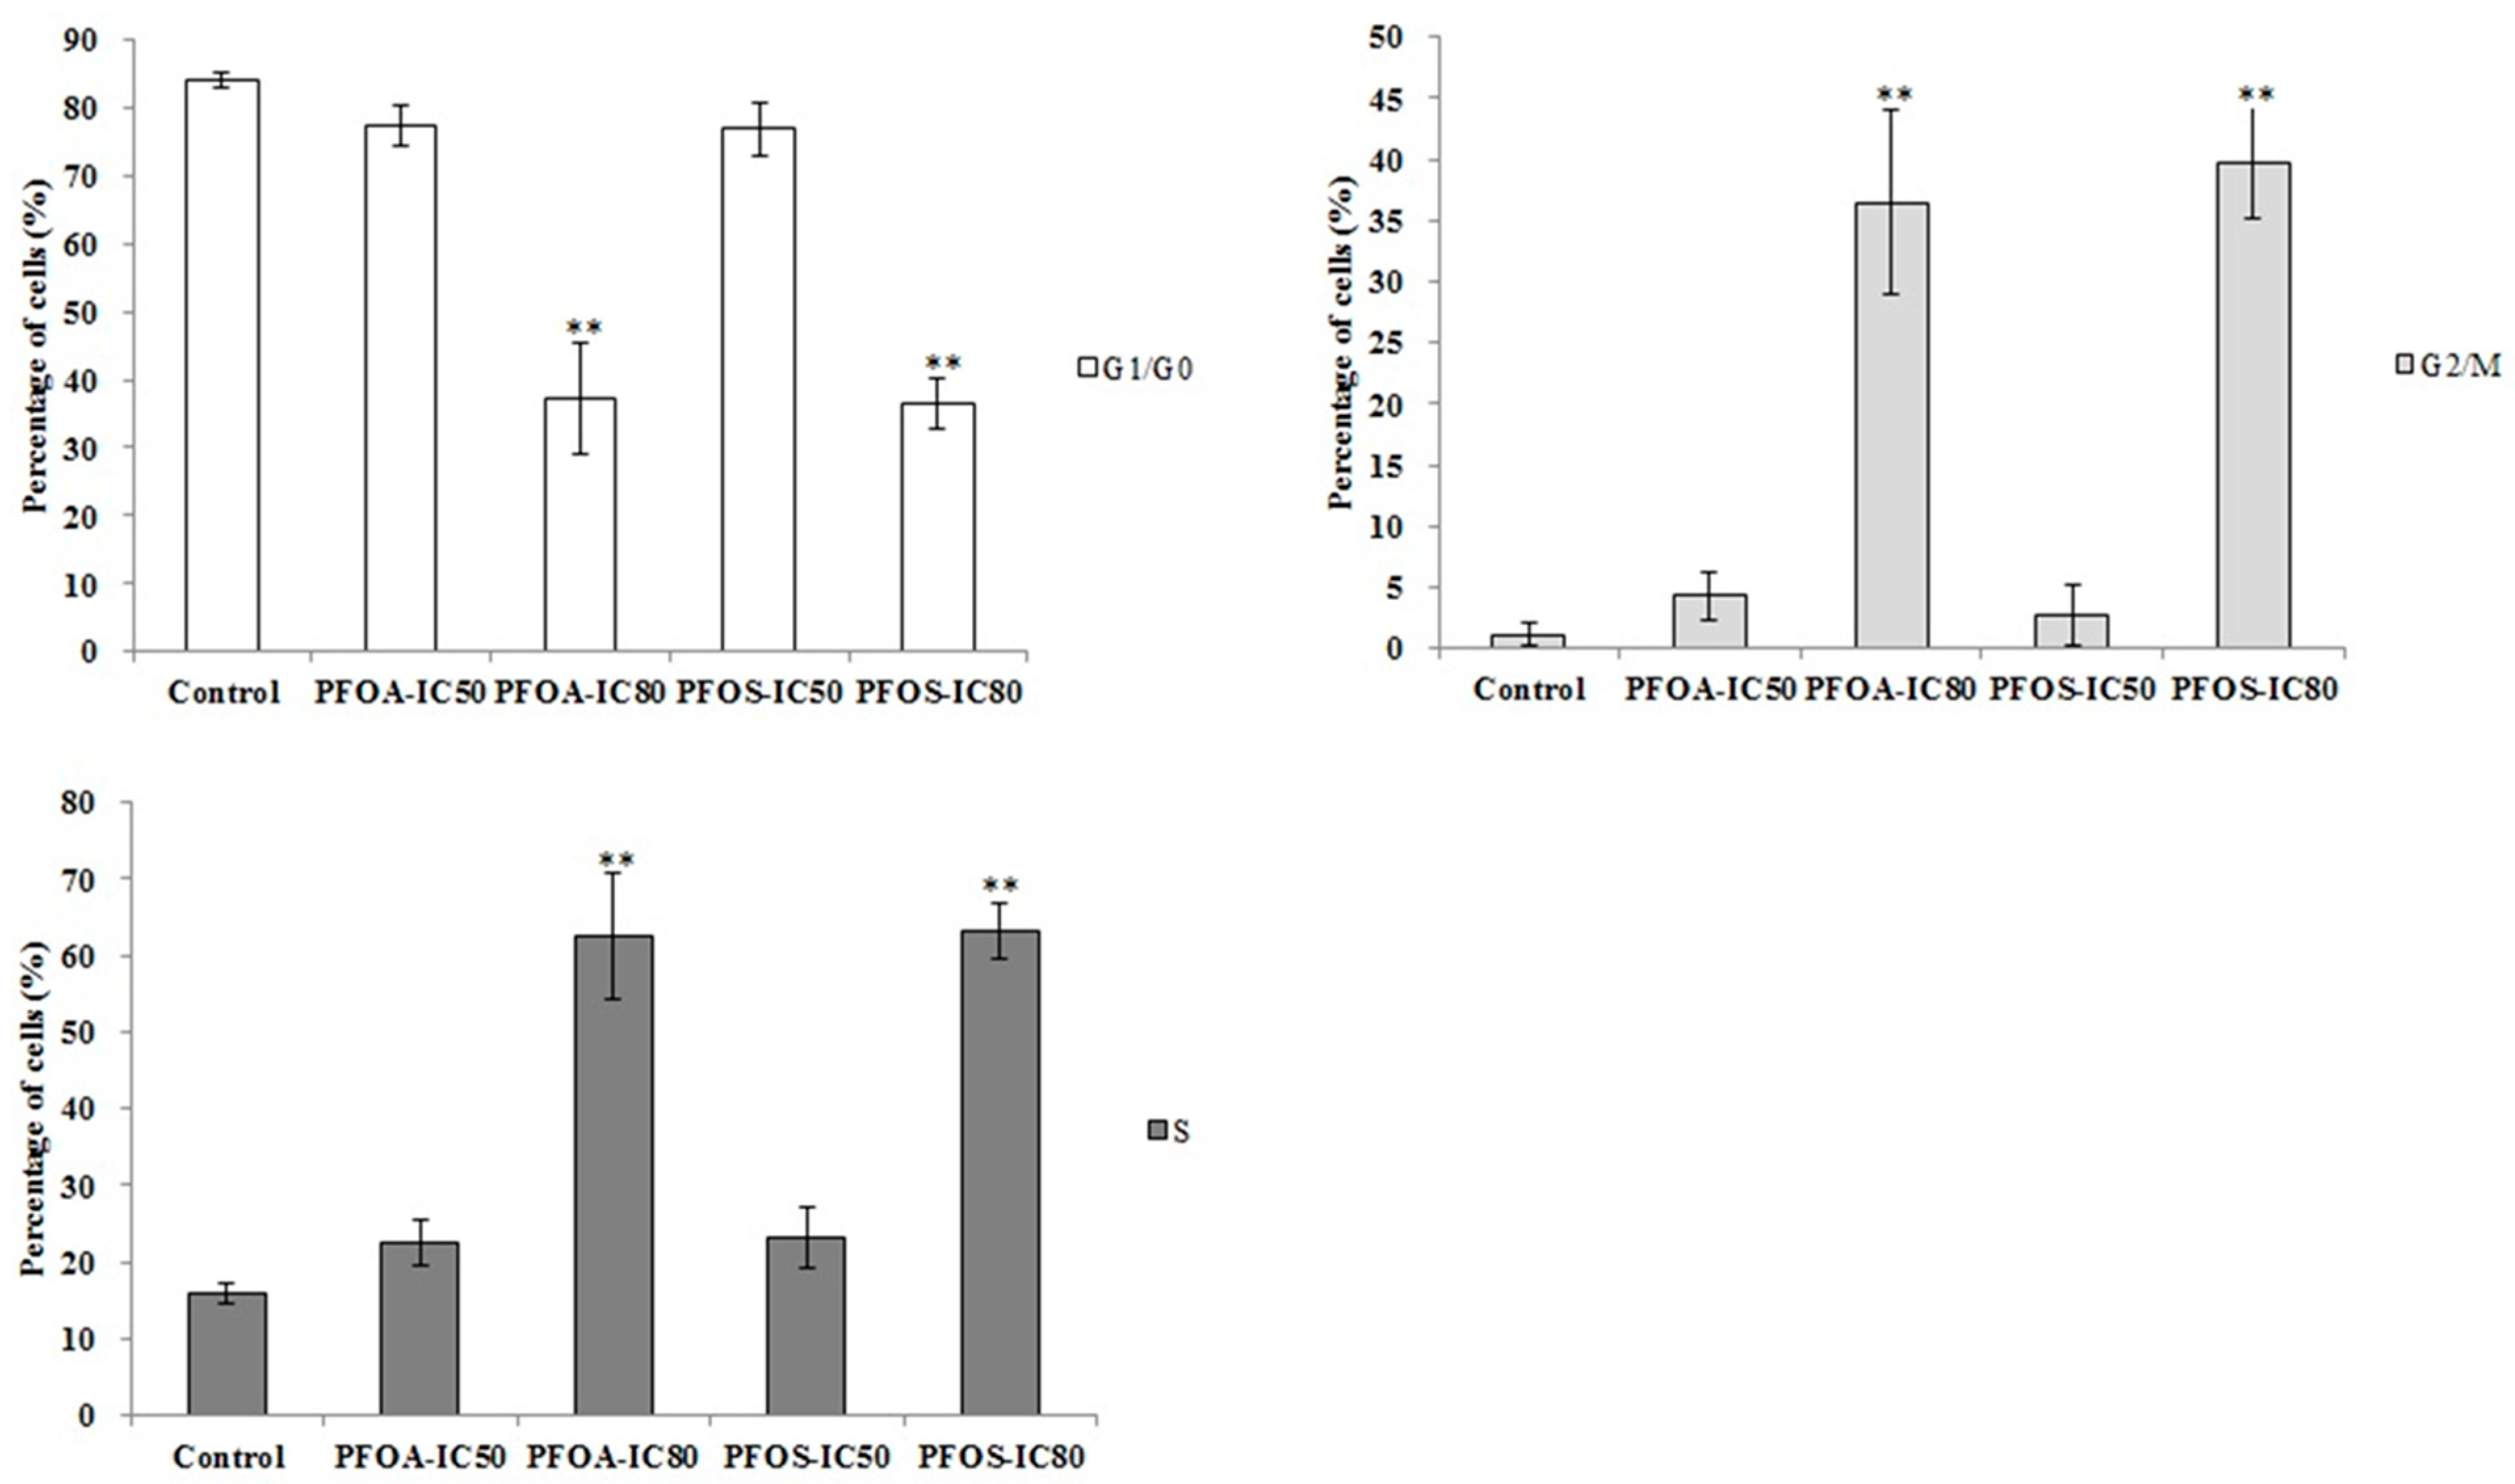
3.3. Cell Apoptosis and Cycle in ZFL Cells

Flow cytometry was used to detect the effects of PFOA and PFOS on apoptosis in ZFL cells. As shown in Figure 3, the percentage of cell apoptosis increased significantly after treatment with PFOA or PFOS in three independent experiments (p < 0.05). In addition, Figure 3 shows that the early apoptosis rate increased significantly in the PFOA-IC50, PFOA-IC80 and PFOS-IC50 groups. Moreover, significant promotion of late apoptosis was also observed in the PFOA-IC80, PFOS-IC50 and PFOS-IC80 groups.
As shown in Figure 4, compared with the control group, the percentage of cells in G1/G0 phase decreased significantly (p < 0.01), and the percentage of cells in G2/M phase and S phase increased significantly (p < 0.01) in both the PFOA-IC80 group and the PFOS-IC80 group. The results indicated that cell proliferation was blocked in both the groups.
Figure 3. Detection of apoptosis on ZFL cells exposed to PFOA and PFOS using flow cytometry. ZFL cells were treated with PFOA or PFOS at IC50 or IC80 concentrations for 48 h. Annexin V-FITC-PI kit was used for detecting cell apoptosis by flow cytometry. Percentage of cell apoptosis after treatment with PFOA or PFOS in three independent experiments. * p < 0.05, ** p < 0.01.
Ijerph 12 15012 g003
Figure 4. Cell cycle of ZFL under the inducing of PFOA and PFOS. The experiment was repeated three times. ** p < 0.01.
Ijerph 12 15012 g004

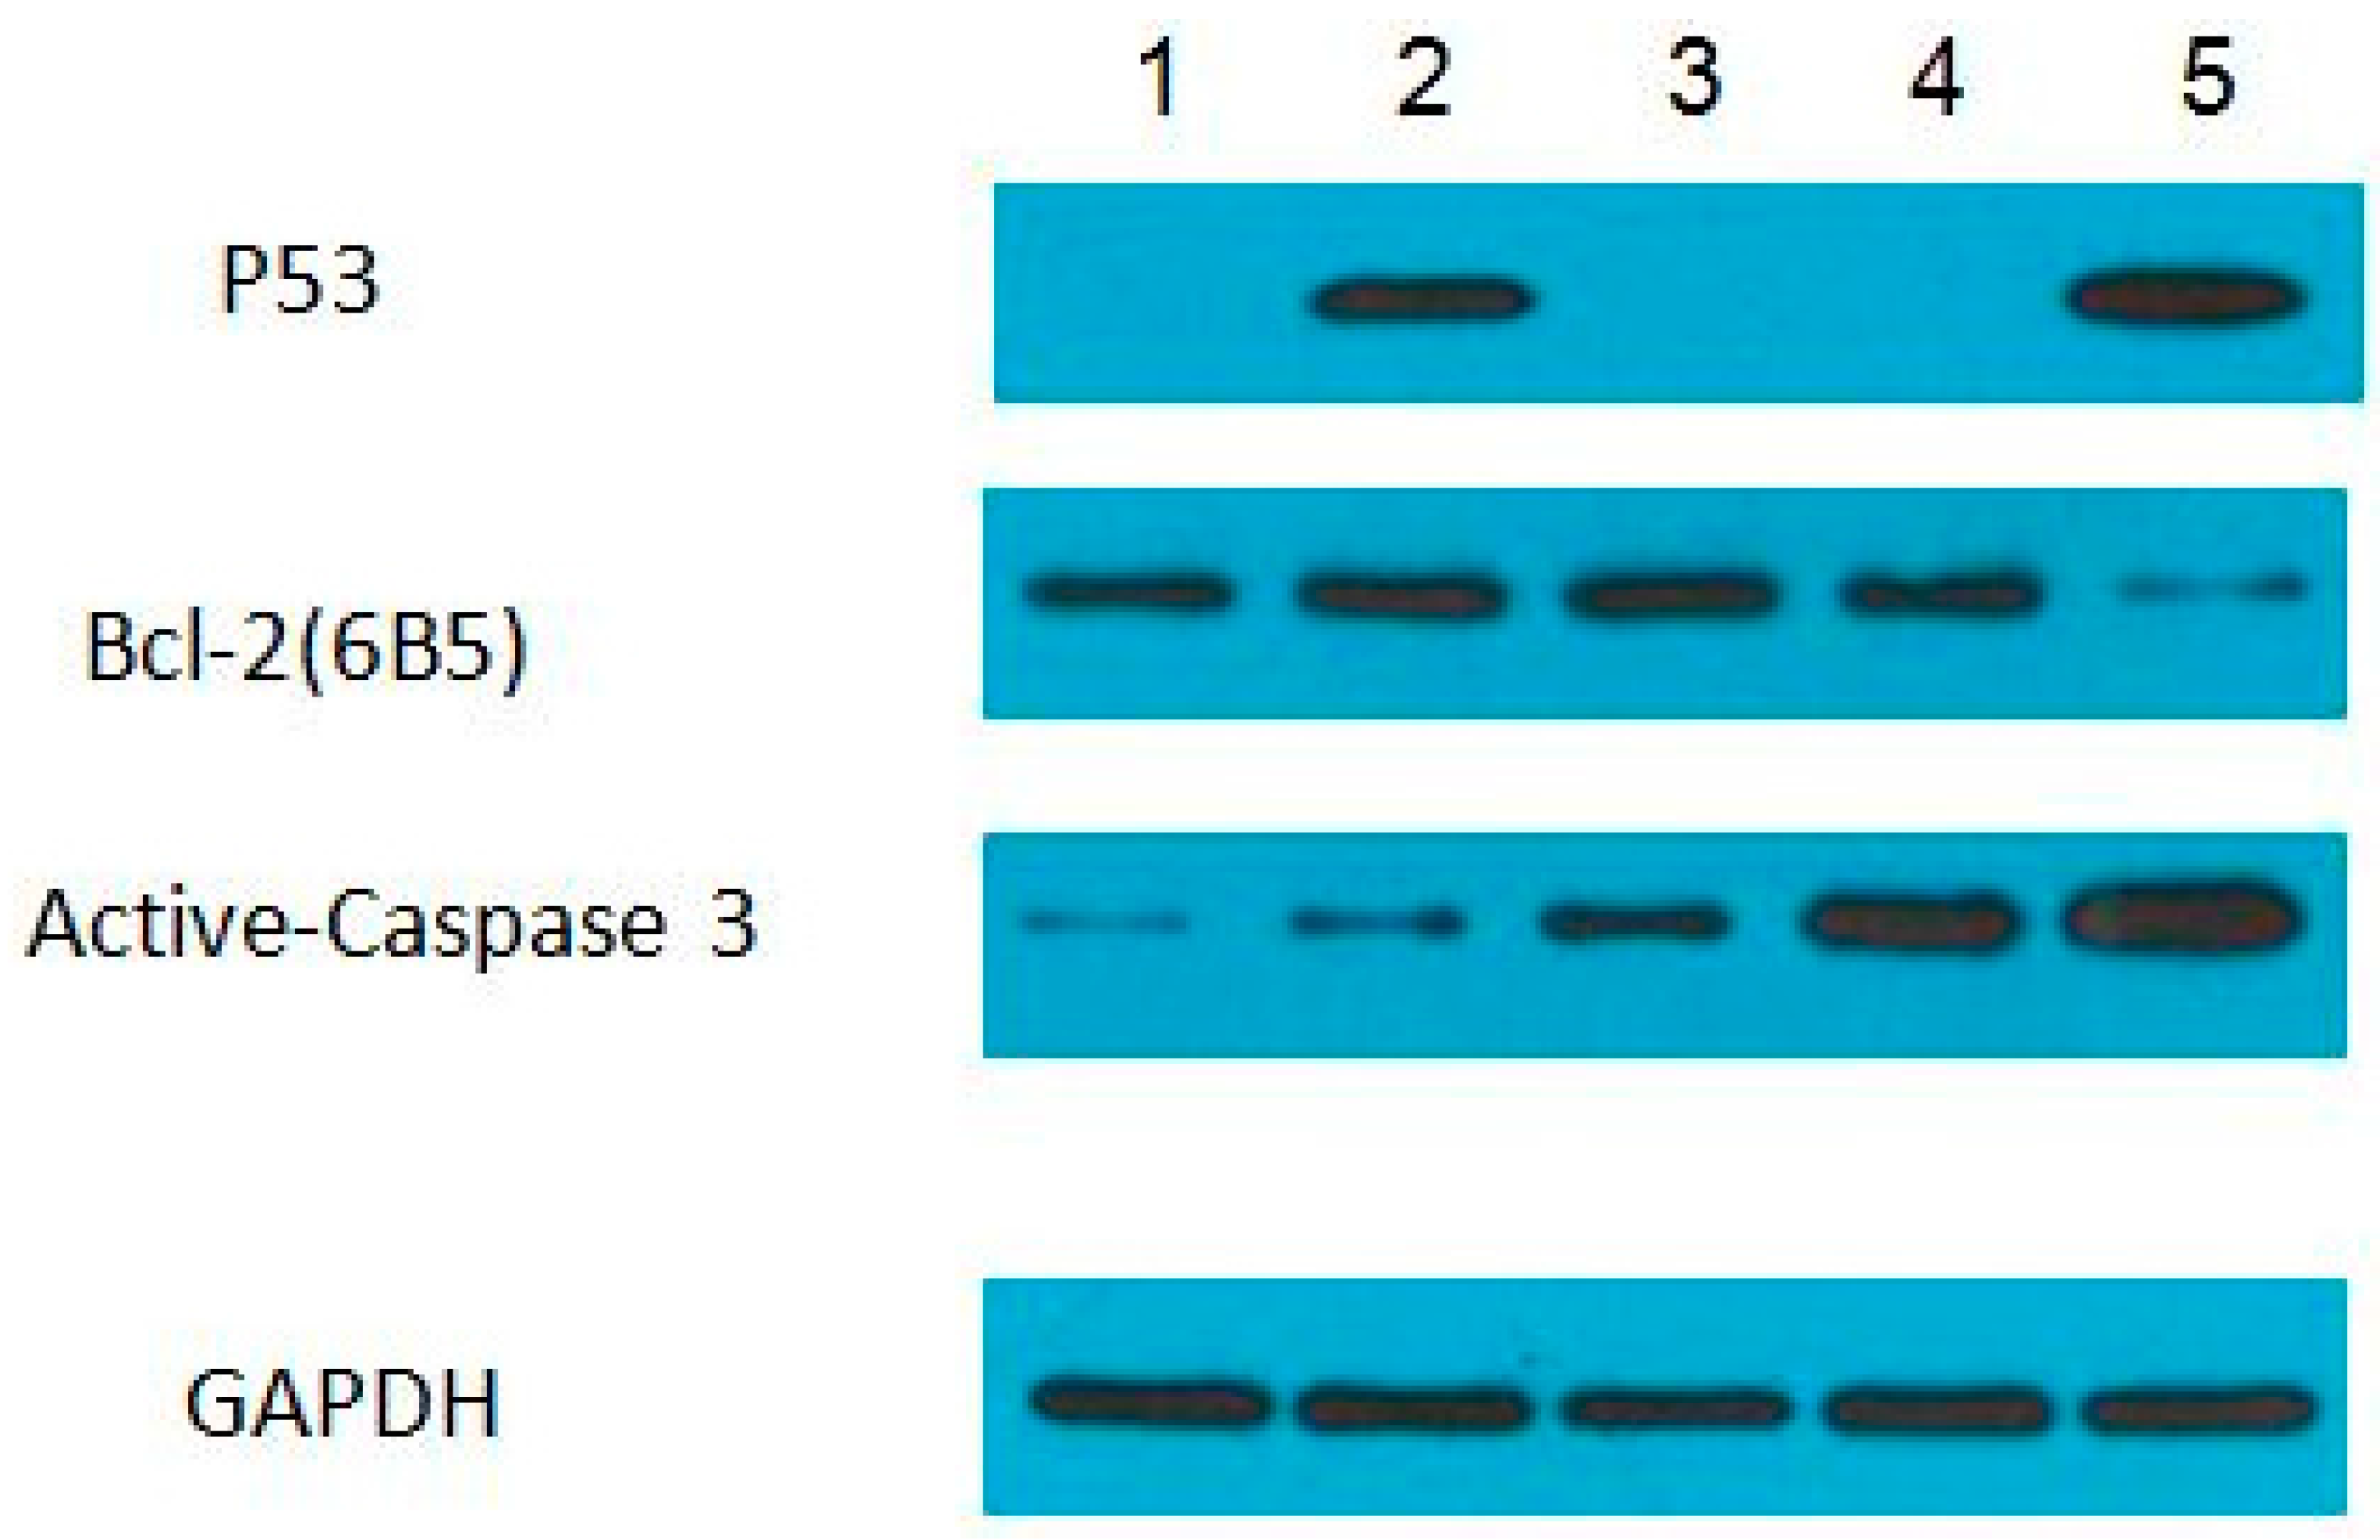
3.4. Protein Expression Levels of p53, Bcl-2, and Active-Caspase 3 in ZFL Cells Induced with PFOA and PFOS

To determine the protein levels of p53, Bcl-2, and active-caspase 3 in PFOA or PFOS treated ZFL cells, western blotting was performed. As shown in Figure 5, p53 protein was expressed in PFOA-IC50 and PFOS-IC80 groups and Bcl2 was expressed in all groups, in spite of a lower expression in the PFOS-IC80 group. For active-caspase 3, the expression in PFOA-IC50, PFOA-IC80, PFOS-IC50 and PFOS-IC80 groups were comparable.
Figure 5. Protein expression level of P53, Bcl-2 and Caspase-3. 1, Control group; 2, PFOA-IC50 group; 3, PFOA-IC80 group; 4, PFOS-IC50 group; 5, PFOS-IC80 group. ZFL cells were treated with PFOA or PFOS at IC50 or IC80 concentrations for 48 h. The protein expressions of p53, caspase 3 and Bcl-2 were detected. GAPDH was used as an internal control.
Ijerph 12 15012 g005

4. Discussion

Although zebrafish is a mostly-widely model organism in laboratories, zebrafish cell lines are still unexploited and limited in applications, partly due to their unknown genetic and physiological properties. In this study, ZFL cells were treated with either PFOA or PFOS for 48 h. Results showed that both PFOA and PFOS were able to induce apoptosis in zebrafish liver cells.
p53, Bcl-2, Bax, caspase-3 and NF-κB p65 are key genes in the process of cell apoptosis. In the present study, we aimed to confirm that the mRNA and protein expression of these key genes in the pathway are altered and also aimed to further explore the effects of PFOA and PFOS in promoting apoptosis in the different dose groups.
The p53 protein plays a critical role in cell cycle arrest and apoptosis, and its loss or inactivation is common in human cancers [24,25,26,27]. Consequently, therapies to restore p53 function, particularly its ability to induce apoptosis, have been a research focus. p53 is a tumor suppressor gene, and contributes to DNA repair and cell apoptosis [28,29,30,31]. Moreover, p53 plays an important role in DNA damage and apoptosis induced by UV and chemical agents. Importantly, p53 has already been cloned in zebrafish and was confirmed to be expressed in the embryogenesis stage. Other studies identified the p53 pathway as the essential mediator of the elevated apoptosis in the developing zebrafish [32]. After stimulated with PFOA and PFOS, the gene expression of p53 increased. We attributed this to a transcriptional event because the mRNA level of p53 was induced upon treatment with PFOA-IC50, PFOA-IC80, PFOS-IC50 and PFOS-IC80 in ZFL cells (Figure 2). Consistent with an increase in mRNA, the protein level of p53 also significantly increased in PFOA-IC50 and PFOS-IC80 groups (Figure 5). These results indicated that PFOS and PFOA induced apoptosis in ZFL cells, presumably though the p53 pathway.
Some Bcl-2 family members are channel proteins and are located in the outer membrane of the mitochondria, endoplasmic reticulum and nuclear membrane, as well as the cytosol [33]. Depending on their function to inhibit or promote apoptosis, the Bcl gene family can be divided into apoptosis inhibiting genes (including Bcl-2 and Bcl-XL), and apoptosis promoting genes (including Bax, Bad and Bxl-XS) [34,35]. Prior to cell apoptosis, Bax is located within the cytoplasm. Upon receiving clues to induce cell death, Bax goes into the outer mitochondrial membrane and forms a specific channel to facilitate the release of cytochrome c. Conversely, Bcl-2’s functions are to prevent the release of cytochrome c in this process. Together Bax and Bcl-2 regulate and mediate the process by which mitochondria contributes to cell death, known as the intrinsic apoptosis pathway [36]. This pathway is required for preventing cancer and for normal embryonic development [36]. In our study, Bcl2 was found to be highly expressed in ZFL cells, whereas the expression of Bax was relative low. ZFL cells treated with PFOA and PFOS expressed higher levels of Bcl-2 (Figure 2 and Figure 5). Anti-apoptotic response were made, and activated the expression of Bcl2. However, large amounts of apoptosis cell were eventually proved and detected by flow cytometry, indicating that Bcl2 mRNA is not effectively translated into apoptotic inhibition proteins.
Members of the caspase family of aspartic acid-directed cysteine proteases lead to the loss of cellular structure and function and eventually result in apoptotic cell death [37,38]. In mammalian cells, the caspase family is comprised of at least 14 enzymes, which can be divided into two categories: initiator caspases and executioner caspases, depending on where they function in the apoptotic cascade [39]. Caspase-3, the essential effector caspase, plays a pivotal role during caspase-dependent apoptosis. The main function of caspase is to hydrolyze proteins and connect the caspase cascade in the upstream and downstream apoptotic process. Amino acids of caspase-3 in zebrafish have great homology with vertebrates. In our study, the mRNA level of caspase 3 was induced with the treatment of PFOA and PFOS (Figure 2), and the protein level of pro-caspase 3 increased in the PFOA-IC50 group and the PFOS-IC80 group (Figure 5). These results revealed that PFOS and PFOA induced apoptosis in ZFL cells with involvement of caspases [22].
To sum up, this study confirmed the crucial genes in the pathway of apoptosis and further illustrated the effects of PFOA and PFOS on the process of apoptosis. It provides a theoretical basis for future study of cell apoptosis.

5. Conclusions

According to the results in this study, we noted that PFOA-IC80 and PFOS-IC50 both promoted apoptosis. The decreased percentage of cells in G1/G0 stage and the increased percentage of cells in G2/M stage clearly showed that cell cycle and cell proliferation were blocked in both the PFOA-IC80 and PFOS-IC80 groups. This study confirmed the crucial genes in the pathway of apoptosis and further illustrated the effect of PFOA and PFOS in the process of apoptosis.

Acknowledgments

This work was supported by grants from Chinese Academy of Inspection and Quarantine (No. 2013JK013), General Administration of Quality Supervision, Inspection and Quarantine (AQSIQ) of People’s Republic of China (No. 201510203-02), and General Administration of Quality Supervision, Inspection and Quarantine (AQSIQ) of People’s Republic of China (No. 201510024).

Author Contributions

Yuan Cui designed the study, performed statistical analysis and wrote the manuscript. Wei Liu, Wenping Xie and Cheng Wang performed the date collection and wrote the manuscript. Wenlian Yu and Huiming Chen conducted the research and revised the manuscript. All of the authors contributed to the design of the study and preparation of the final version of the manuscript.

Conflicts of Interest

The authors declare no conflict of interest.

References

  1. Van Ham, T.J.; Mapes, J.; Kokel, D.; Peterson, R.T. Live imaging of apoptotic cells in zebrafish. FASEB J. 2010, 24, 4336–4342. [Google Scholar] [CrossRef] [PubMed]
  2. Hilger-Eversheim, K.; Moser, M.; Schorle, H.; Buettner, R. Regulatory roles of AP-2 transcription factors in vertebrate development, apoptosis and cell-cycle control. Gene 2000, 260, 1–12. [Google Scholar] [CrossRef]
  3. Bonneau, B.; Nougarède, A.; Prudent, J.; Popgeorgiev, N.; Peyriéras, N.; Rimokh, R.; Gillet, G. The Bcl-2 homolog Nrz inhibits binding of IP3 to its receptor to control calcium signaling during zebrafish epiboly. Sci. Signal. 2014, 7. [Google Scholar] [CrossRef] [PubMed]
  4. Coffin, A.B.; Rubel, E.W.; Raible, D.W. Bax, Bcl2, and p53 differentially regulate neomycin-and gentamicin-induced hair cell death in the zebrafish lateral line. J. Assoc. Res. Otolaryngol. 2013, 14, 645–659. [Google Scholar] [CrossRef] [PubMed]
  5. Chua, J.; Liew, H.; Guo, L.; Lane, D. Tumor-specific signaling to p53 is mimicked by Mdm2 inactivation in zebrafish: Insights from mdm2 and mdm4 mutant zebrafish. Oncogene 2015, 34, 5933–5941. [Google Scholar] [CrossRef] [PubMed]
  6. Yuan, Y.; Sun, H.; Ge, S.; Wang, M.; Zhao, H.; Wang, L.; An, L.; Zhang, J.; Zhang, H.; Hu, B. Controlled intracellular self-assembly and disassembly of 19F nanoparticles for MR imaging of caspase 3/7 in zebrafish. ACS Nano 2014, 9, 761–768. [Google Scholar] [CrossRef] [PubMed]
  7. Wu, S.; Ji, G.; Liu, J.; Zhang, S.; Gong, Y.; Shi, L. TBBPA induces developmental toxicity, oxidative stress, and apoptosis in embryos and zebrafish larvae (Danio rerio). Environ. Toxicol. 2015. [Google Scholar] [CrossRef] [PubMed]
  8. De Felip, E.; Abballe, A.; Albano, F.L.; Battista, T.; Carraro, V.; Conversano, M.; Franchini, S.; Giambanco, L.; Iacovella, N.; Ingelido, A.M. Current exposure of Italian women of reproductive age to PFOS and PFOA: A human biomonitoring study. Chemosphere 2015, 137, 1–8. [Google Scholar] [CrossRef] [PubMed]
  9. Van de Vijver, K.I.; Hoff, P.; Das, K.; Brasseur, S.; Van Dongen, W.; Esmans, E.; Reijnders, P.; Blust, R.; De Coen, W. Tissue distribution of perfluorinated chemicals in harbor seals (Phoca vitulina) from the Dutch Wadden Sea. Environ. Sci. Technol. 2005, 39, 6978–6984. [Google Scholar] [CrossRef] [PubMed]
  10. Yeung, L.W.; So, M.; Jiang, G.; Taniyasu, S.; Yamashita, N.; Song, M.; Wu, Y.; Li, J.; Giesy, J.; Guruge, K. Perfluorooctanesulfonate and related fluorochemicals in human blood samples from China. Environ. Sci. Technol. 2006, 40, 715–720. [Google Scholar] [CrossRef] [PubMed]
  11. Schaefer, C.E.; Andaya, C.; Urtiaga, A.; McKenzie, E.R.; Higgins, C.P. Electrochemical treatment of perfluorooctanoic acid (PFOA) and perfluorooctane sulfonic acid (PFOS) in groundwater impacted by aqueous film forming foams (AFFFs). J. Hazard. Mater. 2015, 295, 170–175. [Google Scholar] [CrossRef] [PubMed]
  12. Loccisano, A.E.; Longnecker, M.P.; Campbell, J.L., Jr.; Andersen, M.E.; Clewell, H.J., III. Development of PBPK models for PFOA and PFOS for human pregnancy and lactation life stages. J. Toxicol. Environ. Health Part A 2013, 76, 25–57. [Google Scholar] [CrossRef] [PubMed]
  13. Abdellatif, A.; Al-Tonsy, A.H.; Awad, M.E.; Roberfroid, M.; Khan, M. Peroxisomal enzymes and 8-hydroxydeoxyguanosine in rat liver treated with perfluorooctanoic acid. Dis. Mark. 2003, 19, 19–25. [Google Scholar] [CrossRef]
  14. Kennedy, G.L.; Butenhoff, J.L.; Olsen, G.W.; O’Connor, J.C.; Seacat, A.M.; Perkins, R.G.; Biegel, L.B.; Murphy, S.R.; Farrar, D.G. The toxicology of perfluorooctanoate. Crit. Rev. Toxicol. 2004, 34, 351–384. [Google Scholar] [CrossRef] [PubMed]
  15. Directorate, O.E. Hazard Assessment of Perfluorooctane Sulfonate (PFOS) and Its Salts: ENV/JM/RD (2002) 17/FINAL; Organisation for Economic Co-operation and Development: Paris, France, 2002. [Google Scholar]
  16. Seacat, A.M.; Thomford, P.J.; Hansen, K.J.; Olsen, G.W.; Case, M.T.; Butenhoff, J.L. Subchronic toxicity studies on perfluorooctanesulfonate potassium salt in cynomolgus monkeys. Toxicol. Sci. 2002, 68, 249–264. [Google Scholar] [CrossRef] [PubMed]
  17. Guruge, K.S.; Yeung, L.W.; Yamanaka, N.; Miyazaki, S.; Lam, P.K.; Giesy, J.P.; Jones, P.D.; Yamashita, N. Gene expression profiles in rat liver treated with perfluorooctanoic acid (PFOA). Toxicol. Sci. 2006, 89, 93–107. [Google Scholar] [CrossRef] [PubMed]
  18. Son, H.-Y.; Kim, S.-H.; Shin, H.-I.; Bae, H.I.; Yang, J.-H. Perfluorooctanoic acid-induced hepatic toxicity following 21-day oral exposure in mice. Arch. Toxicol. 2008, 82, 239–246. [Google Scholar] [CrossRef] [PubMed]
  19. Shabalina, I.G.; Panaretakis, T.; Bergstrand, A.; Depierre, J.W. Effects of the rodent peroxisome proliferator and hepatocarcinogen, perfluorooctanoic acid, on apoptosis in human hepatoma HepG2 cells. Carcinogenesis 1999, 20, 2237–2246. [Google Scholar] [CrossRef] [PubMed]
  20. Panaretakis, T.; Shabalina, I.G.; Grandér, D.; Shoshan, M.C.; DePierre, J.W. Reactive oxygen species and mitochondria mediate the induction of apoptosis in human hepatoma HepG2 cells by the rodent peroxisome proliferator and hepatocarcinogen, perfluorooctanoic acid. Toxicol. Appl. Pharmacol. 2001, 173, 56–64. [Google Scholar] [CrossRef] [PubMed]
  21. Yao, X.; Zhong, L. Genotoxic risk and oxidative DNA damage in HepG2 cells exposed to perfluorooctanoic acid. Mutat. Res./Gen. Toxicol. Environ. Mutagen. 2005, 587, 38–44. [Google Scholar] [CrossRef] [PubMed]
  22. Liu, C.; Yu, K.; Shi, X.; Wang, J.; Lam, P.K.; Wu, R.S.; Zhou, B. Induction of oxidative stress and apoptosis by PFOS and PFOA in primary cultured hepatocytes of freshwater tilapia (Oreochromis niloticus). Aquat. Toxicol. 2007, 82, 135–143. [Google Scholar] [CrossRef] [PubMed]
  23. Bopp, S.K.; Lettieri, T. Comparison of four different colorimetric and fluorometric cytotoxicity assays in a zebrafish liver cell line. BMC Pharmacol. 2008, 8. [Google Scholar] [CrossRef] [PubMed]
  24. Giaccia, A.J.; Kastan, M.B. The complexity of p53 modulation: Emerging patterns from divergent signals. Genes Dev. 1998, 12, 2973–2983. [Google Scholar] [CrossRef] [PubMed]
  25. Levine, A.J. p53, the cellular gatekeeper for growth and division. Cell 1997, 88, 323–331. [Google Scholar] [CrossRef]
  26. Prives, C. Signaling to p53: Breaking the MDM2-p53 circuit. Cell 1998, 95, 5–8. [Google Scholar] [CrossRef]
  27. Vousden, K.H. p53: Death star. Cell 2000, 103, 691–694. [Google Scholar] [CrossRef]
  28. Ko, Y.-C.; Lien, J.-C.; Liu, H.-C.; Hsu, S.-C.; Lin, H.-Y.; Chueh, F.-S.; Ji, B.-C.; Yang, M.-D.; Hsu, W.-H.; Chung, J.-G. Demethoxycurcumin-induced DNA damage decreases DNA repair-associated protein expression levels in NCI-H460 human lung cancer cells. Anticancer Res. 2015, 35, 2691–2698. [Google Scholar] [PubMed]
  29. Carrillo, A.M.; Hicks, M.; Khabele, D.; Eischen, C.M. Pharmacologically increasing Mdm2 inhibits DNA repair and cooperates with genotoxic agents to kill p53 inactivated ovarian cancer cells. Mol. Cancer Res. 2015, 13. [Google Scholar] [CrossRef] [PubMed]
  30. Mancini, F.; Pieroni, L.; Monteleone, V.; Lucà, R.; Fici, L.; Luca, E.; Urbani, A.; Xiong, S.; Soddu, S.; Masetti, R. MDM4/HIPK2/p53 cytoplasmic assembly uncovers coordinated repression of molecules with anti-apoptotic activity during early DNA damage response. Oncogene 2015. [Google Scholar] [CrossRef] [PubMed]
  31. Demoulin, B.; Hermant, M.; Castrogiovanni, C.; Staudt, C.; Dumont, P. Resveratrol induces DNA damage in colon cancer cells by poisoning topoisomerase II and activates the ATM kinase to trigger p53-dependent apoptosis. Toxicol. Vitr. 2015, 29, 1156–1165. [Google Scholar] [CrossRef] [PubMed]
  32. Prykhozhij, S.V. In the absence of Sonic hedgehog, p53 induces apoptosis and inhibits retinal cell proliferation, cell-cycle exit and differentiation in zebrafish. PLoS ONE 2010, 5. [Google Scholar] [CrossRef] [PubMed]
  33. Tian, X.; Zeng, G.; Li, X.; Wu, Z.; Wang, L. Cantharidin inhibits cell proliferation and promotes apoptosis in tongue squamous cell carcinoma through suppression of miR-214 and regulation of p53 and Bcl-2/Bax. Oncol. Rep. 2015, 33, 3061–3068. [Google Scholar] [CrossRef] [PubMed]
  34. Yan, X.; Jiang, Z.; Bi, L.; Yang, Y.; Chen, W. Salvianolic acid A attenuates TNF-α-and d-GalN-induced ER stress-mediated and mitochondrial-dependent apoptosis by modulating Bax/Bcl-2 ratio and calcium release in hepatocyte LO2 cells. Naunyn-Schmiedebergs Arch. Pharmacol. 2015, 388, 817–830. [Google Scholar] [CrossRef] [PubMed]
  35. Zeng, J.; Chen, S.; Li, N.; Chen, L.; Su, J.; Niu, G.; Zhu, S.; Liang, Y. Sasanquasaponin from Camellia oleifera Abel. induces apoptosis via Bcl-2, Bax and caspase-3 activation in HepG2 cells. Mol. Med. Rep. 2015, 12, 1997–2002. [Google Scholar] [CrossRef] [PubMed]
  36. Hardwick, J.M.; Soane, L. Multiple functions of BCL-2 family proteins. Cold Spring Harb. Perspect. Biol. 2013, 5. [Google Scholar] [CrossRef] [PubMed]
  37. Walsh, J.G.; Cullen, S.P.; Sheridan, C.; Lüthi, A.U.; Gerner, C.; Martin, S.J. Executioner caspase-3 and caspase-7 are functionally distinct proteases. Proc. Natl. Acad. Sci. USA 2008, 105, 12815–12819. [Google Scholar] [CrossRef] [PubMed]
  38. González, D.; Espino, J.; Bejarano, I.; López, J.; Rodriguez, A.; Pariente, J. Caspase-3 and-9 are activated in human myeloid HL-60 cells by calcium signal. Mol. Cell. Biochem. 2010, 333, 151–157. [Google Scholar] [CrossRef] [PubMed]
  39. Kuranaga, E. Caspase signaling in animal development. Dev. Growth Differ. 2011, 53, 137–148. [Google Scholar] [CrossRef] [PubMed]

