
Delayed Response of Lake Area Change to Climate Change in Siling Co Lake, Tibetan Plateau, from 2003 to 2013


Abstract
:1. Introduction
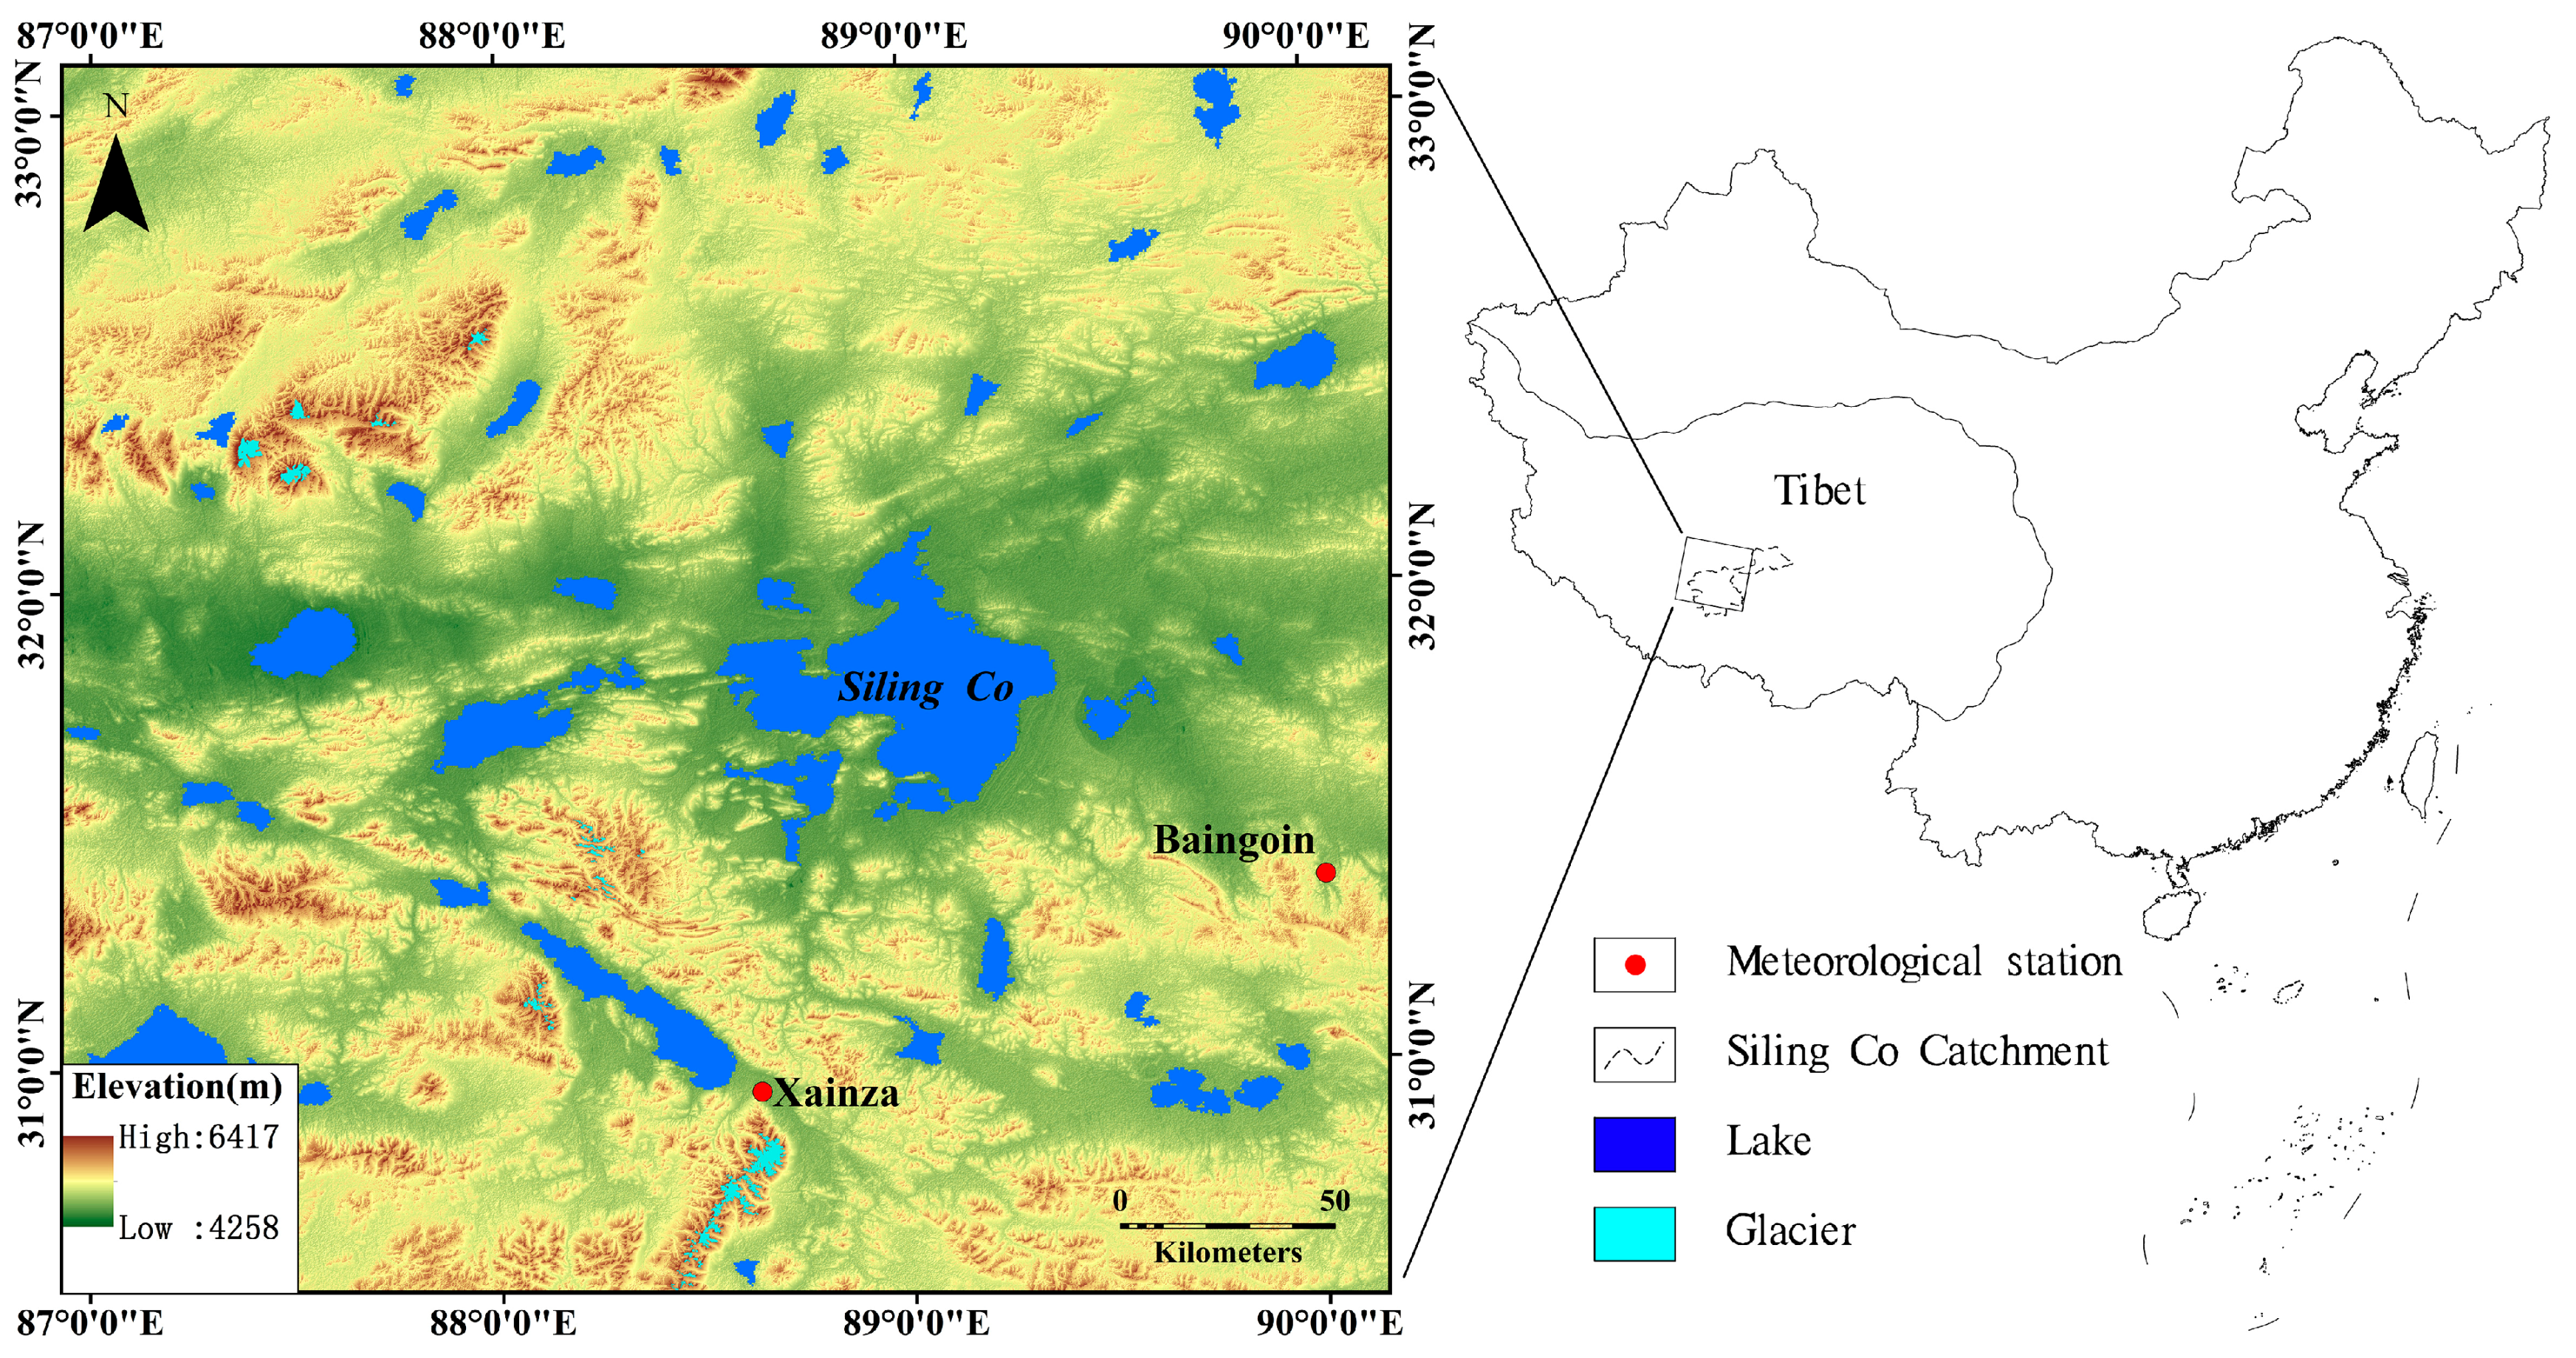
2. Study Area
3. Data and Methods
3.1. Moderate Resolution Imaging Spectroradiometer (MODIS) Data

| Year | 2003–2006 | 2007–2008 | 2009–2012 | 2013 |
|---|---|---|---|---|
| Days | 241 | 273 | 241 | 233 |
| Month | August | September | August | August |
3.2. Meteorological Data
3.3. Analysis Method of Delayed Response
| Delayed Response Time | Reference Series (X0) | Comparison Series (Xi) |
|---|---|---|
| 0 | 2003–2013 | 2003–2013 |
| 1 | 2003–2013 | 2002–2012 |
| 2 | 2003–2013 | 2001–2011 |
| 3 | 2003–2013 | 2000–2010 |
| 4 | 2003–2013 | 1999–2009 |
| 5 | 2003–2013 | 1998–2008 |
4. Results and Discussions
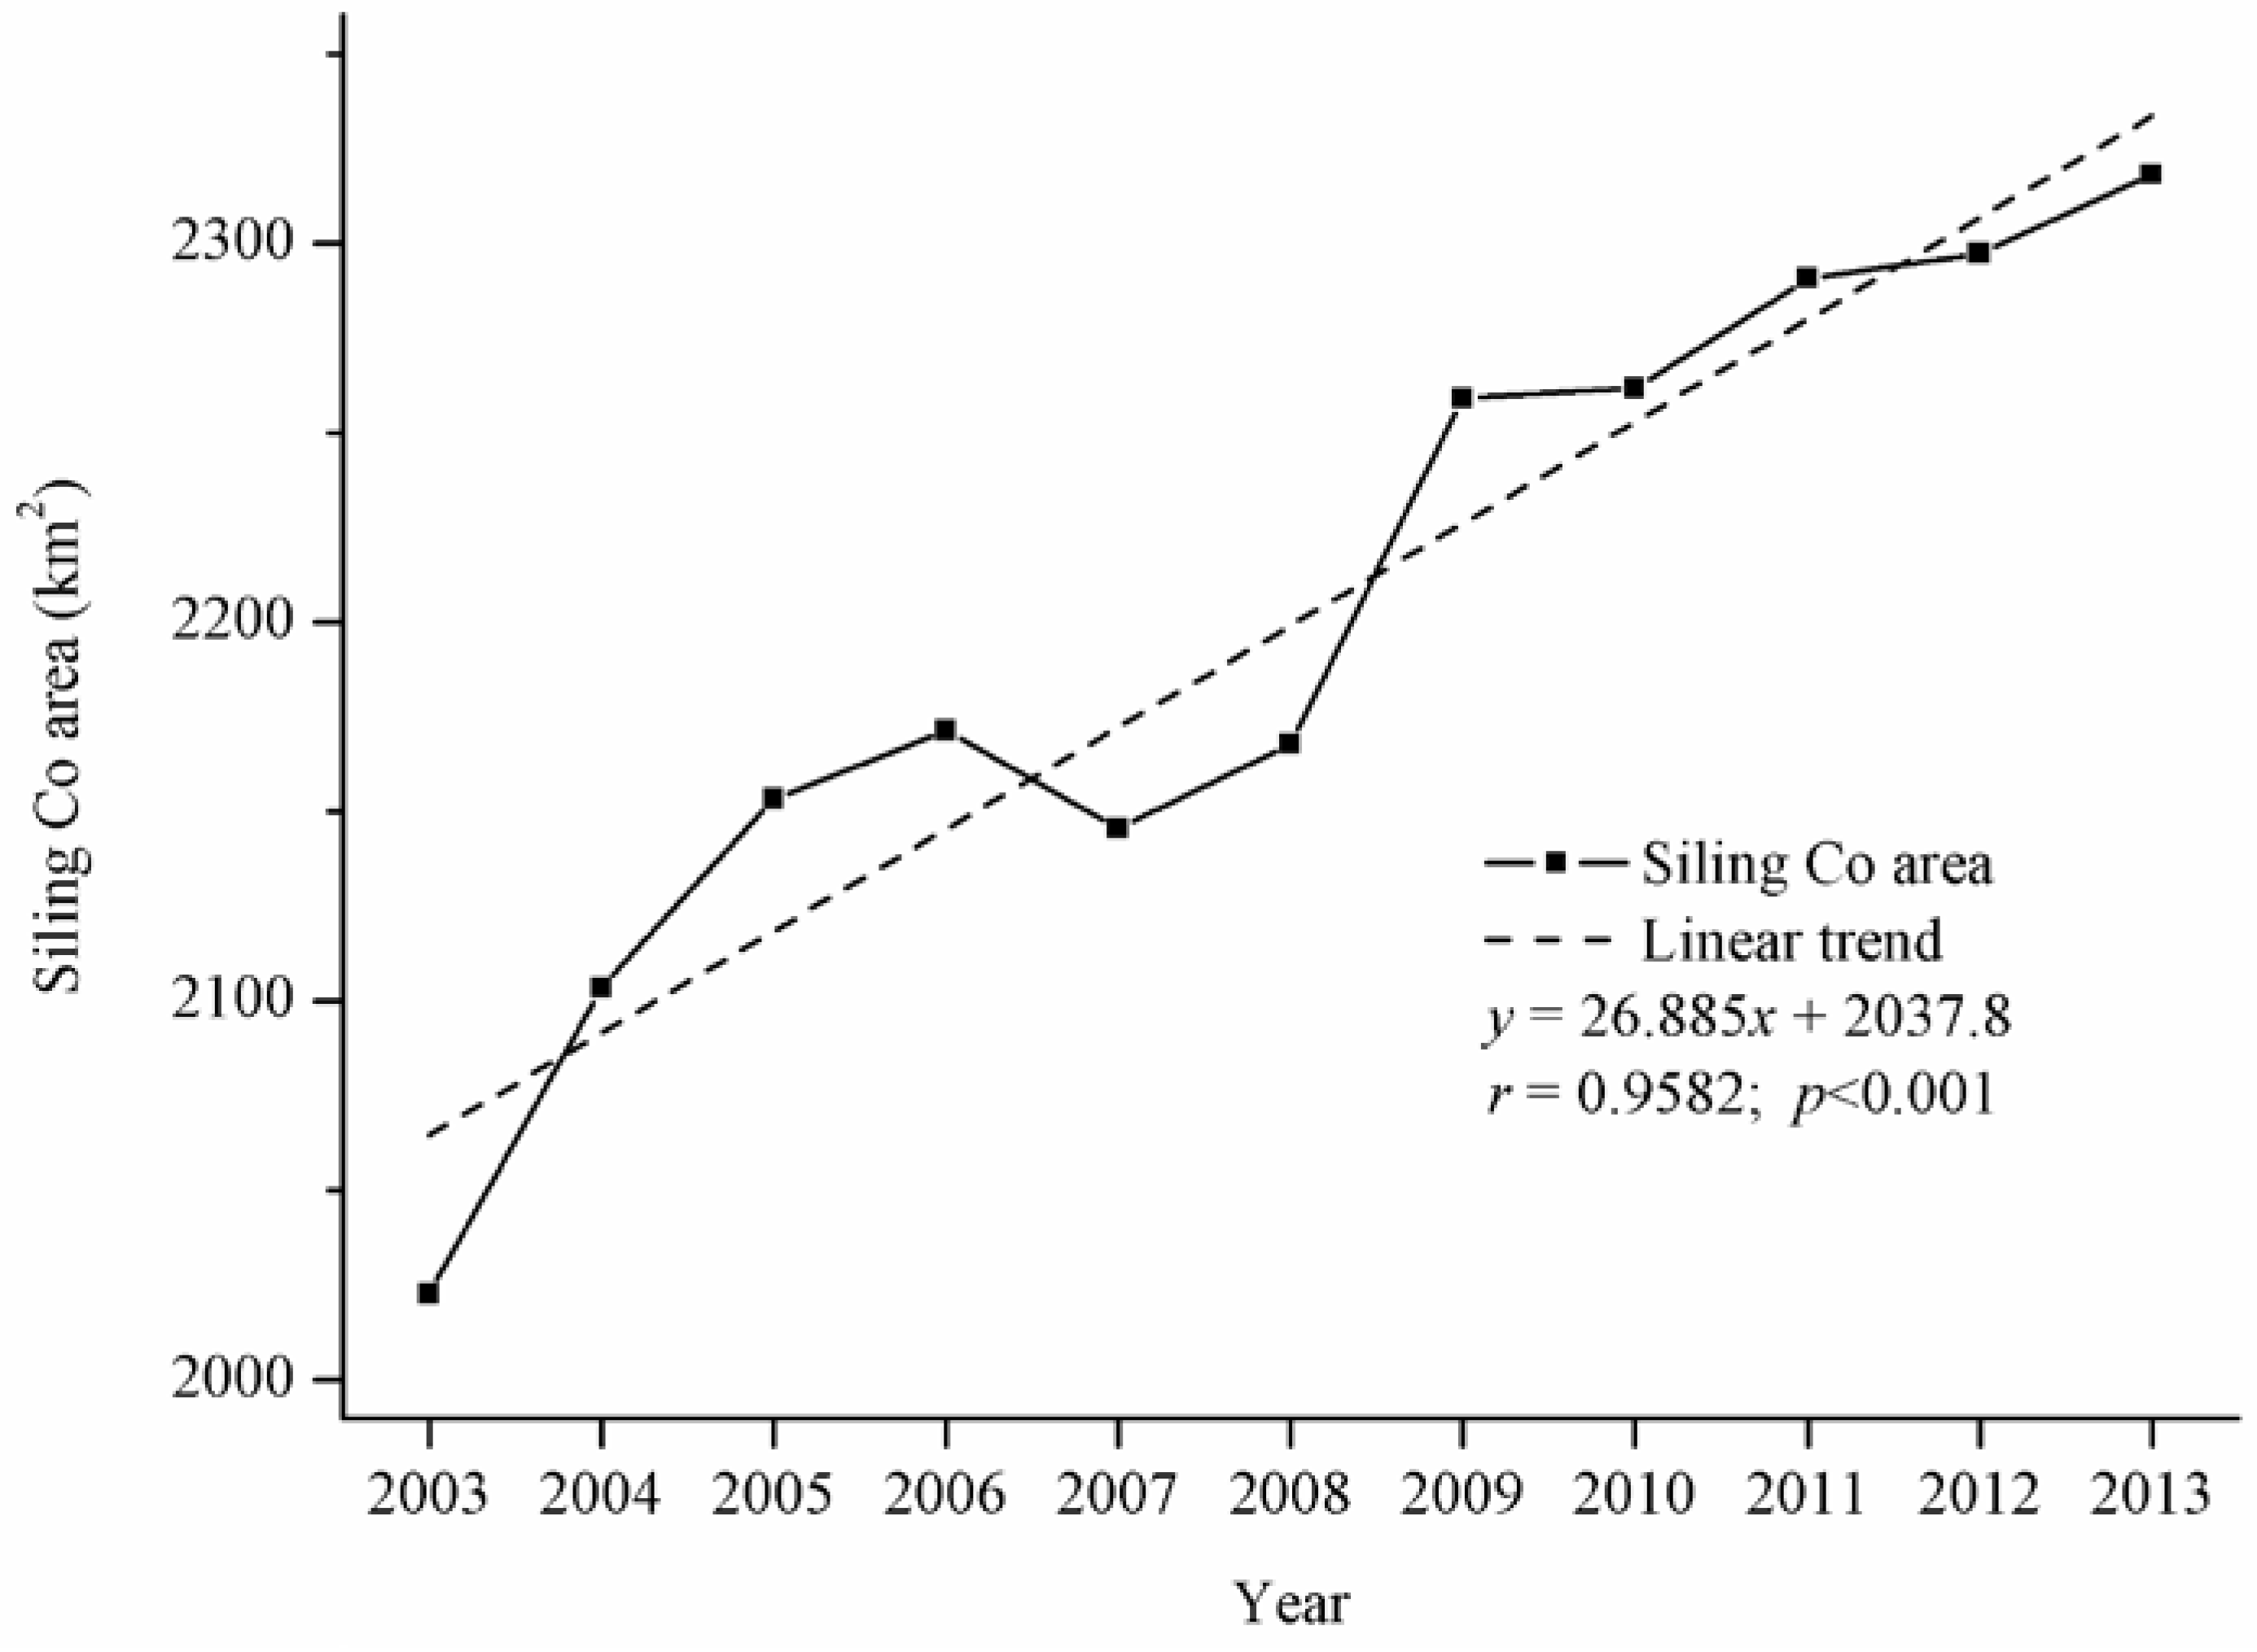
4.1. Siling Co Lake Area Changes
| Year | Change (km2) | Change Rate (%) | Growth Rate (km2∙year−1) |
|---|---|---|---|
| 2003–2006 | 148.52 | 7.34% | 37.13 |
| 2006–2009 | 87.75 | 4.04% | 21.94 |
| 2009–2013 | 59.00 | 2.61% | 11.8 |
| 2003–2013 | 295.2713 | 14.60% | 26.84 |
4.2. Changes in Climate Factors
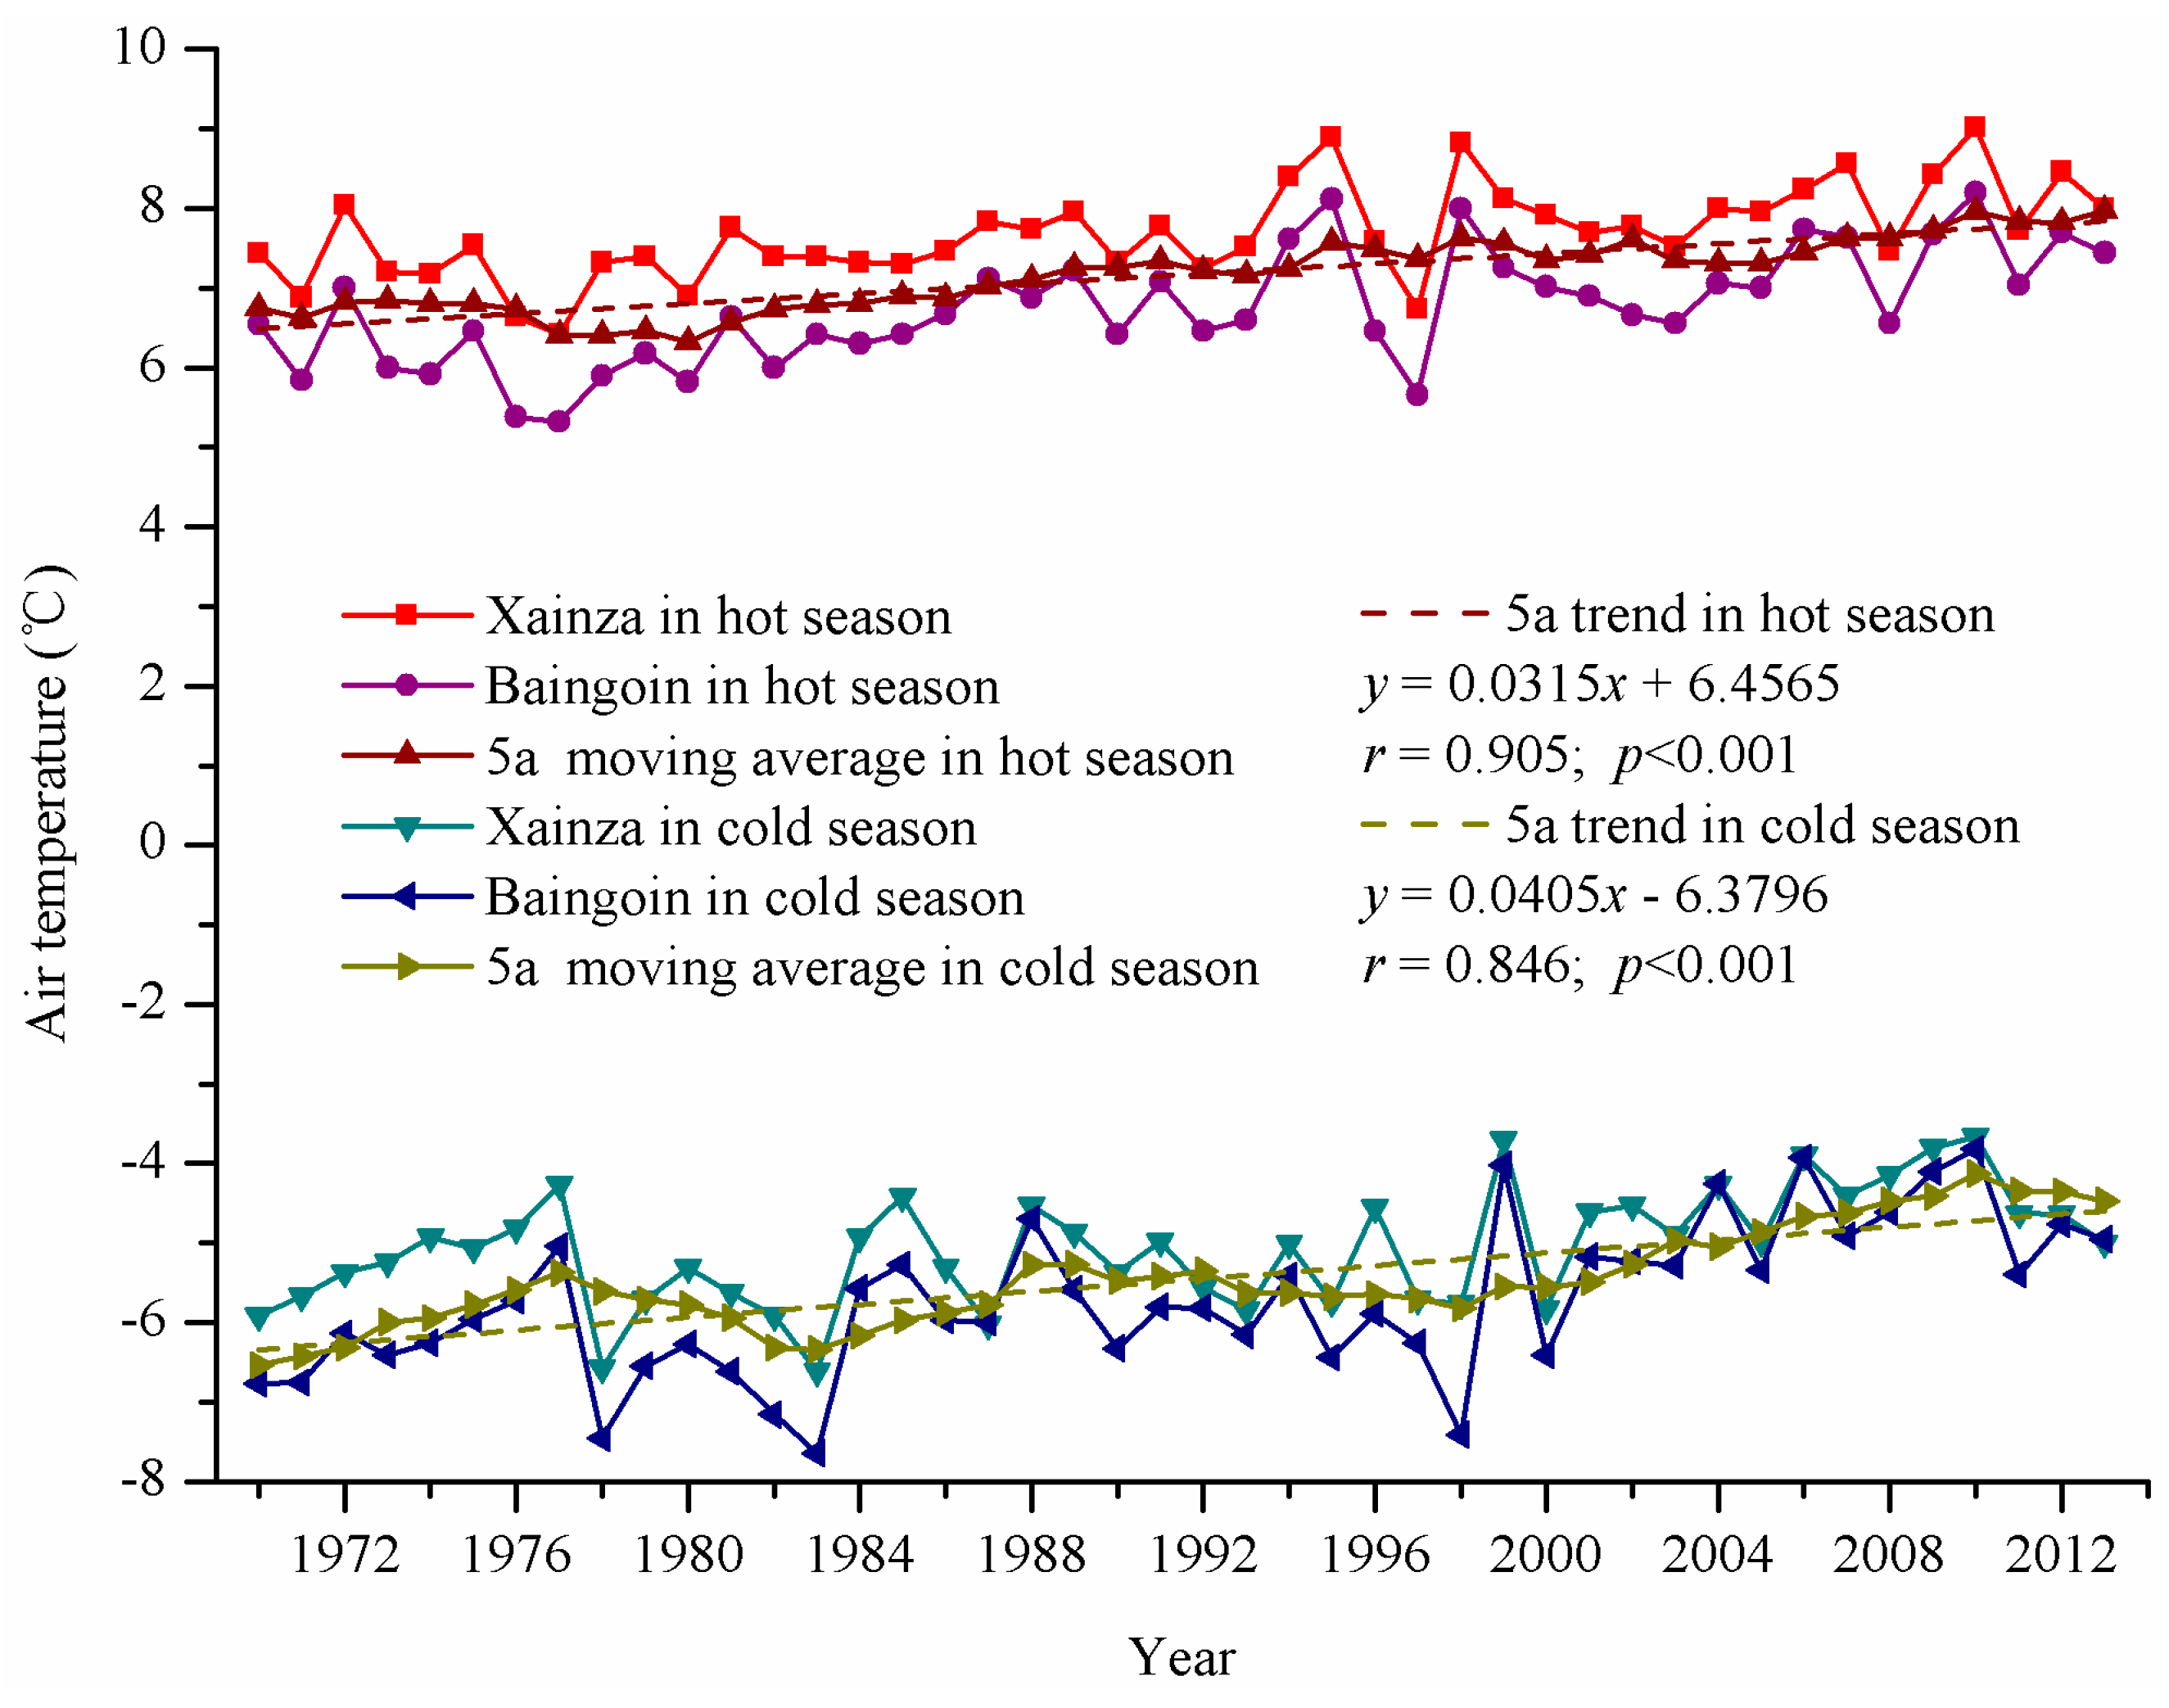
4.2.1. Air Temperature
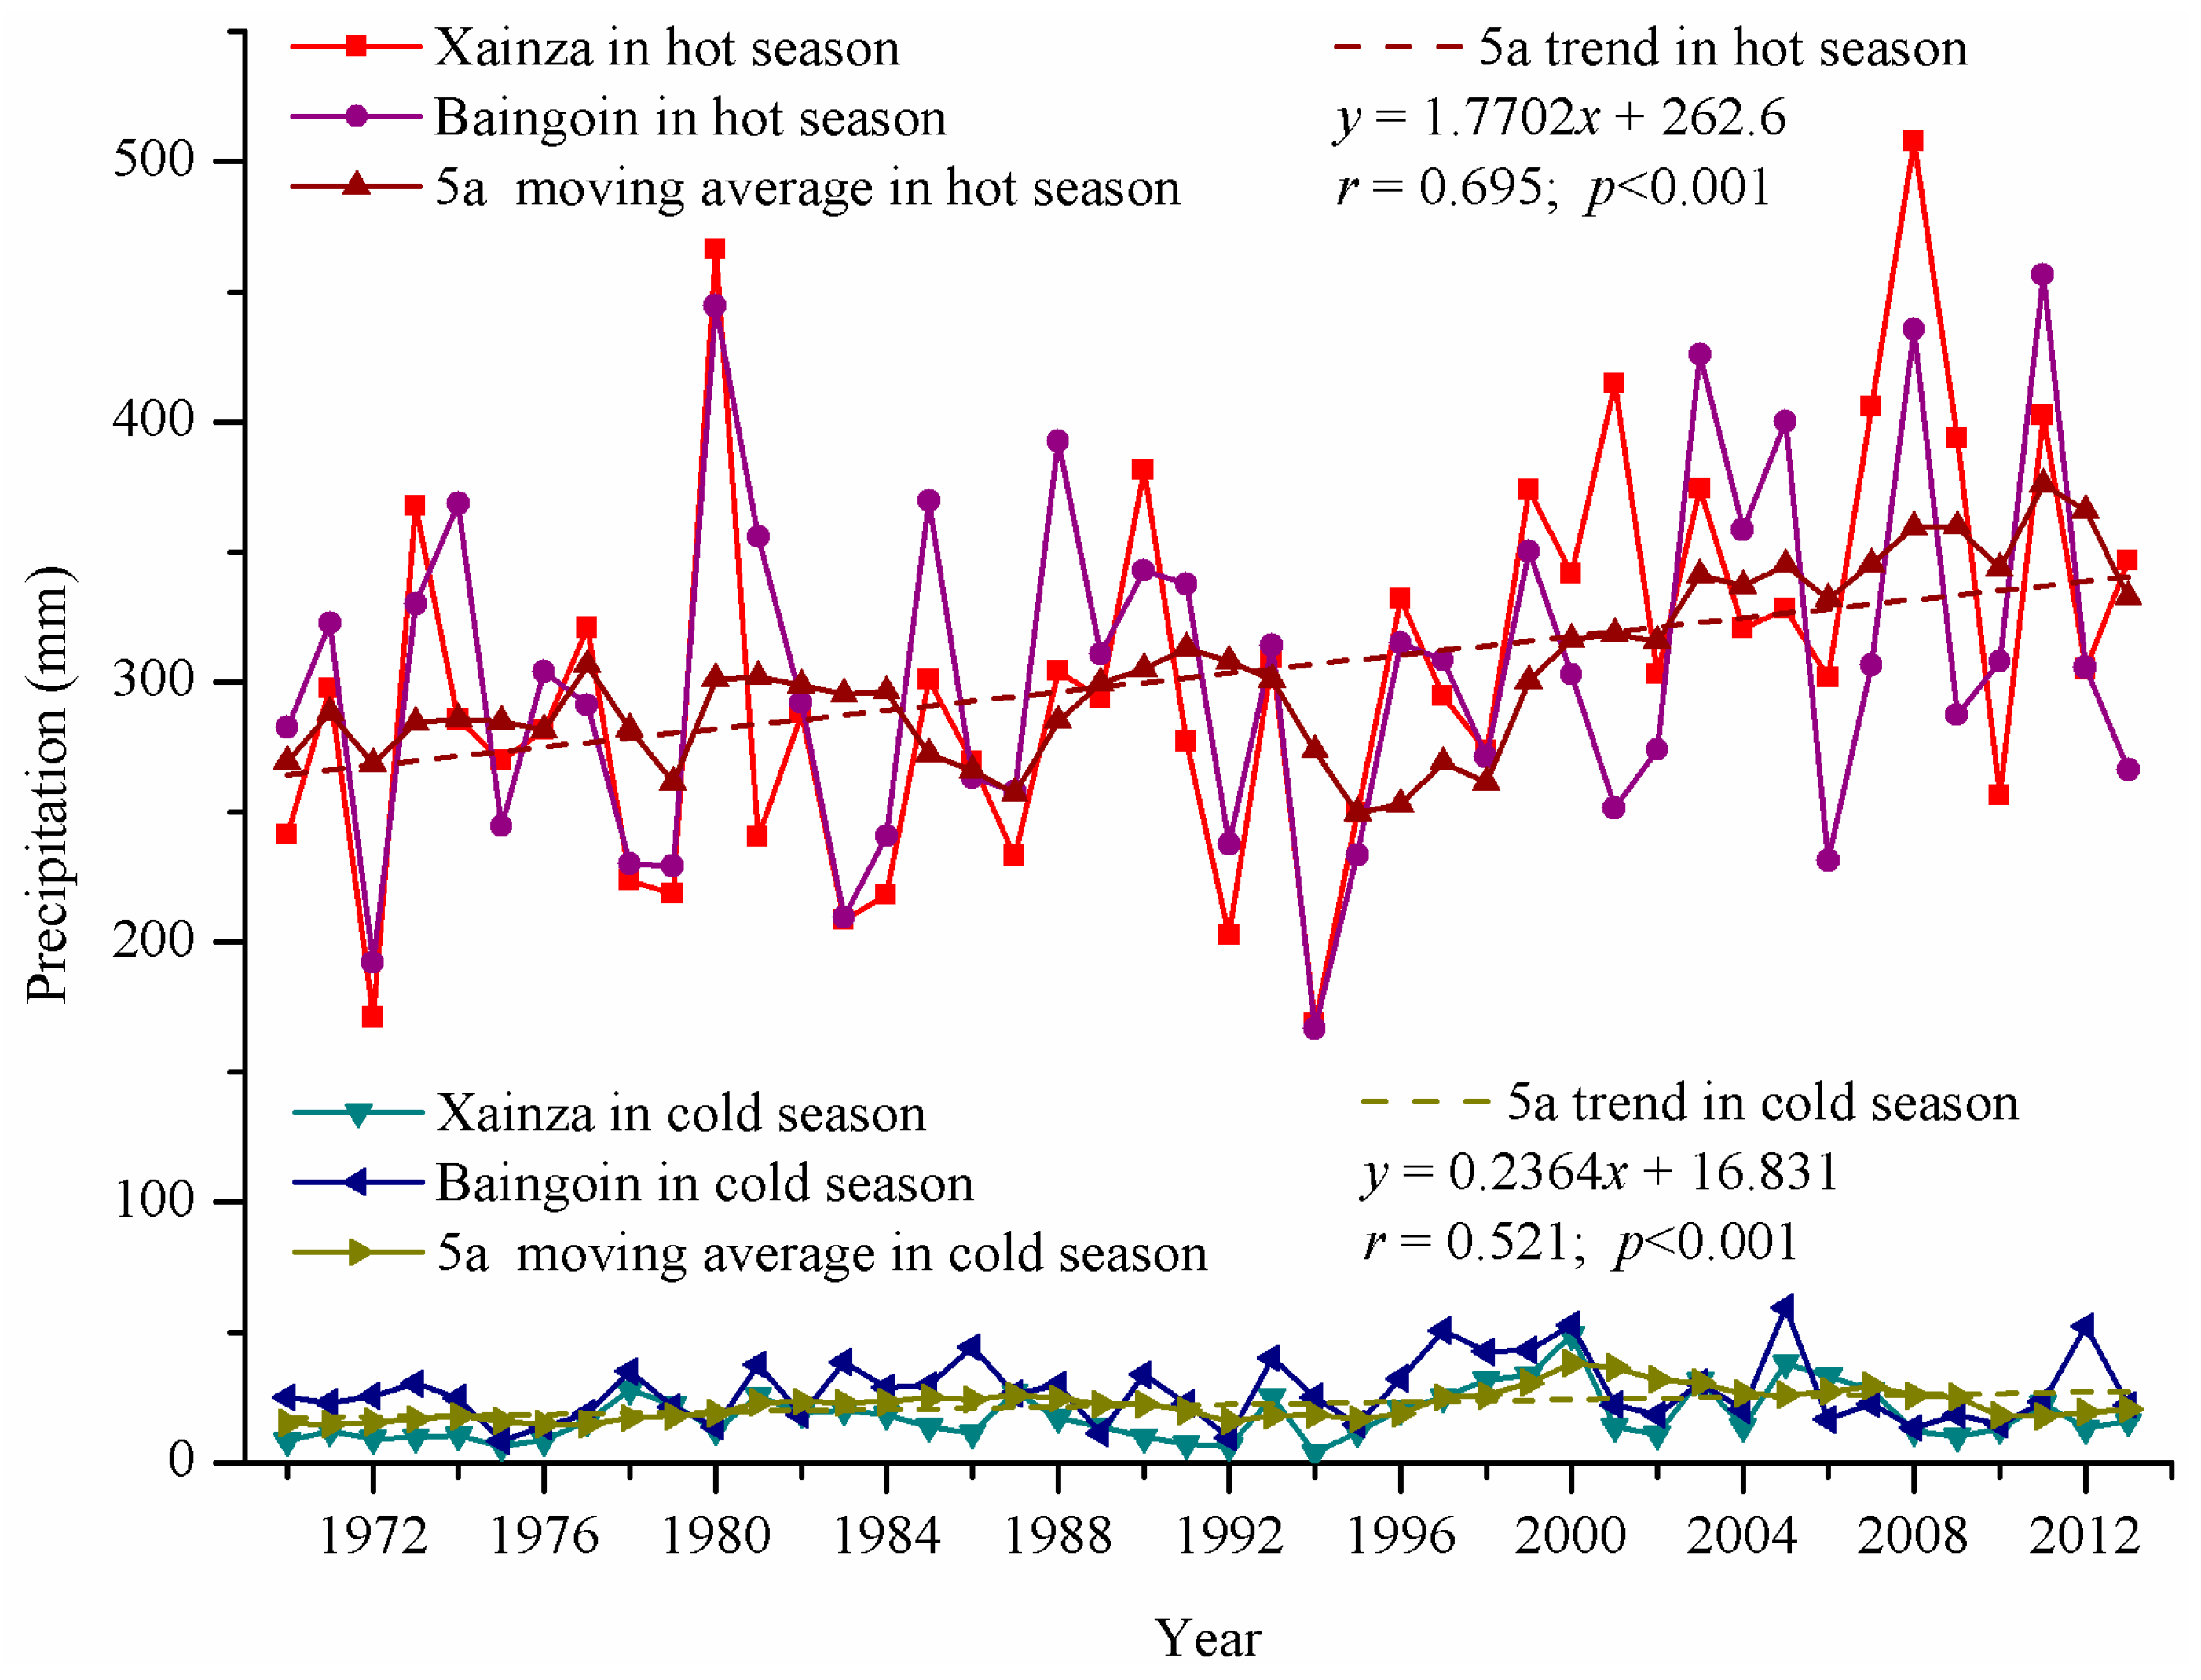
4.2.2. Precipitation

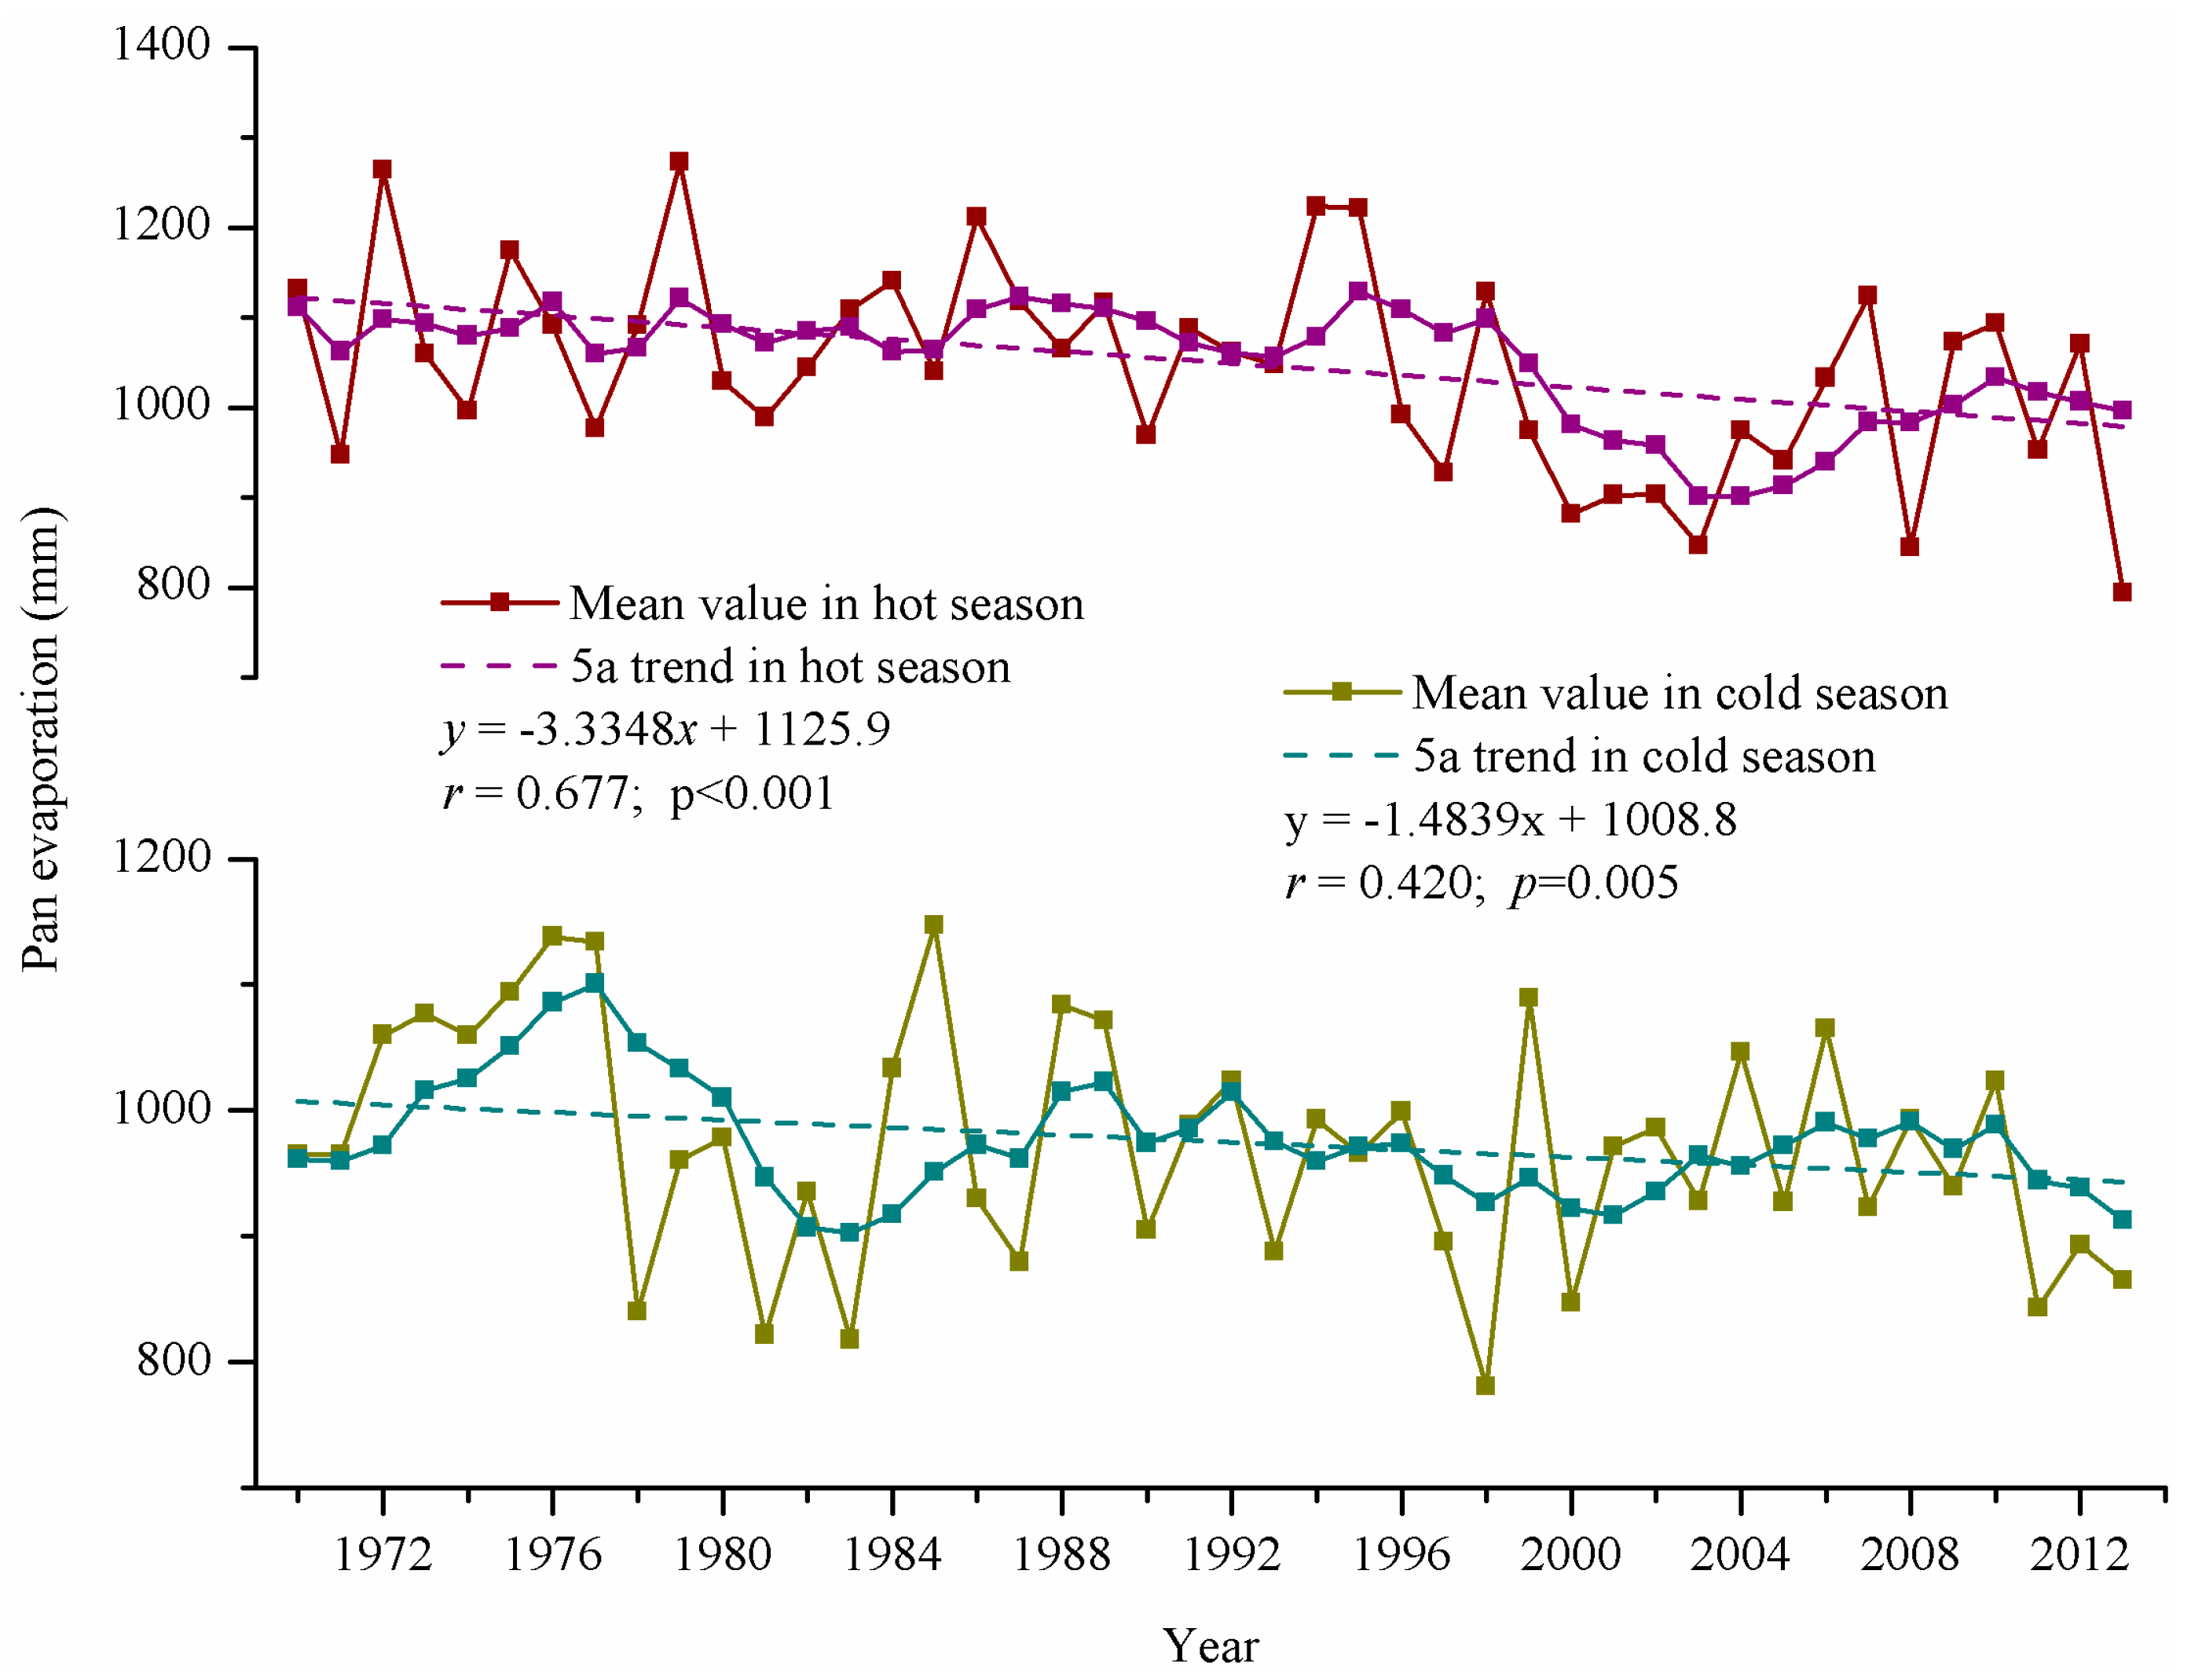
4.2.3. Evaporation

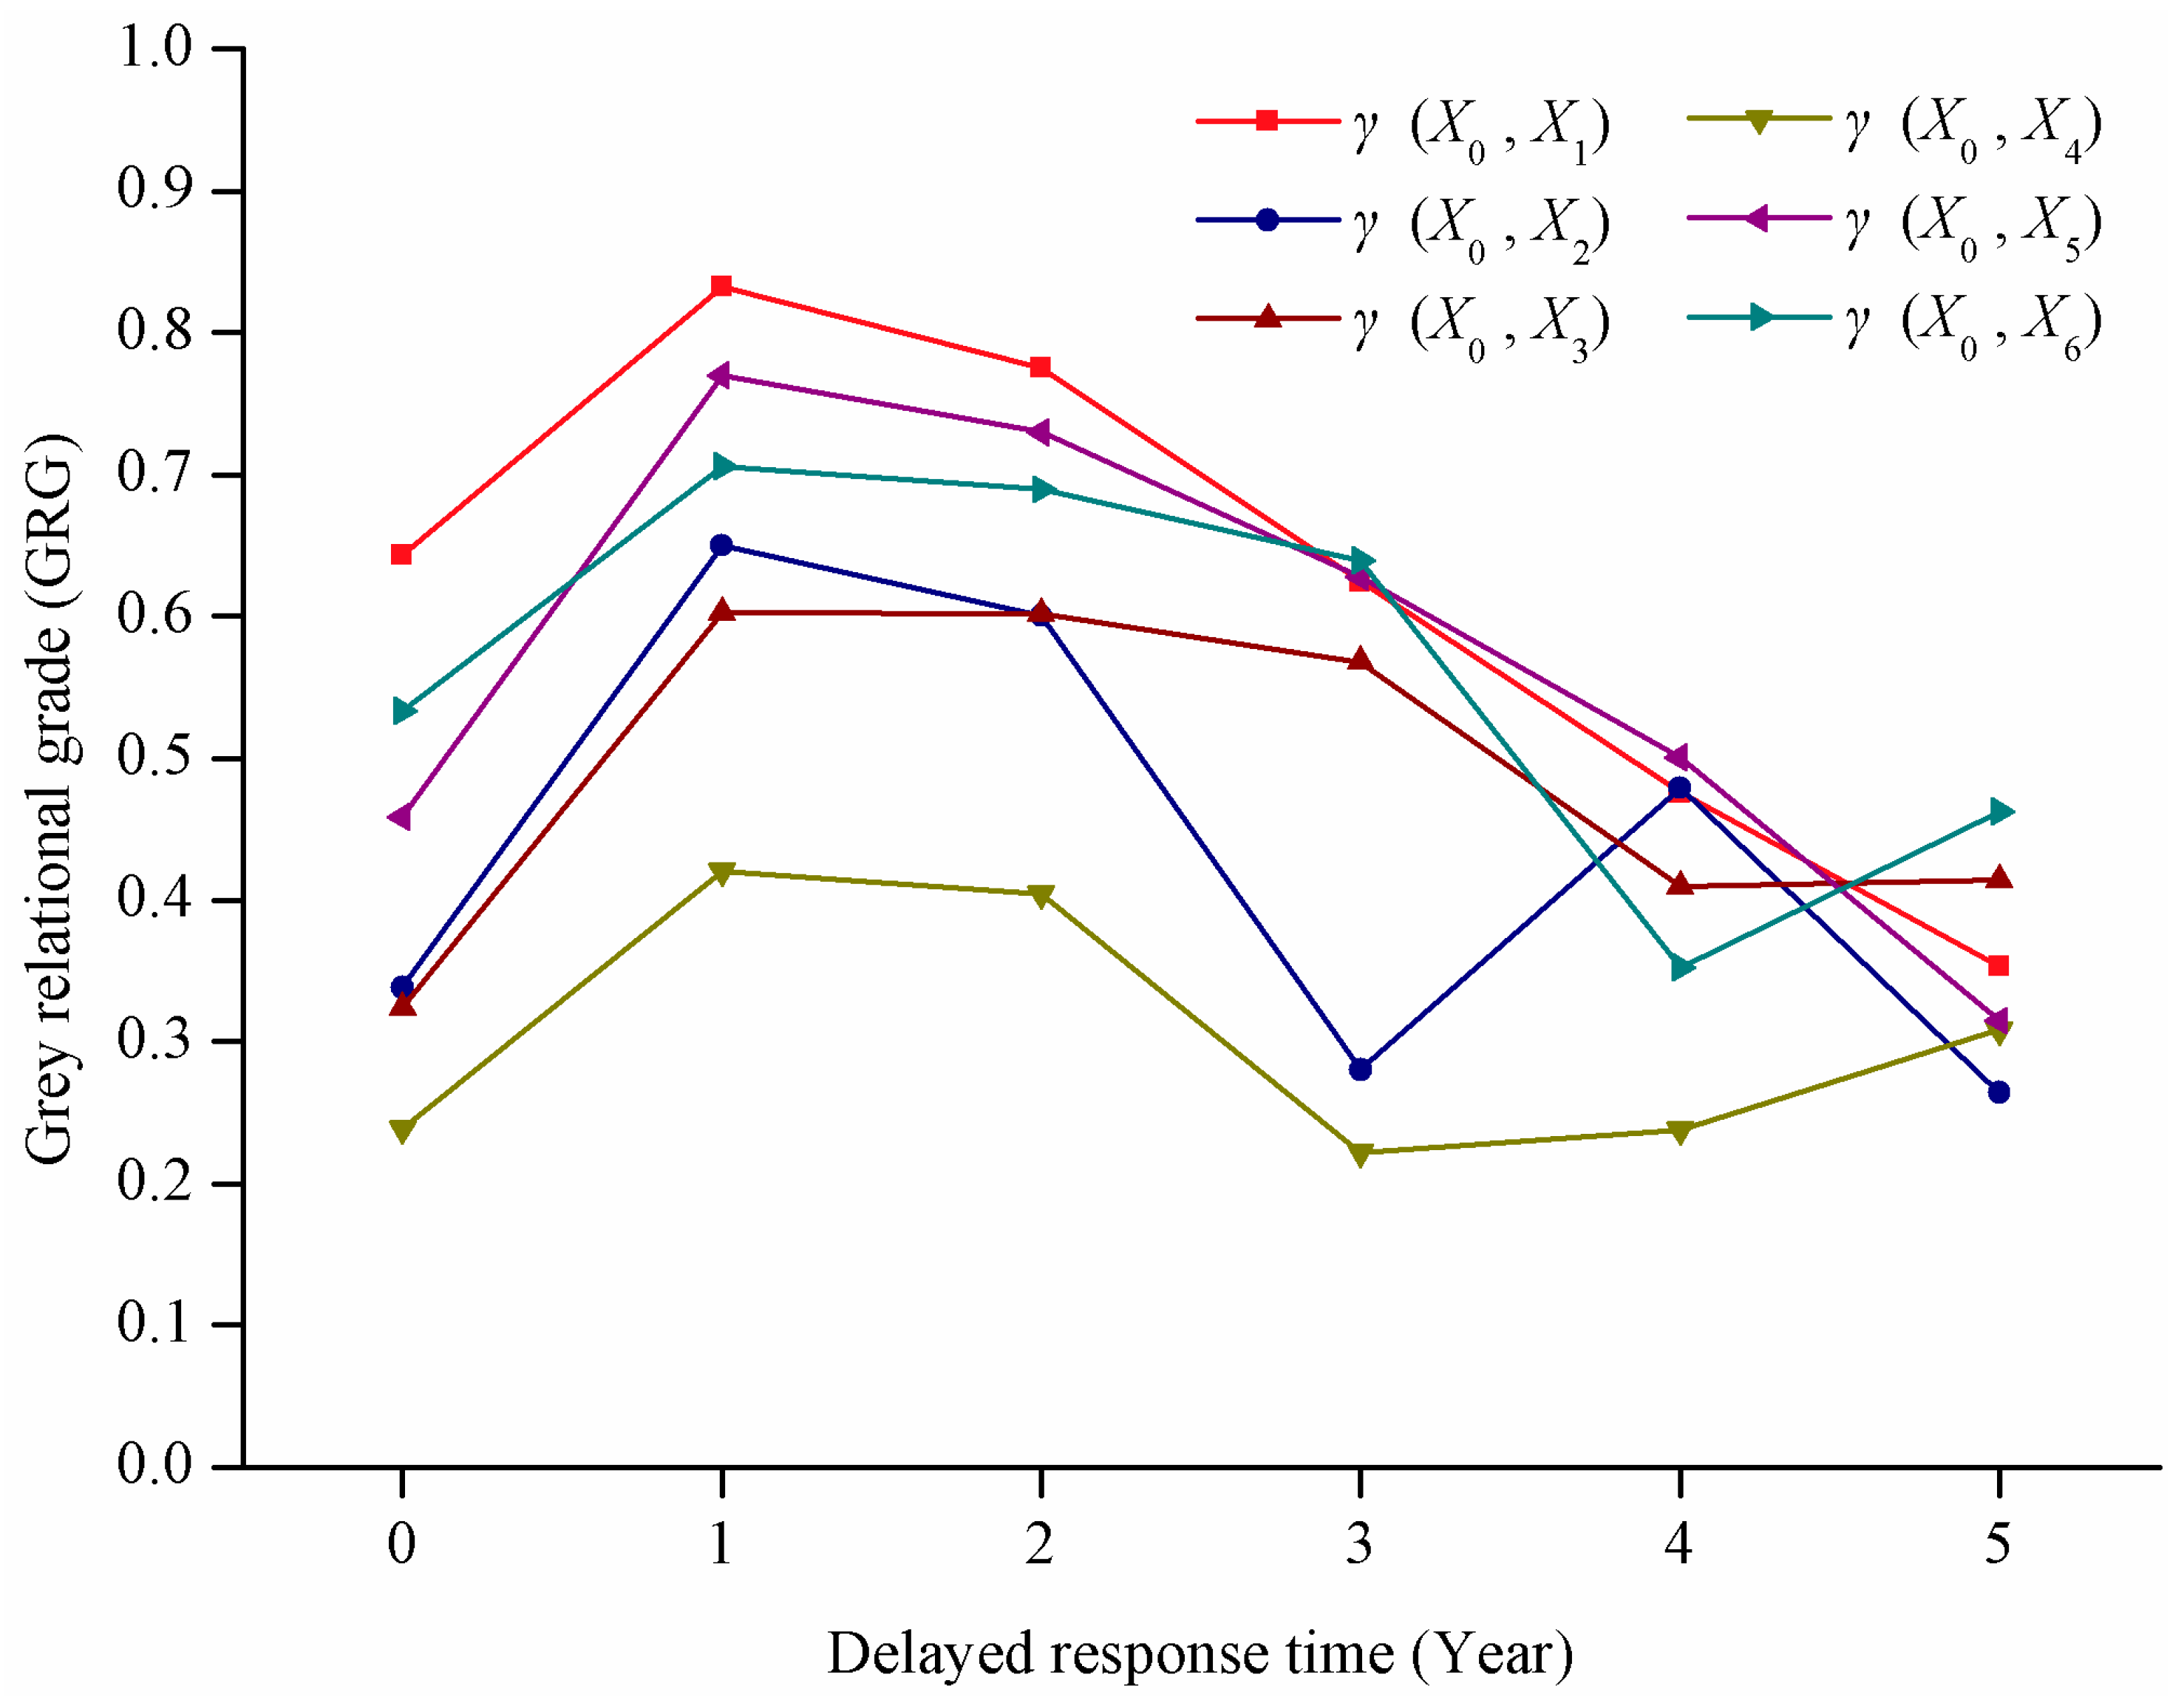
4.3. Analysis of Delayed Response
| X | Items | Factor Series |
|---|---|---|
| X0 | Lake area of Siling Co | Reference series |
| X1 | Hot season mean air temperature (°C) | Comparison series |
| X2 | Cold season mean air temperature (°C) | |
| X3 | Hot season precipitation (mm) | |
| X4 | Cold season precipitation (mm) | |
| X5 | Hot season evaporation (mm) | |
| X6 | Cold season evaporation (mm) |
| GRG | Delayed Response Time (Year) | |||||
|---|---|---|---|---|---|---|
| 0 | 1 | 2 | 3 | 4 | 5 | |
| γ(X0,X1) | 0.6431 | 0.8325 | 0.7755 | 0.6244 | 0.4756 | 0.315 |
| γ(X0,X2) | 0.3384 | 0.6501 | 0.6003 | 0.2803 | 0.4791 | 0.2486 |
| γ(X0,X3) | 0.3239 | 0.6028 | 0.602 | 0.568 | 0.4098 | 0.4531 |
| γ(X0,X4) | 0.2389 | 0.4206 | 0.4041 | 0.222 | 0.238 | 0.2997 |
| γ(X0,X5) | 0.4586 | 0.7698 | 0.7298 | 0.628 | 0.5007 | 0.3148 |
| γ(X0,X6) | 0.5335 | 0.7057 | 0.6896 | 0.6392 | 0.3526 | 0.4627 |

| Contents | Siling Co | Nam Co |
|---|---|---|
| Catchment area (km2) | 50,106.2 | 10,680.4 [32] |
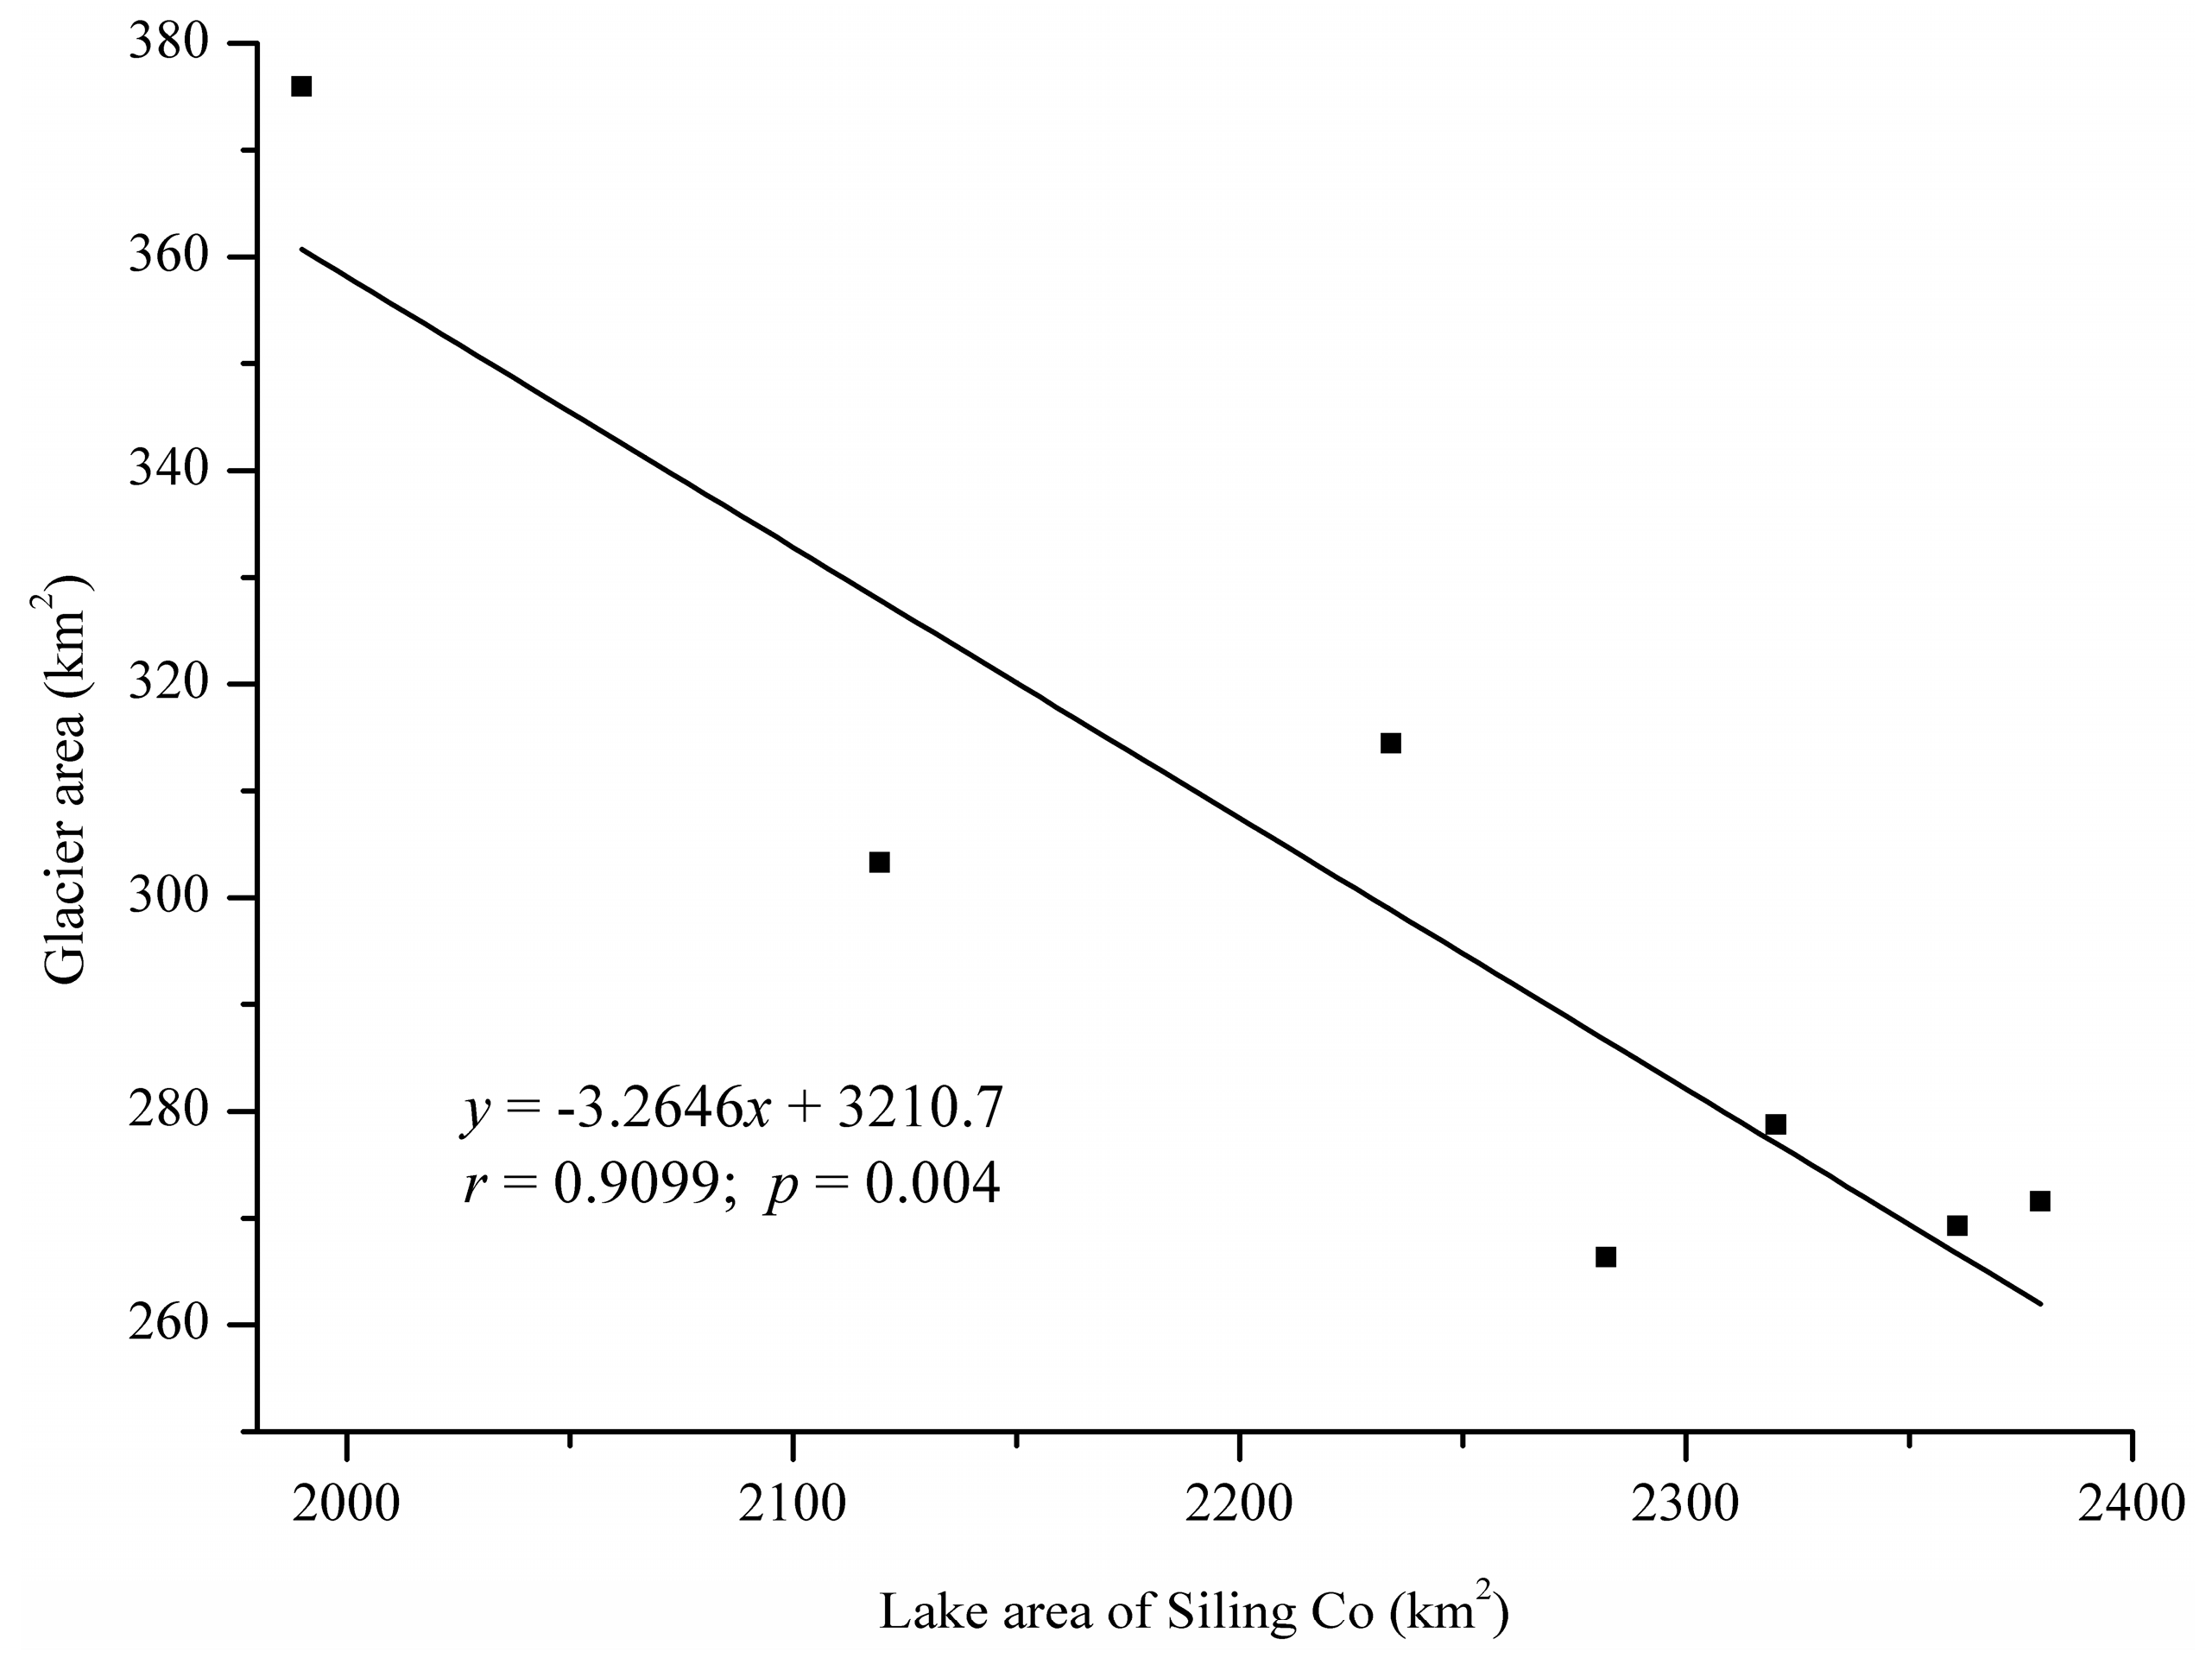
| Glacier area in catchment in 2007 (km2) | 267 | 166.2 [30] |
| Lake area in 2013 (km2) | 2320.12 | 2142.27 |
| Lake area growth rate from 2001 to 2013 (km2·year−1) | 29.95 | 12.84 |

5. Conclusions
- (1)
- The Siling Co lake area exhibited a rapid expansion trend from 2003 to 2013. The lake area had expanded by 295.27 km2 with a growth ratio of 14.6% and annual growth rate of 26.84 km2·year−1. From 2003 to 2006, the lake area expanded rapidly, with an annual growth rate of 37.13 km2·year−1.
- (2)
- An increasing air temperature trend was evident in the Siling Co lake area from 1966 to 2013. The growth rate of air temperature in the hot season was 0.32 °C per ten years. By contrast, the growth rate of air temperature in the cold season was 0.41 °C per ten years, which is slightly greater than that in the hot season. Precipitation in the hot season increased evidently, with a growth rate of 17.70 mm per ten years. By contrast, precipitation in the cold season increased slightly. Pan evaporation exhibited evidently decreasing trends in hot and cold seasons, with rates of −33.35 mm and −14.84 mm per ten years, respectively. In the past 10 years, regional climate evidently became warmer and wetter.
- (3)
- An evident delayed response of the Siling Co lake area change to climate change is observed, with a delay time of approximately one to two years. Overall, the response of lake area changes to air temperature in the hot season is the most significant, followed by hot season evaporation, cold season evaporation, cold season air temperature, and hot season precipitation. The response of lake area changes to precipitation in the cold season is the least significant.
Acknowledgments
Author Contributions
Conflicts of Interest
References
- IPCC. Climate change 2013: The physical science basis. In Intergovernmental Panel on Climate Change; Cambridge University Press: Cambridge, UK, 2014; pp. 100–1050. [Google Scholar]
- Verhaar, P.M.; Biron, P.M.; Ferguson, R.I. Implications of climate change in the twenty-first century for simulated magnitude and frequency of bed-material transport in tributaries of the Saint-Lawrence River. Hydrol. Process. 2010, 25, 1558–1573. [Google Scholar] [CrossRef]
- Zeng, J.J.; Jin, Y.Z.; Sun, D.Y.; Hu, X.Q.; Lu, S.C. Research progress on impact of climate variation on water resource in arid inland river basin. J. Water Resour. Water Eng. 2015, 26, 72–78. [Google Scholar]
- Shao, Z.G.; Zhu, D.G.; Meng, X.G.; Zheng, D.X.; Qiao, Z.J.; Yang, C.B.; Han, J.E.; Yu, J.; Meng, Q.W.; Lv, R.P. Characteristics of the change of major lakes on the Qinghai-Tibet Plateau in the last 25 years. Geol. Bull. China 2007, 26, 1633–1645. [Google Scholar] [CrossRef]
- Lu, A.X.; Yao, T.D.; Wang, L.H.; Liu, S.Y.; Guo, Q.L. Study on the fluctuations of typical glaciers and lakes in the Tibetan Plateau using remote sensing. J. Glaciol. Geocryol. 2005, 27, 783–792. [Google Scholar]
- Williamson, C.E.; Saros, J.E.; Schindler, D.W. Sentinels of change. Science 2009, 323, 887–888. [Google Scholar] [CrossRef] [PubMed]
- Williamson, C.E.; Saros, J.E.; Vincent, W.F.; Smold, J.P. Lakes and reservoirs as sentinels, integrators, and regulators of climate change. Limnol. Oceanogr. 2009, 54, 2273–2282. [Google Scholar] [CrossRef]
- Adrian, R.; O’Reilly, C.M.; Zagarese, H.S.; Baines, B.; Hessen, D.O.; Keller, W. Lakes as sentinels of climate change. Limnol. Oceanogr. 2009, 54, 2283–2297. [Google Scholar] [CrossRef] [PubMed]
- Wan, W.; Xiao, P.F.; Feng, X.Z.; Li, H.; Ma, R.H.; Duan, H.T.; Zhao, L.M. Monitoring lake changes of Qinghai-Tibetan Plateau over the past 30 years using satellite remote sensing data. Chin. Sci. Bull. 2014, 59, 1021–1035. [Google Scholar] [CrossRef]
- Bian, D.; Bian, B.; La, B.; Wang, C.Y.; Cheng, T. The response of water level of Selin Co to climate change during 1975–2008. Acta Geogr. Sin. 2010, 65, 313–319. [Google Scholar]
- La, B.; Chen, T.; La, B.Z.; Ci, Z. Area change of Selincuo Lake and its forming reasons based on MODIS data. J. Meteorol. Environ. 2011, 27, 68–72. [Google Scholar]
- Huang, W.D.; Liao, J.J.; Sheng, G.Z. Lake change in past 40 years in the Southern Nagqu district of Tibet and analysis of its driving forces. Remote Sens. Land Resour. 2012, 94, 122–128. [Google Scholar]
- Meng, K.; Shi, X.H.; Wang, E.Q.; Liu, F. High-altitude salt lake elevation changes and glacial ablation in Central Tibet, 2000–2010. Chin. Sci. Bull. 2012, 57, 571–579. [Google Scholar] [CrossRef]
- Du, J.T.; Yang, B.; He, Y. Glaciers and lakes changes and climate response in the Selin Co Basin from 1990 to 2011. J. Arid Land Resour. Environ. 2014, 28, 88–93. [Google Scholar]
- Yi, G.H.; Deng, W.; Li, A.N.; Zhang, T.B. Response of lakes to climate change in Xainza basin Tibetan Plateau using multi-mission satellite data from 1976 to 2008. J. Mt. Sci. 2015, 12, 604–613. [Google Scholar] [CrossRef]
- Bian, D.; Bian, B.; Li, L.; Wang, W.; Zha, X. The response of lake change to climate fluctuation in north Qinghai-Tibet Plateau in last 30 years. J. Geogr. Sci. 2009, 19, 131–142. [Google Scholar] [CrossRef]
- Wu, Y.H.; Zhu, L.P. The response of lake-glacier variations to climate change in Nam Co Catchment, central Tibetan Plateau, during 1970–2000. J. Geogr. Sci. 2008, 18, 177–189. [Google Scholar] [CrossRef]
- Jiang, Y.J.; Li, S.J.; Shen, D.F.; Chen, W.; Jing, C.F. Climate change and its impact on the lake environment in the Tibetan Plateau in 1971–2008. Sci. Geogr. Sin. 2012, 32, 1503–1512. [Google Scholar]
- Yang, Z.G.; Du, J.; Lin, Z.Q. Extreme air temperature changes in Selin Co basin, Tibet (1961–2012). Acta Ecol. Sin. 2015, 35, 613–621. [Google Scholar]
- Ding, Y.J. Response of global glaciers fluctuation to climatic change in recent 40 years. Sci. China B 1995, 25, 1093–1098. [Google Scholar]
- Liu, S.F.; Dang, Y.G.; Fang, Z.G. Grey System Theory and Its Application; Science Press: Beijing, China, 2010; pp. 1–104. [Google Scholar]
- Justice, C.O.; Townshend, J.R.; Vermote, E.F.; Masuoka, E.; Wolfe, R.E.; Saleous, N.; Roy, D.P.; Morisette, J.T. An overview of MODIS Land data processing and product status. Remote Sens. Environ. 2002, 3–15. [Google Scholar] [CrossRef]
- Kang, X.M.; Wang, Y.F.; Chen, H.; Tian, J.Q.; Cui, X.Y.; Rui, Y.C.; Zhong, L.; Kardol, P.; Hao, Y.B.; Xiao, X.M. Modeling carbon fluxes using multi-temporal MODIS imagery and CO2 eddy flux tower data in Zoige Alpine wetland, South-West China. Wetlands 2014, 34, 603–618. [Google Scholar] [CrossRef]
- Zhou, L.; Guo, S.L.; Zhang, T.; He, K.Z.; Wang, Q.F. Grey relativity analysis of climate change and water level in Hongze Lake Wetland. Environ. Sci. Technol. 2012, 35, 25–29. [Google Scholar]
- Du, J.; Bian, D.; Bao, J.H.; La, B.; Lu, H.Y. Changes of pan evaporations and its impact factors over northern Tibet in 1971–2006. Adv. Water Sci. 2008, 19, 786–791. [Google Scholar]
- Yao, T.D.; Qin, D.H.; Shen, Y.P.; Zhao, L.; Wang, N.L.; Lu, A.X. Cryospheric changes and their impacts on regional water cycle and ecological conditions in the Qinghai-Tibetan Plateau. Chin. J. Nat. 2013, 35, 179–186. [Google Scholar]
- Jin, H.J.; Wang, S.L.; Lü, L.Z.; He, R.X.; Chang, X.L.; Luo, D.L. Features and Degradation of Frozen Ground in the Sources Area of the Yel low River, China. J. Glaciol. Geoyol. 2010, 32, 10–17. [Google Scholar]
- Zhang, Z.Q.; Wu, Q.B. Thermal Hazards Prediction on Qinghai-Tibet Plateau Permafrost Region. J. Jilin Univ. (Earth Sci. Ed.) 2012, 42, 454–484. [Google Scholar]
- Zhao, L.; Yong, J.; Liu, G.Y.; Wang, S.L.; Jin, H.J. Estimates of the Reserves of Ground Ice in Permafrost Regions on the Tibetan Plateau. J. Glaciol. Geoyol. 2010, 32, 1–8. [Google Scholar]
- Zhu, L.P.; Xie, M.P.; Wu, Y.H. Quantitative analysis of lake area variations and the influence factors from 1971 to 2004 in the Nam Co Basin of the Tibetan Plateau. Chin. Sci. Bull. 2010, 55, 1294–1303. [Google Scholar] [CrossRef]
- Yao, T.D.; Li, Z.G.; Yang, W.; Guo, X.J.; Zhu, L.P.; Kang, S.C.; Wu, Y.H.; Yu, W.S. Glacial distribution and mass balance in the Yarlung Zangbo River and its influence on lakes. Chin. Sci. Bull. 2010, 55, 2072–2078. [Google Scholar] [CrossRef]
- Cheng, F.; Kang, S.C.; Zhang, Y.J.; You, Q.L. Glaciers and Lake Change in Response to Climate Change in the Nam Co Basin, Tibet. J. Mt. Sci. 2009, 27, 641–647. [Google Scholar]
- Li, L.; Zhu, X.D.; Wang, Z.Y.; Wang, Q.C. Impacting Factors and Changing Tendency of Water Level in Qinghai Lake in Recent 42 Years. J. Desert Res. 2005, 25, 689–696. [Google Scholar]
- Bai, A.J.; Huang, R.; Cheng, Z.G. Change of Water Level of the Qinghai Lakeunder Climate Warming. Arid Zone Res. 2014, 31, 792–797. [Google Scholar]
© 2015 by the authors; licensee MDPI, Basel, Switzerland. This article is an open access article distributed under the terms and conditions of the Creative Commons Attribution license (http://creativecommons.org/licenses/by/4.0/).
Share and Cite
Yi, G.; Zhang, T. Delayed Response of Lake Area Change to Climate Change in Siling Co Lake, Tibetan Plateau, from 2003 to 2013. Int. J. Environ. Res. Public Health 2015, 12, 13886-13900. https://doi.org/10.3390/ijerph121113886
Yi G, Zhang T. Delayed Response of Lake Area Change to Climate Change in Siling Co Lake, Tibetan Plateau, from 2003 to 2013. International Journal of Environmental Research and Public Health. 2015; 12(11):13886-13900. https://doi.org/10.3390/ijerph121113886
Chicago/Turabian StyleYi, Guihua, and Tingbin Zhang. 2015. "Delayed Response of Lake Area Change to Climate Change in Siling Co Lake, Tibetan Plateau, from 2003 to 2013" International Journal of Environmental Research and Public Health 12, no. 11: 13886-13900. https://doi.org/10.3390/ijerph121113886
APA StyleYi, G., & Zhang, T. (2015). Delayed Response of Lake Area Change to Climate Change in Siling Co Lake, Tibetan Plateau, from 2003 to 2013. International Journal of Environmental Research and Public Health, 12(11), 13886-13900. https://doi.org/10.3390/ijerph121113886