3.1. Optimisation of the HPLC-MS/MS and Extraction Protocols
Initially, the method employed by Nebot
et al. [
36] was selected for the analysis of the collected samples. However, based on the capability of a Synergy-Polar column in the laboratory, this column was selected to perform the analysis instead of a Luna column. This change of the chromatographic columns could explain the results obtained for the paracetamol peak, which did not have a Gaussian shape. The results of the analysis of this compound consequently had to be discarded. More compounds were also included in the method (brilliant green, cefalexin, difloxacin, enrofloxacin, gentian violet, leucomalachite green, malachite green, marbofloxacin, norfloxacin, oxolinic acid, sarafloxacin and triamcinolone). The mobile phase employed was different: methanol and water acidified with formic acid instead of ammonium acetate was employed because the best peak resolution and peak shape were achieved with a combination of these solvents. Formic acid aided in the prevention of peak tailing and provided sufficient ionisation [
38,
39]. The reproducibility of the t
R of the selected drugs was evaluated through the RSDs, and their values were in the range between 0.44% and 5.40%.
The SPE protocol described by Nebot
et al. [
36] was initially employed but for the final method some modification were applied. The cartridges were conditioned with 1 mL less of methanol and water, the sample flow was the same but the elution of the drugs was conducted differently. Methanol alone was employed instead of acetone and methanol because a larger number of analytes were recovered. Instead of 2 L of sample, a volume of 500 mL was employed to spend as little time as possible during extraction and to avoid product degradation due to the laboratory conditions. The acidification of the water samples to pH 3 with 1 N HCl solution was performed to improve the interaction between the elution solvent and the analytes in the SPE [
40]. From 19 pharmaceuticals (brilliant green, cefalexin, diclofenac, difloxacin, enrofloxacin, erythromycin, gentian violet, leucomalachite green, malachite green, marbofloxacin, mefenamic acid, norfloxacin, oxolinic acid, propanolol, sarafloxacin, sulfamethoxazole, tamoxifen, triamcinolone and trimethoprim), a total of 13 analytes were extracted satisfactorily. Recoveries of cefalexin, erythromycin, gentian violet, leucomalachite green, mefenamic acid and norfloxacin could not be taken into account because of their low recoveries. Some steps during the extraction of the fortified samples led to degradation and low recoveries of the analytes. In particular, the pH adjustment inhibited the extraction of erythromycin and mefenamic acid. Recoveries of trimethoprim, sulfamethoxazole, propanolol, diclofenac and tamoxifen from fortified river water were higher in this study compared to Nebot
et al. [
36] most likely due to a different extraction protocol, but the LOD and LOQ were lower certainly due to lower sample volume. Another factor that could have improved recoveries would be the use of an internal standard, contrasting with the procedure of Nebot
et al. [
36], who quantified 12 human drugs without the employment of any IS. In this research, the IS sulfadoxine-d
3 was employed to quantify the selected drugs in accordance with Hao
et al., Hilton
et al. and Kasprzyk-Hordern
et al. [
41,
42,
43], who employed one or two ISs to quantify 13 drugs from different therapeutic classes in water samples.
A test was conducted to determine the percent of compound lost during the extraction protocol, in which a battery of water samples was fortified at a concentration of 25 ng·L−1 after the evaporation step. The results showed a loss between 40%–50% of diclofenac, MG, oxolinic acid, propanolol, sulfamethoxazole and tamoxifen during the extraction step.
3.2. Method Validation
The selectivity of the method was investigated by comparing the two MRM transitions of the selected analytes obtained from a standard solution, non-fortified river samples and fortified river samples. The method selectivity was demonstrated by noting the absence of interference peaks at the tR of the analytes and IS for both selected transitions.
When a standard solution containing a mixture of the analytes was injected at different concentrations, the IDL obtained ranged from 0.2 to 6.4 ng·mL
−1, and the IQL ranged from 0.3 to 6.7 ng·mL
−1 (
Table 4). A linear response was also observed for concentrations between 1–200 ng·mL
−1, with a mean
R2 higher than 0.991. The linearity of the whole procedure, samples spiked and extracted as described previously, was observed to have a mean
R2 above 0.979 for a concentration range between 1 and 200 ng·L
−1 (
Table 5).
For fortified samples, the LOD was in the range of 1–3.43 ng·L
−1, and the LOQ was in the range of 3.0–5.15 ng·L
−1 (
Table 4). Although there are reports of lower LODs and LOQs, for example, for tamoxifen (0.03 and 0.08 g·L
−1) [
36], triamcinolone (0.5 and 1.67 ng·L
−1) [
44], and marbofloxacin (LOD = 0.8 ng·L
−1) [
40], other studies present LOD and LOQ values for enrofloxacin (LOD = 34 ng·L
−1, LOQ = 120 ng·L
−1) and trimethoprim (LOD = 91 ng·L
−1, LOQ = 310 ng·L
−1) higher than those reported in this work [
45] where ion trap MS was used by Dinh
et al. [
14] for enrofloxacin (LOD = 3.3 ng·L
−1, LOQ = 11 ng·L
−1) and oxolinic acid (LOD = 1.7 ng·L
−1, LOQ = 5.7 ng·L
−1) and sarafloxacin (LOD = 1.1 ng·L
−1, LOQ = 3.6 ng·L
−1). Martín
et al. and Batt
et al. reported LOD and LOQ values for propanolol (LOD = 1 ng·L
−1, LOQ = 2 ng·L
−1 and LOD = 0.6 ng·L
−1, LOQ = 2.1 ng·L
−1) [
32,
46], lower than the present work. However, for the compounds diclofenac, sulfamethoxazole and trimethoprim (LOD = 15 ng·L
−1, LOQ = 49 ng·L
−1, LOD = 8 ng·L
−1, LOQ = 28 ng·L
−1, LOD = 6 ng·L
−1, LOQ = 20 ng·L
−1), the values were considerably greater [
32]. Data from Ashton
et al. [
47] showed much higher values than those obtained in this work for sulfamethoxazole, trimethoprim, propanolol, diclofenac and tamoxifen. To the authors’ knowledge, no LOD and LOQ values are available for malachite green and brilliant green in surface water to compare with those obtained in this study.
The MDL was calculated for each analyte using river samples fortified with the pharmaceuticals at a concentration of 25 ng·L
−1. MDL values for each analyte are summarised in
Table 4, and the range was between 2 and 15.1 ng·L
−1. The MDL values for diclofenac and sulfamethoxazol achieved during this research were lower than those published by Cahill
et al. and Yang
et al. [
48,
49]; Muñóz
et al. reported the same MDL for propanolol (2 ng·L
−1) [
50]. However, data obtained for trimethoprim and enrofloxacin were higher than those reported by Senta
et al., who achieved MDLs for these compounds between 1–8.5 ng·L
−1 [
39]. Batt
et al. also report MDLs for sulfamethoxazole and propanolol (5.5 and 1.3 ng·L
−1) [
46], and Kasprzyk-Hordern
et al. report an MDL for diclofenac (0.05 ng·L
−1) [
51]. Once again, no data for malachite green and brilliant green in surface water samples were found.
Table 4.
Instrument detection limit (IDL), instrument quantification limit (IQL), limit of detection (LOD), limit of quantification (LOQ) and method detection limit (MDL).
Table 4.
Instrument detection limit (IDL), instrument quantification limit (IQL), limit of detection (LOD), limit of quantification (LOQ) and method detection limit (MDL).
| Analyte | IDL (ng·mL−1) | IQL (ng·mL−1) | LOD (ng·L−1) | LOQ (ng·L−1) | MDL (ng·L−1) |
|---|
| Brilliant Green | 0.2 | 0.3 | 2.6 | 3.0 | 7.4 |
| Diclofenac | 0.7 | 0.8 | 2.0 | 2.10 | 11.1 |
| Difloxacin | 0.3 | 0.5 | 1.0 | 3.0 | 8.8 |
| Enrofloxacin | 5.4 | 5.8 | 1.37 | 5.15 | 8.1 |
| Malachite Green | 0.2 | 0.3 | 1.5 | 3.3 | 10.9 |
| Marbofloxacin | 0.2 | 0.3 | 1.0 | 3.0 | 8.1 |
| Oxolinic Acid | 6.4 | 6.7 | 3.43 | 3.86 | 9.3 |
| Propanolol | 0.2 | 0.3 | 1.0 | 3.0 | 2.0 |
| Sarafloxacin | 4.6 | 4.8 | 2.1 | 5.2 | 11.9 |
| Sulfamethoxazole | 0.2 | 0.3 | 1.0 | 3.0 | 11.2 |
| Tamoxifen | 0.2 | 0.3 | 2.0 | 3.0 | 13.5 |
| Triamcinolone | 0.9 | 1.1 | 1.0 | 3.0 | 7.6 |
| Trimethoprim | 0.2 | 0.3 | 1.0 | 3.0 | 15.1 |
Table 5.
Regression coefficients (R2), mean recoveries and relative standard deviation (RSD) of the selected veterinary drugs.
Table 5.
Regression coefficients (R2), mean recoveries and relative standard deviation (RSD) of the selected veterinary drugs.
| Analyte | ICC R2 | SCC R2 | Mean Recovery (%) | RSD (%) |
|---|
| Brilliant Green | 0.996 | 0.989 | 80 | 20 |
| Diclofenac | 0.999 | 0.999 | 77 | 16 |
| Difloxacin | 0.993 | 0.995 | 60 | 26 |
| Enrofloxacin | 0.997 | 0.979 | 60 | 27 |
| Malachite Green | 0.999 | 0.997 | 79 | 25 |
| Marbofloxacin | 0.991 | 0.986 | 60 | 23 |
| Oxolinic Acid | 0.994 | 0.991 | 62 | 25 |
| Propanolol | 0.999 | 0.999 | 93 | 10 |
| Sarafloxacin | 0.995 | 0.990 | 72 | 20 |
| Sulfamethoxazole | 0.999 | 0.999 | 82 | 25 |
| Tamoxifen | 0.994 | 0.999 | 75 | 20 |
| Triamcinolone | 0.994 | 0.993 | 68 | 22 |
| Trimethoprim | 0.999 | 0.998 | 80 | 21 |
Mean recoveries of the selected drugs are summarised in
Table 5, where recoveries higher than 60% can be observed. The highest recoveries were obtained for brilliant green, propanolol, sulfamethoxazole and trimethoprim with values above 80% and RSDs lower than 25%. Diclofenac, malachite green, sarafloxacin and tamoxifen showed recoveries between 72% and 79%, and the RSDs were not higher than 25%. The lower recoveries (60%–68%) corresponded to the quinolone drugs (difloxacin, enrofloxacin, marbofloxacin and oxolinic acid) and triamcinolone with the RSD between 22% and 27%.
Dinh
et al. reported results for recoveries of trimethoprim and sulfamethoxazole (90% and 94%) when the spiked level was 200 ng·L
−1 [
14]. Recoveries for enrofloxacin (83%) and oxolinic acid (75%) were higher and for sarafloxacin were similar (79%). Tamtam
et al. obtained, in general, lower recoveries with a spiked level of 100 ng·L
−1 in river water samples using UPLC-MS/MS for trimethoprim, sulfamethoxazole, sarafloxacin and difloxacin (80%, 68%, 44% and 55%) with high RSDs (11%–29%) [
17]. Recoveries for enrofloxacin were approximately 60% as in the present study. Other publications reported a range of mean recoveries between 38% to 88% for the selected drugs investigated in this study [
39,
47,
52], lower than the values obtained in this research.
3.3. Monitoring the Presence of Drugs in Spanish Rivers
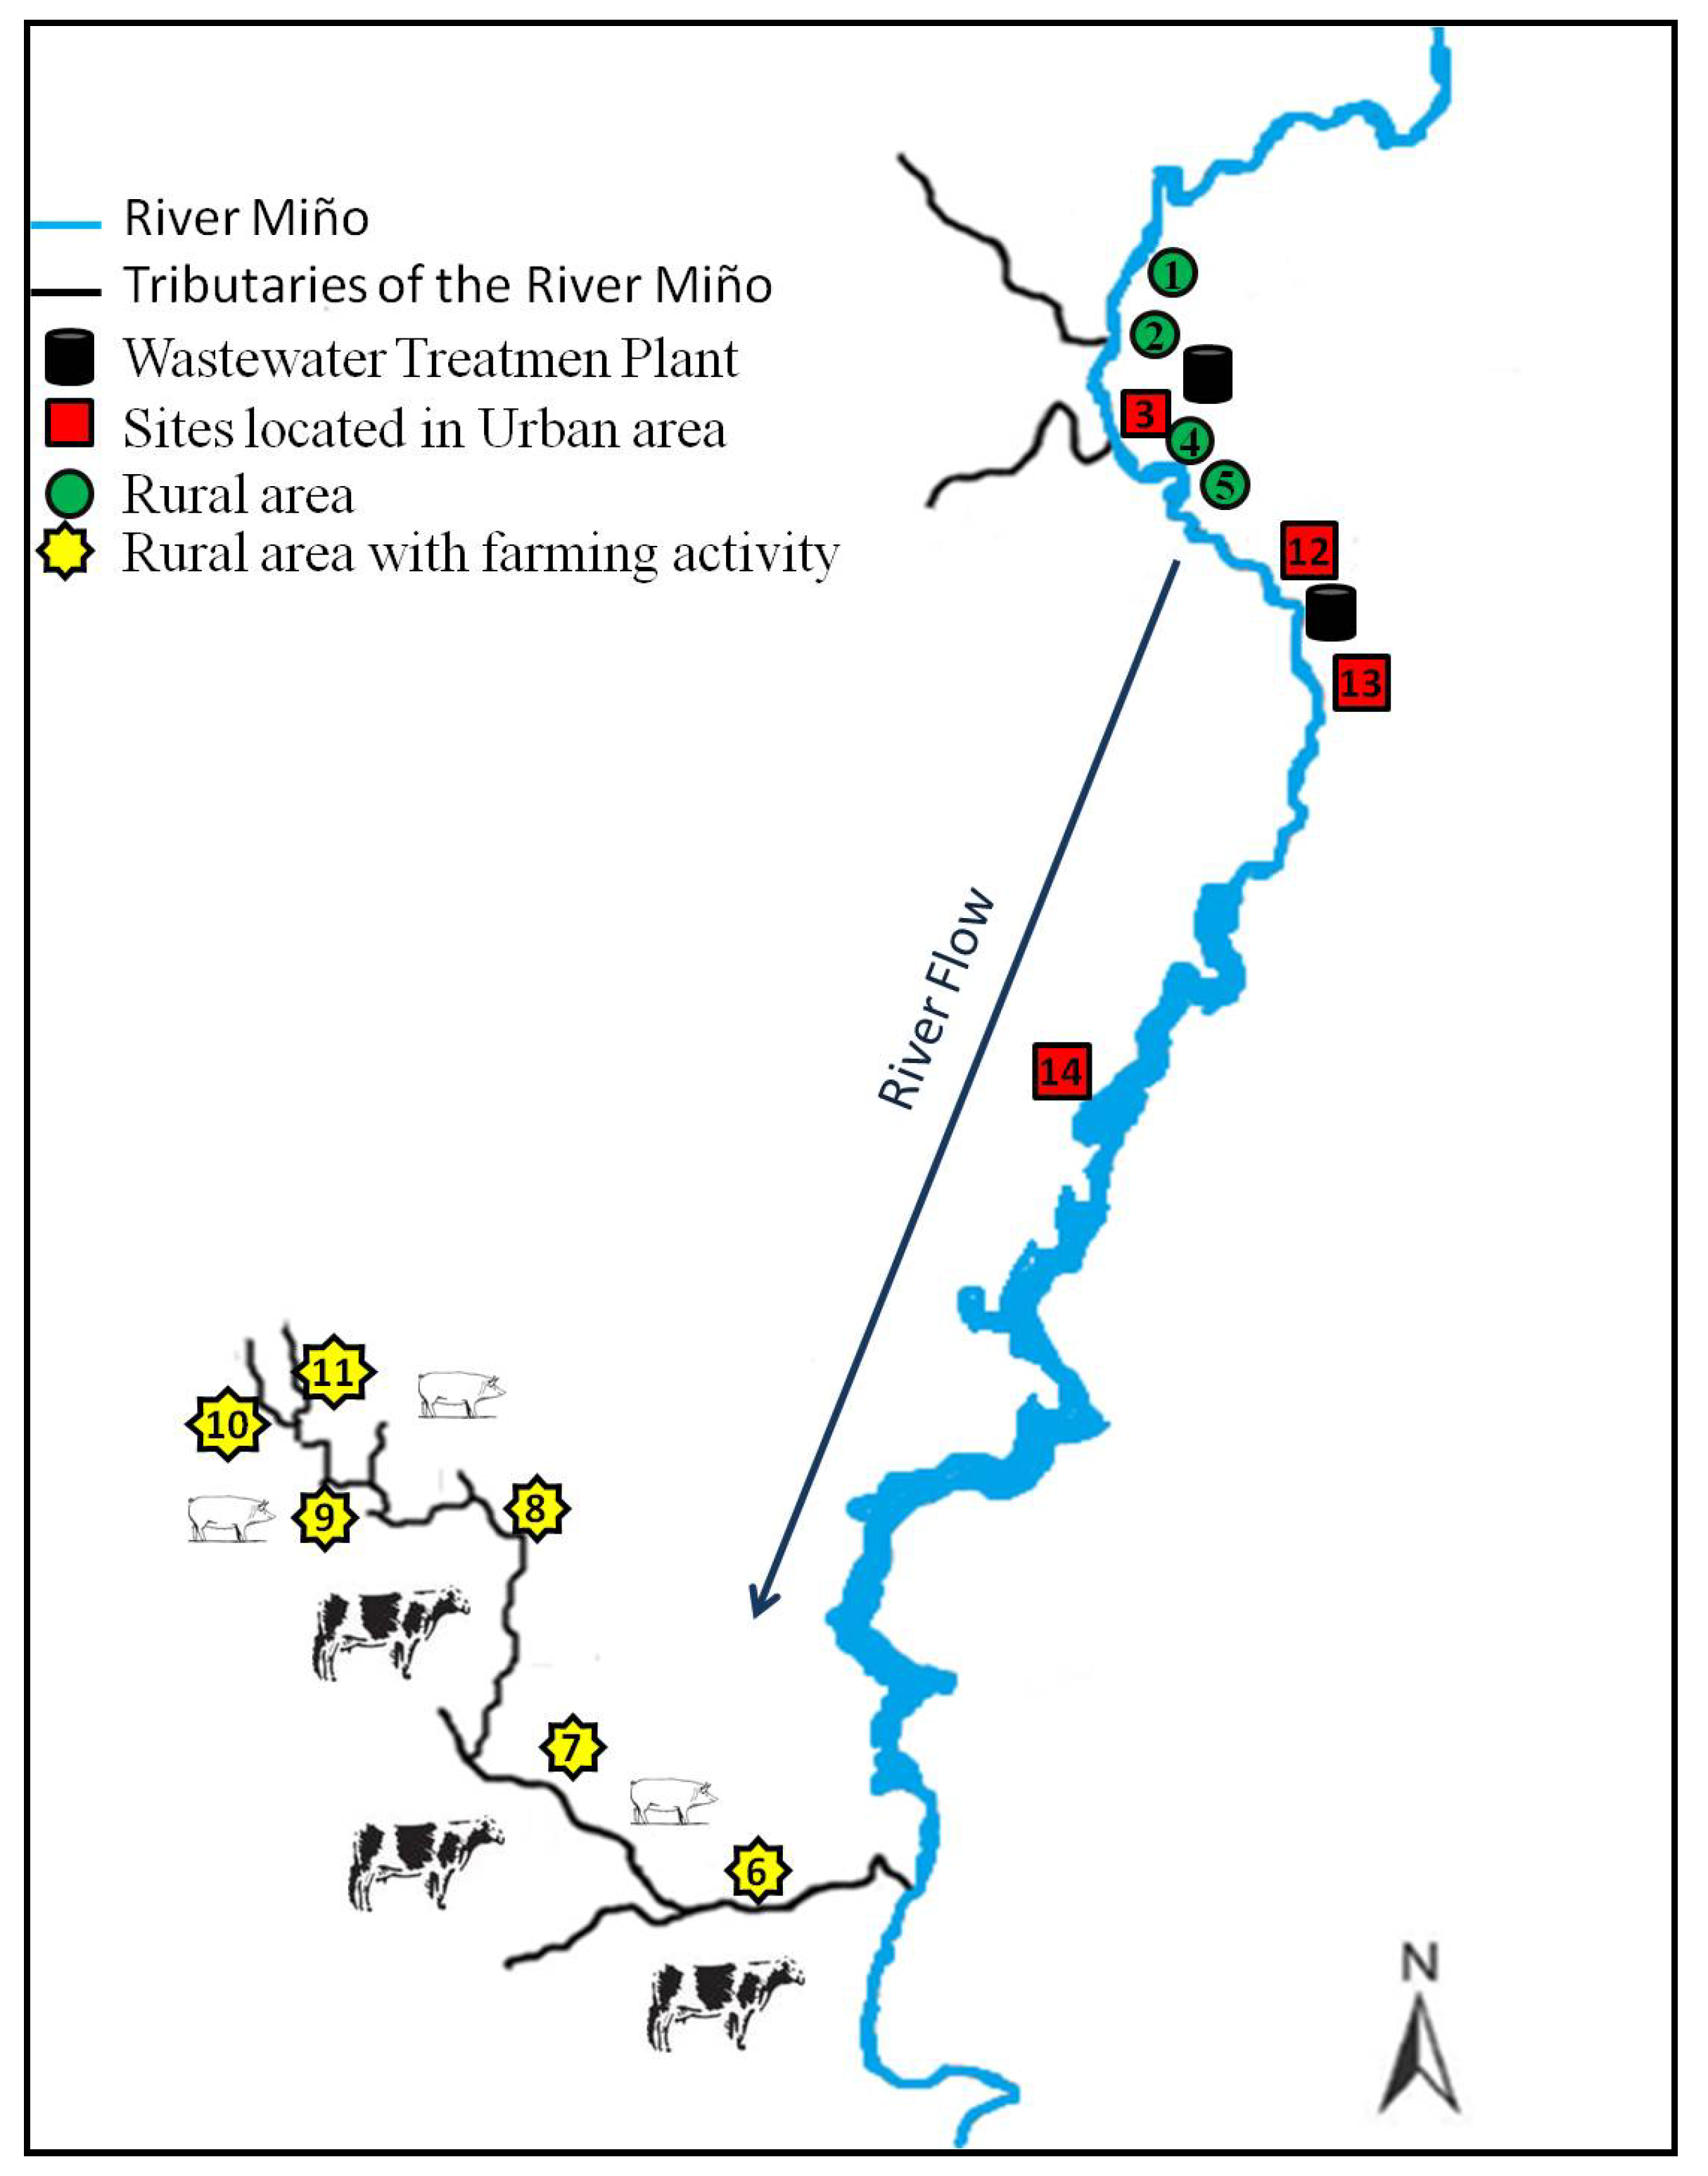
Of 549 water samples collected during the two sampling periods, 100 samples (18%) were positive for the presence of one or more of the selected drugs. The 13 analytes investigated were detected in at least one sample. The mean percentage of positive samples according to the type of area was 17% in urban areas, 4% in rural areas with farming activity and 2% in rural areas without farming activity. Overall, the percentage of positive samples obtained for each sampling period was similar: 19% and 17% for the first and the second, even if the number of samples collected was different, 235 (first sampling period) and 314 (second sampling period). When results for each sampling area were compared by sampling period, results were similar, particularly for those samples collected from urban areas. Sampling points located in these areas gave a higher percentage of positive samples: 16% during the first sampling period and 18% during the second sampling period. However, we noticed that even if the total percentage of positive samples detected in rural areas did not exceed 6%, during the first sampling period the percent of positive samples was double the percentage of positive samples in the second sampling period. Of all the sampling points located in urban areas, those situated after the discharge point of a WWTP (sites 3 and 13) gave the higher number of positive samples, with a range of detections between 24% and 33% of the positive samples and with a percent of detection at each site of 60% and 80% for sites 3 and 13. These results for the area selected from the Galician environment correlated with the results reported by many other authors who detected the presence of pharmaceuticals in surface water samples collected after the discharge of a WWTP [
14,
43,
53]. Sites classified as rural areas with low farming activity were the sites with the lowest number of detections but with the highest variation between the different sampling periods. These results support the idea that contamination of the samples analysed comes from human activity.
It should be highlighted that the number of analytes detected was different in each sampling period. In the second sampling period, all the analytes selected for the study were detected in at least one sample. In the first sampling period, only four drugs were measured (diclofenac, marbofloxacin, sulfamethoxazole and trimethoprim). These results could certainly be due to a longer sampling time, as the second period was conducted over seven months while the first was conducted over only three months. Consequently, during the second sampling period, 60 more samples were collected. The fact that the second sampling period took longer may have highlighted the influence of livestock in terms of health, feeding or environmental conditions. Weather conditions were also different during the two sampling periods. Mean solar radiation was 70% higher during the second sampling period, and mean precipitation was 73% higher during the first sampling period.
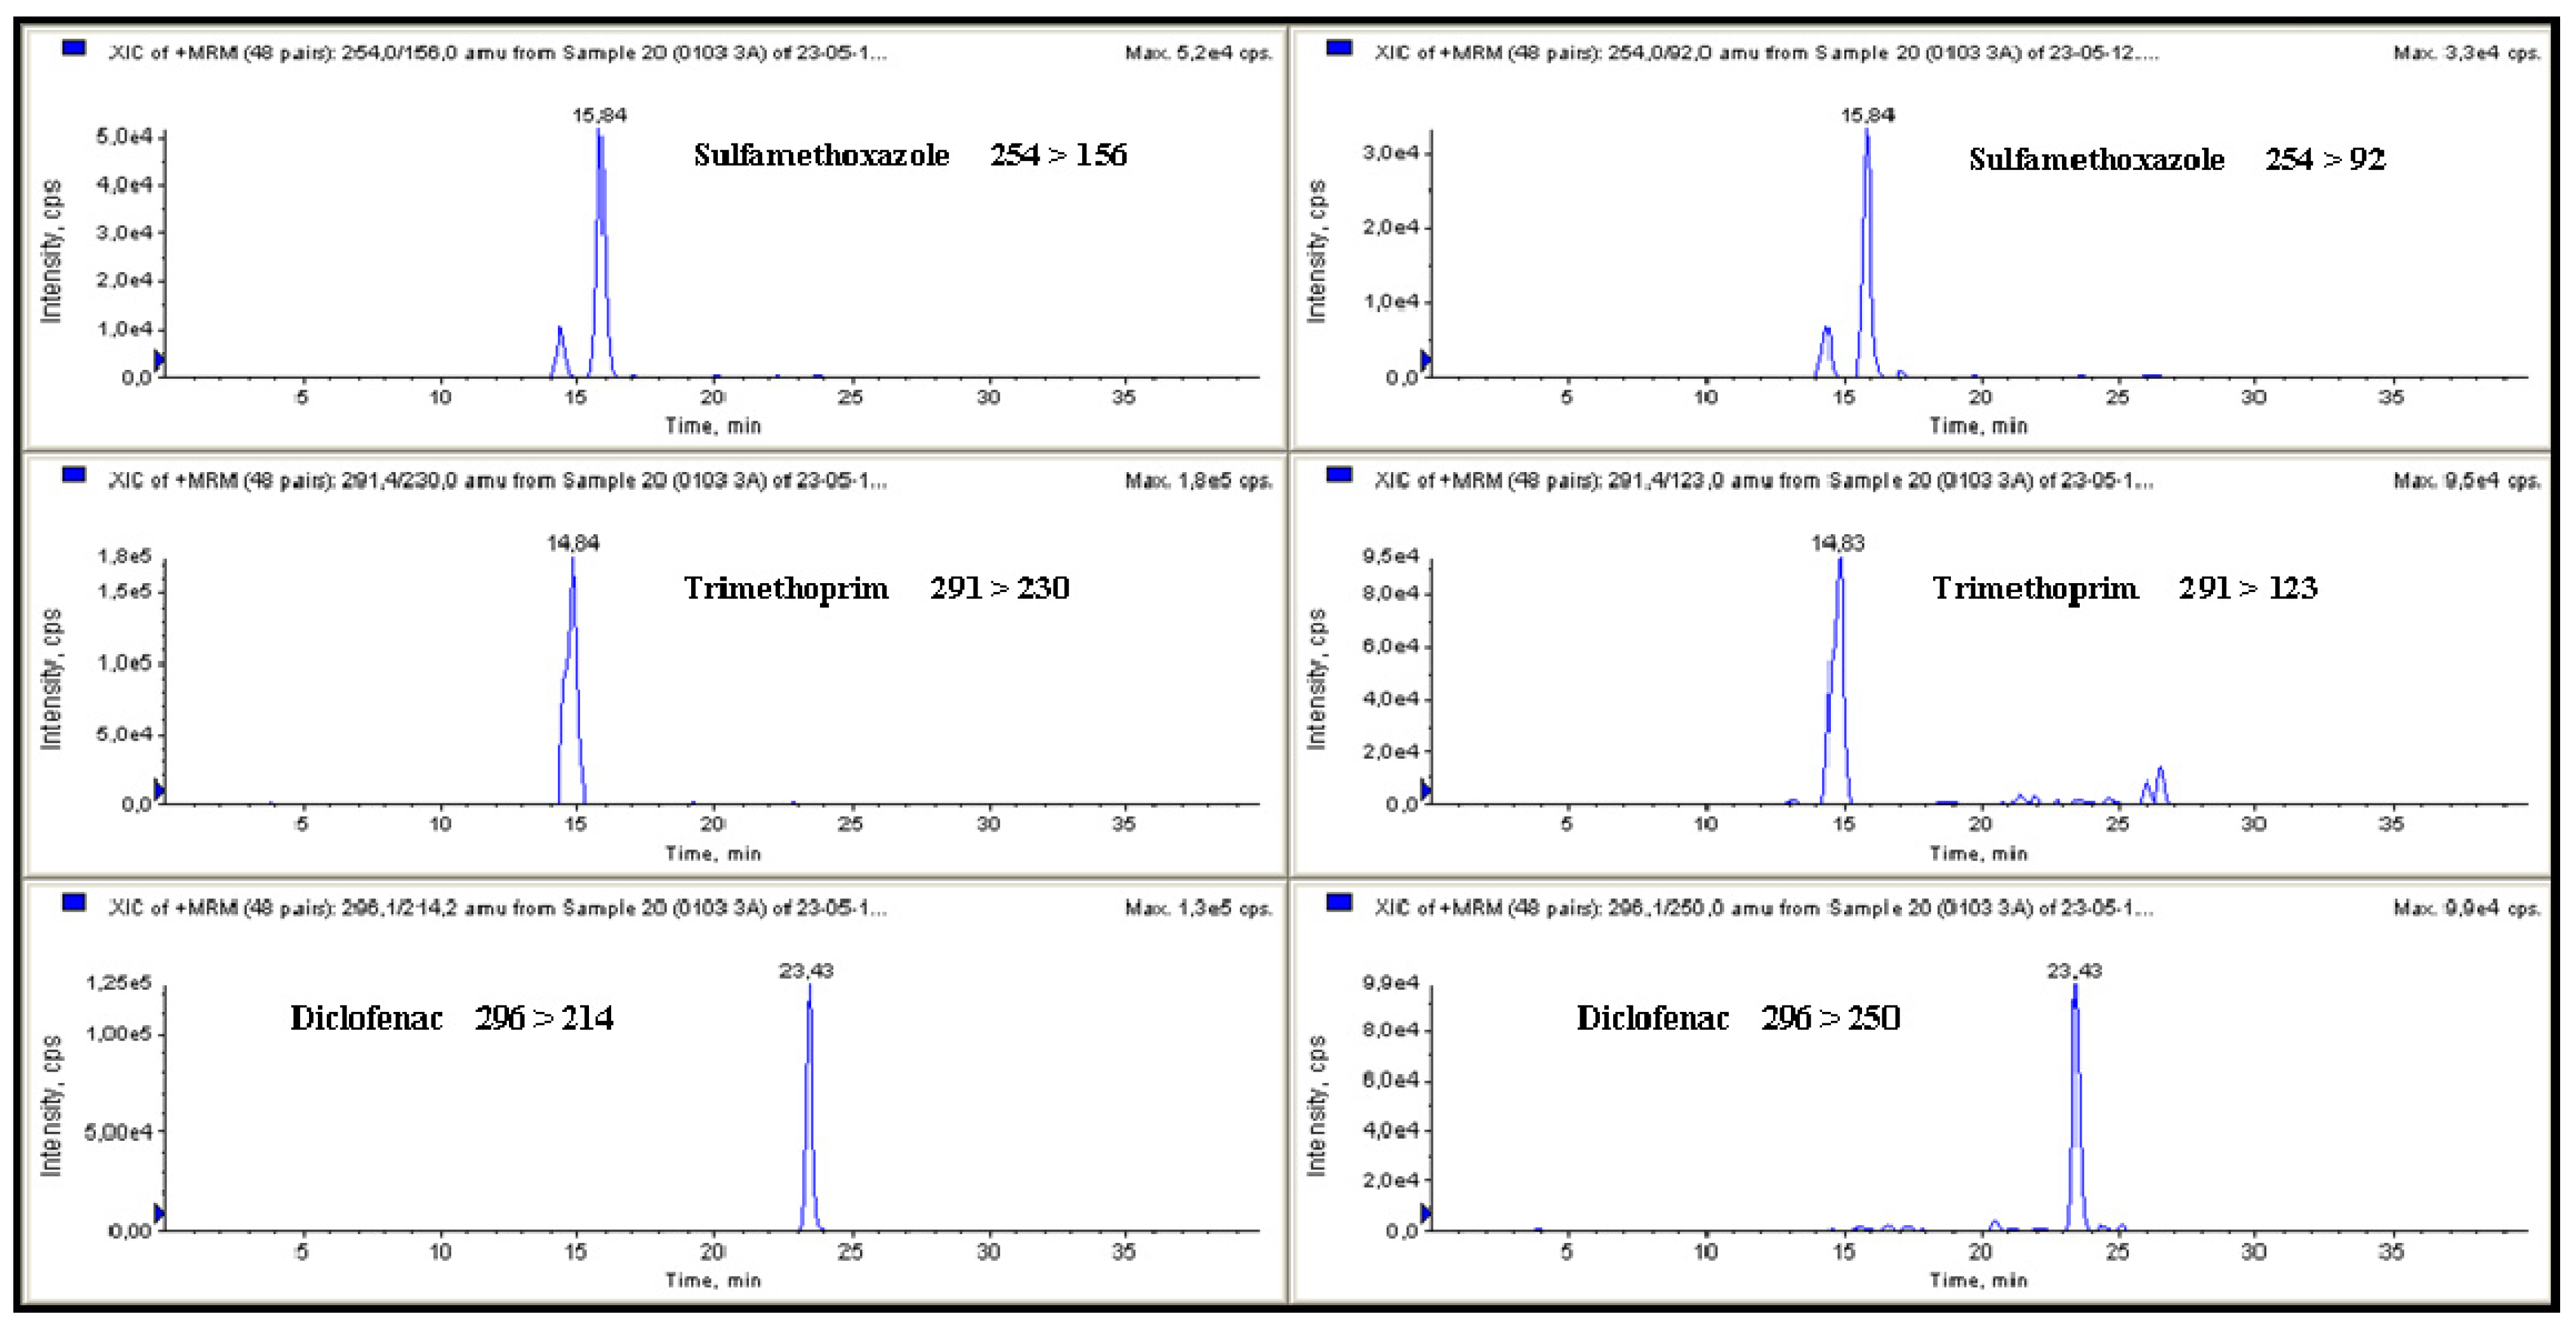
Analytes detected and their concentrations are summarised in
Table 6 and chromatograms of a surface water sample are represented in
Figure 2. If the results are assessed by the type of drugs and their frequency of detection, diclofenac was the drug with more detections in both sampling periods, with 29 (in the first) and 40 (in the second), followed by sulfamethoxazole with nine (in the first) and 33 (in the second) and by trimethoprim with seven (in the first) and 39 (in the second) also the number of detections of sulfamethoxazole and trimethoprim was in the same range for each sampling period, possibly because these drugs are usually administered together in both veterinary and human medicine as they have a synergistic effect. Their high frequency of detection could be due to their frequent use because of their low cost and their broad spectrum of activity to treat bacterial infections [
54,
55]. Sulfonamides such as sulfamethoxazole and trimethoprim have been detected in surface waters worldwide [
56,
57,
58,
59]. These results correlated with data reported by Huang
et al. who suggested that sulfonamides are the most common water pollutants among various antibiotics based on information concerning their environmental fate and predicted concentrations [
60]. Huang
et al. predicted that, for example, sulfamethoxazole was most likely to be present in municipal effluent and sulfamethazine in agricultural runoff [
60]. Diclofenac is a non-steroidal anti-inflammatory drug (NSAID), commonly used to treat inflammatory rheumatic diseases in humans, so its detection at sites located after the discharge of a WWTP is quite expected and, in fact, this drug was detected in 76% of the samples (
n = 21). When the data were treated statistically, significant differences (
p < 0.05) were found only for sulfamethoxazole and diclofenac according to sampling period. These two analytes were more frequently detected during the second sampling period when their detection was double. When a similar analysis was conducted by sampling month, no significant differences were observed for diclofenac or sulfamethoxazole, but significant differences were observed for trimethoprim. Concentration and frequency of detection of these analytes also showed significant differences (
p < 0.05) when they were analysed according to sampling points. Site 13 was the site with the highest number of detections: 29 for diclofenac, 24 for trimethoprim, 19 for sulfamethoxazole and 10 for propanolol.
The concentrations of the drugs measured in this research were between 2.8 to 171.4 ng·L
−1 (
Table 6). Based on the therapeutic class of the drugs, antimicrobial is the group most frequently detected, with 104 detections and a mean concentration of 53.4 ng·L
−1. The second group most frequently detected was the anti-inflammatory agent diclofenac, with 69 detections and a mean concentration of 13.6 ng·L
−1, followed by the anti-hypertensive propanolol. The highest concentration of drugs measured during this study corresponded to sarafloxacin but this compound was detected only once, in the sampling site located downstream from the discharge of one WWTP. The detection of sarafloxacin could be due to the entrance of some animal residue into the WWTP because this fluoroquinolone is specially employed in poultry to prevent and treat infections. The drug measured at the second highest concentration (164.5 ng·L
−1) was also a fluoroquinolone, enrofloxacin. This sample was collected at one of the sites located in a rural area with farming activity (point 7). This site is surrounded by greenery where cow droppings were found on the bank of the river, most likely due to the easy access for grazing livestock to drink water. Like sarafloxacin, the frequency of detection of enrofloxacin was low: enrofloxacin was measured in only three samples collected from three different sites (1, 7 and 13), each site classified differently. Trimethoprim was the analyte measured at the third highest concentration (110.4 ng·L
−1). As mentioned earlier, this drug was frequently detected with a mean concentration of 13.8 ng·L
−1 in both sampling periods. The highest observed concentration of diclofenac, the compound most frequently detected, was 45.9 ng·L
−1, and its mean concentration was 16.6 ng·L
−1 in both sampling periods. Jiang
et al. published values of concentrations in the same range for sulfamethoxazole (4.86–53.24 ng·L
−1) and trimethoprim (2.23–62.39 ng·L
−1) in China [
61]. Diclofenac was detected in the range of 2.8–46 ng·L
−1 in 69% of the positive samples during this research. A similar frequency of detection was reported by Kasprzyk-Hordern
et al. who detected diclofenac in rivers of the UK in the range of 1–261 ng·L
−1 at a mean percentage frequency of 74% [
51]. The greater concentration of trimethoprim (110.4 ng·L
−1) was detected in a sample collected from a rural site surrounded by bovine livestock farms, specifically dairy cattle. Dinh
et al. also reported concentrations for sulfamethoxazole (3.6–1,435 ng·L
−1) and trimethoprim (8–254 ng·L
−1) downstream of WWTPs [
14]. However, if data obtained during this research are compared with concentrations of residues found in surface waters in Spain (up to 20 ng·L
−1), the United Kingdom (up to 42 ng·L
−1), South Korea (3.2–5.3 ng·L
−1) and in Serbia (25 ng·L
−1) [
47,
62,
63,
64], the concentration of the analytes measured in the Galician environment were higher.
Table 6.
Maximum, minimum and mean concentrations of the selected drugs detected in Spanish surface water and number of time detected in the samples.
Table 6.
Maximum, minimum and mean concentrations of the selected drugs detected in Spanish surface water and number of time detected in the samples.
| Analyte | Maximum concentration (ng·L−1) | Minimum concentration (ng·L−1) | Mean concentration (ng·L−1) | Number of detections |
|---|
| Brilliant Green | 7.9 | 3.3 | 5.6 | 2 |
| Diclofenac | 46.0 | 2.8 | 13.6 | 69 |
| Difloxacin | 8.5 | 8.5 | 8.5 | 1 |
| Enrofloxacin | 164.5 | 60.0 | 119.9 | 3 |
| Malachite Green | 9.0 | 9.0 | 9.0 | 1 |
| Marbofloxacin | 20.1 | 3.6 | 8.8 | 10 |
| Oxolinic Acid | 39.1 | 39.1 | 39.1 | 1 |
| Propanolol | 62.6 | 4.2 | 11.5 | 14 |
| Sarafloxacin | 171.4 | 171.4 | 171.4 | 1 |
| Sulfamethoxazole | 40.1 | 3.0 | 10.7 | 42 |
| Tamoxifen | 11.7 | 3.5 | 7.5 | 6 |
| Triamcinolone | 8.4 | 8.4 | 8.4 | 1 |
| Trimethoprim | 110.4 | 3.5 | 16.1 | 46 |
Another active compound frequently detected during this research was propanolol, which is a beta blocker drug involved mainly in relaxing blood vessels and decreasing heart rate to improve blood flow and lower blood pressure. Propanolol was detected in 14 samples in the range of 4.2–62.6 ng·L
−1, similar to the values reported by Kasprzyk-Hordern
et al. (3–91 ng·L
−1) in the rivers of the UK [
51] and higher than the values measured by Alder
et al. in Switzerland (7–8 ng·L
−1) [
13]. The highest concentration of propanolol found during this work (37.4 ng·L
−1) was measured in a sample collected at a site described as a rural area. Most of the detections of this compound occurred at the sites located after the discharge of the WWTPs, most likely due to low removal during treatment at the WWTP as reported by Gros
et al. who observed a rate of removal for this compound below 20% [
65]. These results are in accordance with data published by Martín
et al., who detected propanolol in 100% of the samples collected downstream of discharge from four WWTPs [
32]. The range of concentrations reported for this compound was between 30 to 720 ng·L
−1, ten times higher than the concentrations measured in the River Miño. However, the area investigated was more or less than ten times less populated than the Guadalquivir area studied by Martín
et al. [
32]. As these drugs are not allowed in food-producing animals, the presence of propanolol in a sample collected from a rural area could be due to its application to animals not dedicated to food production, or the presence of this compound could also be due to a leak from the septic tanks.
Figure 2.
MRM chromatograms for sulfamethoxazole (37.7 ng·L−1), trimethoprim (64.3 ng·L−1) and diclofenac (31.4 ng·L−1) detected in galician surface water.
Figure 2.
MRM chromatograms for sulfamethoxazole (37.7 ng·L−1), trimethoprim (64.3 ng·L−1) and diclofenac (31.4 ng·L−1) detected in galician surface water.
The antimicrobial marbofloxacin was detected with a range in concentration from 3.6 to 20.1 ng·L
−1, where the highest value was found at a rural site (point 1) located in the Miño River flow. The second greatest concentration was detected at a site also located in the Miño River but on its way through the city of Lugo (point 12). The rest of the analytes selected in this study were detected at a percentage less than 10%. Like sarafloxacin, oxolinic acid was detected only once (39.1 ng·L
−1) in a sample collected at a site located near the discharge of a WWTP (point 13). Oxolinic acid had also been found in the Seine River at a similar concentration (23 ng·L
−1) by Dinh
et al. [
14].
The presence of the triphenylmethane dyes, brilliant green and malachite green, in the Galician water is a matter for further study, even if brilliant green was detected only twice and malachite green once in concentrations that do not exceed 9.0 ng·L
−1. As previously mentioned, these compounds are multi-organ toxics to mammals that show serious negative effects [
5]. The detections of these two compounds were at the same sampling site, with two of them observed on the same day. The compounds were found at a site located near the discharge of the WWTP located at site number 13, flowing downstream of the city of Lugo. The hypothesis is that these residues could originate from a paper industry located on the upper side of the city and perhaps be swept away by the Miño River to be found in such low concentrations on the lower side or maybe due to the fish farms that are located near the city of Lugo, but this is only a hypothesis because the use of these drugs is forbidden for processing of all categories of edible fish, including fish eggs.
For each collected sample, physicochemical parameters such as nitrites, ammonium, conductivity, turbidity and pH were measured. Statistical analysis (ANOVA and a linearity test) was conducted for the concentration of the analytes and these parameters. However, no significant differences (
p < 0.05) were found for ammonium, nitrites, conductivity, turbidity and pH. When statistical analysis was conducted with weather conditions (mean temperature (°C), mean precipitation (mm), mean humidity (%) and mean solar radiation (10 kJ/m
2)), significant differences (
p < 0.05) were observed for diclofenac and mean temperature. Samples that contained a measurable concentration of diclofenac were collected on days when the temperature was equal to or above 15 °C. Diclofenac was more frequently detected in samples collected in urban areas, especially after the discharge of a WWTP, but in the samples collected from rural areas, diclofenac was detected on days when the mean temperature was above 17 °C, most likely because treated animals were put out to pasture. Significant differences (
p < 0.05) were also observed for propanolol concentration and precipitation. This analyte was generally detected on days when rainfall was not registered. The lack of detection on rainy days could have being due to a dilution effect, as most samples contained a concentration of propanolol below 10 ng·L
−1. No significant differences (
p < 0.05) were found for any of the drugs and mean humidity, but significant differences were observed for diclofenac concentration and mean solar radiation. Similarly to mean temperature, those positive samples for diclofenac that were collected in rural areas were collected on days with low mean solar radiation. As demonstrated by Bartels
et al. [
66], diclofenac is sensitive to solar radiation, and its concentration decreased with solar radiation. Based on these findings, diclofenac could have been liberated into the Galician environment, and its frequency of detection in this study could have been higher but solar radiation helped to decrease its concentration to undetectable levels with the method employed.
This study has demonstrated that even if Galicia is an area of Spain with high rainfall and low population density compared with other areas of Spain, the presence of active compounds such as pharmaceuticals in the aquatic environment is common, and these results were similar to results published for other areas of Spain such as Catalonia, the Spanish Mediterranean area, Valencia, Madrid and Sevilla [
27,
29,
30,
32,
33,
67]. Although drug concentrations were below 200 ng·L
−1 (
Table 6), toxic effects of these compounds in non-target organisms have previously been reported. Potential toxicity affected plants and soil organisms due to sulfamethoxazole [
8,
68] and freshwater crustaceans and fish as a result of their exposure to propanolol and diclofenac [
9,
69]. Based on these findings reported by other authors and results obtained for samples collected at sites located next to the collection point of a drinking water treatment plant, more than 5% of the samples collected at this site were positive for the analysed active compounds, causing significant concern.


 ,
, 


