<?xml version="1.0" encoding="UTF-8"?>
<!DOCTYPE article PUBLIC "-//NLM//DTD Journal Publishing DTD v2.3 20070202//EN" "journalpublishing.dtd">
<article xmlns:mml="http://www.w3.org/1998/Math/MathML" xmlns:xlink="http://www.w3.org/1999/xlink" xml:lang="en" article-type="research-article">
  <front>
    <journal-meta>
      <journal-id journal-id-type="publisher-id">ijerph</journal-id>
      <journal-title>International Journal of Environmental Research and Public Health</journal-title>
      <abbrev-journal-title abbrev-type="publisher">Int. J. Environ. Res. Public Health</abbrev-journal-title>
      <abbrev-journal-title abbrev-type="pubmed">International journal of environmental research and public health</abbrev-journal-title>
      <issn pub-type="epub">1660-4601</issn>
      <publisher>
        <publisher-name>MDPI</publisher-name>
      </publisher>
    </journal-meta>
    <article-meta>
      <article-id pub-id-type="doi">10.3390/ijerph10020478</article-id>
      <article-id pub-id-type="publisher-id">ijerph-10-00478</article-id>
      <article-categories>
        <subj-group>
          <subject>Article</subject>
        </subj-group>
      </article-categories>
      <title-group>
        <article-title>Identifying the Relationships between Water Quality and Land Cover Changes in the Tseng-Wen Reservoir Watershed of Taiwan</article-title>
      </title-group>
      
      <contrib-group>
        <contrib contrib-type="author">
          <name>
            <surname>Chu</surname>
            <given-names>Hone-Jay</given-names>
          </name>
          <xref rid="c1-ijerph-10-00478" ref-type="corresp">*</xref>
        </contrib>
        <contrib contrib-type="author">
          <name>
            <surname>Liu</surname>
            <given-names>Chun-Yu</given-names>
          </name>
        </contrib>
        <contrib contrib-type="author">
          <name>
            <surname>Wang</surname>
            <given-names>Chi-Kuei</given-names>
          </name>
        </contrib>
      </contrib-group>
      <aff id="af1-ijerph-10-00478">Department of Geomatics, National Cheng Kung University, No. 1, University Road, Tainan City 701, Taiwan; E-Mails: <email>cute_chunyu_0527@hotmail.com</email> (C.-Y.L.); <email>chikuei@mail.ncku.edu.tw</email> (C.-K.W.)</aff>
      <author-notes>
        <corresp id="c1-ijerph-10-00478"><label>*</label> Author to whom correspondence should be addressed; E-Mail: <email>honejaychu@gmail.com</email>; Tel.: +886-6-275-7575 (ext. 63827); Fax: +886-6-237-5764.</corresp>
      </author-notes>
      <pub-date pub-type="epub">
        <day>28</day>
        <month>01</month>
        <year>2013</year>
      </pub-date>
      <pub-date pub-type="ppub"><month>02</month>
        <year>2013</year>
      </pub-date>
      <volume>10</volume>
      <issue>2</issue>
      <fpage>478</fpage>
      <lpage>489</lpage>
      <history>
        <date date-type="received">
          <day>22</day>
          <month>09</month>
          <year>2012</year>
        </date>
        <date date-type="rev-recd">
          <day>31</day>
          <month>12</month>
          <year>2012</year>
        </date>
        <date date-type="accepted">
          <day>21</day>
          <month>01</month>
          <year>2013</year>
        </date>
      </history>
      <permissions>
        <copyright-statement>©  2013 by the authors; licensee MDPI, Basel, Switzerland.</copyright-statement>
        <copyright-year>2013</copyright-year>
        <license xmlns:xlink="http://www.w3.org/1999/xlink" license-type="open access" xlink:href="http://creativecommons.org/licenses/by/3.0/">
          <p>This article is an open access article distributed under the terms and conditions of the Creative Commons Attribution license (http://creativecommons.org/licenses/by/3.0/).</p>
        </license>
      </permissions>
      <abstract>
        <p>The effects on water quality of land use and land cover changes, which are associated with human activities and natural factors, are poorly identified. Fine resolution satellite imagery provides opportunities for land cover monitoring and assessment. The multiple satellite images after typhoon events collected from 2001 to 2010 covering land areas and land cover conditions are evaluated by the Normalized Difference Vegetation Index (NDVI). The relationship between land cover and observed water quality, such as suspended solids (SS) and nitrate-nitrogens (NO<sub>3</sub>-N), are explored in the study area. Results show that the long-term variations in water quality are explained by NDVI data in the reservoir buffer zones. Suspended solid and nitrate concentrations are related to average NDVI values on multiple spatial scales. Annual NO<sub>3</sub>-N concentrations are positively correlated with an average NDVI with a 1 km reservoir buffer area, and the SS after typhoon events associated with landslides are negatively correlated with the average NDVI in the entire watershed. This study provides an approach for assessing the influences of land cover on variations in water quality.</p>
      </abstract>
      <kwd-group>
        <kwd>remote sensing</kwd>
        <kwd>NDVI</kwd>
        <kwd>water quality</kwd>
        <kwd>land cover change</kwd>
        <kwd>regression</kwd>
      </kwd-group>
    </article-meta>
  </front>
  <body>
    <sec sec-type="intro">
      <title>1. Introduction</title>
      <p>Land use and land cover changes, associated with human activities and natural factors, compromise many ecosystem services in a watershed [<xref ref-type="bibr" rid="B1-ijerph-10-00478">1</xref>,<xref ref-type="bibr" rid="B2-ijerph-10-00478">2</xref>]. For example, forestland converted to agricultural or urban land may have increased erosion, runoff, and flooding [<xref ref-type="bibr" rid="B3-ijerph-10-00478">3</xref>]. Changes in land use and land cover interact with anthropogenic and natural drivers to affect the water quality of watersheds. Studies have used environmental and landscape data to examine the relationships between land use and land cover changes and suspended sediments [<xref ref-type="bibr" rid="B4-ijerph-10-00478">4</xref>,<xref ref-type="bibr" rid="B5-ijerph-10-00478">5</xref>,<xref ref-type="bibr" rid="B6-ijerph-10-00478">6</xref>,<xref ref-type="bibr" rid="B7-ijerph-10-00478">7</xref>] and nutrients [<xref ref-type="bibr" rid="B1-ijerph-10-00478">1</xref>,<xref ref-type="bibr" rid="B7-ijerph-10-00478">7</xref>,<xref ref-type="bibr" rid="B8-ijerph-10-00478">8</xref>,<xref ref-type="bibr" rid="B9-ijerph-10-00478">9</xref>,<xref ref-type="bibr" rid="B10-ijerph-10-00478">10</xref>]. Ahearn <italic>et al</italic>. showed that land use and land cover exert the greatest control over water quality in the Cosumnes Watershed, California [<xref ref-type="bibr" rid="B7-ijerph-10-00478">7</xref>]. The percentage of agricultural coverage had a significant influence on nutrient loading. Sliva and Williams used multivariate analysis to determine whether there was a correlation between water quality and landscape characteristics within the local Southern Ontario watersheds in Canada. They compared the influences of buffer zones and whole catchment landscape characteristics on water quality [<xref ref-type="bibr" rid="B9-ijerph-10-00478">9</xref>]. Li <italic>et al</italic>. showed the impact of land use and land cover on the water quality in the Upper Han River basin, China [<xref ref-type="bibr" rid="B10-ijerph-10-00478">10</xref>]. The correlation and regression analysis indicated that water quality was significantly related to vegetated coverage. </p>
      <p>Water quality is controlled by numerous anthropogenic and natural factors [<xref ref-type="bibr" rid="B7-ijerph-10-00478">7</xref>]. The quality of receiving waters is affected by human activities in a watershed by point sources, such as wastewater treatment facilities, and non-point sources, such as runoff from urban areas and farmland [<xref ref-type="bibr" rid="B11-ijerph-10-00478">11</xref>]. Understanding non-point source pollution requires an understanding of how particular land covers influence water quality within a watershed. The extent that land covers hierarchically affect water quality at space-time scales is a key question. The most widely used land cover index in this context is the normalized difference vegetation index (NDVI), which is a function of red and near-infrared spectral bands [<xref ref-type="bibr" rid="B12-ijerph-10-00478">12</xref>]. On a regional scale, multi-temporal NDVI images are practical for monitoring vegetation dynamics. The multi-temporal NDVI is useful for classifying land cover and detecting the dynamics of vegetation [<xref ref-type="bibr" rid="B13-ijerph-10-00478">13</xref>,<xref ref-type="bibr" rid="B14-ijerph-10-00478">14</xref>]. However, major changes in the NDVI are noted near landslides that were induced by disturbances in Taiwan [<xref ref-type="bibr" rid="B15-ijerph-10-00478">15</xref>,<xref ref-type="bibr" rid="B16-ijerph-10-00478">16</xref>]. For example, a typhoon is one of major natural disturbances to land cover. Sequent typhoons and rainstorms cause abnormal destruction to the vegetation; this destruction is influenced by rainfall distributions and typhoon paths [<xref ref-type="bibr" rid="B15-ijerph-10-00478">15</xref>]. </p>
      <p>The NDVI data were derived from SPOT satellite images in the Tseng-Wen Reservoir Watershed, Taiwan, before and after Typhoon Morakot and several other large typhoons (e.g., Typhoon Mindulle in 2004, Haitang in 2005, Sepat in 2007, Kalmaegi in 2008, and Fanapi in 2010) [<xref ref-type="bibr" rid="B17-ijerph-10-00478">17</xref>] to identify the changes to land cover. To represent land use and land cover change, an evaluation of multiple NDVI spatial scales was conducted. The study identified and delineated the relationships between temporal variations of the NDVI and water quality in the study area.</p>
    </sec>
    <sec>
      <title>2. Materials and Methods
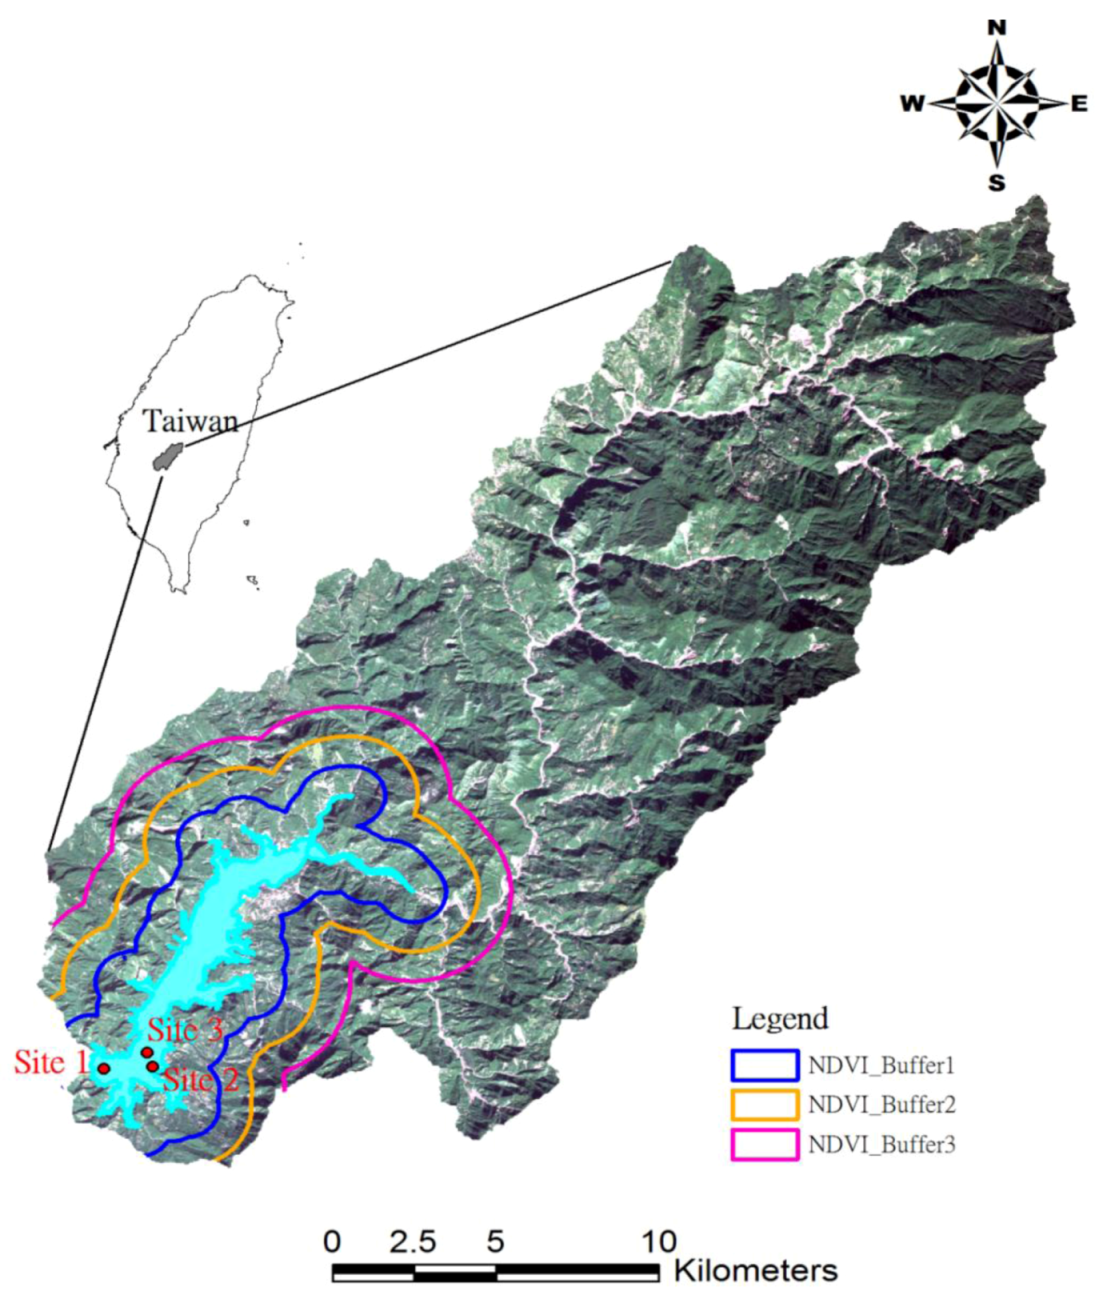
</title>
      <sec>
        <title>2.1. Study Area</title>
        <p>The Tseng-Wen Reservoir is a multipurpose reservoir designed for flood control, hydroelectric power generation, irrigation, water supply, recreation, and flow augmentation. The storage capacity of the Tseng-Wen reservoir is 608 × 10<sup>6</sup> m<sup>3</sup>, but its effective water storage is 490 × 10<sup>6</sup> m<sup>3</sup>, and the hydroelectric plant capacity is 50 MW. The Tseng-Wen Reservoir Basin is located in the upstream area of the Tseng-Wen River system in Chiayi County (<xref ref-type="fig" rid="ijerph-10-00478-f001">Figure 1</xref>). The entire watershed area of this river basin is 1,176 km<sup>2</sup>, in which the Tseng-Wen Reservoir watershed covers 481 km<sup>2</sup>. The average slope of this river basin is approximately 1/57. Average rainfall in this watershed area is approximately 3,000 mm per year and annual average temperature is about 23.4° Celsius. Rich soil in the watershed is suitable for fruit and tea farms. Agriculture has restricted near the reservoir but tourism has developed in recent years. </p>
        
        <p>Numerous major typhoons have struck Taiwan, such as Typhoon Mindulle in 2004, Haitang in 2005, Sepat in 2007, Kalmaegi in 2008, Morakot in 2009, and Fanapi in 2010 [<xref ref-type="bibr" rid="B17-ijerph-10-00478">17</xref>]. Especially, Typhoon Morakot struck Taiwan from 7 to 9 August, 2009, and produced record-breaking rainfall and catastrophic damage in Southern Taiwan. The typhoon produced copious amounts of rainfall peaking at 2,777 mm<italic>.</italic></p>
        <fig id="ijerph-10-00478-f001" position="float">
          <label>Figure 1</label>
          <caption>
            <p>Location of Tseng-Wen Reservoir watershed and water quality sampling stations.</p>
          </caption>
          <graphic xmlns:xlink="http://www.w3.org/1999/xlink" xlink:href="ijerph-10-00478-g001.tif"/>
        </fig>
      </sec>
      <sec>
        <title>2.2. Satellite Images
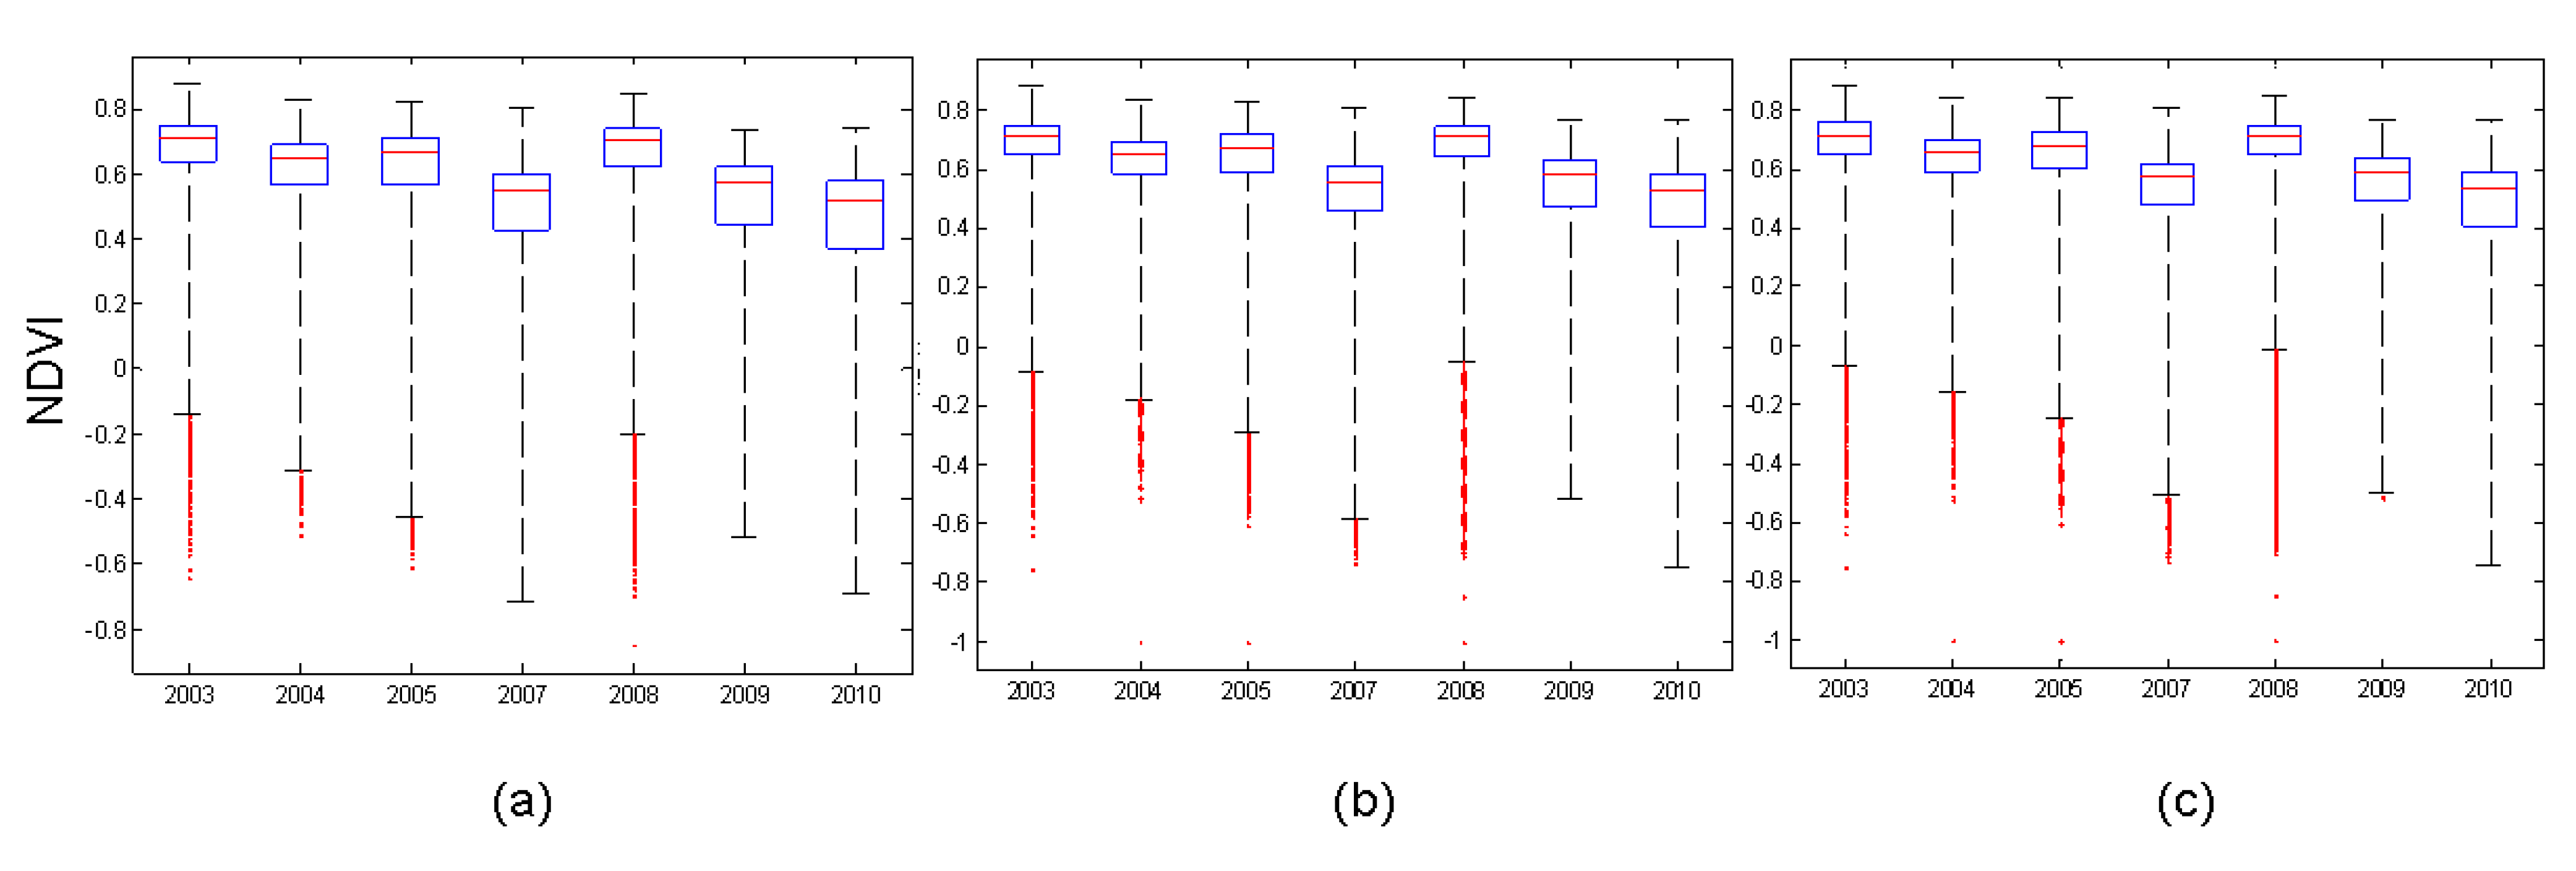
</title>
        <p>Multi-temporal Système Pour l'Observation de la Terre (SPOT) satellite images obtained after typhoons in 2001, 2003–2005, and 2007–2010 were used to quantify land cover changes in our study. Details for the dates are listed in <xref ref-type="table" rid="ijerph-10-00478-t001">Table 1</xref>. For atmospheric correction, Fast Line of Sight Atmospheric Analysis of Spectral Hypercube (FLAASH) is applied to correct the visible and near-infrared wavelengths in the satellite images [<xref ref-type="bibr" rid="B18-ijerph-10-00478">18</xref>]. Then, the NDVI maps were derived from the SPOT images taken in 2001 with a 20 m resolution, and with a 10 m resolution in 2003–2010. Moreover, the SPOT images were classified using supervised classification by the software package ERDAS IMAGINE. Land-use types were classified into the following six categories: forested land, built-up land, landslide, grassland, water, and bare land [<xref ref-type="bibr" rid="B19-ijerph-10-00478">19</xref>]. The reference maps were the aerial photographs by the Aerial Survey Office, Forestry Bureau, Taiwan.</p>
        <table-wrap id="ijerph-10-00478-t001" position="float">
          <object-id pub-id-type="pii">ijerph-10-00478-t001_Table 1</object-id>
          <label>Table 1</label>
          <caption>
            <p>Mean andstandard deviation of NDVI maps during 2001–2010.</p>
          </caption>
          <table rules="rows" style="border: solid thin">
            <thead>
              <tr>
                <th align="center" valign="middle"> </th>
                <th align="center" valign="middle">Date</th>
                <th align="center" valign="middle">Mean</th>
                <th align="center" valign="middle">SD</th>
              </tr>
            </thead>
            <tbody>
              <tr>
                <td align="center" valign="middle">2001</td>
                <td align="center" valign="middle">2001/10/22</td>
                <td align="center" valign="middle">0.585</td>
                <td align="center" valign="middle">0.205</td>
              </tr>
              <tr>
                <td align="center" valign="middle">2003</td>
                <td align="center" valign="middle">2003/12/30</td>
                <td align="center" valign="middle">0.704</td>
                <td align="center" valign="middle">0.163</td>
              </tr>
              <tr>
                <td align="center" valign="middle">2004</td>
                <td align="center" valign="middle">2004/12/29</td>
                <td align="center" valign="middle">0.600</td>
                <td align="center" valign="middle">0.171</td>
              </tr>
              <tr>
                <td align="center" valign="middle">2005</td>
                <td align="center" valign="middle">2005/11/05</td>
                <td align="center" valign="middle">0.663</td>
                <td align="center" valign="middle">0.191</td>
              </tr>
              <tr>
                <td align="center" valign="middle">2007</td>
                <td align="center" valign="middle">2008/01/05</td>
                <td align="center" valign="middle">0.563</td>
                <td align="center" valign="middle">0.209</td>
              </tr>
              <tr>
                <td align="center" valign="middle">2008</td>
                <td align="center" valign="middle">2008/11/12</td>
                <td align="center" valign="middle">0.686</td>
                <td align="center" valign="middle">0.171</td>
              </tr>
              <tr>
                <td align="center" valign="middle">2009</td>
                <td align="center" valign="middle">2009/11/01</td>
                <td align="center" valign="middle">0.437</td>
                <td align="center" valign="middle">0.218</td>
              </tr>
              <tr>
                <td align="center" valign="middle">2010</td>
                <td align="center" valign="middle">2010/12/27</td>
                <td align="center" valign="middle">0.494</td>
                <td align="center" valign="middle">0.221</td>
              </tr>
            </tbody>
          </table>
          <table-wrap-foot>
          <fn>
          <p>SD: standard deviation.</p>
          </fn>
          </table-wrap-foot>
        </table-wrap>
        
      </sec>
      <sec>
        <title>2.3. Water Quality Data</title>
        <p>Seasonal time series of water-quality data monitored in the reservoir were obtained from Taiwanese EPA Web sites [<xref ref-type="bibr" rid="B20-ijerph-10-00478">20</xref>]. The water quality data observed at three stations were obtained from 2001 to 2010 and data sampling frequency was three months. The sampling sites are shown in <xref ref-type="fig" rid="ijerph-10-00478-f001">Figure 1</xref>. The water-quality variables, such as nitrate-nitrogen (NO<sub>3</sub>-N), suspended sediments (SS), chemical oxygen demand (COD), dissolved oxygen (DO), total phosphorus (TP), and turbidity, were derived for analysis. The variables are used as general indicators of water quality<italic>. </italic>For example, the COD is commonly used to measure the amount of organic compounds in water. As the DO in water drops below a threshold, aquatic life is under stress. The presence of high nitrates and TP concentrations in water indicates possible pollution of the water. Turbidity is the haziness of a fluid caused by the SS, which are solid particles usually transported by flowing water.</p>
      </sec>
      <sec>
        <title>2.4. Regression Model</title>
        <p>Reservoir water chemistry was sampled at the outlets and downstream of the reservoir every three months. We refer to the water samples after typhoons in the fourth season and acquire annual values each year. We ran a series of models to examine the correlations between land-cover and the water quality variables.</p>
        <p>Our basic statistical tool was stepwise multiple linear regression, with backward selection of variables and <italic>p  =</italic> 0.1 to enter or remove variables. Cases with missing data were excluded. Statistical analyses were done using SPSS 10.0. The dependent (response) variables are NO<sub>3</sub>-N and SS concentrations that are selected from the high-NDVI correlated water quality factors. The variable details are shown in <xref ref-type="sec" rid="sec3dot2-ijerph-10-00478">Section 3.2</xref>. In addition, the independent variables are average NDVI at various spatial scales such as average NDVI in whole watershed, average NDVI in reservoir 1 km, 2 km and 3 km buffer zones, can be represented as:
        <disp-formula id="ijerph-10-00478-i001">
<inline-graphic xmlns:xlink="http://www.w3.org/1999/xlink" xlink:href="ijerph-10-00478-i001.tif"/><label>(1)</label>
</disp-formula>

        Where <italic>NDVI</italic>(<italic>s,t</italic>) represent NDVI value varies with space <italic>s</italic> and time <italic>t</italic>; <inline-graphic xmlns:xlink="http://www.w3.org/1999/xlink" xlink:href="ijerph-10-00478-i002.tif"/> is average NDVI in whole watershed or reservoir buffer zone during time <italic>t</italic>; <italic>S</italic> is the domain set that defined as whole watershed or reservoir buffer zone; <italic>num</italic> is the number of the pixels in the set <italic>S</italic>.</p>
      </sec>
    </sec>
    <sec sec-type="results">
      <title>3. Results and Discussion</title>
      <sec>
        <title>
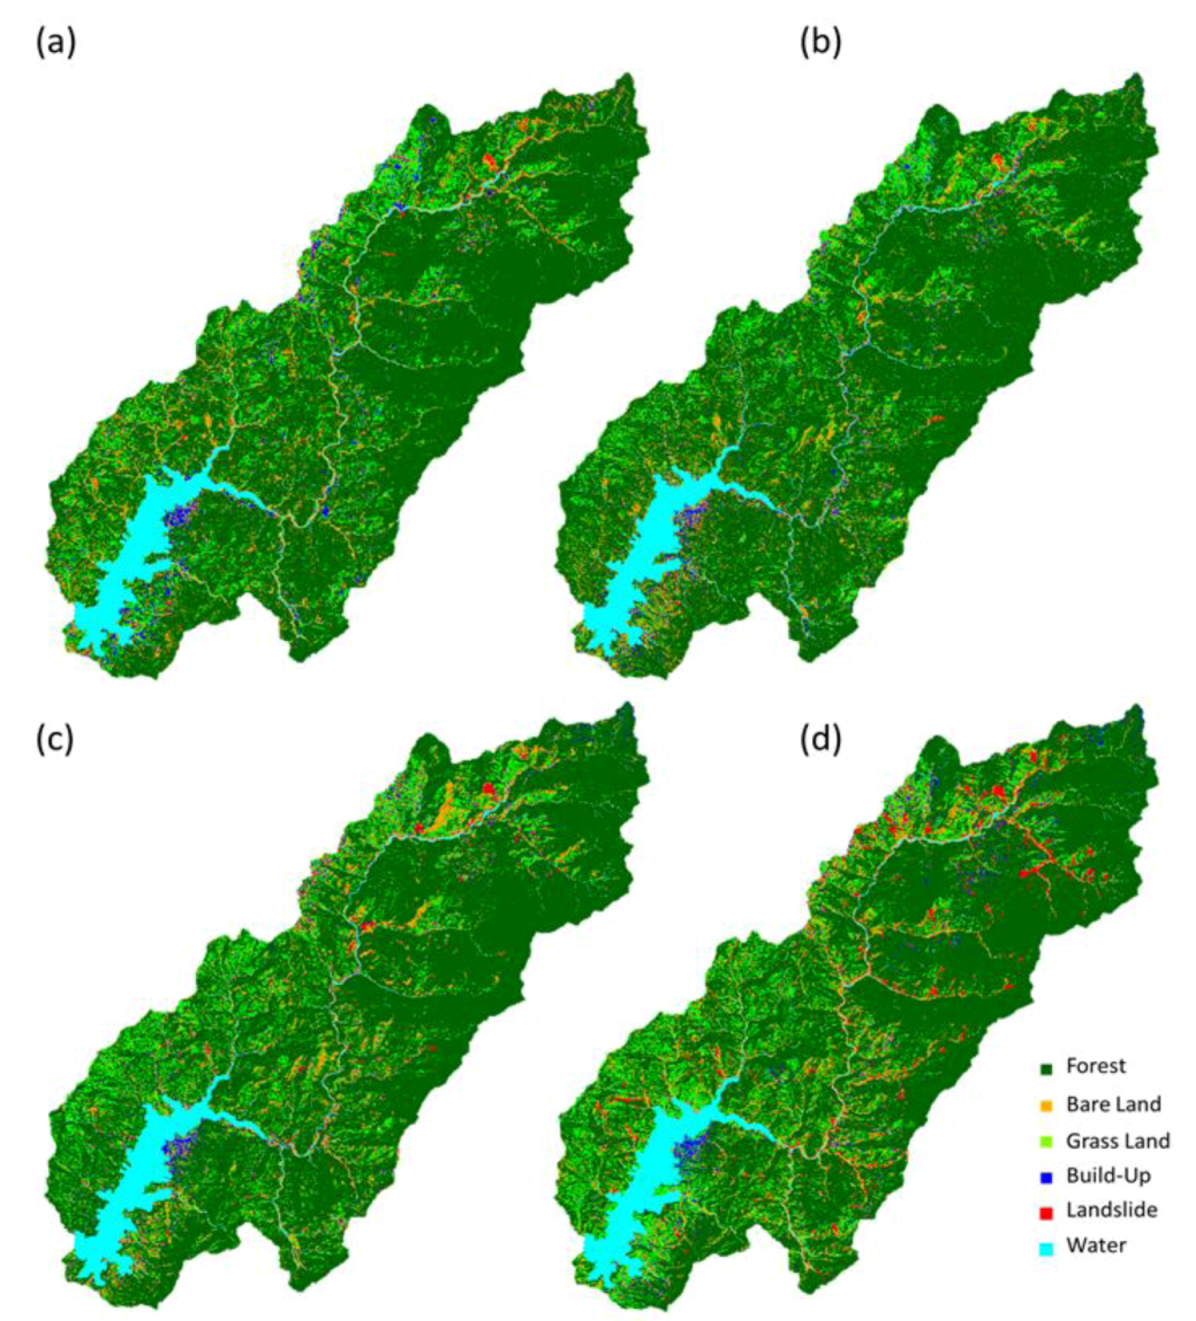
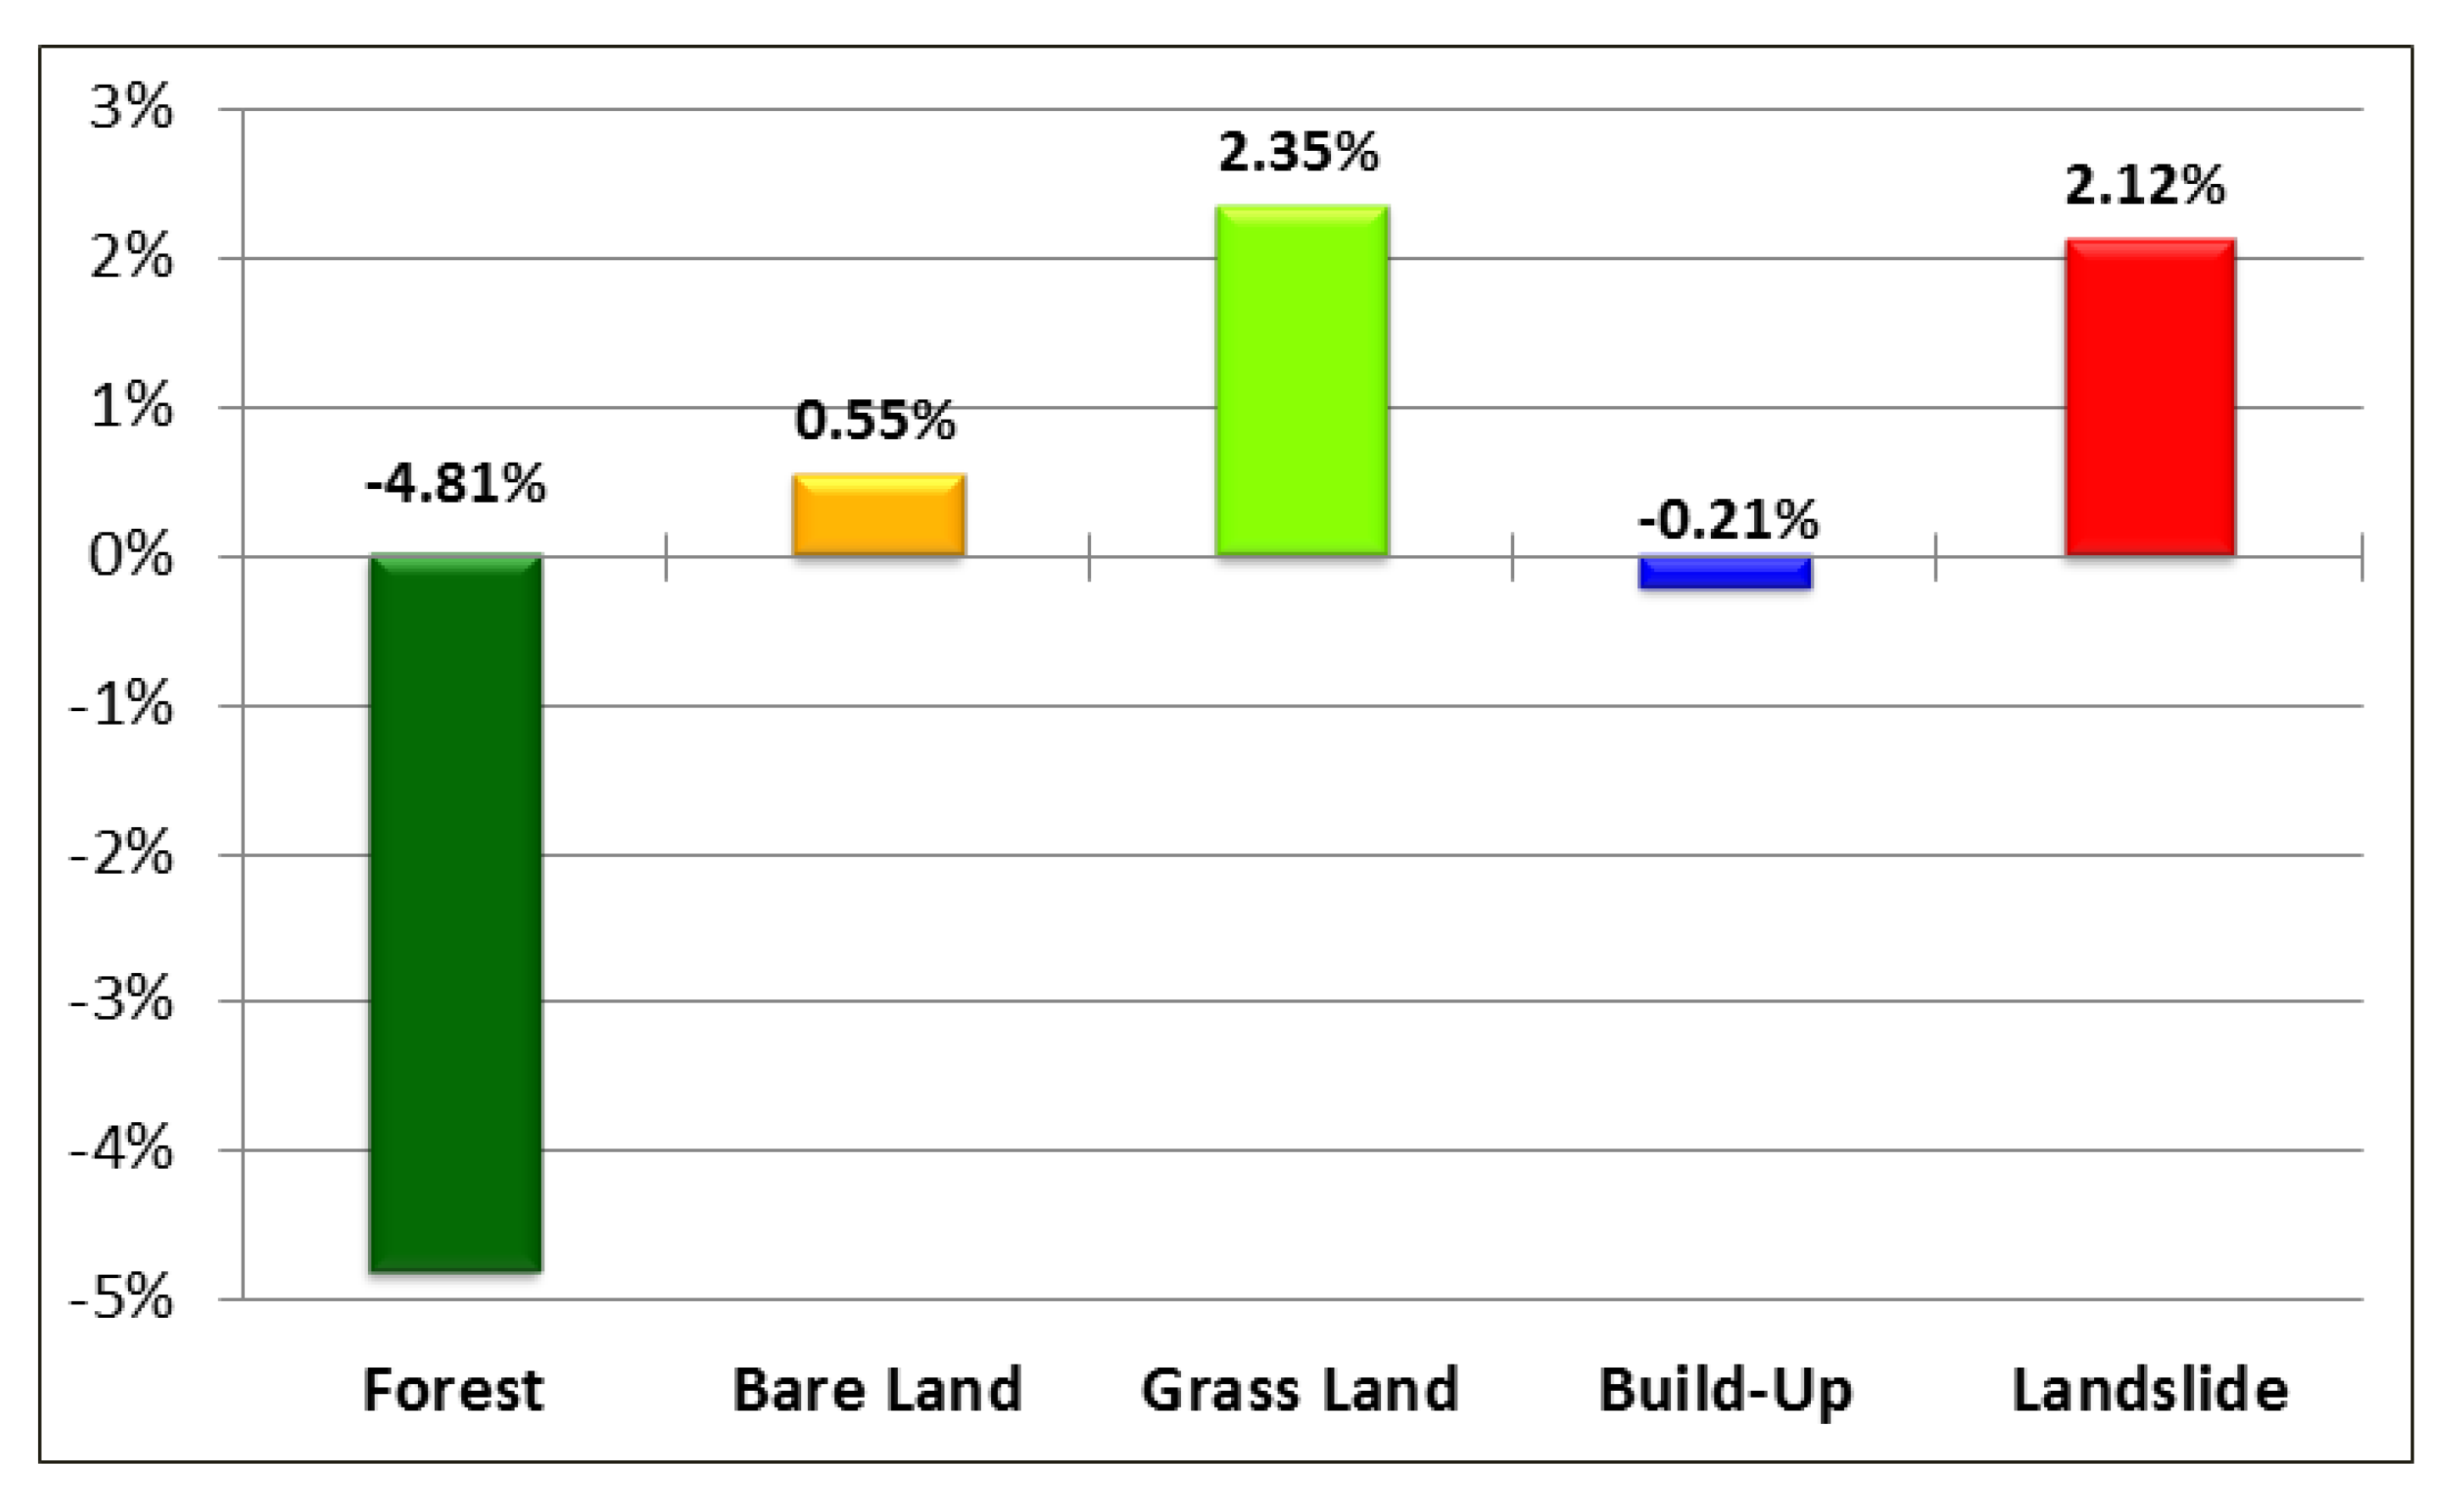
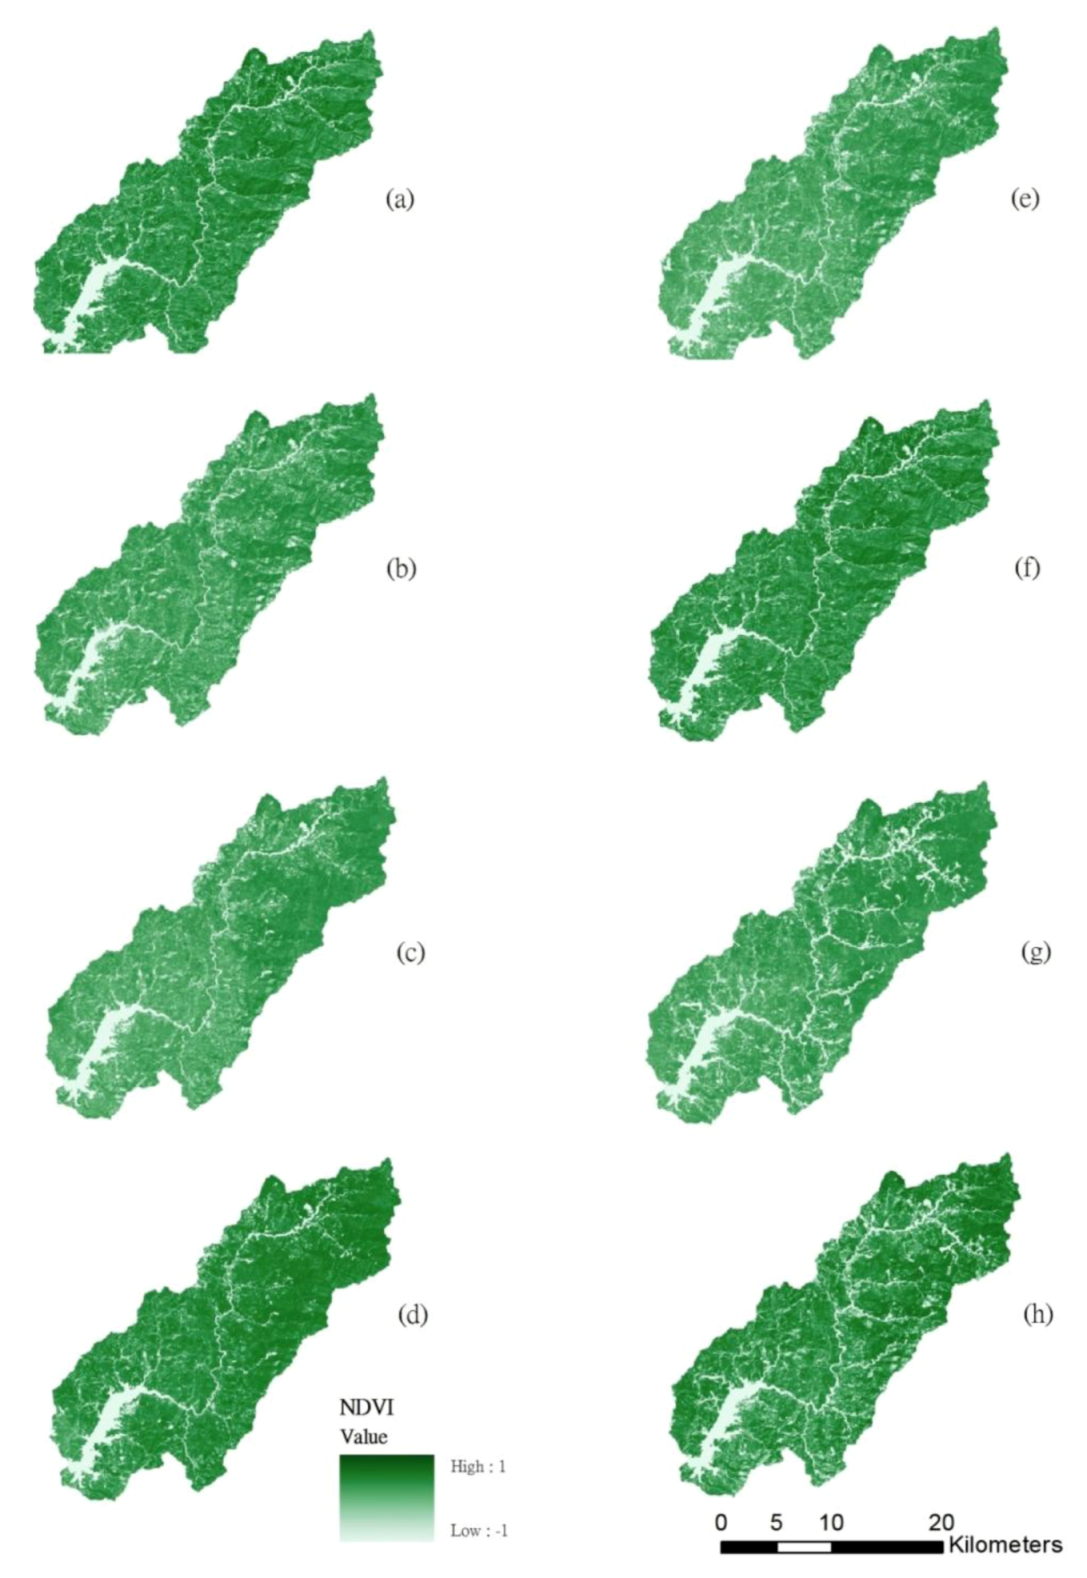
3.1. Temporal Land Use and NDVI Changes</title>
        <p><xref ref-type="fig" rid="ijerph-10-00478-f002">Figure 2</xref> shows that land use classification in 2001, 2004, 2007 and 2010. The forested land, grassland, bare land, build-up, and landslide accounted for 77.61%, 11.72%, 7.72%, 2.55% and 0.42% (excluding water) of the total watershed area in 2001, respectively. During 2001–2010, forest has decreased 4.81%, grassland has increased 2.35%, landslide has increased 2.12%, bare land has increased 0.55%, and built-up land has decreased 0.21% (<xref ref-type="fig" rid="ijerph-10-00478-f003">Figure 3</xref>). The results matched previous studies [<xref ref-type="bibr" rid="B21-ijerph-10-00478">21</xref>,<xref ref-type="bibr" rid="B22-ijerph-10-00478">22</xref>] that many landslides in the Tseng-Wen reservoir watershed were caused by typhoons. <xref ref-type="table" rid="ijerph-10-00478-t001">Table 1</xref> shows the statistics of NDVI images after typhoon events from 2001 to 2010. Results show that the lowest mean NDVI values (0.437) occurred on November 1, 2009, after Typhoon Morakot, and the second lowest NDVI values occurred on December 27, 2010 (0.494). The greatest impact on the landscape is from Typhoons Morakot and Fanapi. During the event (<italic>i.e</italic>., Typhoon Fanapi), the standard deviation of NDVI values was the largest. The analysis results of NDVI images (<xref ref-type="fig" rid="ijerph-10-00478-f004">Figure 4</xref>) are sufficient to present land cover changes induced by disturbances, particularly by spatial structure, variability, and spatial correlation. The disturbances impacted the fragmentation and interspersion of the low NDVI patches and created heterogeneous patterns across the landscape within the affected area [<xref ref-type="bibr" rid="B16-ijerph-10-00478">16</xref>]. However, land cover change may be different in the spatial scales. The box plot shows that the range between the lower and upper quartiles in the NDVI decreases when the buffer zone increases (<xref ref-type="fig" rid="ijerph-10-00478-f005">Figure 5</xref>).</p>
        
      </sec>
      <sec id="sec3dot2-ijerph-10-00478">
        <title>
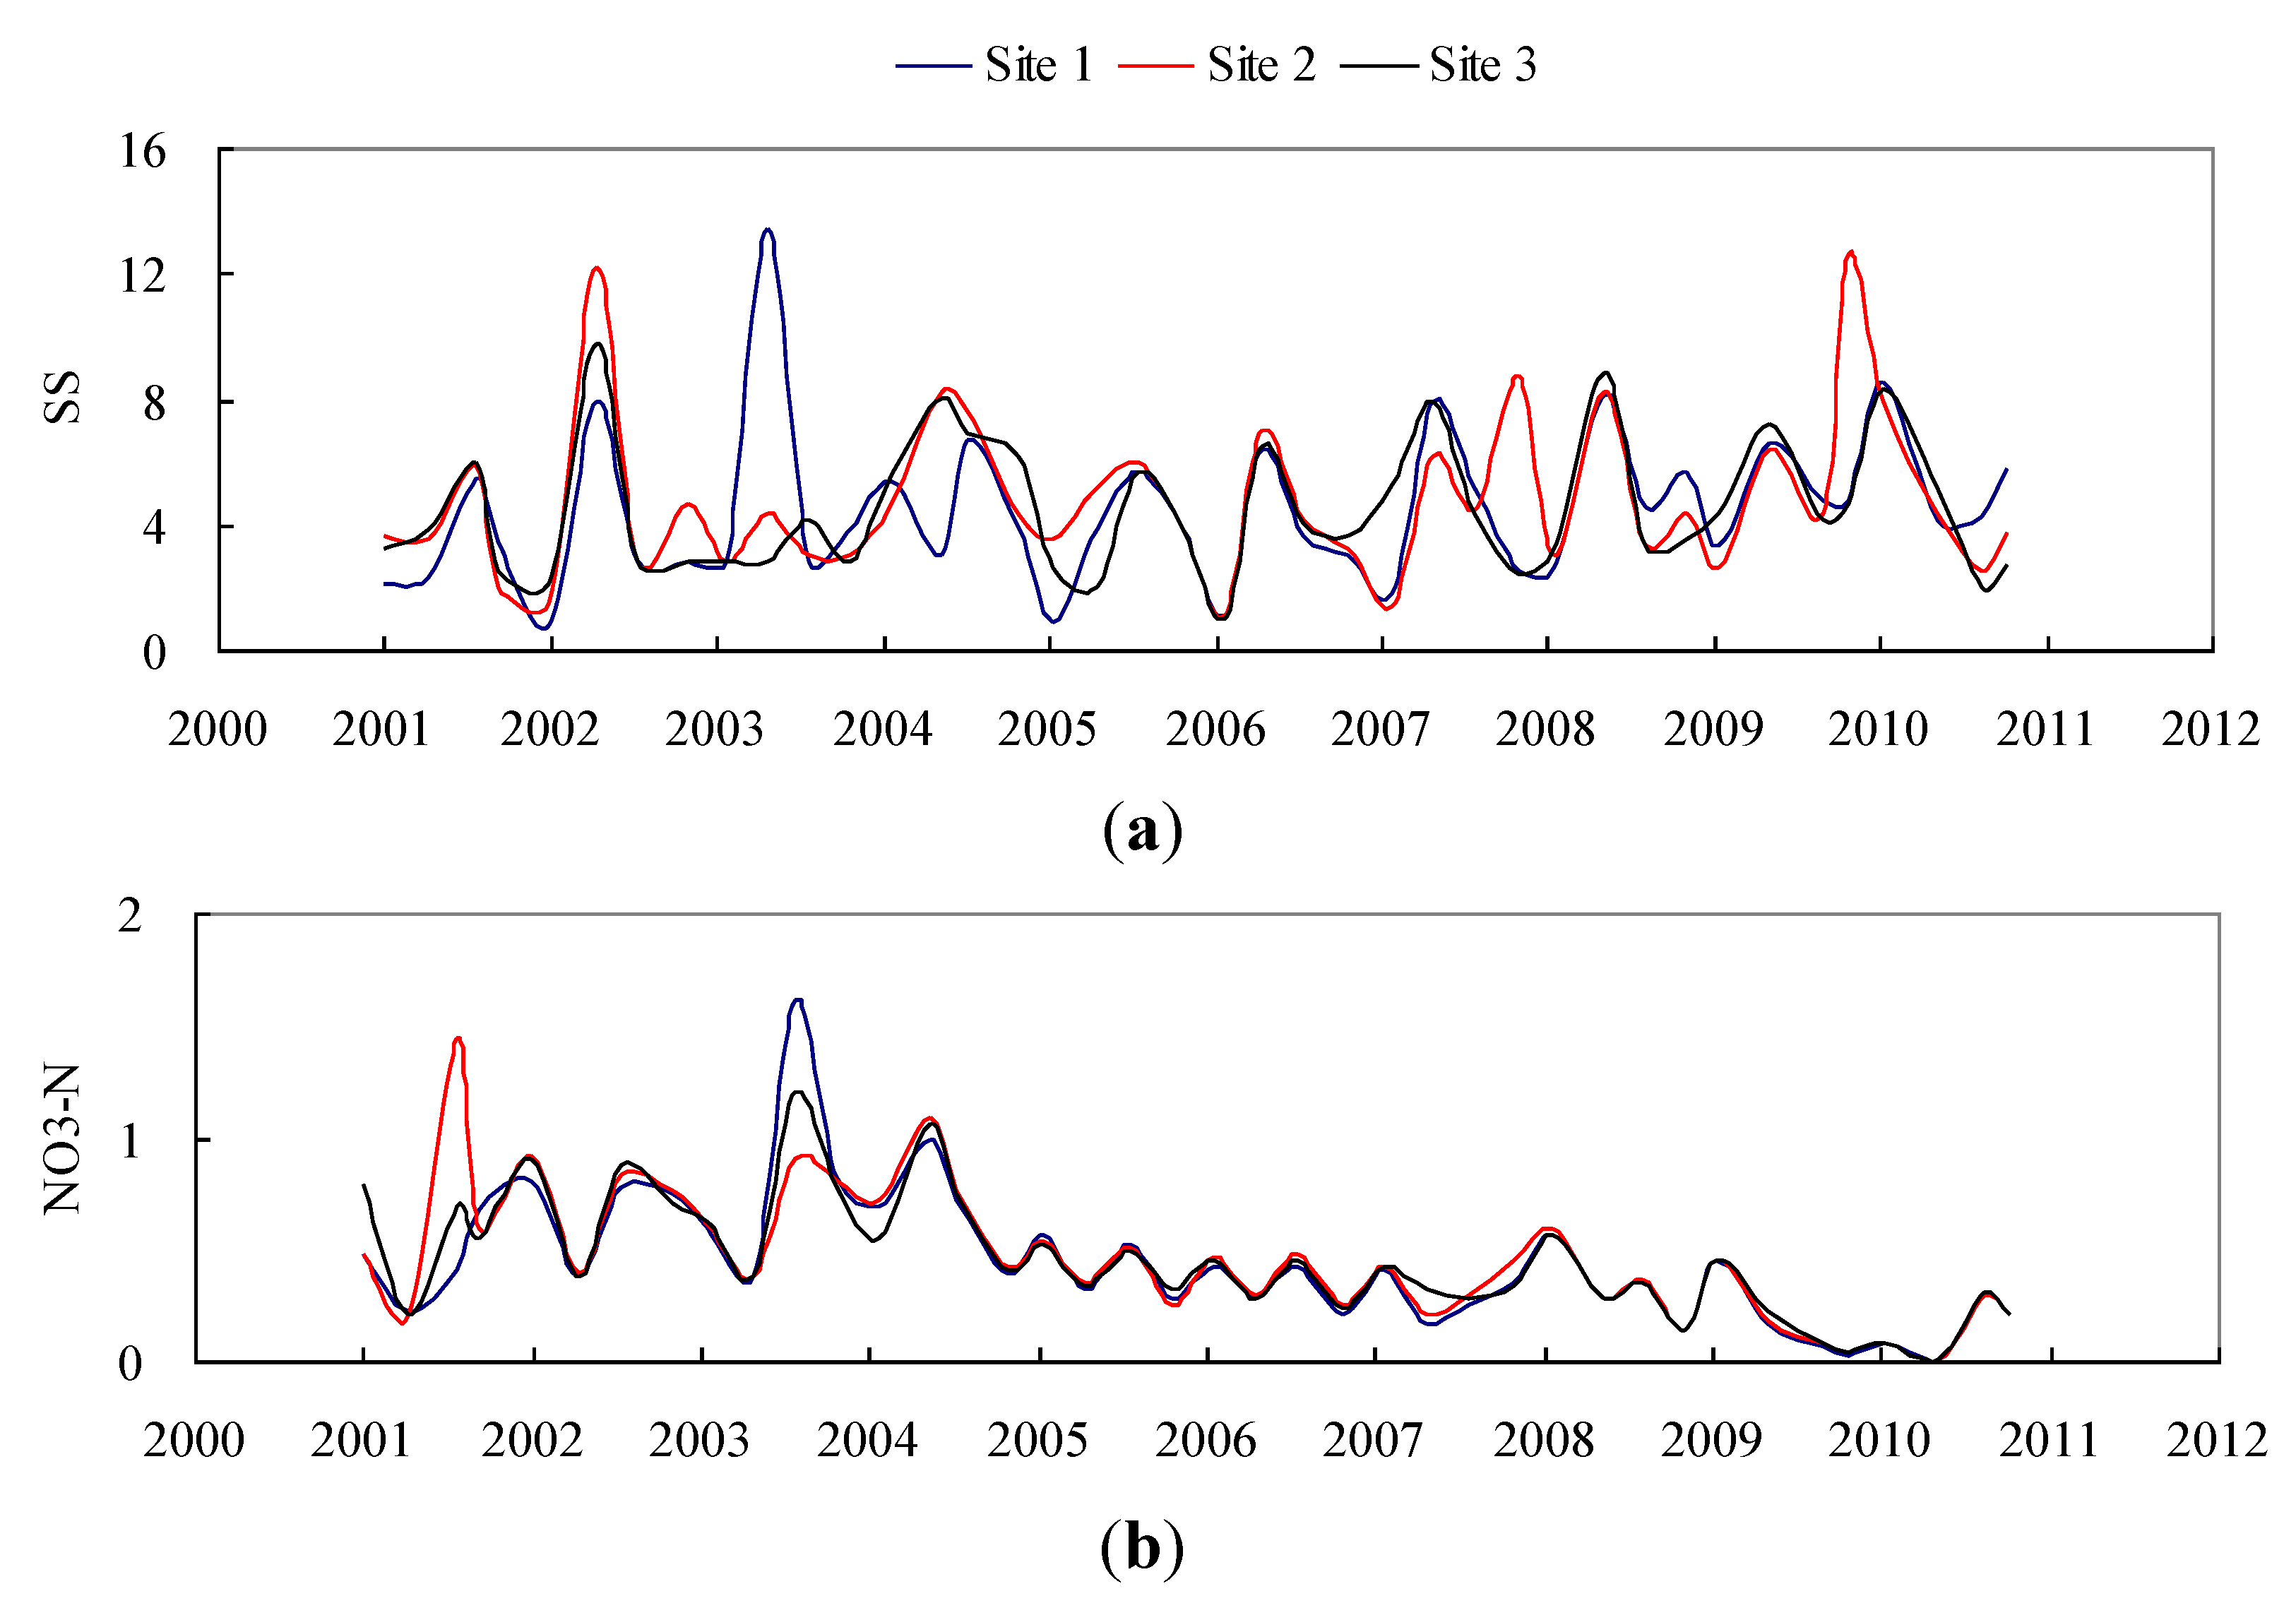
3.2. The Change of Water Quality</title>
        <p><xref ref-type="table" rid="ijerph-10-00478-t002">Table 2</xref> shows the correlation coefficients between the average NDVI in the watershed and average water quality factors during the whole year and after typhoon. The average value of the NDVI in the watershed is strongly correlated with NO<sub>3</sub>-N during the entire year and is strongly correlated with SS after typhoon from 2001 to 2010. These water quality factors such as SS and NO<sub>3</sub>-N concentrations are the indices for water quality assessment when considering land cover changes. The average SS concentrations after typhoons and the average annual NO<sub>3</sub>-N in the sites are used by later descriptive statistics and regression analysis.</p>
        <fig id="ijerph-10-00478-f002" position="float">
          <label>Figure 2</label>
          <caption>
            <p>Land use classification in (<bold>a</bold>) 2001, (<bold>b</bold>) 2004, (<bold>c</bold>) 2007 and (<bold>d</bold>) 2010.</p>
          </caption>
          <graphic xmlns:xlink="http://www.w3.org/1999/xlink" xlink:href="ijerph-10-00478-g002.tif"/>
        </fig>
         <fig id="ijerph-10-00478-f003" position="float">
          <label>Figure 3</label>
          <caption>
            <p>Land use change percentage from 2001 to 2010.</p>
          </caption>
          <graphic xmlns:xlink="http://www.w3.org/1999/xlink" xlink:href="ijerph-10-00478-g003.tif"/>
        </fig>
        <fig id="ijerph-10-00478-f004" position="float">
          <label>Figure 4</label>
          <caption>
            <p>Images of NDVI patterns in the study area during (<bold>a</bold>) 2001, (<bold>b</bold>) 2003, (<bold>c</bold>) 2004,(<bold>d</bold>) 2005, (<bold>e</bold>) 2007, (<bold>f</bold>) 2008, (<bold>g</bold>) 2009 and (<bold>h</bold>) 2010.</p>
          </caption>
          <graphic xmlns:xlink="http://www.w3.org/1999/xlink" xlink:href="ijerph-10-00478-g004.tif"/>
        </fig>
        <fig id="ijerph-10-00478-f005" position="float">
          <label>Figure 5</label>
          <caption>
            <p>Boxplot of NDVI values for (<bold>a</bold>) 1, (<bold>b</bold>) 2, and (<bold>c</bold>) 3 km buffer zones.</p>
          </caption>
          <graphic xmlns:xlink="http://www.w3.org/1999/xlink" xlink:href="ijerph-10-00478-g005.tif"/>
        </fig>
        <table-wrap id="ijerph-10-00478-t002" position="float">
          <object-id pub-id-type="pii">ijerph-10-00478-t002_Table 2</object-id>
          <label>Table 2</label>
          <caption>
            <p>Correlation coefficients of average NDVI and water quality in whole year and after typhoon.</p>
          </caption>
          <table rules="rows" style="border: solid thin">
            <thead>
              <tr>
                <th align="center" valign="middle"> </th>
                <th align="center" valign="middle">NO<sub>3</sub>-N</th>
                <th align="center" valign="middle">SS</th>
                <th align="center" valign="middle">COD</th>
                <th align="center" valign="middle">DO</th>
                <th align="center" valign="middle">TP</th>
                <th align="center" valign="middle">Turbidity</th>
              </tr>
            </thead>
            <tbody>
              <tr>
                <td align="center" valign="middle">
                  <bold>Whole year </bold>
                </td>
                <td align="center" valign="middle">0.687 </td>
                <td align="center" valign="middle">−0.577 </td>
                <td align="center" valign="middle">0.277 </td>
                <td align="center" valign="middle">−0.498 </td>
                <td align="center" valign="middle">0.313 </td>
                <td align="center" valign="middle">0.086 </td>
              </tr>
              <tr>
                <td align="center" valign="middle">
                  <bold>After typhoon</bold>
                </td>
                <td align="center" valign="middle">0.529 </td>
                <td align="center" valign="middle">−0.621 </td>
                <td align="center" valign="middle">0.604 </td>
                <td align="center" valign="middle">−0.060 </td>
                <td align="center" valign="middle">0.364 </td>
                <td align="center" valign="middle">−0.384 </td>
              </tr>
            </tbody>
          </table>
          <table-wrap-foot>
          <fn>
          <p>NO3-N: nitrate-nitrogen; SS: suspended sediments; COD: chemical oxygen demand; DO: dissolved oxygen; TP: total phosphorus.</p>
          </fn>
          </table-wrap-foot>
        </table-wrap>
        
        
        <table-wrap id="ijerph-10-00478-t003" position="float">
          <object-id pub-id-type="pii">ijerph-10-00478-t003_Table 3</object-id>
          <label>Table 3</label>
          <caption>
            <p>Descriptive statistics of SS, and NO<sub>3</sub>-N data in three water quality-monitoring stations during 2001–2010.</p>
          </caption>
          <table rules="rows" style="border: solid thin">
            <thead>
              <tr>
                <th align="left" valign="middle"> </th>
                <th align="left" valign="middle"> </th>
                <th align="right" valign="middle">Mean</th>
                <th align="right" valign="middle">SD</th>
                <th align="right" valign="middle">Q25</th>
                <th align="right" valign="middle">Q75</th>
                <th align="right" valign="middle">Min</th>
                <th align="right" valign="middle">Max</th>
              </tr>
            </thead>
            <tbody>
              <tr>
                <td rowspan="3" align="left" valign="top">SS (ppm)</td>
                <td align="left" valign="middle">Site 1</td>
                <td align="right" valign="middle">4.51 </td>
                <td align="right" valign="middle">2.47 </td>
                <td align="right" valign="middle">2.90 </td>
                <td align="right" valign="middle">5.70 </td>
                <td align="right" valign="middle">0.80 </td>
                <td align="right" valign="middle">13.50 </td>
              </tr>
              <tr>
                <td align="left" valign="middle">Site 2</td>
                <td align="right" valign="middle">4.85 </td>
                <td align="right" valign="middle">2.61 </td>
                <td align="right" valign="middle">3.10 </td>
                <td align="right" valign="middle">6.05 </td>
                <td align="right" valign="middle">1.10 </td>
                <td align="right" valign="middle">12.60 </td>
              </tr>
              <tr>
                <td align="left" valign="middle">Site 3</td>
                <td align="right" valign="middle">4.52 </td>
                <td align="right" valign="middle">2.14 </td>
                <td align="right" valign="middle">2.90 </td>
                <td align="right" valign="middle">5.78 </td>
                <td align="right" valign="middle">1.00 </td>
                <td align="right" valign="middle">9.80 </td>
              </tr>
              <tr>
                <td rowspan="3" align="left" valign="top">NO<sub>3</sub>-N (ppm)</td>
                <td align="left" valign="middle">Site 1</td>
                <td align="right" valign="middle">0.44 </td>
                <td align="right" valign="middle">0.31 </td>
                <td align="right" valign="middle">0.25 </td>
                <td align="right" valign="middle">0.58 </td>
                <td align="right" valign="middle">0.01 </td>
                <td align="right" valign="middle">1.62 </td>
              </tr>
              <tr>
                <td align="left" valign="middle">Site 2</td>
                <td align="right" valign="middle">0.47 </td>
                <td align="right" valign="middle">0.30 </td>
                <td align="right" valign="middle">0.26 </td>
                <td align="right" valign="middle">0.60 </td>
                <td align="right" valign="middle">0.01 </td>
                <td align="right" valign="middle">1.45 </td>
              </tr>
              <tr>
                <td align="left" valign="middle">Site 3</td>
                <td align="right" valign="middle">0.45 </td>
                <td align="right" valign="middle">0.28 </td>
                <td align="right" valign="middle">0.28 </td>
                <td align="right" valign="middle">0.58 </td>
                <td align="right" valign="middle">0.01 </td>
                <td align="right" valign="middle">1.20 </td>
              </tr>
            </tbody>
          </table>
          <table-wrap-foot>
          <fn>
           <p>SD: standard deviation; Q25: the first quartile; Q75: the third quartile; Min: minimum; Max: maximum.</p>
          </fn>
          </table-wrap-foot>
        </table-wrap>
      <fig id="ijerph-10-00478-f006" position="float">
          <label>Figure 6</label>
          <caption>
            <p>Temporal variation of (<bold>a</bold>) SS and (<bold>b</bold>) NO<sub>3</sub>-N during 2001 and 2010 (unit: ppm).</p>
          </caption>
          <graphic xmlns:xlink="http://www.w3.org/1999/xlink" xlink:href="ijerph-10-00478-g006.tif"/>
        </fig>
        <p><xref ref-type="table" rid="ijerph-10-00478-t003">Table 3</xref> lists quarterly measurements of SS, and NO<sub>3</sub>-N data at three water quality-monitoring stations from 2001 to 2010 (<xref ref-type="fig" rid="ijerph-10-00478-f006">Figure 6</xref>). The average concentrations for SS for observation Sites 1, 2, and 3 are in the ranges of 0.8–13.5 (ppm), 1.1–12.6 (ppm), and 1.0–9.8 (ppm), respectively. Moreover, the average concentration of NO<sub>3</sub>-N for Sites 1, 2, and 3 are in the ranges of 0.01–1.62 (ppm), 0.01–1.45 (ppm), and 0.01–1.20 (ppm), respectively. The average SS values are 4.51, 4.85, and 4.52 (ppm), and the average NO<sub>3</sub>-N values are 0.44, 0.47, and 0.45 (ppm) in these 3 sites. <xref ref-type="fig" rid="ijerph-10-00478-f006">Figure 6</xref>(a) shows that SS concentrations are cyclical. Typhoons and heavy rainfalls trigger large sediment discharge into the rivers of Taiwan and cause high-suspended sediment concentrations during these events<italic>. </italic>Most nitrate concentrations in the water drains from agricultural land. However<italic>, </italic><xref ref-type="fig" rid="ijerph-10-00478-f006">Figure 6</xref>(b) shows NO<sub>3</sub>-N concentrations vary with a decreasing trend.</p>
        
      </sec>
      <sec>
        <title>3.3. Relationship between SS Concentration and Land Cover Change</title>
        <p><xref ref-type="table" rid="ijerph-10-00478-t004">Table 4</xref> shows the regression models for water quality and land cover changes at various spatial scales. The factors comprise the average NDVI in the watershed, and the average NDVI in 1 km, 2 km, and 3 km buffer zones. Results show that annual nitrate-nitrogen concentrations are positively correlated with the NDVI with a 1 km buffer area. However, SS is negatively impacted by the average NDVI in the watershed, suggesting that typhoons impact land cover change in the watershed. For example, typhoons cause landslides, and these are a major source of soil erosion and sediment yield in the watershed<italic>. </italic>The average NDVI in the watershed adversely impacts the water quality, and therefore, increases sediments associated with water quality. The average NDVI in the watershed becomes a key factor influencing the SS concentration. Typhoon events are major natural disturbances causing NDVI changes and also cause serious landslides [<xref ref-type="bibr" rid="B16-ijerph-10-00478">16</xref>,<xref ref-type="bibr" rid="B23-ijerph-10-00478">23</xref>,<xref ref-type="bibr" rid="B24-ijerph-10-00478">24</xref>]. Both important factors affecting soil erosion and sediment delivery to river channels are changes in land use and climate. Due to destruction of vegetation and increased soil exposure in the watershed after rainstorms and typhoons, the NDVI values decreased. The rainstorms and typhoons cause divergent destruction of vegetation, and led to an increase in the potential for soil erosion.</p>
        <table-wrap id="ijerph-10-00478-t004" position="float">
          <object-id pub-id-type="pii">ijerph-10-00478-t004_Table 4</object-id>
          <label>Table 4</label>
          <caption>
            <p>Regression model for the function of water quality and average NDVI in various scales.</p>
          </caption>
          <table rules="rows" style="border: solid thin">
            <thead>
              <tr>
                <th align="left" valign="middle"> </th>
                <th align="center" valign="middle">SS</th>
                <th align="center" valign="middle">NO<sub>3</sub>-N</th>
              </tr>
            </thead>
            <tbody>
              <tr>
                <td align="left" valign="middle">Const.</td>
                <td align="center" valign="middle">6.86</td>
                <td align="center" valign="middle">−0.73</td>
              </tr>
              <tr>
                <td align="left" valign="middle">NDVI_Watershed</td>
                <td align="center" valign="middle">−23.74 *</td>
                <td align="center" valign="middle">-</td>
              </tr>
              <tr>
                <td align="left" valign="middle">NDVI_Buffer1</td>
                <td align="center" valign="middle">-</td>
                <td align="center" valign="middle">2.10*</td>
              </tr>
              <tr>
                <td align="left" valign="middle">NDVI_Buffer2</td>
                <td align="center" valign="middle">-</td>
                <td align="center" valign="middle">-</td>
              </tr>
              <tr>
                <td align="left" valign="middle">NDVI_Buffer3</td>
                <td align="center" valign="middle">20.23</td>
                <td align="center" valign="middle">-</td>
              </tr>
              <tr>
                <td align="left" valign="middle">
                  <italic>R<sup>2</sup></italic>
                </td>
                <td align="center" valign="middle">0.65</td>
                <td align="center" valign="middle">0.75</td>
              </tr>
            </tbody>
          </table>
          <table-wrap-foot>
          <fn>
          <p><bold>*</bold> represents <italic>p </italic>&lt; 0.05;</p>
        <p>NDVI_Watershed: average NDVI in whole watershed;</p>
        <p>NDVI_Buffer1: average value of NDVI in 1 km buffer zone;</p>
        <p>NDVI_Buffer2: average value of NDVI in 2 km buffer zone;</p>
        <p>NDVI_Buffer3: average value of NDVI in 3 km buffer zone.</p>
          </fn>
          </table-wrap-foot>
        </table-wrap>
        
      </sec>
      <sec>
        <title>3.4. Relationship Between NO<sub>3</sub>-N Concentration and Land Cover Change</title>
        <p>Results show that the dominant explanatory variables in NO<sub>3</sub>-N cases have an average NDVI with a 1 km buffer zone. In some reservoirs and lakes, the primary indicator of agriculture is dependent on NO<sub>3</sub>-N concentration. The nitrate concentration is correlated with agricultural practices during the high-flow period. Human activity alters the patterns of nitrate concentrations during storm events in the agricultural catchment [<xref ref-type="bibr" rid="B25-ijerph-10-00478">25</xref>]. Since Taiwan joined the World Trade Organization (WTO) in 2002, imported agricultural products are cheaper than domestic ones, thus negating the need for extensive agriculture areas. This corresponds to the data that tea farms in Chiayi County decreased from 2,292 to 2,189 ha from 2005 to 2011 [<xref ref-type="bibr" rid="B26-ijerph-10-00478">26</xref>]. Forestry, agriculture, and anthropogenic activities impact the quality of water over short and long periods [<xref ref-type="bibr" rid="B27-ijerph-10-00478">27</xref>]. The SS and NO<sub>3</sub>-N are typically sensitive in landslide and agriculture land areas. The previous results match that percent agricultural coverage had a significant influence on both SS and nitrate-N loading [<xref ref-type="bibr" rid="B7-ijerph-10-00478">7</xref>]. NDVI variation results imply that as land cover changes; hence, the multi-scale NDVI, which is one of the indices in the watershed of land cover changes, is associated with water quality and is hard to directly link with agriculture. However, the land use classification of SPOT images is also hard to identify the agriculture land. Further study could consider the high-resolution satellite images in the land use classification.</p>
      </sec>
    </sec>
    <sec sec-type="conclusions">
      <title>4. Conclusions</title>
      <p>This study examined the NDVI images from 2001 to 2010 based on SPOT imagery data. The imagery shows that the land cover changes in the study vary with the influences of typhoons and human activities. Satellite image data showed a general decline in the acreage of vegetation cover implying increased landslide and decreased forest pressure on the vegetation resources.</p>
      <p>Land cover change had a significant influence on both suspended solid and nitrate-nitrogen loadings. Simple regressions were performed that showed water quality is related to land cover in various spatial scales. Annual NO<sub>3</sub>-N concentration is positively correlated with an average NDVI with a reservoir 1 km buffer area, but SS are negatively correlated with an average NDVI in the watershed after typhoon events. Understanding the relationship between land cover change and water quality is useful for watershed management and pollution prevention plans. Further study should add additional spatial and independent variables to the models, such as percentage of land use type, anthropogenic activities and typhoon precipitation. </p>
    </sec>
    
  </body>
  <back>
  <ack>
      <title>Acknowledgment</title>
      <p>The authors would like to thank Dept. of Land Administration, Ministry of Interior and National Science Council, Taiwan (No. NSC 100-2218-E-006-021) for financially supporting this research. This research received funding from the Headquarters of University Advancement at the National Cheng Kung University, which is sponsored by the Ministry of Education, Taiwan. We also thank editors, many helpers and the Taiwanese EPA for providing the monitoring data and Center for Space &amp; Remote Sensing Research, NCU for image processing assistance.</p>
    </ack>
    <ref-list>
      <title>References</title>
      <ref id="B1-ijerph-10-00478">
        <label>1.</label>
        <citation citation-type="journal">
          <person-group person-group-type="author">
            <name>
              <surname>Allan</surname>
              <given-names>J.D.</given-names>
            </name>
            <name>
              <surname>Erickson</surname>
              <given-names>D.L.</given-names>
            </name>
            <name>
              <surname>Fay</surname>
              <given-names>J.</given-names>
            </name>
          </person-group>
          <article-title>The influence of catchment land use on stream integrity across multiple spatial scales</article-title>
          <source>Freshwater Biol.</source>
          <year>1997</year>
          <volume>37</volume>
          <fpage>149</fpage>
          <lpage>161</lpage>
        <pub-id pub-id-type="doi">10.1046/j.1365-2427.1997.d01-546.x</pub-id></citation>
      </ref>
      <ref id="B2-ijerph-10-00478">
        <label>2.</label>
        <citation citation-type="journal">
          <person-group person-group-type="author">
            <name>
              <surname>Burcher</surname>
              <given-names>C.L.</given-names>
            </name>
            <name>
              <surname>Valett</surname>
              <given-names>H.M.</given-names>
            </name>
            <name>
              <surname>Benfield</surname>
              <given-names>E.F.</given-names>
            </name>
          </person-group>
          <article-title>The land-cover cascade: Relationships coupling land and water</article-title>
          <source>Ecology</source>
          <year>2007</year>
          <volume>88</volume>
          <fpage>228</fpage>
          <lpage>242</lpage>
          <pub-id pub-id-type="doi">10.1890/0012-9658(2007)88[228:TLCRCL]2.0.CO;2</pub-id>
        </citation>
      </ref>
      <ref id="B3-ijerph-10-00478">
        <label>3.</label>
        <citation citation-type="journal">
          <person-group person-group-type="author">
            <name>
              <surname>Prato</surname>
              <given-names>T.</given-names>
            </name>
          </person-group>
          <article-title>Selection and evaluation of projects to conserve ecosystem services</article-title>
          <source>Biol. Modelling</source>
          <year>2007</year>
          <volume>203</volume>
          <fpage>290</fpage>
          <lpage>296</lpage>
          <pub-id pub-id-type="doi">10.1016/j.ecolmodel.2006.11.030</pub-id>
        </citation>
      </ref>
      <ref id="B4-ijerph-10-00478">
        <label>4.</label>
        <citation citation-type="journal">
          <person-group person-group-type="author">
            <name>
              <surname>Allan</surname>
              <given-names>J.D.</given-names>
            </name>
            <name>
              <surname>Erickson</surname>
              <given-names>D.L.</given-names>
            </name>
            <name>
              <surname>Fay</surname>
              <given-names>J.</given-names>
            </name>
          </person-group>
          <article-title>The influence of catchment land use on stream integrity across multiple spatial scales</article-title>
          <source>Freshwater Biol.</source>
          <year>1997</year>
          <volume>37</volume>
          <fpage>149</fpage>
          <lpage>161</lpage>
        <pub-id pub-id-type="doi">10.1046/j.1365-2427.1997.d01-546.x</pub-id></citation>
      </ref>
      <ref id="B5-ijerph-10-00478">
        <label>5.</label>
        <citation citation-type="journal">
          <person-group person-group-type="author">
            <name>
              <surname>Bolstad</surname>
              <given-names>P.V.</given-names>
            </name>
            <name>
              <surname>Swank</surname>
              <given-names>W.T.</given-names>
            </name>
          </person-group>
          <article-title>Cumulative impacts of landuse on water quality in a southern Appalachian watershed</article-title>
          <source>J. Am. Water Resour. Assoc.</source>
          <year>1997</year>
          <volume>33</volume>
          <fpage>519</fpage>
          <lpage>533</lpage>
          <pub-id pub-id-type="doi">10.1111/j.1752-1688.1997.tb03529.x</pub-id>
        </citation>
      </ref>
      <ref id="B6-ijerph-10-00478">
        <label>6.</label>
        <citation citation-type="journal">
          <person-group person-group-type="author">
            <name>
              <surname>Johnson</surname>
              <given-names>L.B.</given-names>
            </name>
            <name>
              <surname>Richards</surname>
              <given-names>C.</given-names>
            </name>
            <name>
              <surname>Host</surname>
              <given-names>G.E.</given-names>
            </name>
            <name>
              <surname>Arthur</surname>
              <given-names>J.W.</given-names>
            </name>
          </person-group>
          <article-title>Landscape influences on water chemistry in midwestern stream ecosystems</article-title>
          <source>Freshwater Biol.</source>
          <year>1997</year>
          <volume>37</volume>
          <fpage>193</fpage>
          <lpage>208</lpage>
        <pub-id pub-id-type="doi">10.1046/j.1365-2427.1997.d01-539.x</pub-id></citation>
      </ref>
      <ref id="B7-ijerph-10-00478">
        <label>7.</label>
        <citation citation-type="journal">
          <person-group person-group-type="author">
            <name>
              <surname>Ahearn</surname>
              <given-names>D.S.</given-names>
            </name>
            <name>
              <surname>Sheibley</surname>
              <given-names>R.S.</given-names>
            </name>
            <name>
              <surname>Dahlgren</surname>
              <given-names>R.A.</given-names>
            </name>
            <name>
              <surname>Anderson</surname>
              <given-names>M.</given-names>
            </name>
            <name>
              <surname>Jonson</surname>
              <given-names>J.</given-names>
            </name>
            <name>
              <surname>Tate</surname>
              <given-names>K.W.</given-names>
            </name>
          </person-group>
          <article-title>Land use and land cover influence on water quality in the last free-flowing river draining the western Sierra Nevada, California</article-title>
          <source>J. Hydrol.</source>
          <year>2005</year>
          <volume>313</volume>
          <fpage>234</fpage>
          <lpage>247</lpage>
          <pub-id pub-id-type="doi">10.1016/j.jhydrol.2005.02.038</pub-id>
        </citation>
      </ref>
      <ref id="B8-ijerph-10-00478">
        <label>8.</label>
        <citation citation-type="journal">
          <person-group person-group-type="author">
            <name>
              <surname>Osborne</surname>
              <given-names>L.L.</given-names>
            </name>
            <name>
              <surname>Wiley</surname>
              <given-names>M.J.</given-names>
            </name>
          </person-group>
          <article-title>Empirical relationships between land-use cover and stream water-quality in an agricultural watershed</article-title>
          <source>J. Environ. Manage.</source>
          <year>1988</year>
          <volume>26</volume>
          <fpage>9</fpage>
          <lpage>27</lpage>
        </citation>
      </ref>
      <ref id="B9-ijerph-10-00478">
        <label>9.</label>
        <citation citation-type="journal">
          <person-group person-group-type="author">
            <name>
              <surname>Sliva</surname>
              <given-names>L.</given-names>
            </name>
            <name>
              <surname>Williams</surname>
              <given-names>D.D.</given-names>
            </name>
          </person-group>
          <article-title>Buffer zone <italic>versus </italic>whole catchment approaches to studying land use impact on river water quality</article-title>
          <source>Water Res.</source>
          <year>2001</year>
          <volume>35</volume>
          <fpage>3462</fpage>
          <lpage>3472</lpage>
          <pub-id pub-id-type="doi">10.1016/S0043-1354(01)00062-8</pub-id>
        </citation>
      </ref>
      <ref id="B10-ijerph-10-00478">
        <label>10.</label>
        <citation citation-type="journal">
          <person-group person-group-type="author">
            <name>
              <surname>Li</surname>
              <given-names>S.Y.</given-names>
            </name>
            <name>
              <surname>Gu</surname>
              <given-names>S.</given-names>
            </name>
            <name>
              <surname>Liu</surname>
              <given-names>W.Z.</given-names>
            </name>
            <name>
              <surname>Han</surname>
              <given-names>H.Y.</given-names>
            </name>
            <name>
              <surname>Zhang</surname>
              <given-names>Q.F.</given-names>
            </name>
          </person-group>
          <article-title>Water quality in relation to land use and land cover in the upper Han River Basin, China</article-title>
          <source>CATENA</source>
          <year>2008</year>
          <volume>75</volume>
          <fpage>216</fpage>
          <lpage>222</lpage>
        <pub-id pub-id-type="doi">10.1016/j.catena.2008.06.005</pub-id></citation>
      </ref>
      <ref id="B11-ijerph-10-00478">
        <label>11.</label>
        <citation citation-type="journal">
          <person-group person-group-type="author">
            <name>
              <surname>Wang</surname>
              <given-names>X.</given-names>
            </name>
          </person-group>
          <article-title>Integrating water-quality management and land-use planning in a watershed context</article-title>
          <source>J. Environ. Manage.</source>
          <year>2001</year>
          <volume>61</volume>
          <fpage>25</fpage>
          <lpage>36</lpage>
          <pub-id pub-id-type="doi">10.1006/jema.2000.0395</pub-id>
        </citation>
      </ref>
      <ref id="B12-ijerph-10-00478">
        <label>12.</label>
        <citation citation-type="journal">
          <person-group person-group-type="author">
            <name>
              <surname>Stefanov</surname>
              <given-names>W.L.</given-names>
            </name>
            <name>
              <surname>Netzband</surname>
              <given-names>M.</given-names>
            </name>
          </person-group>
          <article-title>Assessment of ASTER land cover and MODIS NDVI data at multiple scales for ecological characterization of an arid urban center</article-title>
          <source>Remote Sen. Environ.</source>
          <year>2005</year>
          <volume>99</volume>
          <fpage>31</fpage>
          <lpage>43</lpage>
          <pub-id pub-id-type="doi">10.1016/j.rse.2005.04.024</pub-id>
        </citation>
      </ref>
      <ref id="B13-ijerph-10-00478">
        <label>13.</label>
        <citation citation-type="book">
          <person-group person-group-type="author">
            <name>
              <surname>Legendre</surname>
              <given-names>P.</given-names>
            </name>
            <name>
              <surname>Legendre</surname>
              <given-names>L.</given-names>
            </name>
          </person-group>
          <source>Numerical Ecology</source>
          <publisher-name>Elsevier</publisher-name>
          <publisher-loc>Amsterdam, The Netherlands</publisher-loc>
          <year>1998</year>
        </citation>
      </ref>
      <ref id="B14-ijerph-10-00478">
        <label>14.</label>
        <citation citation-type="journal">
          <person-group person-group-type="author">
            <name>
              <surname>Senay</surname>
              <given-names>G.B.</given-names>
            </name>
            <name>
              <surname>Elliott</surname>
              <given-names>R.L.</given-names>
            </name>
          </person-group>
          <article-title>Combining AVHRR-NDVI and landuse data to describe temporal and spatial dynamics of vegetation</article-title>
          <source>Forest Ecol. Manage.</source>
          <year>2000</year>
          <volume>128</volume>
          <fpage>83</fpage>
          <lpage>91</lpage>
          <pub-id pub-id-type="doi">10.1016/S0378-1127(99)00275-3</pub-id>
        </citation>
      </ref>
      <ref id="B15-ijerph-10-00478">
        <label>15.</label>
        <citation citation-type="journal">
          <person-group person-group-type="author">
            <name>
              <surname>Lin</surname>
              <given-names>Y.P.</given-names>
            </name>
            <name>
              <surname>Chu</surname>
              <given-names>H.J.</given-names>
            </name>
            <name>
              <surname>Wang</surname>
              <given-names>C.L.</given-names>
            </name>
            <name>
              <surname>Yu</surname>
              <given-names>H.H.</given-names>
            </name>
            <name>
              <surname>Wang</surname>
              <given-names>Y.C.</given-names>
            </name>
          </person-group>
          <article-title>Remote sensing data with the conditional Latin hypercube sampling and geostatistical approach to delineate landscape changes induced by large chronological physical disturbances</article-title>
          <source>Sensors</source>
          <year>2009</year>
          <volume>9</volume>
          <fpage>148</fpage>
          <lpage>174</lpage>
          <pub-id pub-id-type="doi">10.3390/s90100148</pub-id>
        </citation>
      </ref>
      <ref id="B16-ijerph-10-00478">
        <label>16.</label>
        <citation citation-type="journal">
          <person-group person-group-type="author">
            <name>
              <surname>Chu</surname>
              <given-names>H.J.</given-names>
            </name>
            <name>
              <surname>Lin</surname>
              <given-names>Y.P.</given-names>
            </name>
            <name>
              <surname>Huang</surname>
              <given-names>Y.L.</given-names>
            </name>
            <name>
              <surname>Wang</surname>
              <given-names>Y.C.</given-names>
            </name>
          </person-group>
          <article-title>Detecting the land-cover changes induced by large-physical disturbances using landscape metrics, spatial sampling, simulation and spatial analysis</article-title>
          <source>Sensors</source>
          <year>2009</year>
          <volume>9</volume>
          <fpage>6670</fpage>
          <lpage>6700</lpage>
          <pub-id pub-id-type="doi">10.3390/s90906670</pub-id>
        </citation>
      </ref>
      <ref id="B17-ijerph-10-00478">
        <label>17.</label>
        <citation citation-type="web">
          <article-title>Typhoon Database in Taiwan</article-title>
          
          <comment>Available online:<ext-link xmlns:xlink="http://www.w3.org/1999/xlink" xlink:href="http://rdc28.cwb.gov.tw/" ext-link-type="uri">http://rdc28.cwb.gov.tw/</ext-link></comment><access-date>(accessed on 22 September 2012)</access-date>
        </citation>
      </ref>
      <ref id="B18-ijerph-10-00478">
        <label>18.</label>
        <citation citation-type="web">
          <article-title>ENVI Atmospheric Correction Module: QUAC and FLAASH User’s Guide</article-title>
          
          <comment>Available online:<ext-link xmlns:xlink="http://www.w3.org/1999/xlink" xlink:href="http://www.exelisvis.com/portals/0/pdfs/envi/Flaash_Module.pdf" ext-link-type="uri">http://www.exelisvis.com/portals/0/pdfs/envi/Flaash_Module.pdf</ext-link></comment>
		  <access-date>(accessed on 22 September 2012)</access-date>
        </citation>
      </ref>
      <ref id="B19-ijerph-10-00478">
        <label>19.</label>
        <citation citation-type="confproc">
          <person-group person-group-type="author">
            <name>
              <surname>Chu</surname>
              <given-names>H.J.</given-names>
            </name>
            <name>
              <surname>Liu</surname>
              <given-names>C.Y.</given-names>
            </name>
            <name>
              <surname>Wang</surname>
              <given-names>C.K.</given-names>
            </name>
          </person-group>
          <article-title>Relationship between Land Cover and Water Quality in Tseng-Wen Reservoir Watershed, Taiwan</article-title>
          <source>Proceedings of the 33rd Asian Conference on Remote Sensing (ACRS 2012)</source>
          <conf-loc>Pattaya, Thailand</conf-loc>
          <conf-date>26–30 November 2012</conf-date>
        </citation>
      </ref>
      <ref id="B20-ijerph-10-00478">
        <label>20.</label>
        <citation citation-type="web">
          <source>Taiwanese Environmental Protection Administration (EPA) Websites</source>
          
          <comment>Available online:<ext-link xmlns:xlink="http://www.w3.org/1999/xlink" xlink:href="http://taqm.epa.gov.tw/taqm/zh-tw/default.aspx" ext-link-type="uri">http://taqm.epa.gov.tw/taqm/zh-tw/default.aspx</ext-link></comment>
		  <access-date>(accessed on 22 September 2012)</access-date>
        </citation>
      </ref>
      <ref id="B21-ijerph-10-00478">
        <label>21.</label>
        <citation citation-type="journal">
          <person-group person-group-type="author">
            <name>
              <surname>Galewsky</surname>
              <given-names>J.</given-names>
            </name>
            <name>
              <surname>Stark</surname>
              <given-names>C.P.</given-names>
            </name>
            <name>
              <surname>Dadson</surname>
              <given-names>S.</given-names>
            </name>
            <name>
              <surname>Wu</surname>
              <given-names>C.C.</given-names>
            </name>
            <name>
              <surname>Sobel</surname>
              <given-names>A.H.</given-names>
            </name>
            <name>
              <surname>Horng</surname>
              <given-names>M.J.</given-names>
            </name>
          </person-group>
          <article-title>Tropical cyclone triggering of sediment discharge in Taiwan</article-title>
          <source>J. Geophys. Res. Earth Surf.</source>
          <year>2006</year>
          <volume>111</volume>
          <pub-id pub-id-type="doi">10.1029/2005JF000428</pub-id>
        </citation>
      </ref>
      <ref id="B22-ijerph-10-00478">
        <label>22.</label>
        <citation citation-type="journal">
          <person-group person-group-type="author">
            <name>
              <surname>Ward</surname>
              <given-names>P.</given-names>
            </name>
            <name>
              <surname>van Balen</surname>
              <given-names>R.T.</given-names>
            </name>
            <name>
              <surname>Verstraeten</surname>
              <given-names>G.</given-names>
            </name>
            <name>
              <surname>Renssen</surname>
              <given-names>H.</given-names>
            </name>
            <name>
              <surname>Vandenberghe</surname>
              <given-names>J.</given-names>
            </name>
          </person-group>
          <article-title>The impact of land use and climate change on late Holocene and future suspended sediment yield of the Meuse catchment</article-title>
          <source>Geomorphology</source>
          <year>2008</year>
          <volume>103</volume>
          <fpage>389</fpage>
          <lpage>400</lpage>
        </citation>
      </ref>
      <ref id="B23-ijerph-10-00478">
        <label>23.</label>
        <citation citation-type="journal">
          <person-group person-group-type="author">
            <name>
              <surname>Borghuis</surname>
              <given-names>A.M.</given-names>
            </name>
            <name>
              <surname>Chang</surname>
              <given-names>K.</given-names>
            </name>
            <name>
              <surname>Lee</surname>
              <given-names>H.Y.</given-names>
            </name>
          </person-group>
          <article-title>Comparison between automated and manual mapping of typhoon-triggered landslides from SPOT-5 imagery</article-title>
          <source>Int. J. Remote Sens.</source>
          <year>2007</year>
          <volume>28</volume>
          <fpage>1843</fpage>
          <lpage>1856</lpage>
          <pub-id pub-id-type="doi">10.1080/01431160600935638</pub-id>
        </citation>
      </ref>
      <ref id="B24-ijerph-10-00478">
        <label>24.</label>
        <citation citation-type="journal">
          <person-group person-group-type="author">
            <name>
              <surname>Liu</surname>
              <given-names>C.C.</given-names>
            </name>
            <name>
              <surname>Shieh</surname>
              <given-names>C.L.</given-names>
            </name>
            <name>
              <surname>Lin</surname>
              <given-names>J.C.</given-names>
            </name>
            <name>
              <surname>Wu</surname>
              <given-names>A.M.</given-names>
            </name>
          </person-group>
          <article-title>Classification of non-vegetated areas using Formosat-2 high spatiotemporal imagery: The case of Tseng-Wen Reservoir catchment area (Taiwan)</article-title>
          <source>Int. J. Remote Sens.</source>
          <year>2011</year>
          <volume>32</volume>
          <fpage>8519</fpage>
          <lpage>8540</lpage>
          <pub-id pub-id-type="doi">10.1080/01431161.2010.542200</pub-id>
        </citation>
      </ref>
      <ref id="B25-ijerph-10-00478">
        <label>25.</label>
        <citation citation-type="journal">
          <person-group person-group-type="author">
            <name>
              <surname>Poor</surname>
              <given-names>C.J.</given-names>
            </name>
            <name>
              <surname>McDonnell</surname>
              <given-names>J.J.</given-names>
            </name>
          </person-group>
          <article-title>The effects of land use on stream nitrate dynamics</article-title>
          <source>J. Hydrol.</source>
          <year>2007</year>
          <volume>332</volume>
          <fpage>54</fpage>
          <lpage>68</lpage>
          <pub-id pub-id-type="doi">10.1016/j.jhydrol.2006.06.022</pub-id>
        </citation>
      </ref>
      <ref id="B26-ijerph-10-00478">
        <label>26.</label>
        <citation citation-type="web">
        <collab>Agriculture and Food Agency, Council of Agriculture, Executive Yuan, Taiwan</collab>
          
          
          <comment>Available online:<ext-link xmlns:xlink="http://www.w3.org/1999/xlink" xlink:href="http://www.afa.gov.tw/GrainStatistics_index.asp" ext-link-type="uri">http://www.afa.gov.tw/GrainStatistics_index.asp</ext-link></comment>
		  <access-date>(accessed on 22 September 2012)</access-date>
        </citation>
      </ref>
      <ref id="B27-ijerph-10-00478">
        <label>27.</label>
        <citation citation-type="journal">
          <person-group person-group-type="author">
            <name>
              <surname>Pekárová</surname>
              <given-names>P.</given-names>
            </name>
            <name>
              <surname>Pekár</surname>
              <given-names>J.</given-names>
            </name>
          </person-group>
          <article-title>The impact of land use on stream water quality in Slovakia</article-title>
          <source>J. Hydrol.</source>
          <year>1996</year>
          <volume>180</volume>
          <fpage>333</fpage>
          <lpage>350</lpage>
          <pub-id pub-id-type="doi">10.1016/0022-1694(95)02882-X</pub-id>
        </citation>
      </ref>
    </ref-list>
  </back>
</article>
