
The Feasibility of Two Handheld Spectrometers for Meat Speciation Combined with Chemometric Methods and Its Application for Halal Certification

 , ,
, ,  ,
,
Abstract
:
1. Introduction
2. Materials and Methods
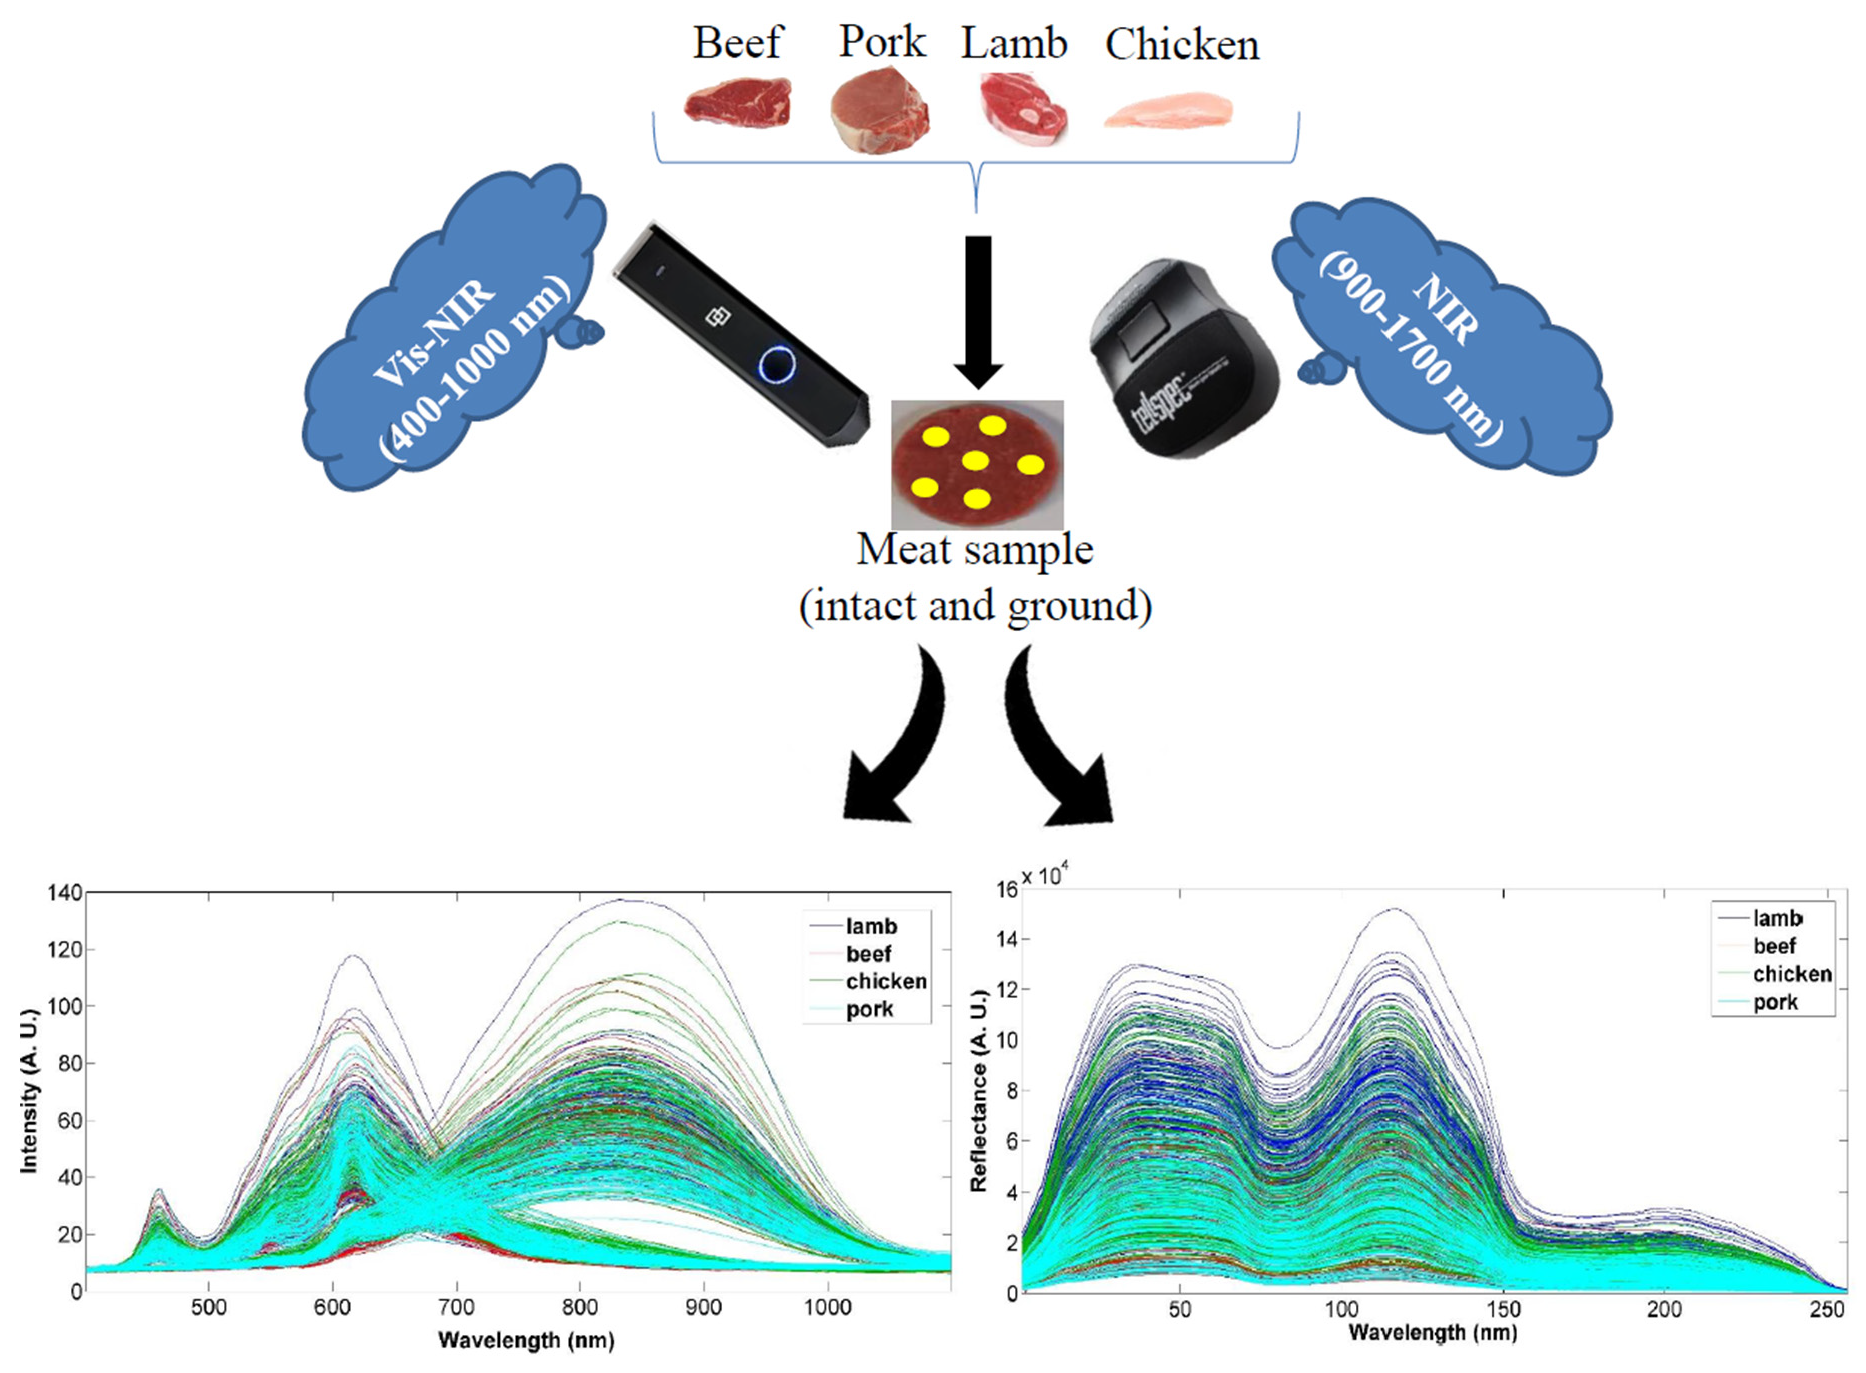
2.1. Sample Collection and Preparation
2.2. Data Acquisition
2.2.1. NIR
2.2.2. Vis-NIR
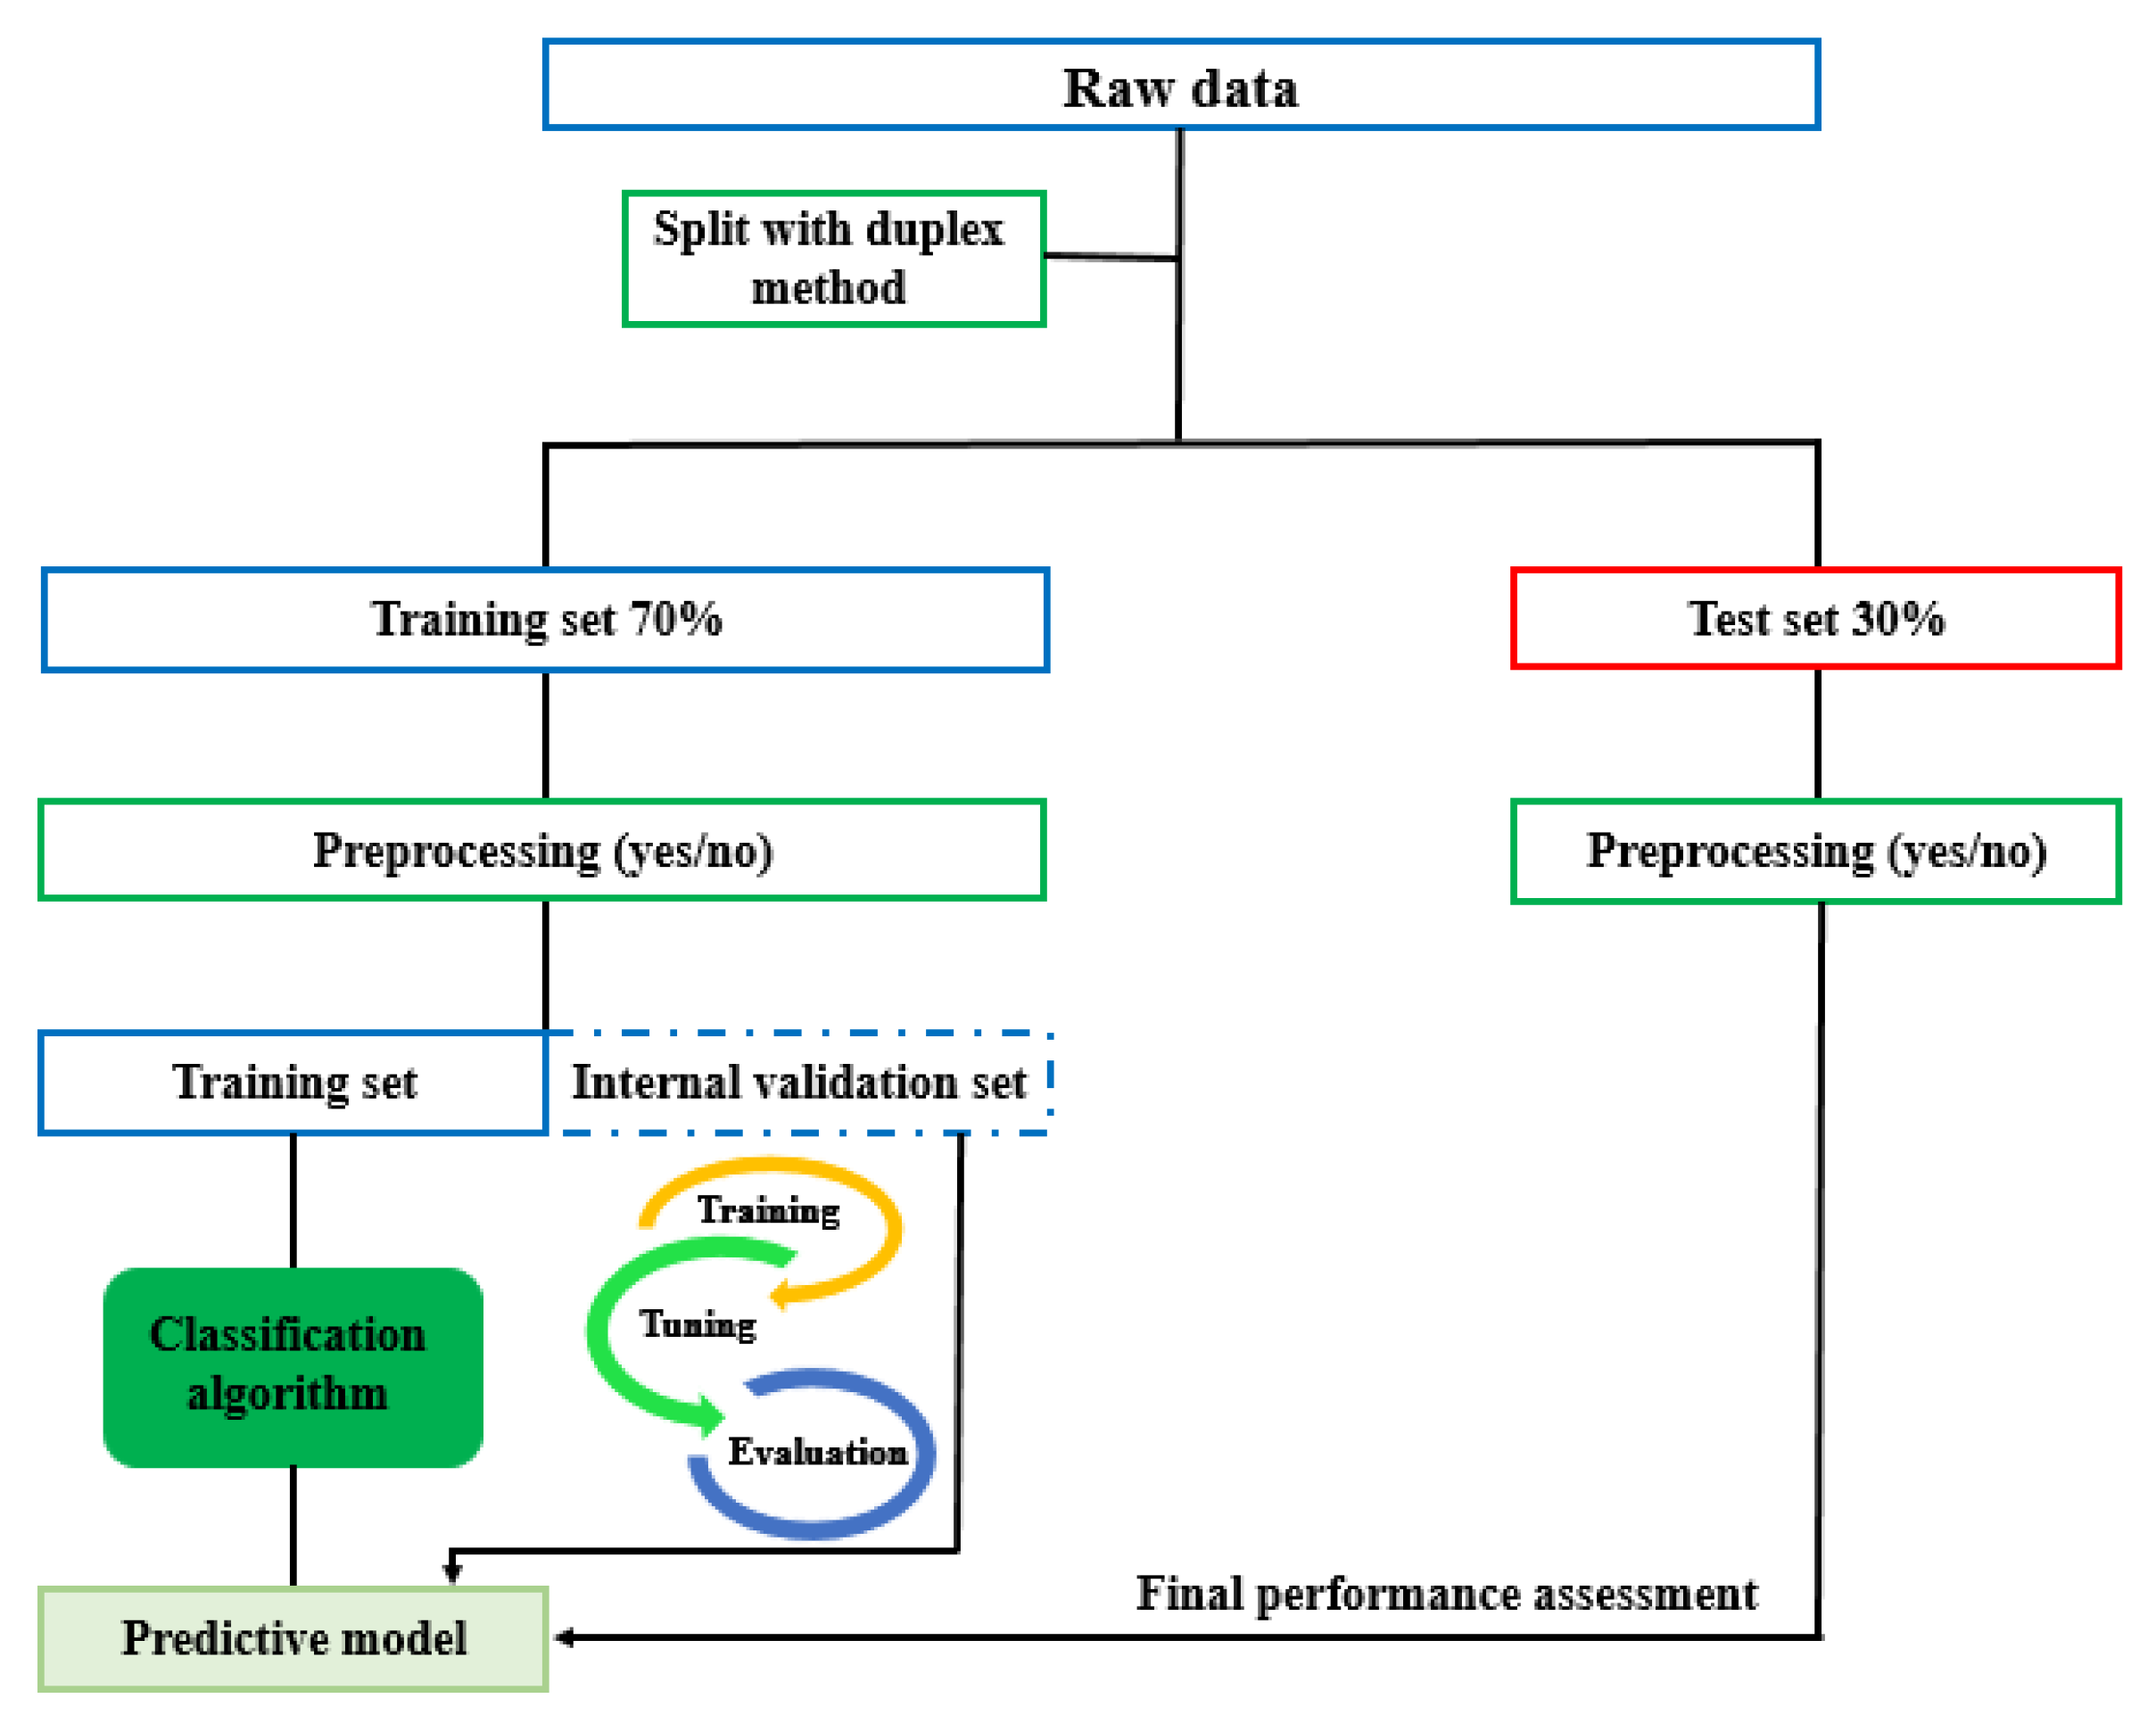
2.3. Data Analysis
2.3.1. OCC Approach
2.3.2. Discriminant Approach
3. Results and Discussion
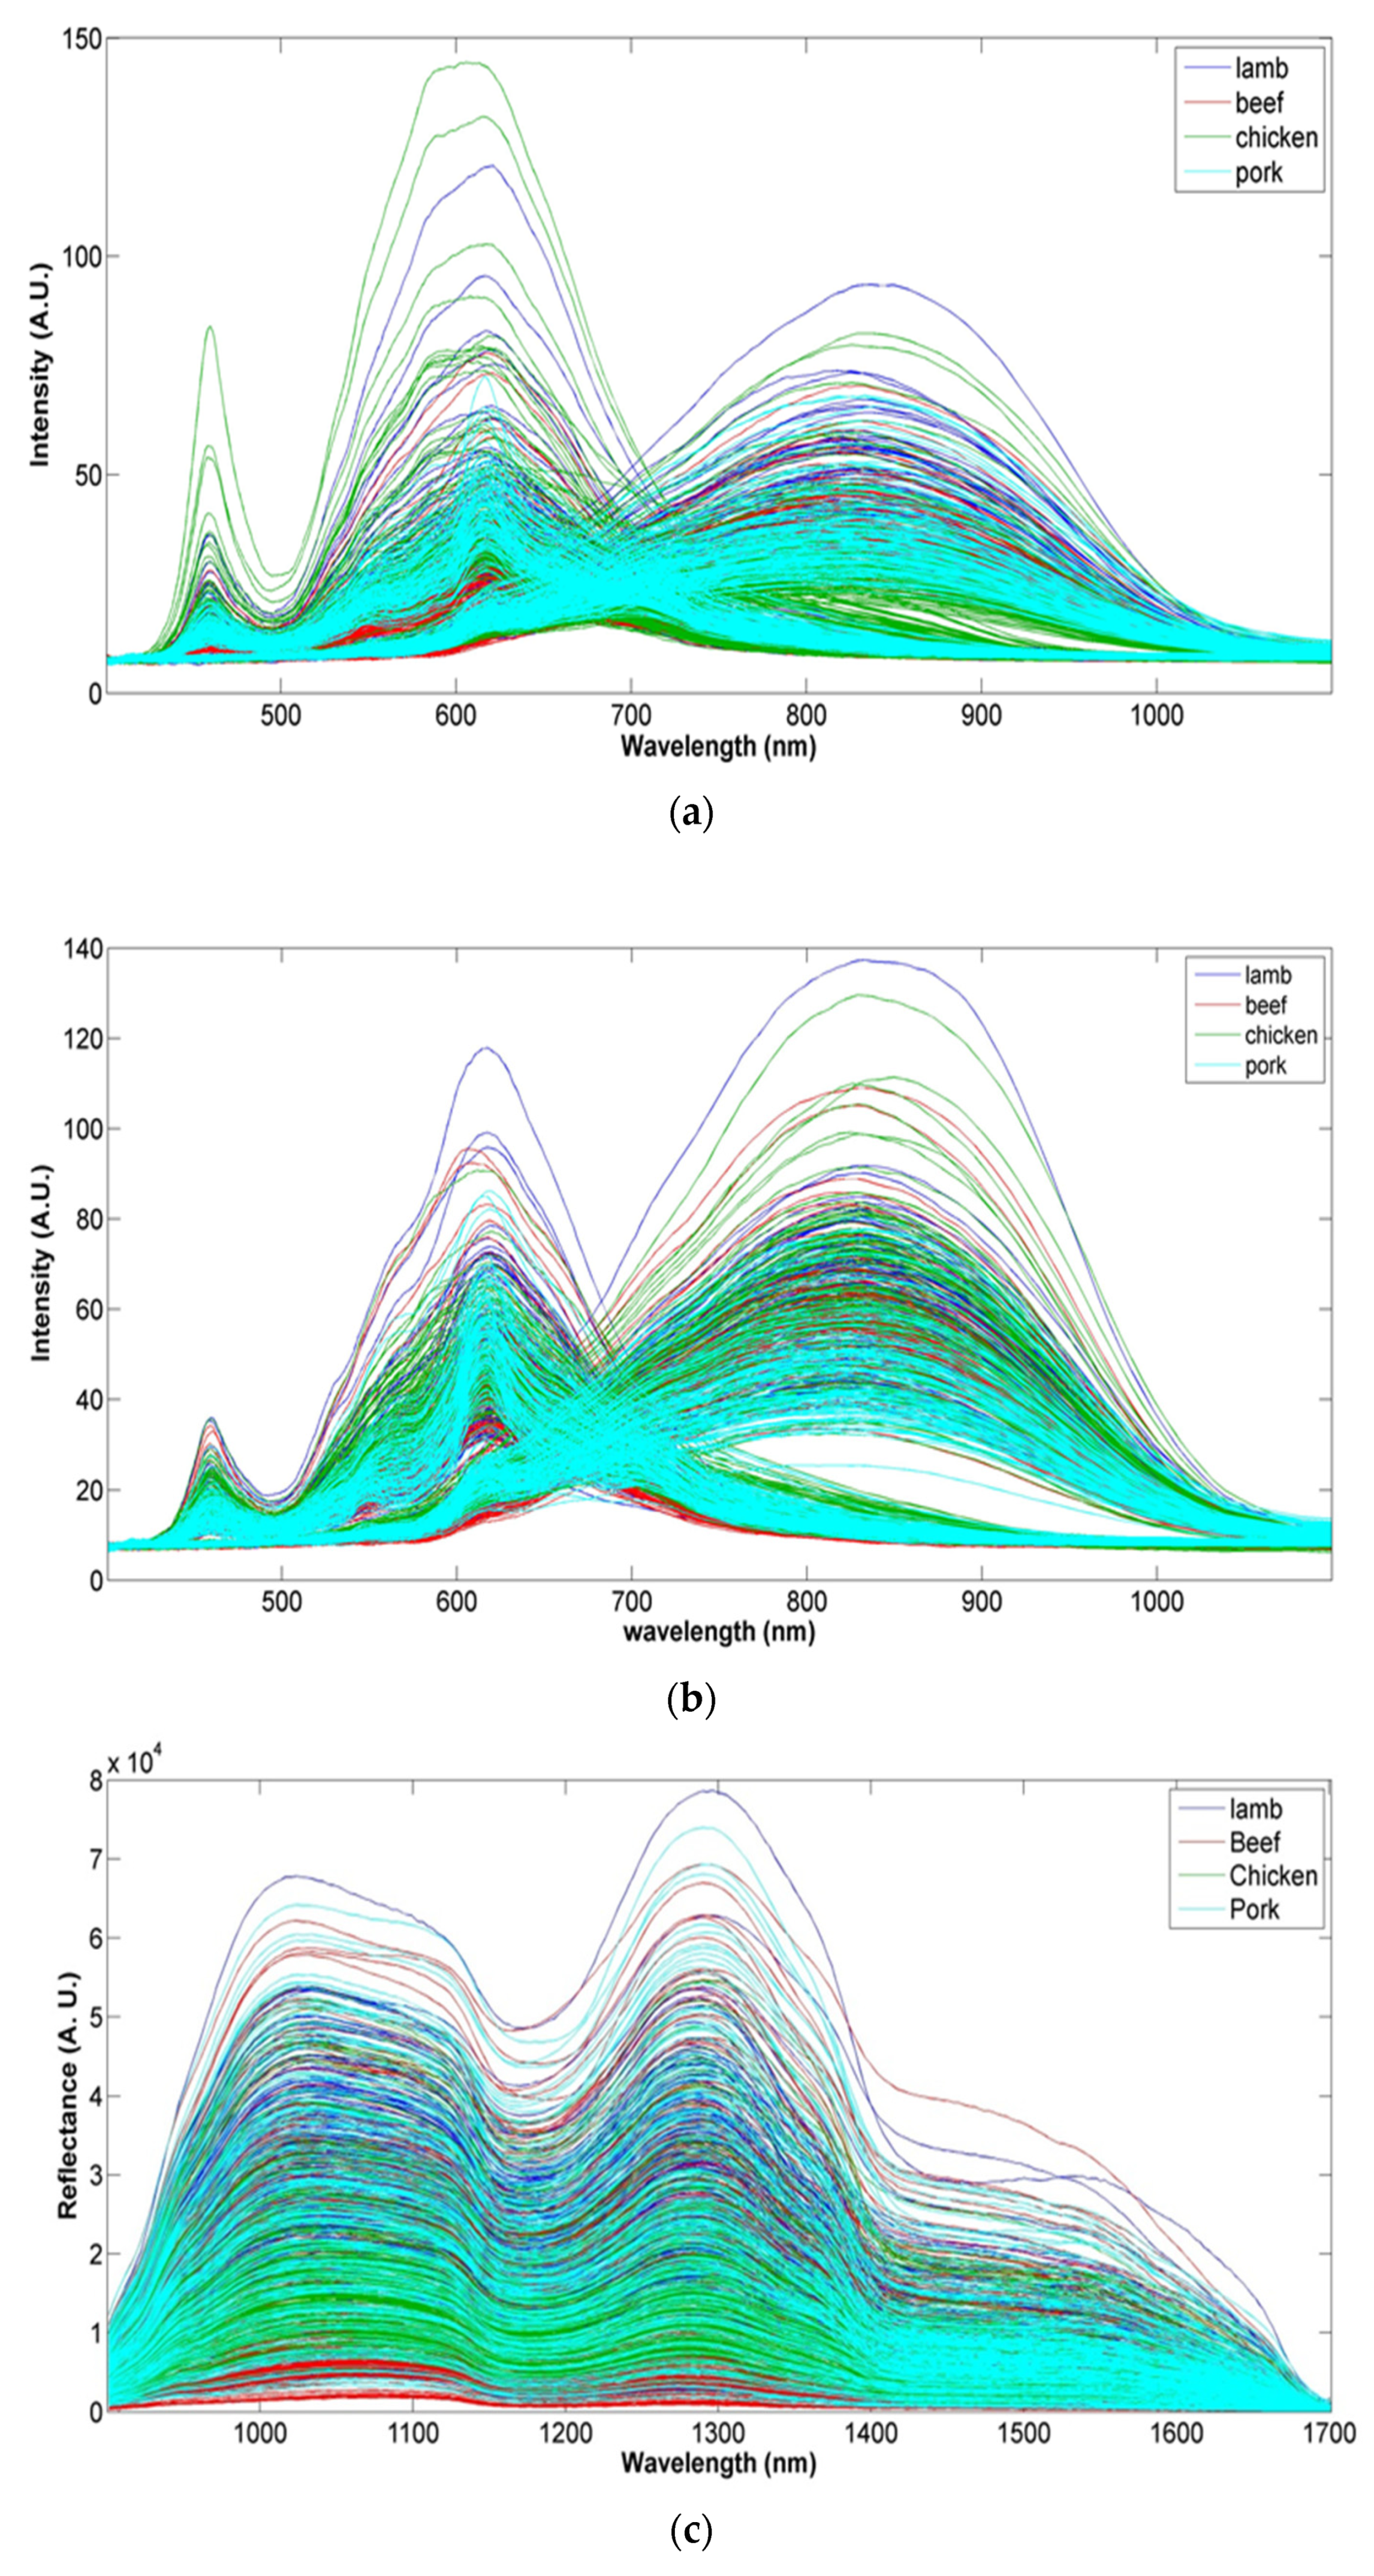
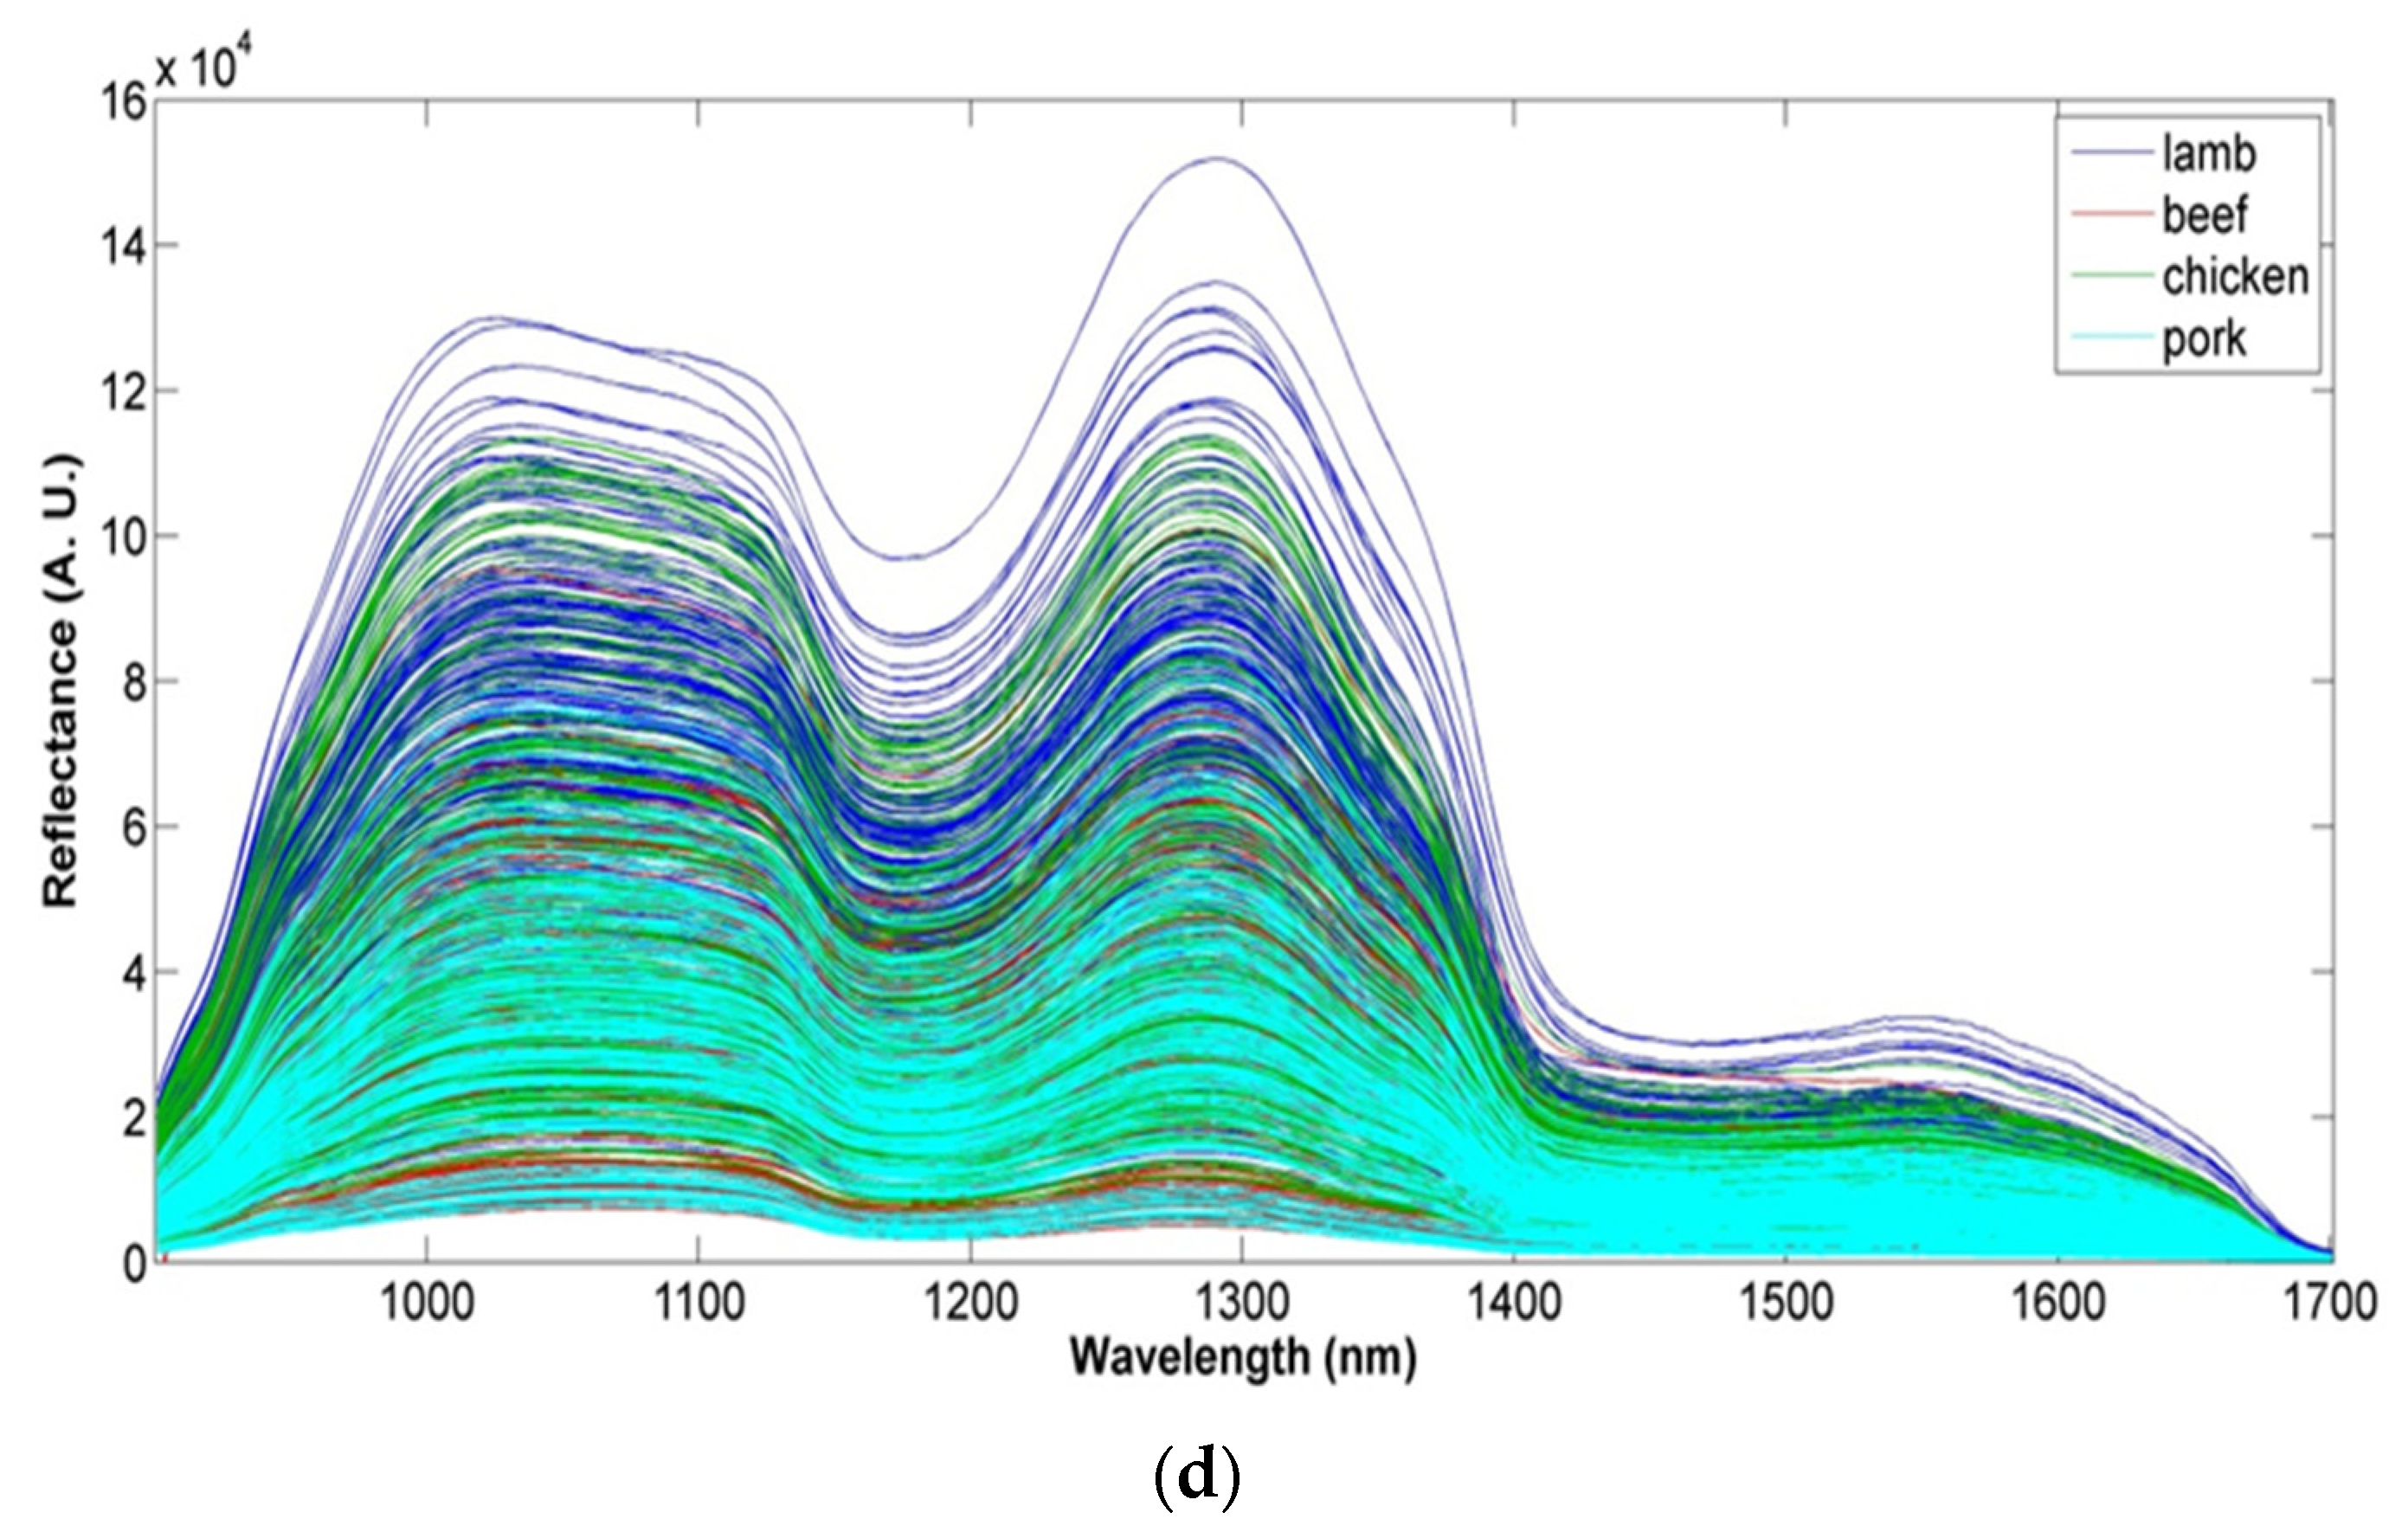
3.1. Intact and Ground Meat Spectra
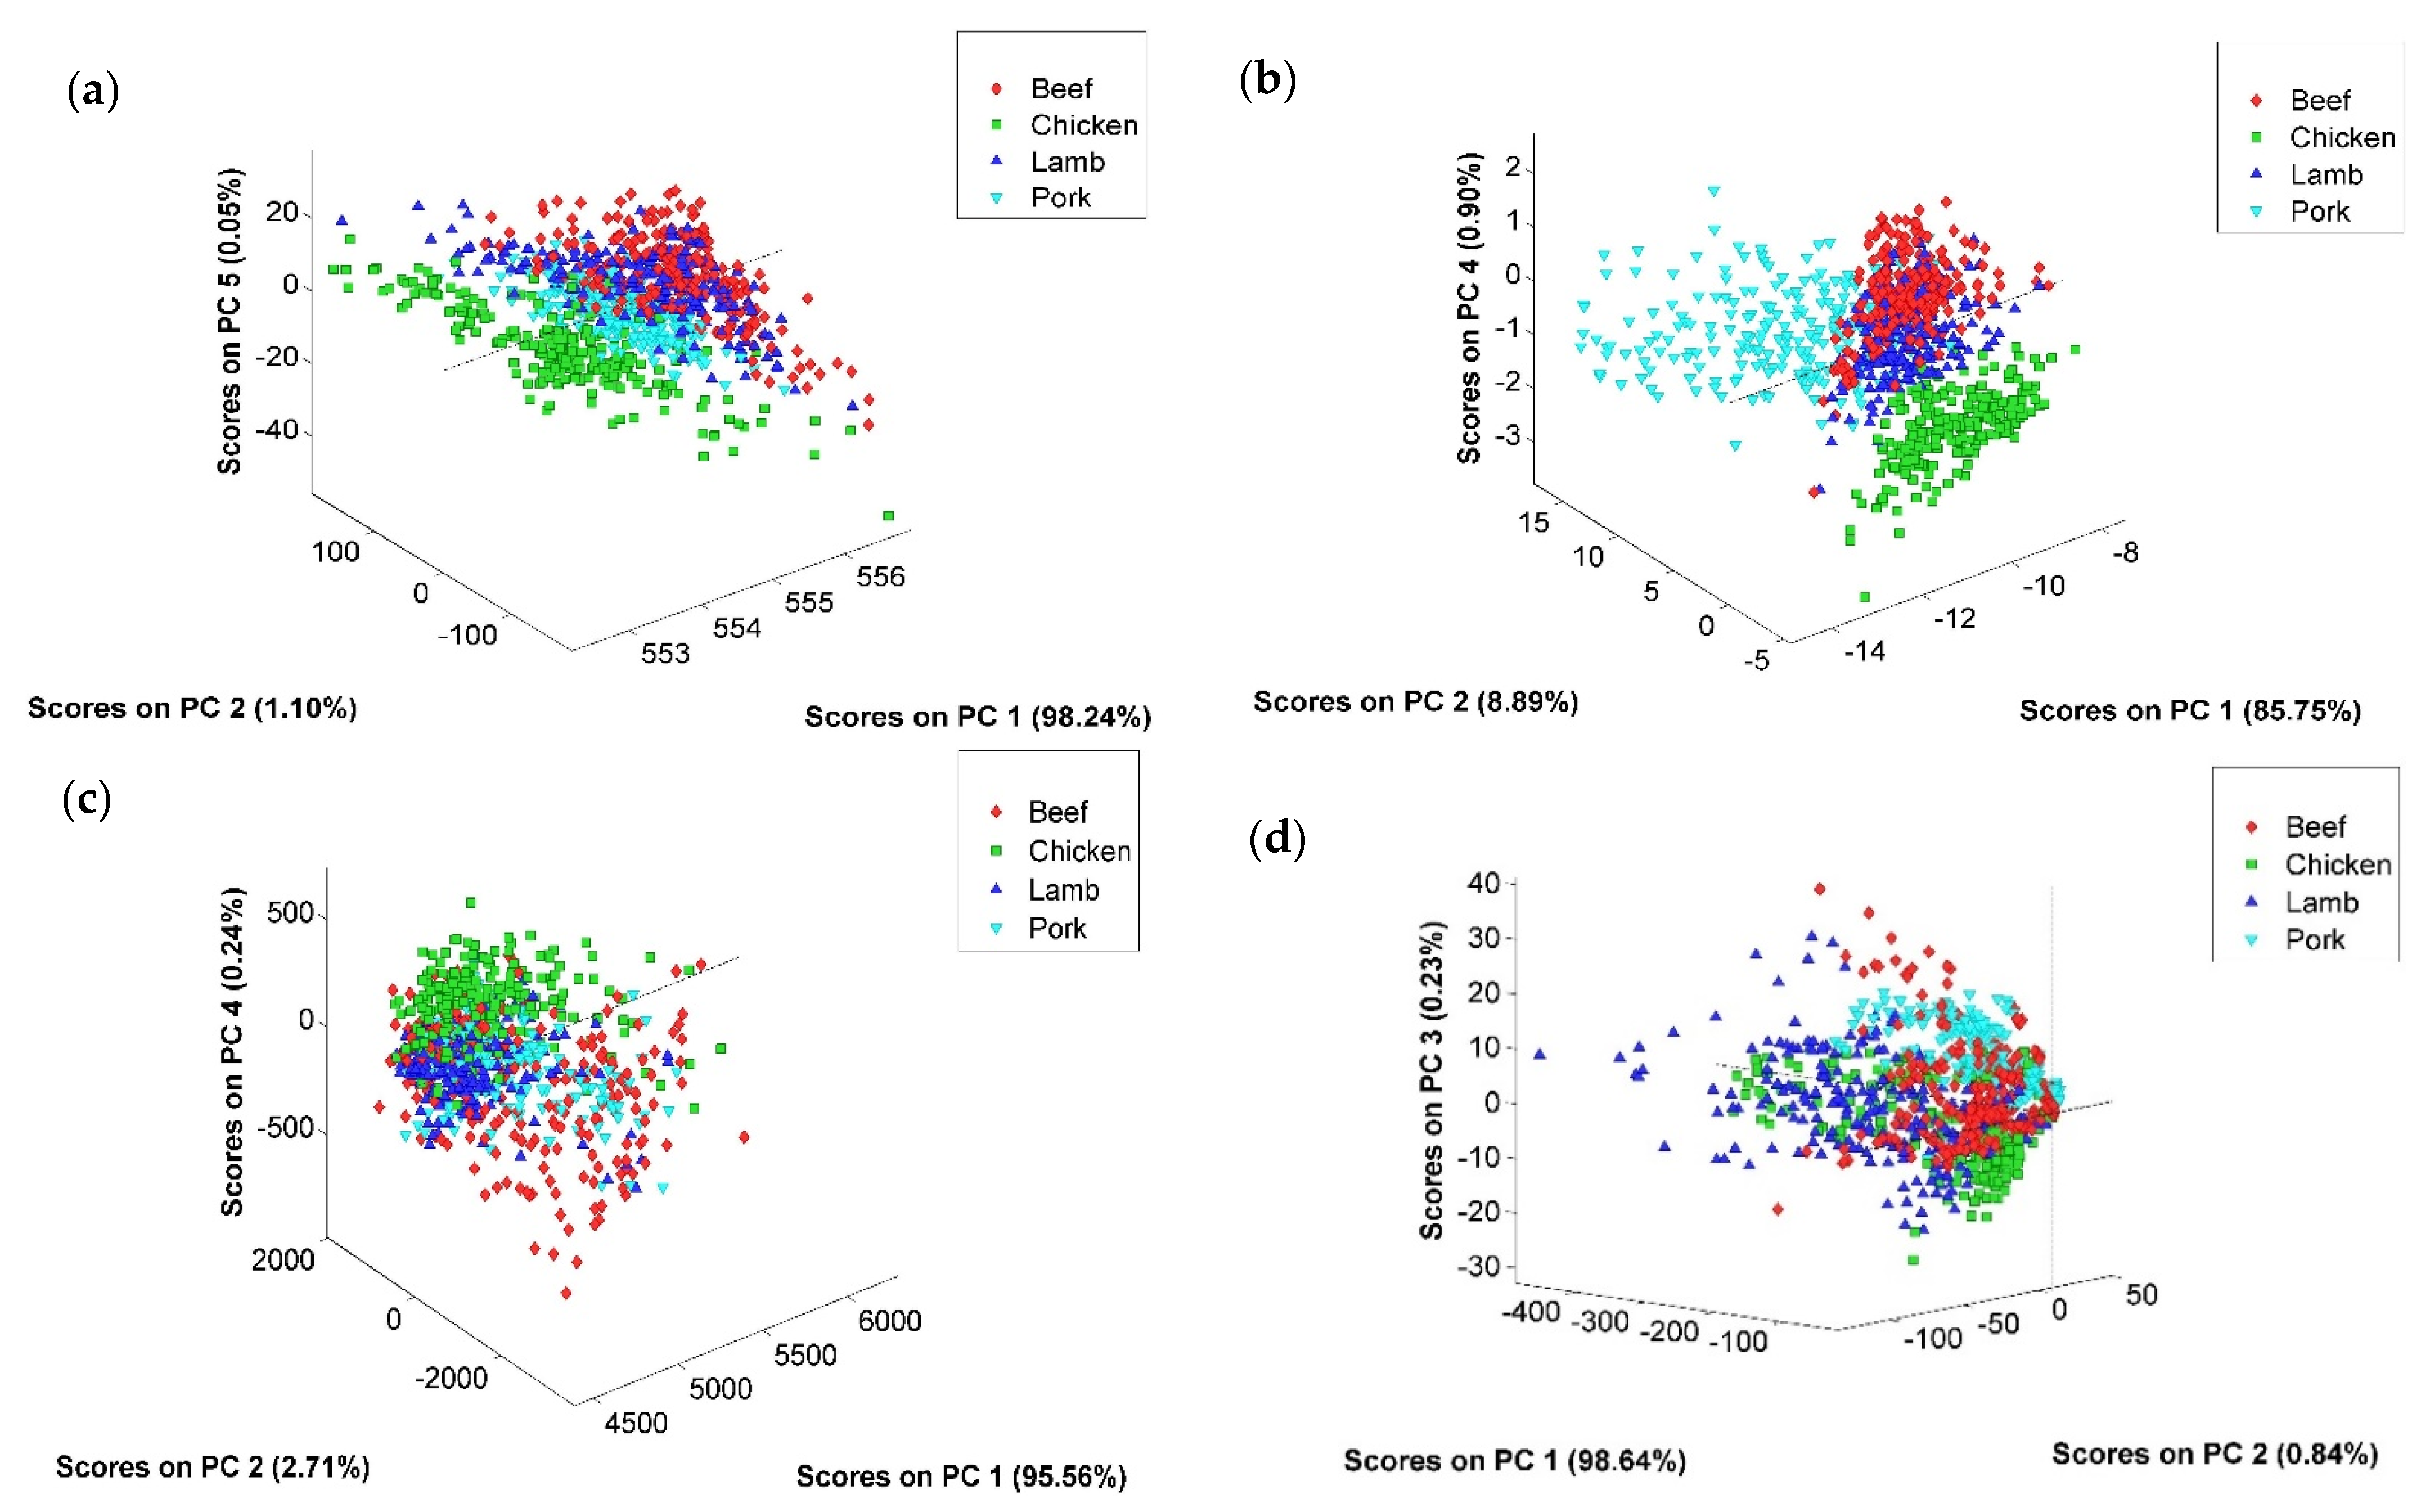
3.2. Exploratory Data Analysis Using PCA
3.3. OCC Approach
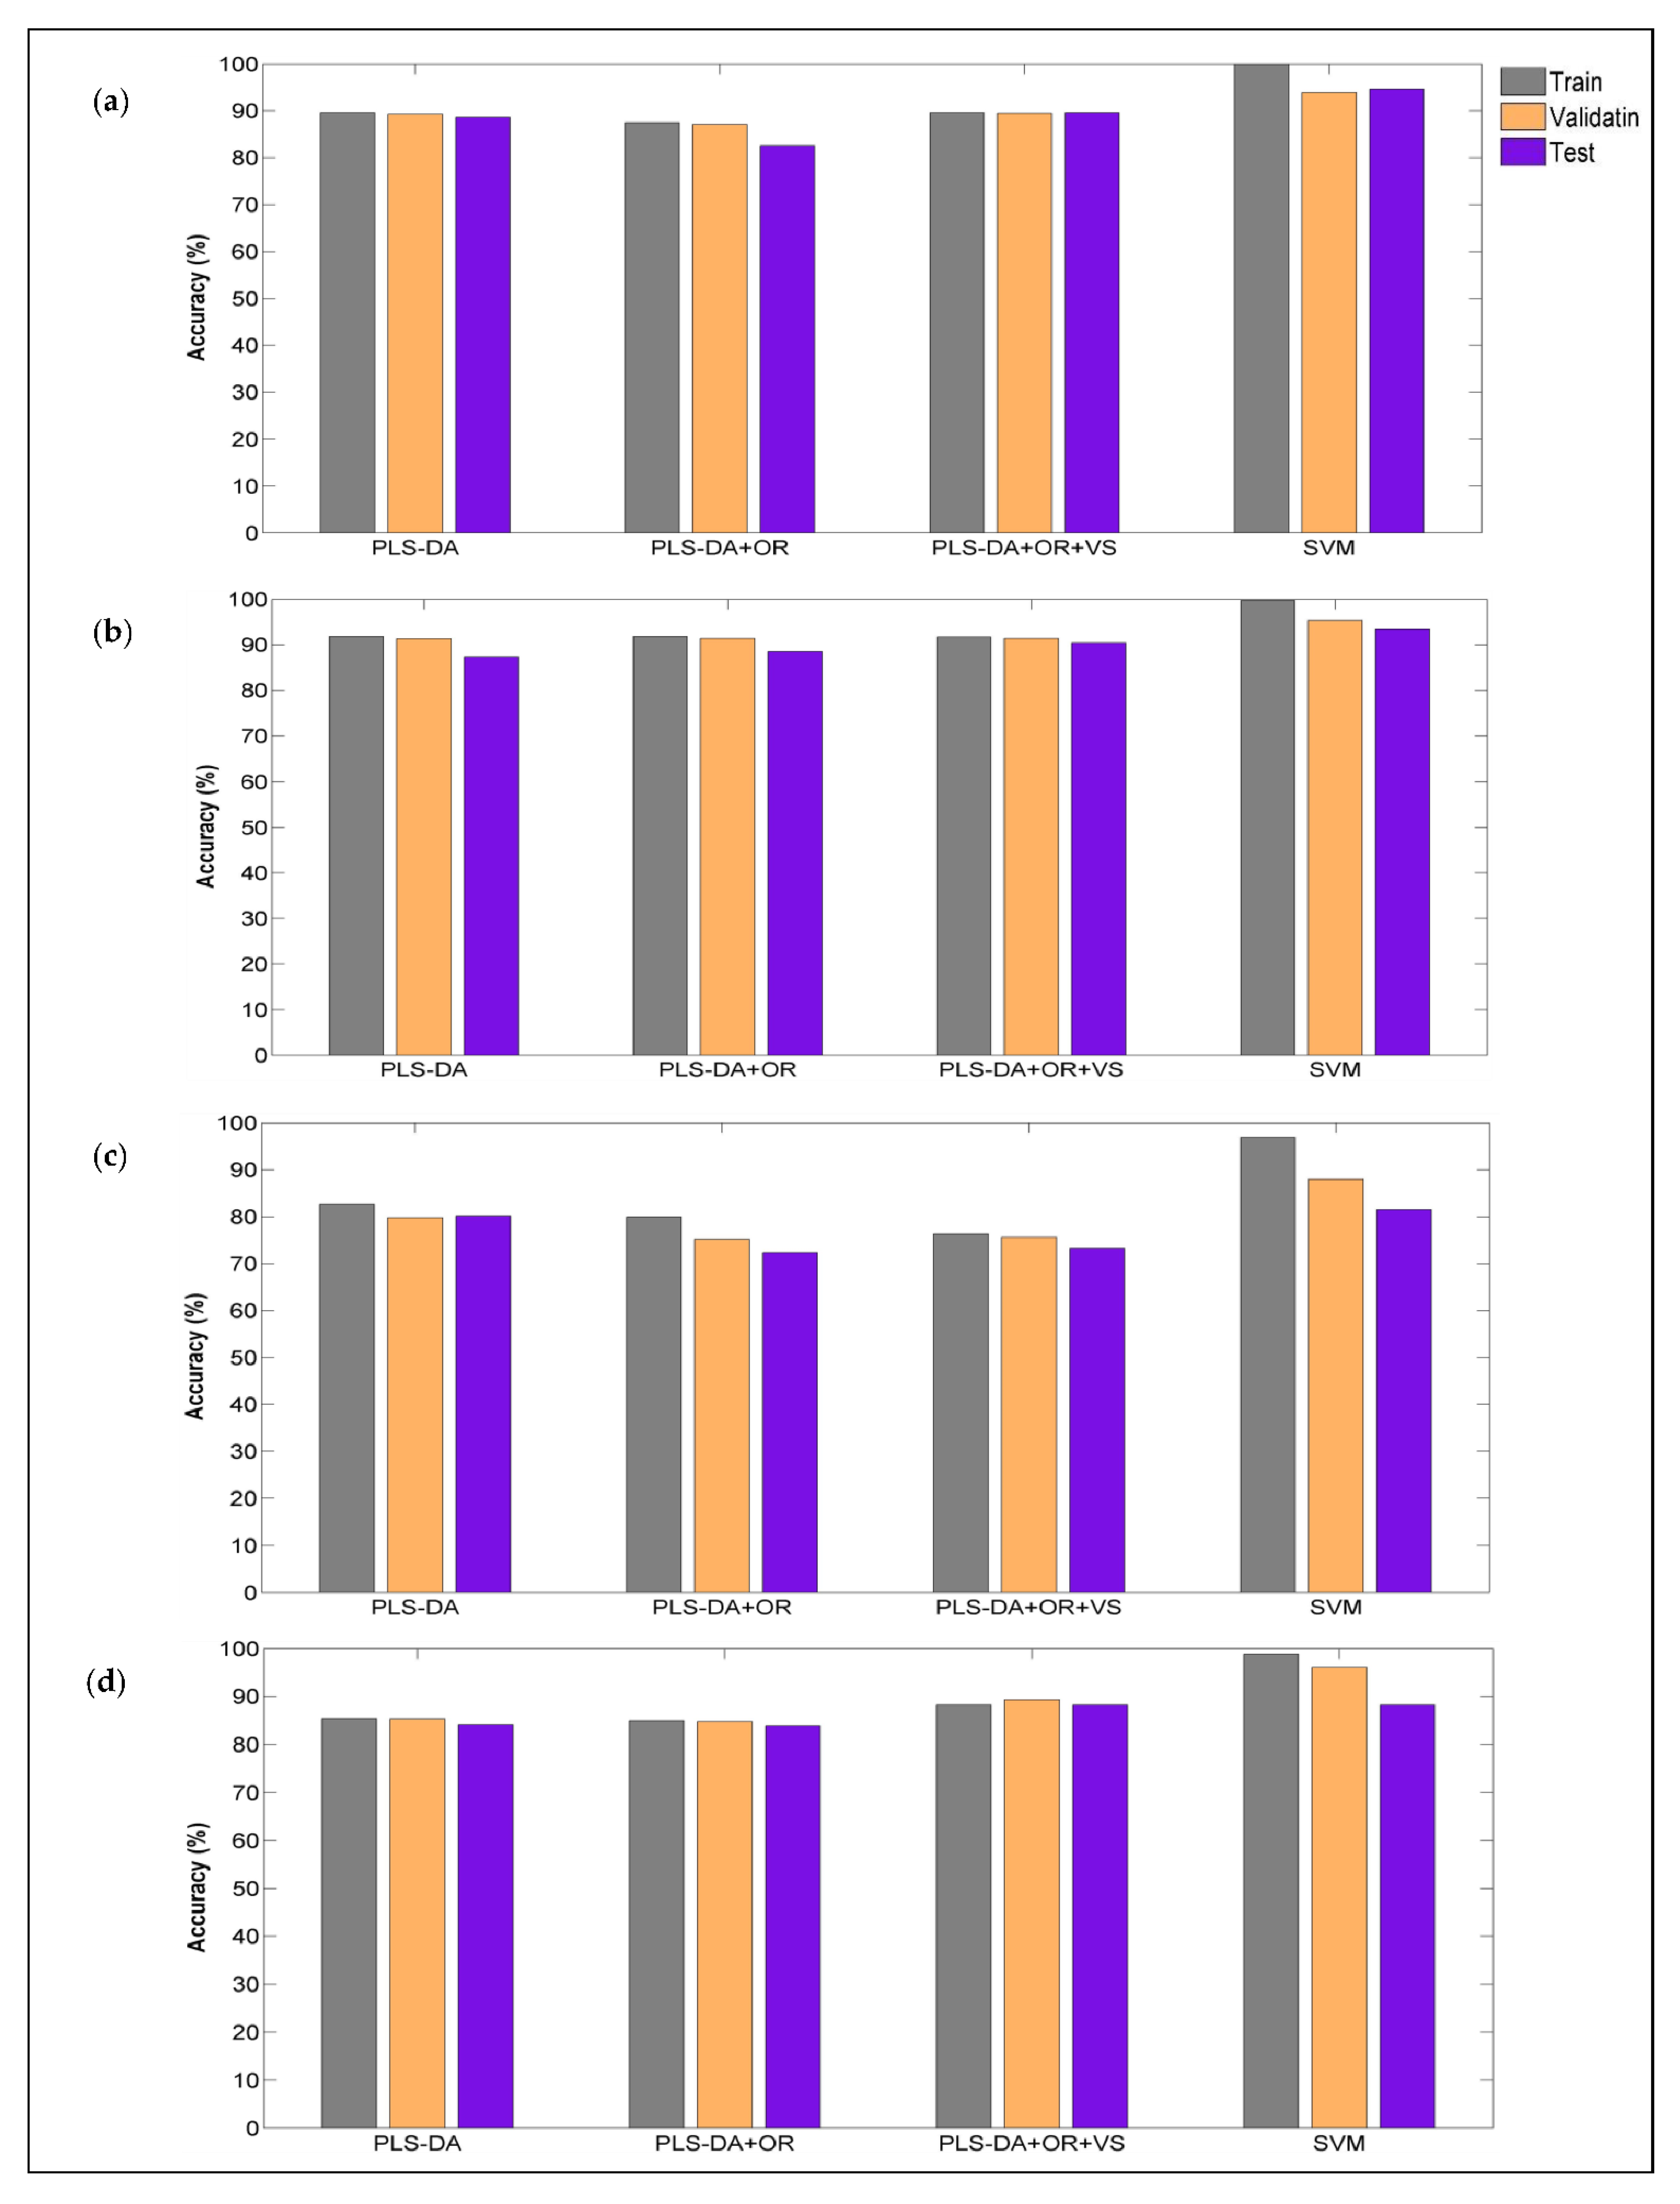
3.4. Discriminant Models
3.4.1. PLS-DA
3.4.2. SVM
4. Conclusions
Supplementary Materials
Author Contributions
Funding
Institutional Review Board Statement
Informed Consent Statement
Data Availability Statement
Acknowledgments
Conflicts of Interest
References
- Mendez, J.; Mendoza, L.; Cruz-Tirado, J.P.; Quevedo, R.; Siche, R. Trends in application of NIR and hyperspectral imaging for food authentication. Scientia Agropecuaria 2019, 10, 143–161. [Google Scholar] [CrossRef]
- Yang, L.; Wu, T.; Liu, Y.; Zou, J.; Huang, Y.; Babu, V.S.; Lin, L. Rapid identification of pork adulterated in the beef and mutton by infrared spectroscopy. J. Spectrosc. 2018, 2018, 2413874. [Google Scholar] [CrossRef]
- Regenstein, J.M.; Chaudry, M.M.; Regenstein, C.E. The kosher and halal food laws. Compr. Rev. Food Sci. Food Saf. 2003, 2, 111–127. [Google Scholar] [CrossRef] [PubMed]
- Pointing, J.; Teinaz, Y.; Shafi, S. Illegal labelling and sales of halal meat and food products. J. Crim. Law 2008, 72, 206–213. [Google Scholar] [CrossRef]
- Organisation of Islamic Cooperation (OIC)/Standards and Metrology Institute for the Islamic Countries (SMIIC), OIC/SMIIC 1:2019 General Requirements for Halal Food. Available online: https://www.smiic.org/en/project/24 (accessed on 19 November 2021).
- Ruslan, A.A.A.; Kamarulzaman, N.H.; Sanny, M. Muslim consumers’ awareness and perception of Halal food fraud. Int. Food Res. J. 2018, 25, S87–S96. [Google Scholar]
- McElwee, G.; Smith, R.; Lever, J. Illegal activity in the UK halal (sheep) supply chain: Towards greater understanding. Food Policy 2017, 69, 166–175. [Google Scholar] [CrossRef]
- Parastar, H.; van Kollenburg, G.; Weesepoel, Y.; van den Doel, A.; Buydens, L.; Jansen, J. Integration of handheld NIR and machine learning to “Measure & Monitor” chicken meat authenticity. Food Control 2020, 112, 107149. [Google Scholar] [CrossRef]
- Zia, Q.; Alawami, M.; Mokhtar, N.F.K.; Nhari, R.M.H.R.; Hanish, I. Current analytical methods for porcine identification in meat and meat products. Food Chem. 2020, 324, 126664. [Google Scholar] [CrossRef]
- Prieto, N.; Pawluczyk, O.; Dugan, M.E.R.; Aalhus, J.L. A review of the principles and applications of near-infrared spectroscopy to characterize meat, fat, and meat products. Appl. Spectrosc. 2017, 71, 1403–1426. [Google Scholar] [CrossRef] [Green Version]
- Yan, J.; van Stuijvenberg, L.; van Ruth, S.M. Handheld Near-Infrared Spectroscopy for Distinction of Extra Virgin Olive Oil from Other Olive Oil Grades Substantiated by Compositional Data. Eur. J. Lipid Sci. Technol. 2019, 121, 1900031. [Google Scholar] [CrossRef] [Green Version]
- Jahani, R.; Yazdanpanah, H.; Van Ruth, S.M.; Kobarfard, F.; Alewijn, M.; Mahboubi, A.; Faizi, M.; AliAbadi, M.H.S.; Salamzadeh, J. Novel application of near-infrared spectroscopy and chemometrics approach for detection of lime juice adulteration. Iran. J. Pharm. Res. IJPR 2020, 19, 34. [Google Scholar] [CrossRef]
- McVey, C.; Gordon, U.; Haughey, S.A.; Elliott, C.T. Assessment of the Analytical Performance of Three Near-Infrared Spectroscopy Instruments (Benchtop, Handheld and Portable) through the Investigation of Coriander Seed Authenticity. Foods 2021, 10, 956. [Google Scholar] [CrossRef]
- Patel, N.; Toledo-Alvarado, H.; Cecchinato, A.; Bittante, G. Predicting the Content of 20 Minerals in Beef by Different Portable Near-Infrared (NIR) Spectrometers. Foods 2020, 9, 1389. [Google Scholar] [CrossRef]
- Teye, E.; Elliott, C.; Sam-Amoah, L.K.; Mingle, C. Rapid and nondestructive fraud detection of palm oil adulteration with Sudan dyes using portable NIR spectroscopic techniques. Food Addit. Contam. Part A 2019, 36, 1589–1596. [Google Scholar] [CrossRef]
- Basri, K.N.; Hussain, M.N.; Bakar, J.; Sharif, Z.; Khir, M.F.A.; Zoolfakar, A.S. Classification and quantification of palm oil adulteration via portable NIR spectroscopy. Spectrochim. Acta Part A Mol. Biomol. Spectrosc. 2017, 173, 335–342. [Google Scholar] [CrossRef] [PubMed]
- McVey, C.; McGrath, T.F.; Haughey, S.A.; Elliott, C.T. A rapid food chain approach for authenticity screening: The development, validation and transferability of a chemometric model using two handheld near infrared spectroscopy (NIRS) devices. Talanta 2021, 222, 121533. [Google Scholar] [CrossRef] [PubMed]
- Guelpa, A.; Marini, F.; du Plessis, A.; Slabbert, R.; Manley, M. Verification of authenticity and fraud detection in South African honey using NIR spectroscopy. Food Control. 2017, 73, 1388–1396. [Google Scholar] [CrossRef]
- Weesepoel, Y.; Alewijn, M.; Wijtten, M.; Müller-Maatsch, J. Detecting food fraud in extra virgin olive oil using a prototype portable hyphenated photonics sensor. J. AOAC Int. 2021, 104, 7–15. [Google Scholar] [CrossRef] [PubMed]
- Nolasco-Perez, I.M.; Rocco, L.A.C.M.; Cruz-Tirado, J.P.; Pollonio, M.A.R.; Barbon, S.; Barbon, A.P.A.C.; Barbin, D.F. Comparison of rapid techniques for classification of ground meat. Biosyst. Eng. 2019, 183, 151–159. [Google Scholar] [CrossRef]
- Georgiou, C.A.; Danezis, G.P. Food Authentication: Management, Analysis and Regulation; John Wiley & Sons: Hoboken, NJ, USA, 2017; ISBN 1118810260. [Google Scholar]
- Oliveri, P.; Malegori, C.; Casale, M. Chemometrics and Statistics|Multivariate Classification Techniques. In Chemical Analysis of Food: Techniques and Applications; Academic Press: Cambridge, MA, USA, 2019. [Google Scholar] [CrossRef]
- Rodionova, O.Y.; Titova, A.V.; Pomerantsev, A.L. Discriminant analysis is an inappropriate method of authentication. TrAC Trends Anal. Chem. 2016, 78, 17–22. [Google Scholar] [CrossRef]
- Oliveri, P.; Downey, G. Discriminant and class-modelling chemometric techniques for food PDO verification. In Comprehensive Analytical Chemistry; Elsevier: Amsterdam, The Netherlands, 2013; Volume 60, pp. 317–338. ISBN 0166-526X. [Google Scholar] [CrossRef]
- Commission, C.A. General guidelines for the use of the term “HALAL”. In Proceedings of the 22nd Session of the Codex Alimentarius Commission, Geneva, Switzerland, 23–28 June 1997. [Google Scholar]
- Prieto, N.; Roehe, R.; Lavín, P.; Batten, G.; Andrés, S. Application of near infrared reflectance spectroscopy to predict meat and meat products quality: A review. Meat Sci. 2009, 83, 175–186. [Google Scholar] [CrossRef] [PubMed]
- Prieto, N.; Andrés, S.; Giráldez, F.J.; Mantecón, A.R.; Lavín, P. Ability of near infrared reflectance spectroscopy (NIRS) to estimate physical parameters of adult steers (oxen) and young cattle meat samples. Meat Sci. 2008, 79, 692–699. [Google Scholar] [CrossRef] [PubMed]
- Moon, E.J.; Kim, Y.; Xu, Y.; Na, Y.; Giaccia, A.J.; Lee, J.H. Evaluation of Salmon, Tuna, and Beef Freshness Using a Portable Spectrometer. Sensors 2020, 20, 4299. [Google Scholar] [CrossRef] [PubMed]
- Puzyn, T.; Mostrag-Szlichtyng, A.; Gajewicz, A.; Skrzyński, M.; Worth, A.P. Investigating the influence of data splitting on the predictive ability of QSAR/QSPR models. Struct. Chem. 2011, 22, 795–804. [Google Scholar] [CrossRef] [Green Version]
- López-Maestresalas, A.; Insausti, K.; Jarén, C.; Pérez-Roncal, C.; Urrutia, O.; Beriain, M.J.; Arazuri, S. Detection of minced lamb and beef fraud using NIR spectroscopy. Food Control 2019, 98, 465–473. [Google Scholar] [CrossRef]
- Rinnan, Å.; Van Den Berg, F.; Engelsen, S.B. Review of the most common pre-processing techniques for near-infrared spectra. TrAC Trends Anal. Chem. 2009, 28, 1201–1222. [Google Scholar] [CrossRef]
- NIR Spectroscopy Monograph: A Guide to Near-Infrared Spectroscopic Analysis of Industrial Manufacturing Processes; Metrohm Ltd.: Herisau, Switzerland, 2002.
- Ballabio, D.; Consonni, V. Classification tools in chemistry. Part 1: Linear models. PLS-DA. Anal. Methods 2013, 5, 3790–3798. [Google Scholar] [CrossRef]
- Chiesa, L.; Panseri, S.; Bonacci, S.; Procopio, A.; Zecconi, A.; Arioli, F.; Cuevas, F.J.; Moreno-Rojas, J.M. Authentication of Italian PDO lard using NIR spectroscopy, volatile profile and fatty acid composition combined with chemometrics. Food Chem. 2016, 212, 296–304. [Google Scholar] [CrossRef]
- Müller-Maatsch, J.; Alewijn, M.; Wijtten, M.; Weesepoel, Y. Detecting fraudulent additions in skimmed milk powder using a portable, hyphenated, optical multi-sensor approach in combination with one-class classification. Food Control 2021, 121, 107744. [Google Scholar] [CrossRef]
- Callao, M.P.; Ruisánchez, I. An overview of multivariate qualitative methods for food fraud detection. Food Control 2018, 86, 283–293. [Google Scholar] [CrossRef]
- Andersen, C.M.; Bro, R. Variable selection in regression—A tutorial. J. Chemom. 2010, 24, 728–737. [Google Scholar] [CrossRef]
- Hsu, C.-W.; Chang, C.-C.; Lin, C.-J. A Practical Guide to Support Vector Classification; University of National Taiwan: Taipei, Taiwan, 2003. [Google Scholar]
- Chapelle, O.; Vapnik, V.; Bousquet, O.; Mukherjee, S. Choosing multiple parameters for support vector machines. Mach. Learn. 2002, 46, 131–159. [Google Scholar] [CrossRef]
- Devos, O.; Ruckebusch, C.; Durand, A.; Duponchel, L.; Huvenne, J.-P. Support vector machines (SVM) in near infrared (NIR) spectroscopy: Focus on parameters optimization and model interpretation. Chemom. Intell. Lab. Syst. 2009, 96, 27–33. [Google Scholar] [CrossRef]
- Tharwat, A. Classification assessment methods. Appl. Comput. Inform. 2018, 17, 168–192. [Google Scholar] [CrossRef]
- Alamprese, C.; Casale, M.; Sinelli, N.; Lanteri, S.; Casiraghi, E. Detection of minced beef adulteration with turkey meat by UV–vis, NIR and MIR spectroscopy. LWT-Food Sci. Technol. 2013, 53, 225–232. [Google Scholar] [CrossRef]
- Cozzolino, D.; Murray, I. Identification of animal meat muscles by visible and near infrared reflectance spectroscopy. LWT-Food Sci. Technol. 2004, 37, 447–452. [Google Scholar] [CrossRef]
- Workman, J., Jr.; Weyer, L. Practical Guide and Spectral Atlas for Interpretive Near-Infrared Spectroscopy; CRC Press: Boca Raton, FL, USA, 2012; ISBN 1439875251. [Google Scholar]
- Grassi, S.; Casiraghi, E.; Alamprese, C. Handheld NIR device: A non-targeted approach to assess authenticity of fish fillets and patties. Food Chem. 2018, 243, 382–388. [Google Scholar] [CrossRef]
- Edwards, K.; Manley, M.; Hoffman, L.C.; Beganovic, A.; Kirchler, C.G.; Huck, C.W.; Williams, P.J. Differentiation of South African game meat using near-infrared (NIR) spectroscopy and hierarchical modelling. Molecules 2020, 25, 1845. [Google Scholar] [CrossRef]
- Müller-Maatsch, J.T.L.; Weesepoel, Y.J.A.; Roetgerink, E.A.M.; Wijtten, A.M.; Alewijn, M. Are low-cost, hand-held NIR sensors suitable to detect adulterations of halal meat? In Proceedings of the OCM 2021—Optical Characterization of Materials, Karlsruhe, Germany, 17–18 March 2021; KIT Publishers: Amsterdam, The Netherlands, 2021; pp. 1–10. [Google Scholar] [CrossRef]
- Schmutzler, M.; Beganovic, A.; Böhler, G.; Huck, C.W. Methods for detection of pork adulteration in veal product based on FT-NIR spectroscopy for laboratory, industrial and on-site analysis. Food Control 2015, 57, 258–267. [Google Scholar] [CrossRef]
- Mamani-Linares, L.W.; Gallo, C.; Alomar, D. Identification of cattle, llama and horse meat by near infrared reflectance or transflectance spectroscopy. Meat Sci. 2012, 90, 378–385. [Google Scholar] [CrossRef]
- Restaino, E.; Fassio, A.; Cozzolino, D. Discrimination of meat patés according to the animal species by means of near infrared spectroscopy and chemometrics Discriminación de muestras de paté de carne según tipo de especie mediante el uso de la espectroscopia en el infrarrojo cercano y la quimi. CyTA-J. Food 2011, 9, 210–213. [Google Scholar] [CrossRef] [Green Version]
- Moran, L.; Andres, S.; Allen, P.; Moloney, A.P. Visible and near infrared spectroscopy as an authentication tool: Preliminary investigation of the prediction of the ageing time of beef steaks. Meat Sci. 2018, 142, 52–58. [Google Scholar] [CrossRef]
- Westad, F.; Marini, F. Validation of chemometric models—A tutorial. Anal. Chim. Acta 2015, 893, 14–24. [Google Scholar] [CrossRef]


| Model | Pre-Processing | Algorithm | AUROC | |||||||
|---|---|---|---|---|---|---|---|---|---|---|
| SNV | Derivative | Subset | DWT | Pork vs. lamb | Pork vs. beef | Pork vs. chicken | Pork vs. all | |||
| Intact | 1 | - | 1st | 3rd | - | SIMCA (3 PCs) | 0.61 | 0.53 | 0.51 | 0.55 |
| 2 | DT | - | 2nd | - | OCSVM | 0.59 | 0.79 | 0.82 | 0.73 | |
| 3 | SNV | - | 3rd | - | PCA residual (3PCs) | 0.54 | 0.75 | 0.82 | 0.70 | |
| Ground | 1 | - | 1st | 3rd | - | SIMCA (3 PCs) | 0.93 | 0.73 | 0.84 | 0.83 |
| 2 | SNV | - | (full) | la8 (3–5) | OCSVM | 0.80 | 0.85 | 0.78 | 0.81 | |
| 3 | - | 1st | 4th | - | OCSVM | 0.89 | 0.70 | 0.94 | 0.83 | |
| Model | Pre-Processing | Algorithm | AUROC | |||||||
|---|---|---|---|---|---|---|---|---|---|---|
| SNV | Derivative | Subset | DWT | Pork vs. lamb | Pork vs. beef | Pork vs. chicken | Pork vs. all | |||
| Intact | 1 | - | 1st | 2nd | - | OCSVM | 0.95 | 0.98 | 0.93 | 0.95 |
| 2 | DT | - | 4th | - | SIMCA (3 PCs) | 0.93 | 0.95 | 0.99 | 0.96 | |
| 3 | SNV | - | (full) | la8 (3–5) | SIMCA (3 PCs) | 0.93 | 0.93 | 0.98 | 0.95 | |
| Ground | 1 | - | 1st | (full) | - | kNN (2 PCs) | 0.97 | 0.98 | 0.98 | 0.98 |
| 2 | - | 1st | 4th | - | PCA residual (3 PCs) | 0.96 | 0.98 | 0.96 | 0.97 | |
| 3 | - | 1st | (full) | - | SIMCA (3 PCs) | 0.96 | 0.98 | 0.98 | 0.97 | |
| VIS-NIR | NIR | |||||||
|---|---|---|---|---|---|---|---|---|
| Intact Meat | Ground Meat | Intact Meat | Ground Meat | |||||
| Scenario | 1 | 2 | 1 | 2 | 1 | 2 | 1 | 2 |
| Pork | 100 | 98 | 100 | 98 | 100 | 79 | 100 | 79 |
| Lamb | 97 | 100 | 97 | 100 | 27 | 44 | 73 | 95 |
| Beef | 100 | 100 | 100 | 100 | 51 | 73 | 42 | 75 |
| Chicken | 100 | 100 | 95 | 100 | 53 | 85 | 75 | 88 |
| Intact Meat 2 | Ground Meat 3 | |||||||
|---|---|---|---|---|---|---|---|---|
| Train | CV | Test | Train | CV | Test | |||
| Lamb | Sensitivity | 96.4 | 80.9 | 70.5 | 94.4 | 87.6 | 80.9 | |
| Specificity | 95.6 | 87.4 | 87.2 | 99.8 | 97.4 | 90.2 | ||
| Accuracy | 96.0 | 84.0 | 78.4 | 97.0 | 92.3 | 85.4 | ||
| Error | 4.0 | 16.0 | 21.6 | 3.0 | 7.7 | 14.6 | ||
| Beef | Sensitivity | 96.4 | 81.5 | 64.1 | 99.5 | 96.7 | 86.1 | |
| Specificity | 99.3 | 94.6 | 93.6 | 98.0 | 96.5 | 94.7 | ||
| Accuracy | 97.8 | 87.8 | 77.4 | 98.7 | 96.6 | 90.3 | ||
| Error | 2.2 | 12.2 | 22.6 | 1.3 | 3.3 | 9.7 | ||
| Chicken | Sensitivity | 98.2 | 89.2 | 84.7 | 100.0 | 95.1 | 81.2 | |
| Specificity | 99.5 | 96.7 | 91.9 | 99.8 | 99.0 | 94.6 | ||
| Accuracy | 98.8 | 92.8 | 88.2 | 99.9 | 97.0 | 87.6 | ||
| Error | 1.2 | 7.2 | 11.8 | 0.1 | 3.0 | 12.4 | ||
| Pork | Sensitivity | 91.2 | 78.5 | 74.0 | 99.3 | 97.4 | 83.3 | |
| Specificity | 99.6 | 98.0 | 91.2 | 100.0 | 99.2 | 96.8 | ||
| Accuracy | 95.3 | 87.7 | 82.1 | 99.6 | 98.3 | 89.8 | ||
| Error | 4.7 | 12.3 | 17.9 | 0.4 | 1.7 | 10.2 | ||
| Intact Meat 2 | Ground Meat 3 | |||||||
|---|---|---|---|---|---|---|---|---|
| Train | CV | Test | Train | CV | Test | |||
| Lamb | Sensitivity | 100.0 | 79.4 | 80.7 | 99.2 | 92.7 | 92.8 | |
| Specificity | 100.0 | 96.0 | 96.0 | 100.0 | 93.6 | 88.3 | ||
| Accuracy | 100.0 | 87.3 | 88.0 | 99.6 | 93.2 | 90.5 | ||
| Error | 0.0 | 12.7 | 12.0 | 0.4 | 6.8 | 9.5 | ||
| Beef | Sensitivity | 100.0 | 85.4 | 93.7 | 100.0 | 85.6 | 83.3 | |
| Specificity | 100.0 | 93.1 | 93.5 | 99.7 | 98.1 | 97.6 | ||
| Accuracy | 100.0 | 89.1 | 93.6 | 99.8 | 91.6 | 90.2 | ||
| Error | 0.0 | 10.8 | 6.4 | 0.2 | 8.4 | 9.8 | ||
| Chicken | Sensitivity | 100.0 | 98.9 | 94.7 | 100.0 | 94.4 | 87.5 | |
| Specificity | 100.0 | 100.0 | 100.0 | 100.0 | 99.8 | 99.4 | ||
| Accuracy | 100.0 | 99.4 | 97.3 | 100.0 | 97.0 | 93.2 | ||
| Err | 0.0 | 0.6 | 2.7 | 0.0 | 3.0 | 6.8 | ||
| Pork | Sensitivity | 100.0 | 100.0 | 100.0 | 100.0 | 100.0 | 100.0 | |
| Specificity | 100.0 | 100.0 | 100.0 | 100.0 | 100.0 | 100.0 | ||
| Accuracy | 100.0 | 100.0 | 100.0 | 100.0 | 100.0 | 100.0 | ||
| Error | 0.0 | 0.0 | 0.0 | 0.0 | 0.0 | 0.0 | ||
| Left Out | Accuracy (%) | Spectra | Lamb | Beef | Chicken | Pork |
|---|---|---|---|---|---|---|
| Lamb | 99.8 | 222 | -------------- | 131 (59 %) | 75 (33.8 %) | 16 (7.2 %) |
| Beef | 99.0 | 240 | 231 (96.3 %) | ------------ | 7 (2.9 %) | 2 (0.8 %) |
| Chicken | 92.1 | 240 | 220 (91.7 %) | 2 (0.8 %) | ----------- | 18 (7.5 %) |
| Pork | 89.0 | 240 | 227 (94.6 %) | 0 (0.0 %) | 13 (5.4 %) | ------------ |
| Left Out | Accuracy (%) | Spectra | Lamb | Beef | Chicken | Pork |
|---|---|---|---|---|---|---|
| Lamb | 99.3 | 246 | ------------ | 82 (33.3%) | 145 (58.9%) | 19 (7.7%) |
| Beef | 97.9 | 288 | 155 (53.8%) | -------------- | 4 (1.3%) | 129 (44.8%) |
| Chicken | 97.4 | 240 | 197 (82.0 %) | 10 (4.1%) | ------------ | 33 (13.7%) |
| Pork | 97.4 | 204 | 77 (37.7 %) | 101 (49.5 %) | 26 (12.7 %) | ------------ |
Publisher’s Note: MDPI stays neutral with regard to jurisdictional claims in published maps and institutional affiliations. |
© 2021 by the authors. Licensee MDPI, Basel, Switzerland. This article is an open access article distributed under the terms and conditions of the Creative Commons Attribution (CC BY) license (https://creativecommons.org/licenses/by/4.0/).
Share and Cite
Dashti, A.; Müller-Maatsch, J.; Weesepoel, Y.; Parastar, H.; Kobarfard, F.; Daraei, B.; AliAbadi, M.H.S.; Yazdanpanah, H. The Feasibility of Two Handheld Spectrometers for Meat Speciation Combined with Chemometric Methods and Its Application for Halal Certification. Foods 2022, 11, 71. https://doi.org/10.3390/foods11010071
Dashti A, Müller-Maatsch J, Weesepoel Y, Parastar H, Kobarfard F, Daraei B, AliAbadi MHS, Yazdanpanah H. The Feasibility of Two Handheld Spectrometers for Meat Speciation Combined with Chemometric Methods and Its Application for Halal Certification. Foods. 2022; 11(1):71. https://doi.org/10.3390/foods11010071
Chicago/Turabian StyleDashti, Abolfazl, Judith Müller-Maatsch, Yannick Weesepoel, Hadi Parastar, Farzad Kobarfard, Bahram Daraei, Mohammad Hossein Shojaee AliAbadi, and Hassan Yazdanpanah. 2022. "The Feasibility of Two Handheld Spectrometers for Meat Speciation Combined with Chemometric Methods and Its Application for Halal Certification" Foods 11, no. 1: 71. https://doi.org/10.3390/foods11010071
APA StyleDashti, A., Müller-Maatsch, J., Weesepoel, Y., Parastar, H., Kobarfard, F., Daraei, B., AliAbadi, M. H. S., & Yazdanpanah, H. (2022). The Feasibility of Two Handheld Spectrometers for Meat Speciation Combined with Chemometric Methods and Its Application for Halal Certification. Foods, 11(1), 71. https://doi.org/10.3390/foods11010071