
A New Pyrroloquinoline-Derivative-Based Fluorescent Probe for the Selective Detection and Cell Imaging of Lysine

1
School of Chemistry and Chemical Engineering, Nantong University, Nantong 226019, China
2
Institute of Special Environmental Medicine, Nantong University, Nantong 226019, China
3
School of Textile and Clothing, Nantong University, Nantong 226019, China
*
Authors to whom correspondence should be addressed.
Pharmaceuticals 2022, 15(4), 474; https://doi.org/10.3390/ph15040474
Submission received: 9 February 2022
/
Revised: 29 March 2022
/
Accepted: 7 April 2022
/
Published: 13 April 2022
(This article belongs to the Special Issue Novel Fluorescent Probes for Drug Discovery and Development)
Abstract
:In this paper, a new pyrroloquinoline-derivative-based fluorescent probe, PQP-1, was prepared for the selective detection of Lys in living cells and natural mineral water for drinking. PQP-1 exhibited high selectivity, low limit of detection, and a wide pH range. PQP-1 could be successfully applied for imaging Lys in living cells and in natural mineral water for drinking. We expect that PQP-1 will expand the detection reaction mechanism and the practical biological applications of Lys.
1. Introduction
l-lysine is an essential amino acid for mammals and human beings which cannot be synthesized by the body itself and can only be obtained from food [1]. However, lysine is very low in cereals, so it is also known as the first limiting amino acid. l-lysine plays an important role in the regulation of protein synthesis [2,3] and energy metabolism [4,5], and it can improve mineral absorption [6] and bone growth [7], enhance immunity [8], and relieve anxiety [9]. The WHO/FAO/UNU Expert Committee had established a l-lysine requirement of 30 mg·kg−1·d−1 [10], which is now widely accepted. Thus, the development of analytical methods for the detection of lysine is of significance for medical and biological research.
Some analytical techniques have been used to detect lysine, including colorimetric method [11,12,13,14], liquid chromatography [15] and thin-layer chromatography [16], mass spectrometry [17], luminescent sensors [18], amperometric biosensors [19,20], electrochemical detection [21,22,23,24], and fluorescent probes [25,26,27,28,29,30,31,32,33,34,35,36,37,38,39,40,41,42,43]. In these methods, fluorescent probes feature high sensitivity and selectivity—satisfactory capability compared with other complicated methods—having been studied by more researchers. However, many reported fluorescent probes simultaneously detect multiple amino acids; which is to say that the selectivity of the fluorescent probe to lysine requires further research. Additionally, organic micromolecule fluorescent probes for detection of lysine have been scarcely reported.
In this study, a new pyrroloquinoline-derivative-based fluorescent probe, PQP-1, was successfully synthesized. The probe PQP-1 can specifically recognize Lys and not react equally with homocysteine (Hcy), glutathione (GSH), glucose (GLu), various ions, and other amino acids. Afterwards PQP-1 was used to monitor Lys in HeLa cells and in Nongfu natural mineral water for drinking. Comparing with other reported probes listed in Table S1, PQP-1 features relatively simple structure, and can be easy to synthesize. In addition, the detection of PQP-1 to Lys can be performed in water without a large amount of additional organic solvents. Most of all, PQP-1 exhibited a high selectivity toward Lys, low limit of detection, and wide pH range. At the same time, PQP-1 can be successfully applied for cell imaging and real water samples, but not all reported probes can be used.
2. Results and Discussion
2.1. Synthesis of the Probe PQP-1
The probe PQP-1 was prepared from compound 1 according to the route in Figure 1. Its structure was confirmed (1H NMR and 13C NMR seen in Figures S1–S3).
2.2. Fluorescent Response of Probe PQP-1 to Lysine
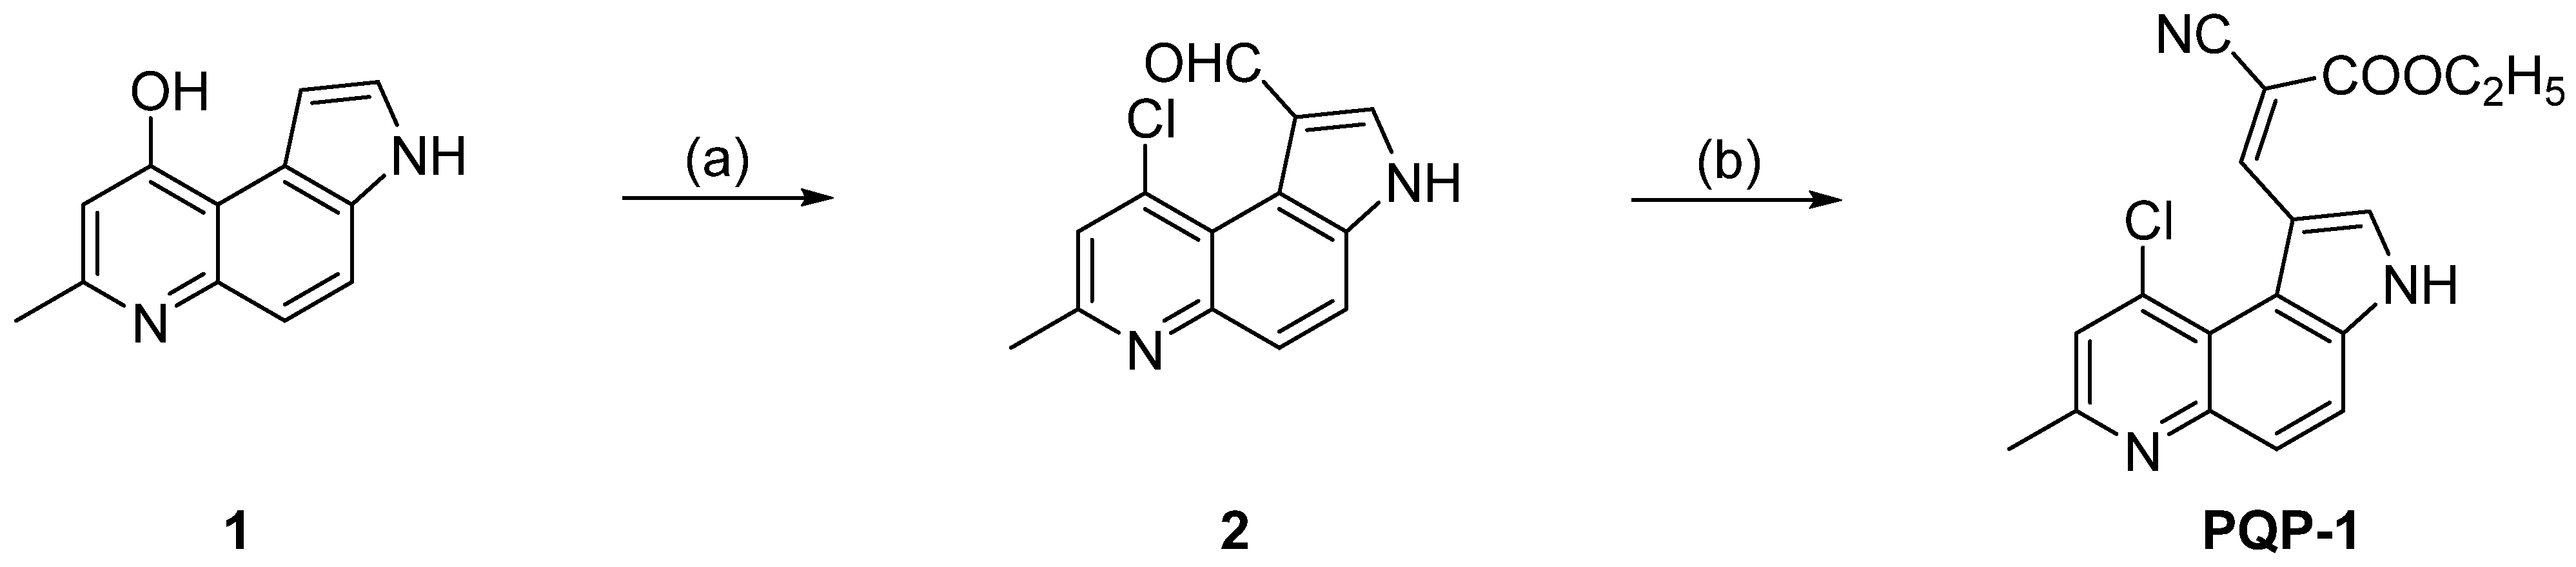
The fluorescence quantum yield (Φu) of probe PQP-1 is 0.05. Based primarily on optimization, 10 μM was selected as the testing concentration of PQP-1 and 30 min was the testing reaction time. With measuring conditions in hand, the varying regularity of the fluorescence spectroscopy have been estimated in the absence and presence of l-lysine in deionized water. Under the excitation wavelength of 335 nm, the fluorescence spectra of PQP-1 detecting l-lysine suggested the strong emission peak at around 420 nm appeared after the addition of l-lysine (Figure 2). The fluorescence enhancement also exhibited a linearly increasing relationship to the concentration of l-lysine (50–1000 μM). According to the equation the detection limit (LOD) = 3σ/k, the detection limit was calculated to be 21.89 nM.
Then, the pH-dependent fluorescent response experiments of PQP-1 to lysine were carried out. As we can see from Figure S4, the fluorescence intensity of PQP-1 remained stable in the 5.0–11.0 pH range. After 600 μM of l-lysine was added, the response of PQP-1 can hold steady at pH 6.0–9.0.
2.3. Selective Detection for Lysine
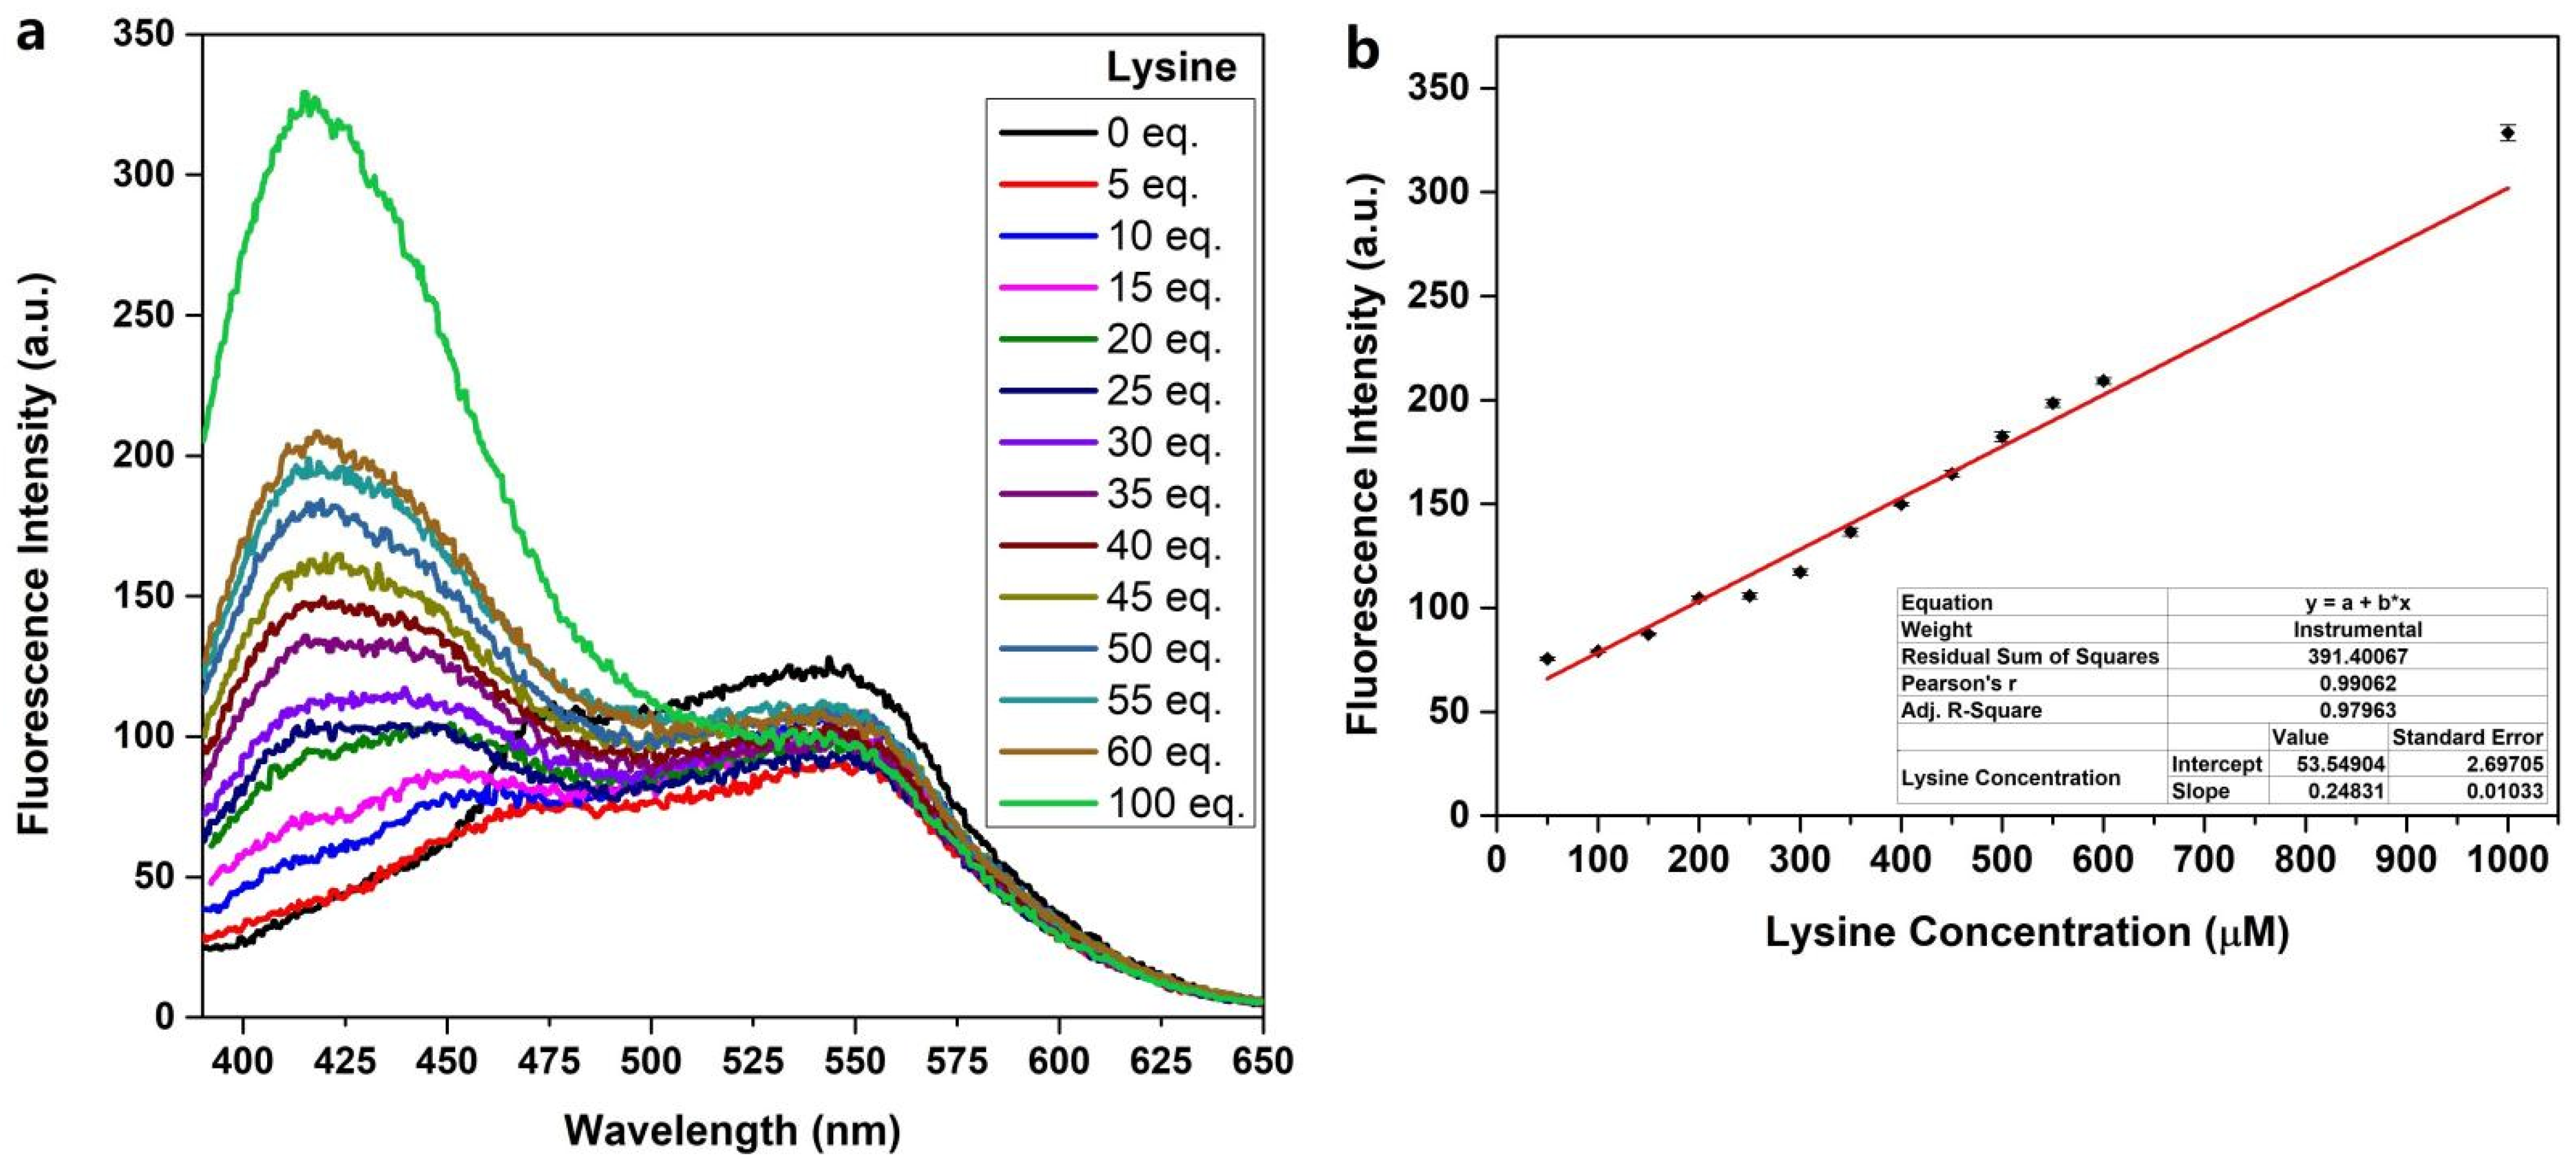
The selectivity was discussed through the comparison of the fluorescence intensity in the presence of various anions, metal cations, amino acids, GSH, Hcy, and GLu. As shown in Figure 3a–c, except for lysine, none of these competitive species led to obvious fluorescence response. However, cyano-based probes were usually applied in the detection of sulfur dioxide derivatives (HSO3−/SO32−), and reports suggested the amino acid Arg had similar response to Lys, so HSO3− and Arg were investigated for evaluating the selectivity of PQP-1 to Lys. The results in Figure 3d demonstrated the response peak of 1 mM Arg appeared at 450 nm rather than 420 nm (the response peak of Lys); meanwhile, three peaks at 420, 475, and 550 nm were observed in the fluorescence spectra after the addition of 500 μM or 1 mM NaHSO3. In addition, the peak at 420 nm after the addition of 1 mM NaHSO3 was almost as high as the peak after the addition of 400 μM l-lysine but far below the peak after the addition of the same concentration of l-lysine. Therefore, we can conclude that HSO3− and Arg cannot react with PQP-1 as well as Lys. These results showed that PQP-1 exhibited high selectivity.
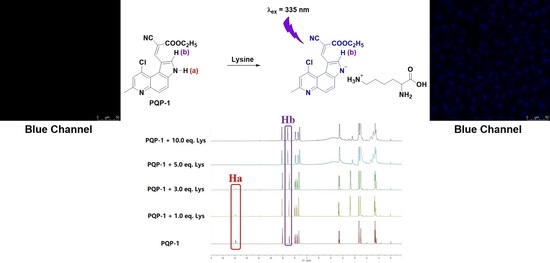
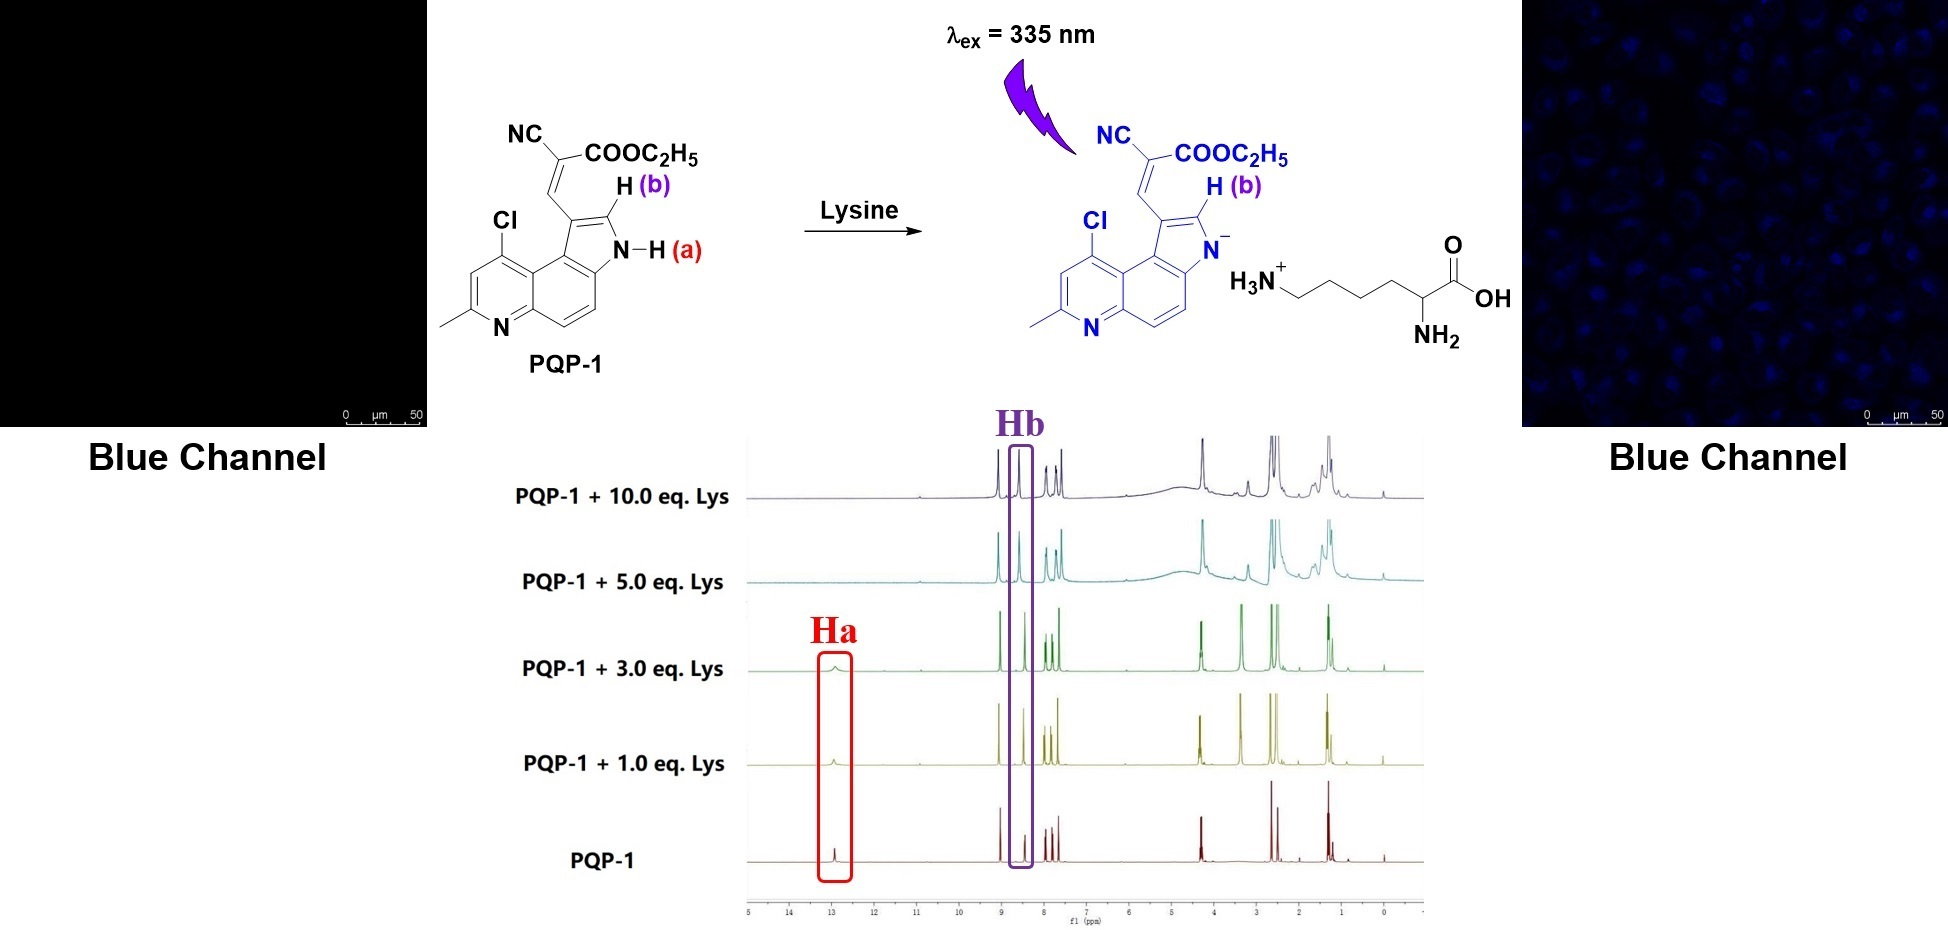
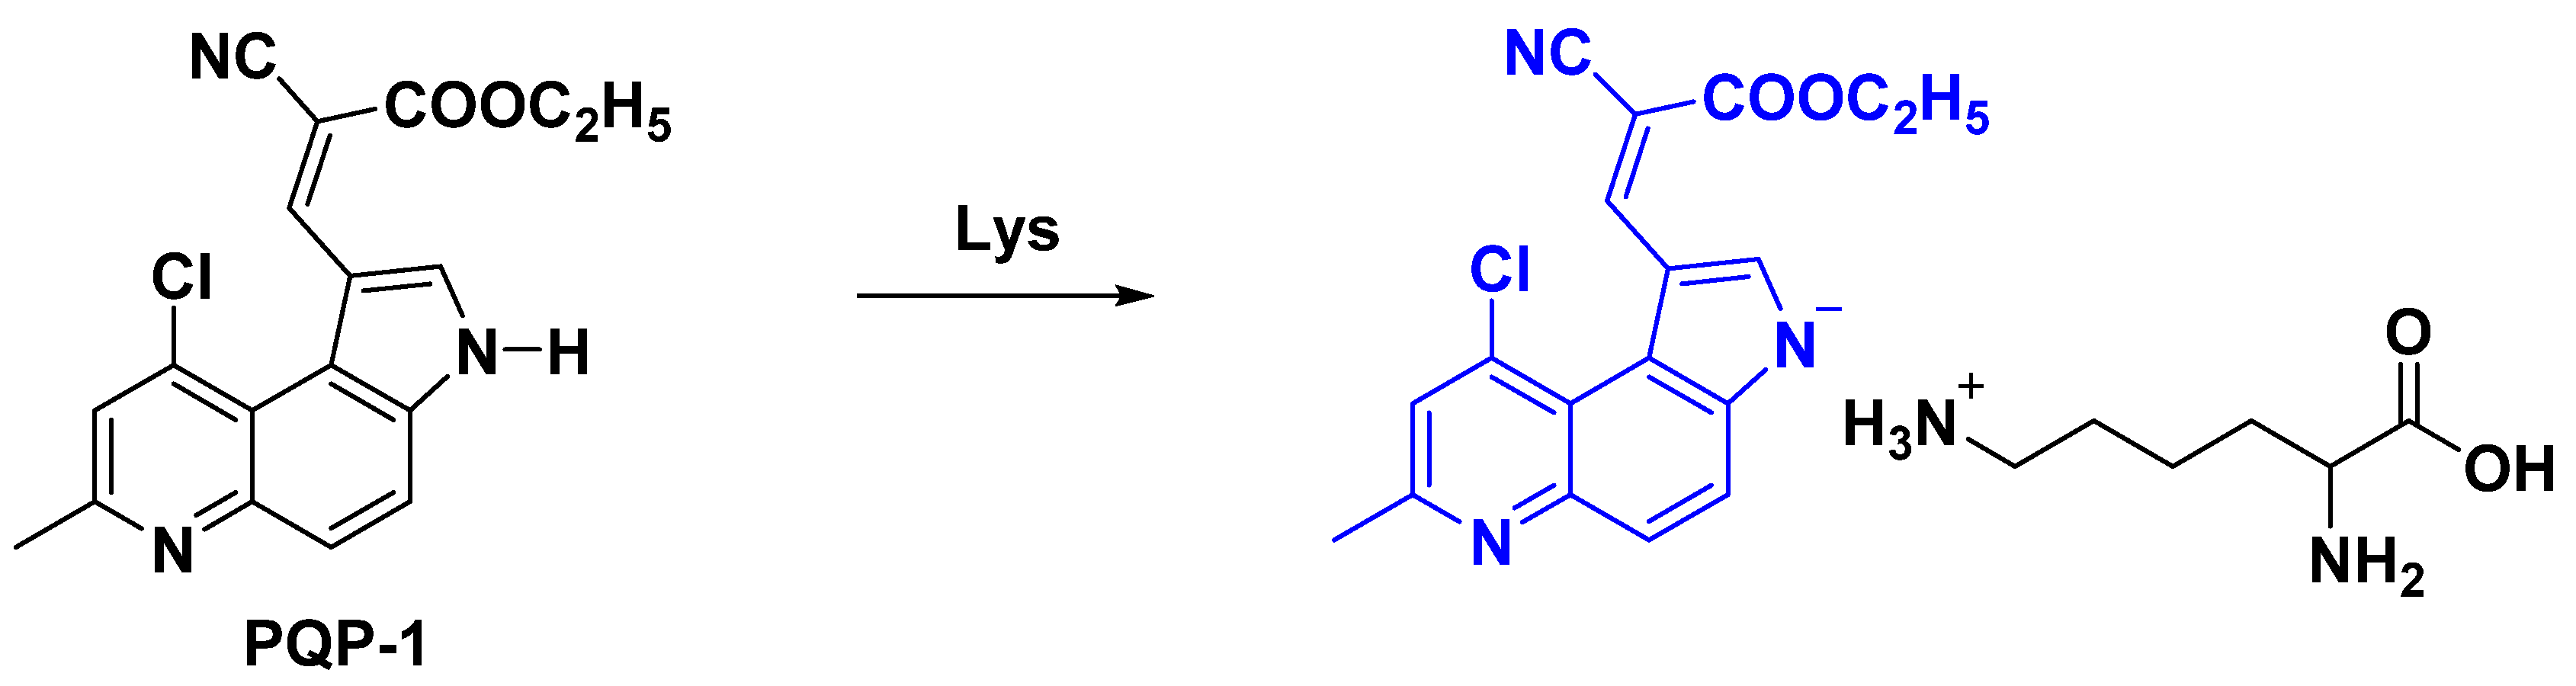
2.4. Proposed Response Mechanism
The response mechanism between PQP-1 and lysine was shown in Figure 4. ε-Amino group in lysine structure can capture the proton bonded to nitrogen of the pyrrole structure on PQP-1, increase the electron cloud density of the PQP-1 structure, and change the electronic configuration, which can bring about the new fluorescence response signal.
The response mechanism as mentioned in Figure 4 was confirmed by 1H NMR titration results in Figure 5. There are at least two pieces of evidence. On one hand, with increase in the concentration of Lys, the peak of the hydrogen Ha on the pyrrole nitrogen decreased gradually and disappeared at last (Figure 5a). On the other hand, the peak type of hydrogen Hb in aromatic ring adjacent to nitrogen in the pyrrole structure changed from doublet into singlet. These data suggested that the proton Ha had been abstracted in PQP-1 during the detection of lysine, which could support the proposed response mechanism.
2.5. Imaging Study
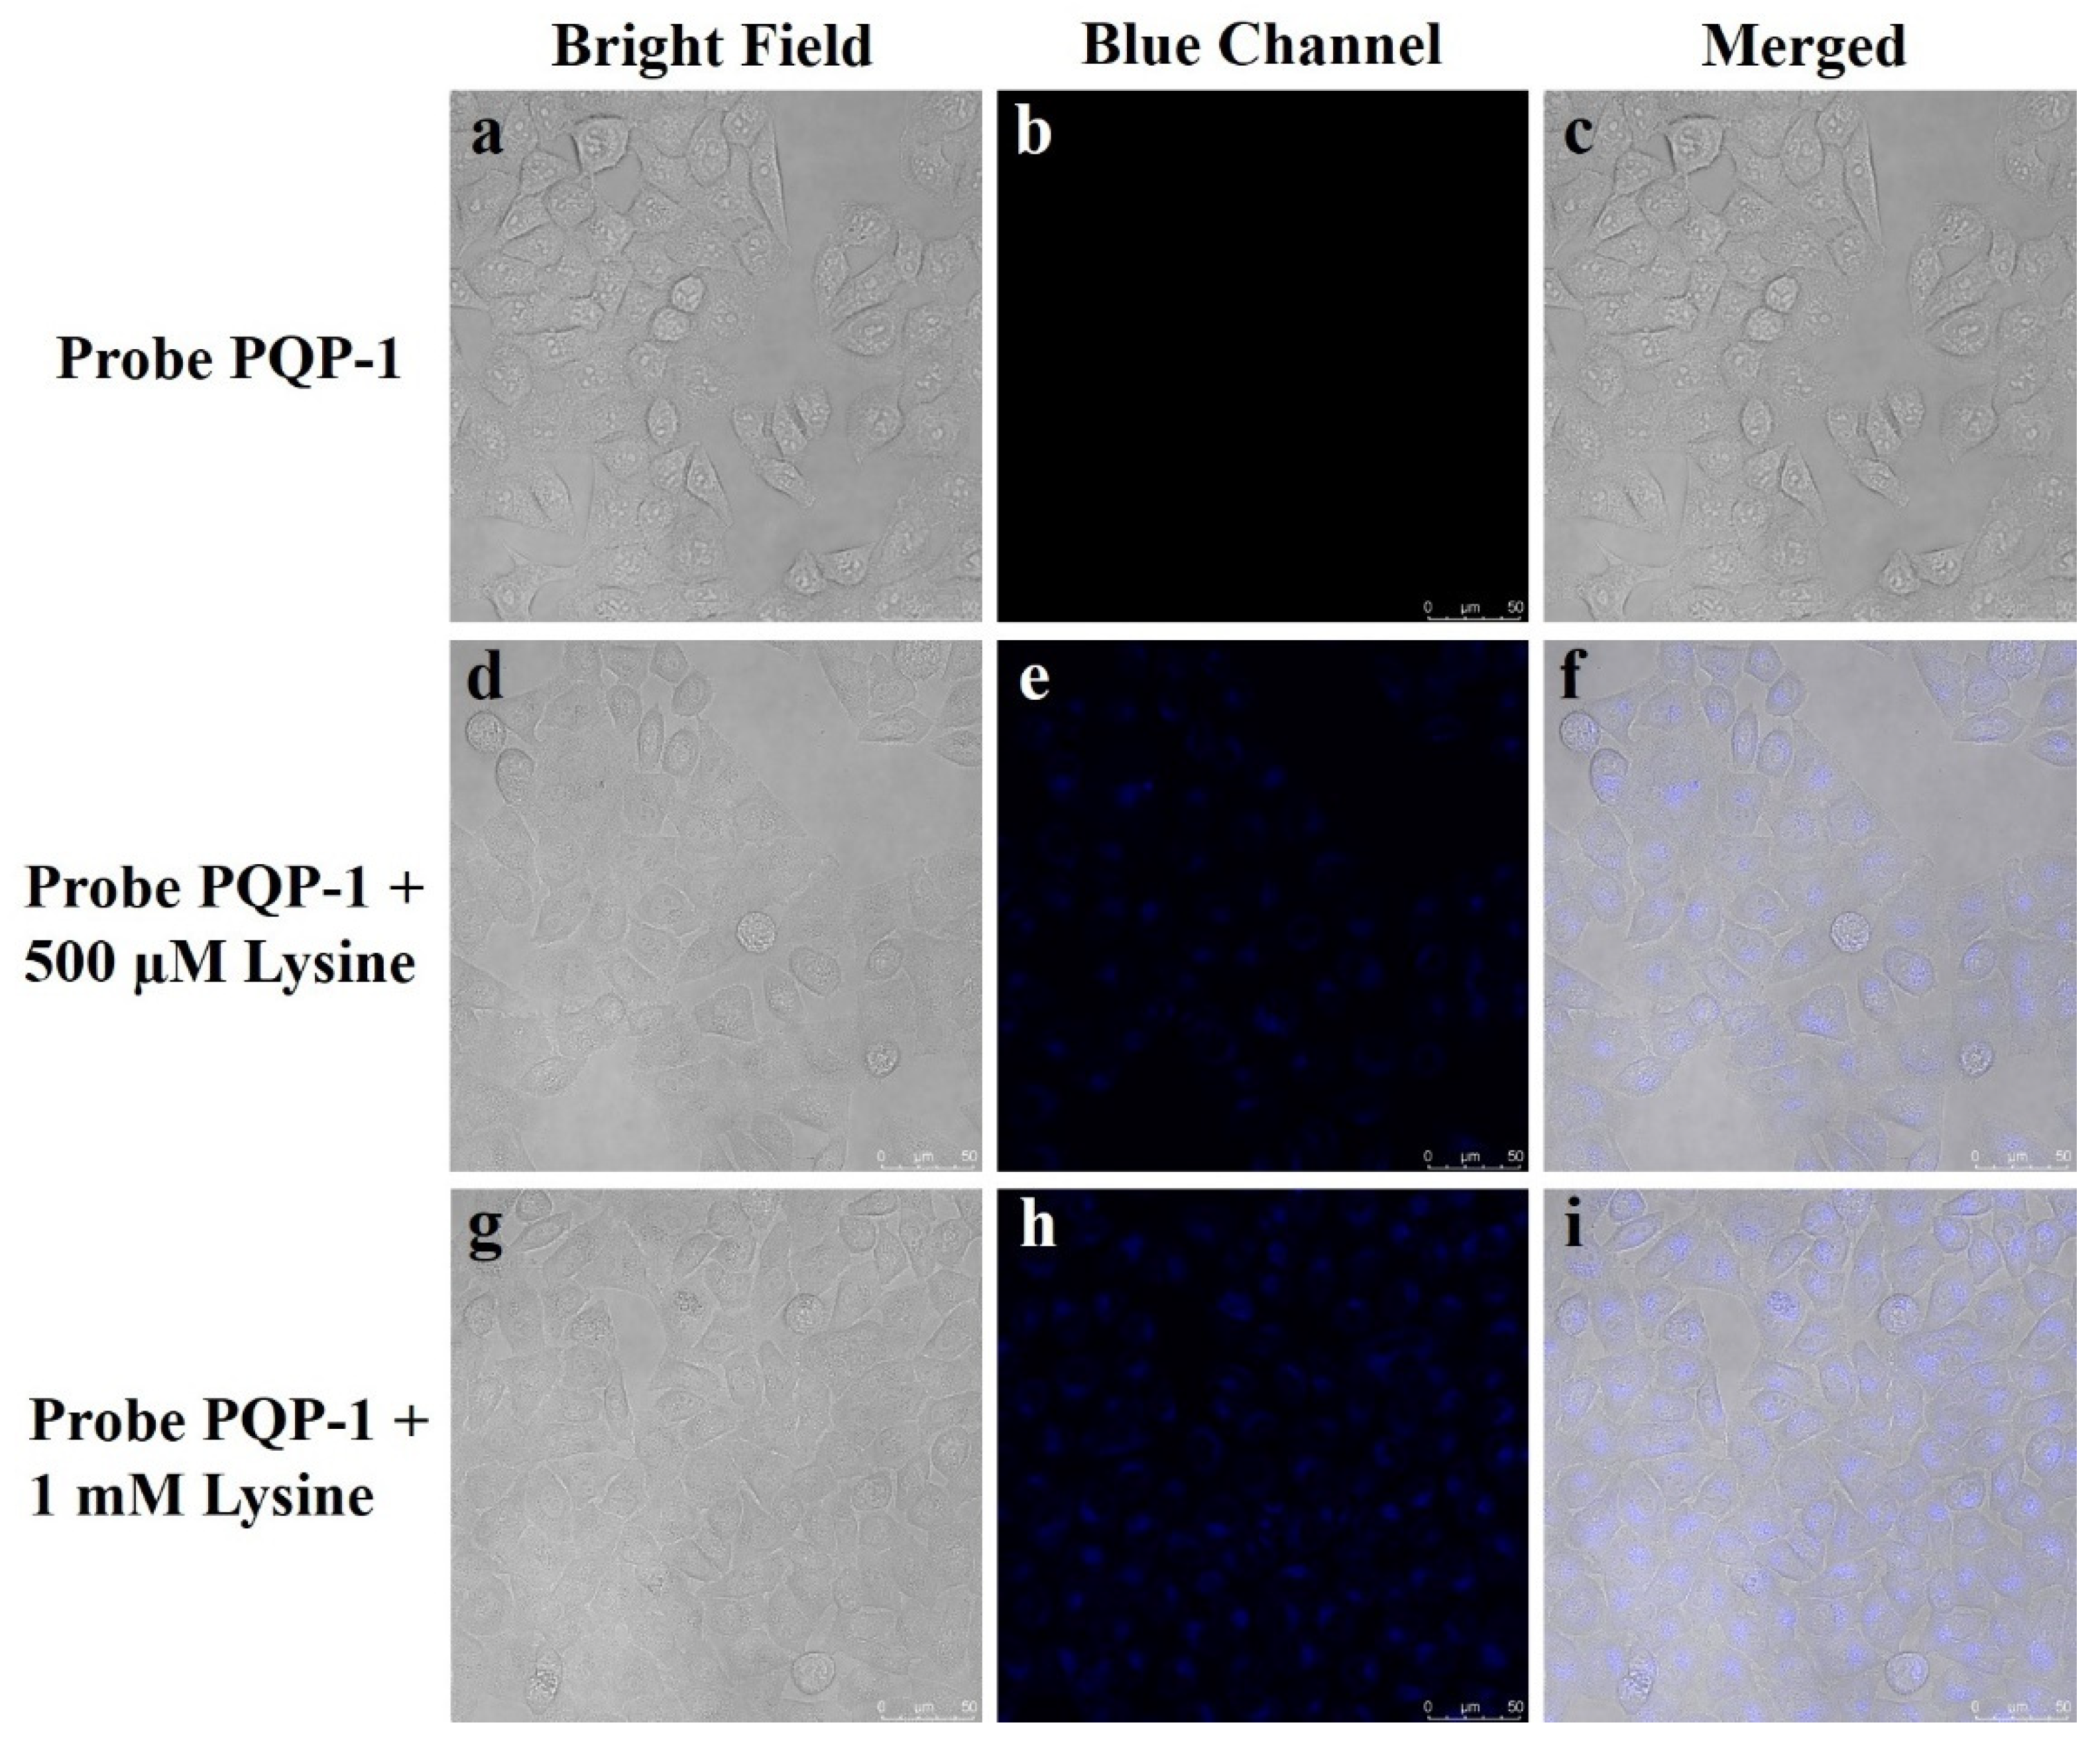
The intracellular performance in monitoring l-lysine was further revealed on a confocal fluorescent microscope (Figure 6). After HeLa cells were incubated with PQP-1 (10 μM) for 30 min, there was no obvious fluorescent signal (Figure 6a–c). When the cells were incubated with 10 μM of the probe PQP-1 for 30 min and subsequently incubated with 500 μM of l-lysine (Figure 6d–f) and 1 mM (Figure 6g–i), respectively, the enhancement of the fluorescence signal was observed compared with that of the control. Notably, the fluorescence signal increased in a dose-dependent manner. In a word, these observations indicate that PQP-1 can detect lysine in living cells.
2.6. Detection of Lysine Concentrations in Natural Mineral Water for Drinking
Not only can lysine be mixed with various vitamins to compound nutritional supplements, but it can improve the performance of some drugs to enhance the efficacy of drugs. These nutritional supplements and drugs are commonly used in tablet form. On the other hand, natural mineral water for drinking is daily water, which is convenient for sampling. In order to study the effect of mineral water for drinking on these tablets, PQP-1 was further applied to detect l-lysine in natural mineral water for drinking. As shown in Table 1, testing results of PQP-1 to l-lysine was found to be consistent with the real adding amount of l-lysine under the standard testing conditions. The range of recovery was between 96.65% and 101.93%, indicating that the natural mineral water for drinking did not influence the recognition of PQP-1 toward Lys.
3. Materials and Methods
3.1. Materials and Apparatus
5-Aminoindole and ethyl cyanoacetate were purchased from Bide Pharmatech Ltd., Shanghai, China. Ethyl acetoacetate was purchased from Shanghai Macklin Biochemical Co., Ltd., Shanghai, China. Phosphorus oxychloride (POCl3) was purchased from Shanghai xianding Biotechnology, Shanghai, China. Dimethyl formamide (DMF) was purchased from Sinopharm Chemical Reagent Co., Ltd., Shanghai, China. The purchased chemicals were directly used. The purification of products was performed with silica gel column chromatography (silica gel: 200–300 mesh, Qingdao Ocean Chemical Co. Ltd., Qingdao, China). HeLa cells (CCL-2, PRID: CVCL_0030) was obtained from ATCC.
Melting points were determined on a micro melting point apparatus (SGW X-4B, Shanghai, China) and uncorrected. 1H and 13C NMR spectra were measured with a Bruker AVANCE III HD 400M spectrometer (Zurich, Switzerland). Chemical shifts (δ) were shown in ppm (parts per million) with respect to TMS. Coupling constants (J) were reported in Hz. HRMS (High Resolution Mass Spectrometry) data were obtained from an AB Sciex TripleTOF 4600 System mass spectrometer (Framingham, MA, USA) with an ESI (electrospray ionization) source.
The UV–vis absorption measurement was conducted on a Shimadzu UV-3600 spectrometer (Tokyo, Japan). All fluorescence tests were obtained from a Hitachi F-7000 Fluorescence Spectrometer (Tokyo, Japan). The cell imaging experiments were accomplished on a Leica TCS SP8 STED 3X confocal fluorescent microscope (Wetzlar, Germany).
3.2. Preparation of the Probe PQP-1
The preparation process of PQP-1 was shown in Figure 1.
According to previous reports [44,45], 3H-9-Hydroxy-pyrrolo[3,2-f]quinoline (1) and 3H-9-chloro-7-methyl-1-formyl-pyrrolo[3,2-f]quinoline (2) were synthesized. Compound 1 can develop from condensation and cyclization of 5-aminoindole with ethyl acetoacetate, and be used after filtration without purification. Then, compound 2 was prepared from the Vilsmeier–Haack formylation reaction of compound 1 with POCl3 and DMF. The pure compound 2 can be obtained by silica gel column.
To an ethanol solution (25.0 mL) of aldehyde compound 2 (0.2445 g, 1.0 mmol) was added ethyl cyanoacetate (0.17 mL), and the reaction liquid was heated to reflux for 5 h while stirring. After the consumption of the reaction was confirmed, the reaction mixture was evaporated under reduced pressure. The crude product was purified by silica gel chromatography to give a yellow solid (PQP-1, 0.2887 g, yield: 85%). m.p. 203.0–204.0 °C. 1H NMR (400 MHz, DMSO-d6) δ 1.30 (t, 3H, J = 7.2 Hz), 2.64 (d, 3H, J = 1.2 Hz), 4.30 (q, 2H, J = 7.2 Hz), 7.62–7.65 (m, 1H), 7.78–7.82 (m, 1H), 7.93–7.97 (m, 1H), 8.45 (d, 1H, J = 2.4 Hz), 9.02–9.04 (m, 1H), 12.90 (s, 1H). 13C NMR (100 MHz, DMSO-d6) δ 14.2, 23.8, 61.7, 93.9, 112.3, 117.1, 117.5, 118.2, 119.6, 122.6, 125.8, 130.8 (d, J = 15.0 Hz), 135.3, 137.5, 147.4, 153.5, 155.9, 162.9. HRMS (ESI-TOF) m/z: [M+H]+ Calcd. for C18H15ClN3O2 340.0847, Found 340.0843.
3.3. Testing Conditions
The solution of probe PQP-1 in DMSO and deionized water (V:V = 1:4) was diluted for testing. The deionized water was used to prepare the testing solution of other analytes. λex = 335 nm, slit: 5 × 5 nm.
3.4. Calculation of the Fluorescence Quantum Yield
The sulfuric acid solution (0.1 M) of quinine sulfate (1 µM, Φ = 0.54, λex = 360 nm) used as the standard, the following equation was used to calculate the fluorescence quantum yield (FQY) Φu:
Φu = [(AsFun2)/(AuFsn02)]Φs.
Φs is the quantum yield of quinine sulfate; As and Au must be lower than 0.05, refer to the absorbance of the standard and PQP-1 (1 µM) at the respective excitation wavelength; Fs and Fu represent the integrated emission band areas; n and n0 are the refractive indexes of water and sulfuric acid solution (0.1 M), respectively.
Φs = 0.54, As = 0.009, Fs = 119.159, n0 = 1.3330;
Au = 0.0207, Fu = 27.036, n = 1.3330;
Quantum yield: Φu = 0.05.
Au = 0.0207, Fu = 27.036, n = 1.3330;
Quantum yield: Φu = 0.05.
3.5. Calculation of the Detection Limit
The following equation was used to calculate the detection limit (LOD):
where σ is the standard derivation of 25 blank PQP-1 solutions, k refers to the slope between the fluorescence intensity at around 420 nm and a series of concentrations of L-lysine.
LOD = 3σ/k
3.6. Imaging Study
HeLa cells were cultured for 12 h in a humidified atmosphere carrying 5% CO2. The cells were washed by PBS three times, then used for cell imaging.
3.7. Water Sample Preparation
The natural mineral water for drinking was derived from Nongfu barreled natural mineral water for drinking. The natural mineral water was directly used as the solution system in the tests instead of above deionized water.
4. Conclusions
In general, we prepared a new fluorescent probe, PQP-1, containing a pyrroloquinoline structure for the selective detection of Lys. Research results suggested that PQP-1 had a high selectivity to Lys, low limit of detection, and wide pH range. Moreover, PQP-1 could be successfully applied for the living cell imaging of Lys. Finally, PQP-1 has been used in natural mineral water for drinking. Furthermore, we expect that PQP-1 will broaden the reaction mechanism of Lys detection as well as its biological applications.
Supplementary Materials
The following supporting information can be downloaded at: https://www.mdpi.com/article/10.3390/ph15040474/s1, Figure S1: 1H NMR spectra of PQP-1; Figure S2: 13C NMR spectra of PQP-1; Figure S3: HRMS spectra of compound PQP-1; Figure S4: The variation of the fluorescence intensity at 420 nm of PQP-1 (10 μM) at different pH values (from 5.0 to 11.0) in the absence (black) and presence (red) of L-lysine (600 μM); Table S1: The comparison of PQP-1 and reported small-molecule fluorescent probes for Lys.
Author Contributions
Conceptualization, B.Y.; Methodology, B.Y. and Z.C.; Validation, J.Z. and X.H.; Formal analysis, B.Y.; Investigation, J.Z. and X.H.; Resources, B.Y. and Z.C.; Writing—original draft preparation, B.Y.; Writing—review and editing, S.T.; Supervision, Y.S.; Project administration, S.T. All authors have read and agreed to the published version of the manuscript.
Funding
This research was funded by Nantong University Scientific Research Foundation for the Introduced Talents, grant number 03081220 (B.Y.); and Large Instruments Open Foundation of Nantong University, grant number KFJN2024 (B.Y.).
Institutional Review Board Statement
Not applicable.
Informed Consent Statement
Not applicable.
Data Availability Statement
Data is contained within the article or supplementary material.
Conflicts of Interest
The authors declare no conflict of interest.
References
- Galili, G.; Amir, R. Fortifying plants with the essential amino acids lysine and methionine to improve nutritional quality. Palnt Biotechnol. J. 2013, 11, 211–222. [Google Scholar] [CrossRef]
- Lin, X.; Li, S.; Zou, Y.; Zhao, F.Q.; Liu, J.; Liu, H. Lysine stimulates protein synthesis by promoting the expression of ATB (0,+) and activating the mTOR pathway in bovine mammary epithelial cells. J. Nutr. 2018, 148, 1426–1433. [Google Scholar] [CrossRef]
- Austin, S.A.; Clemens, M.J. Stimulation of protein synthesis by lysine analogues in lysine-deprived Ehrlich ascites tumour cells. Biochim. Biophys. Acta Mol. Cell Res. 1984, 804, 16–22. [Google Scholar] [CrossRef]
- Zhao, Y.; Han, Y.; Sun, Y.; Wei, Z.; Chen, J.; Niu, X.; An, Q.; Zhang, L.; Qi, R.; Gao, X. Comprehensive succinylome profiling reveals the pivotal role of lysine succinylation in energy metabolism and quorum sensing of staphylococcus epidermidis. Front. Microbiol. 2021, 11, 632367. [Google Scholar] [CrossRef] [PubMed]
- De Marchi, U.; Galindo, A.N.; Thevenet, J.; Hermant, A.; Bermont, F.; Lassueur, S.; Domingo, J.S.; Kussmann, M.; Dayon, L.; Wiederkehr, A. Mitochondrial lysine deacetylation promotes energy metabolism and calcium signaling in insulin-secreting cells. FASEB J. 2019, 33, 4660–4674. [Google Scholar] [CrossRef] [PubMed]
- Rushton, D.H. Nutritional factors and hair loss. Clin. Exp. Dermatol. 2002, 27, 396–404. [Google Scholar] [CrossRef] [PubMed]
- Civitelli, R.; Villareal, D.T.; Agnusdei, D.; Nardi, P.; Gennari, C. Dietary L-lysine and calcium metabolism in humans. Nutrition 1992, 8, 400–405. [Google Scholar] [PubMed]
- Wang, H.; Elsaadawy, S.A.; Wu, Z.; Bu, D.P. Maternal supply of ruminally-protected lysine and methionine during close-up period enhances immunity and growth rate of neonatal calves. Front. Vet. Sci. 2021, 8, 780731. [Google Scholar] [CrossRef]
- Smriga, M.; Kameishi, M.; Uneyama, H.; Torii, K. Dietary L-lysine deficiency increases stress-induced anxiety and fecal excretion in rats. J. Nutr. 2002, 132, 3744–3746. [Google Scholar] [CrossRef] [Green Version]
- Unni, U.S.; Raj, T.; Sambashivaiah, S.; Kuriyan, R.; Uthappa, S.; Vaz, M.; Regan, M.M.; Kurpad, A.V. The effect of a controlled 8-week metabolic ward based lysine supplementation on muscle function, insulin sensitivity and leucine kinetics young men. Clin. Nutr. 2012, 31, 903–910. [Google Scholar] [CrossRef]
- Zhou, Y.; Yang, Z.; Xu, M. Colorimetric detection of lysine using gold nanoparticles aggregation. Anal. Methods 2012, 4, 2711–2714. [Google Scholar] [CrossRef]
- Kugimiya, A.; Takamitsu, E. Spectrophotometric detection of histidine and lysine using combined enzymatic reactions. Mater. Sci. Eng. C 2013, 33, 4867–4870. [Google Scholar] [CrossRef]
- Rawat, K.A.; Kailasa, S.K. Visual detection of arginine, histidine and lysine using quercetin-functionalized gold nanoparticles. Microchim. Acta 2014, 181, 1917–1929. [Google Scholar] [CrossRef]
- Zeußel, L.; Mai, P.; Sharma, S.; Schober, A.; Ren, S.; Singh, S. Colorimetric method for instant of lysine and arginine using novel meldrum’s acid-furfural conjugate. Chemistryselect 2021, 6, 6834–6840. [Google Scholar] [CrossRef]
- García-Villar, N.; Saurina, J.; Hernández-Cassou, S. Liquid chromatographic determination of lysine by potentionmetric detection with a biosensor. Anal. Lett. 2002, 35, 1313–1325. [Google Scholar] [CrossRef]
- Zakrzewski, R.; Ciesielski, W.; Kaźmierczak, D. Detection of proline, arginine, and lysine using iodine-azide reaction in TLC and HPTLC. J. Sep. Sci. 2003, 26, 1063–1066. [Google Scholar] [CrossRef]
- Arendowski, A.; Ruman, T. Lysine detection and quantification by laser desorption/ionization mass spectrometry on gold nanoparticle-enhanced target. Anal. Methods 2018, 10, 5398–5405. [Google Scholar] [CrossRef]
- Liu, Y.; Huangfu, M.; Wu, P.; Jiang, M.; Zhao, X.; Liang, L.; Xie, L.; Bai, J.; Wang, J. Post-imparting Brønsted acidity into an amino functionalized MOF as a bifunctional luminescent turn-ON sensor for the detection of aluminum ions and lysine. Dalton Trans. 2019, 48, 13834–13840. [Google Scholar] [CrossRef]
- Sahin, O.G.; Gulce, H.; Gulce, A. Polyvinylferrocenium based platinum electrodeposited amperometric biosensors for lysine detection. J. Electroanal. Chem. 2013, 690, 1–7. [Google Scholar] [CrossRef]
- Chauhan, N.; Narang, J.; Sunny; Pundir, C.S. Immobilization of lysine oxidase on a gold-platinum nanoparticles modified Au electrode for detection of lysine. Enzyme Microb. Technol. 2013, 52, 265–271. [Google Scholar] [CrossRef]
- Yu, H.; Xu, L.; You, T. Indirect electrochemiluminescence detection of lysine and histidine separated by capillary electrophoresis based on charge displacement. Luminescence 2013, 28, 217–221. [Google Scholar] [CrossRef] [PubMed]
- Heli, H.; Sattarahmady, N.; Hajjizadeh, M. Electrocatalytic oxidation and electrochemical detection of guanine, L-arginine and L-lysine at a copper nanoparticles-modified electrode. Anal. Methods 2014, 6, 6981–6989. [Google Scholar] [CrossRef]
- Cheng, J.; Zhong, S.; Wan, W.; Chen, X.; Chen, A.; Cheng, Y. Novel graphene/In2O3 nanocubes preparation and selective electrochemical detection for L-lysine of Camellia nitidissima Chi. Materials 2020, 13, 1999. [Google Scholar] [CrossRef] [PubMed]
- Butko, A.V.; Butko, V.Y.; Lebedev, S.P.; Lebedev, A.A.; Davydov, V.Y.; Eliseyev, I.A.; Kumzerov, Y.A. Detection of lysine molecular ions in solution gated field effect transistors based on unmodified graphene. J. Appl. Phys. 2020, 128, 215302. [Google Scholar] [CrossRef]
- Ma, H.; Qi, C.; Cao, H.; Zhang, Z.; Yang, Z.; Zhang, B.; Chen, C.; Lei, Z.Q. Water-soluble fluorescent probes for selective recognition of lysine and its application in an object carry-and-release system. Chem. Asian J. 2016, 11, 58–63. [Google Scholar] [CrossRef]
- Liu, G.; Feng, D.Q.; Hua, D.; Liu, T.; Qi, G.; Wang, W. Fluorescence enhancement of terminal amine assembled on gold nanoclusters and its application to ratiometric lysine detection. Langmuir 2017, 33, 14643–14648. [Google Scholar] [CrossRef]
- Song, W.; Duan, W.; Liu, Y.; Ye, Z.; Chen, Y.; Chen, H.; Qi, S.; Wu, J.; Liu, D.; Xiao, L.; et al. Ratiometric detection of intracellular lysine and pH with one-pot synthesized dual emissive carbon dots. Anal. Chem. 2017, 89, 13626–13633. [Google Scholar] [CrossRef]
- Jiang, X.D.; Yue, S.; Jia, L.; Li, S.; Li, C.; Li, Q.; Xiao, L. NIR fluorescent azaBODPIY-based probe for the specific detection of L-lysine. Chemistryselect 2018, 3, 7581–7585. [Google Scholar] [CrossRef]
- Zhang, Z.; Wei, T.; Chen, Y.; Chen, T.; Chi, B.; Wang, F.; Chen, X. A polydiacetylenes-based colorimetric and fluorescent probe for L-arginine and L-lysine and its application for logic gate. Sens. Actuators B 2018, 255, 2211–2217. [Google Scholar] [CrossRef]
- Du, G.; Pu, L. Micelle-encapsulated fluorescent probe: Chemoselective and enantioselective recognition of lysine in aqueous solution. Org. Lett. 2019, 21, 4777–4781. [Google Scholar] [CrossRef]
- Mi, G.; Yang, M.; Wang, C.; Zhang, B.; Hu, X.; Hao, H.; Fan, J. A simple “turn off-on” ratio fluorescent probe for sensitive detection of dopamine and lysine/arginine. Spectrochim. Acta Part A 2021, 253, 119555. [Google Scholar] [CrossRef] [PubMed]
- Zhou, Y.; Won, J.; Lee, J.Y.; Yoon, J. Studies leading to the development of a highly selective colorimetric and fluorescent chemosensor for lysine. Chem. Commun. 2011, 47, 1997–1999. [Google Scholar] [CrossRef] [PubMed]
- Lohar, S.; Safin, D.A.; Sengupta, A.; Chattopadhyay, A.; Matalobos, J.S.; Babashkina, M.G.; Robeyns, K.; Mitoraj, M.P.; Kubisiak, P.; Garcia, Y.; et al. Ratiometric sensing of lysine through the formation of the pyrene excimer: Experimental and computational studies. Chem. Commun. 2015, 51, 8536–8539. [Google Scholar] [CrossRef] [PubMed]
- Adhikari, S.; Ghosh, A.; Mandal, S.; Guria, S.; Banerjee, P.P.; Chatterjee, A.; Das, D. Colorimetric and fluorescence probe for the detection of nano-molar lysine in aqueous medium. Org. Biomol. Chem. 2016, 14, 10688–10694. [Google Scholar] [CrossRef]
- Yang, L.; Xie, Y.; Chen, Q.; Zhang, J.; Li, L.; Sun, H. Colorimetric and fluorescent dual-signal chemosensor for lysine and arginine and its application to detect amines in solid-phase peptide synthesis. ACS Appl. Bio Mater. 2021, 4, 6558–6564. [Google Scholar] [CrossRef]
- Zhu, Z.; Wang, Y.; Ding, H.; Fan, C.; Tu, Y.; Liu, G.; Pu, S. A novel full symmetric diarylethene-based ratiometric fluorescent sensor for lysine and the application for a logic circuit. Luminescence 2021, 36, 691–697. [Google Scholar] [CrossRef]
- Hou, J.-T.; Li, K.; Liu, B.-Y.; Liao, Y.-X.; Yu, X.-Q. The first ratiometric probe for lysine in water. Tetrahedron 2013, 69, 2118–2123. [Google Scholar] [CrossRef]
- Qian, X.; Gong, W.; Wang, F.; Lin, Y.; Ning, G. A pyrylium-based colorimetric and fluorimetric chemosensor for the selective detection of lysine in aqueous environment and real sample. Tetrahedron Lett. 2015, 56, 2764–2767. [Google Scholar] [CrossRef]
- Bhosale, R.S.; Shitre, G.V.; Kumar, R.; Biradar, D.O.; Bhosale, S.V.; Narayan, R.; Bhosale, S.V. A 8-hydroxypyrene-1,3,6-trisulfonic acid trisodium salt (HPTS) based colorimetric and green turn-on fluorescent sensor for the detection of arginine and lysine in aqueous solution. Sens. Actuators B 2017, 241, 1270–1275. [Google Scholar] [CrossRef]
- Zhao, H.; Li, Y.; Cao, Y.; Gong, G.; Zhou, Y.; Gao, X.X.; Pu, L.; Zhao, G. Spectroscopic studies of a BINAM-based sensor: Highly selective fluorescent recognition of lysine in water solution through a nucleophilic substitution reaction. Tetrahedron Lett. 2019, 60, 1238–1242. [Google Scholar] [CrossRef]
- Hao, J.; Wang, M.; Wang, S.; Huang, Y.; Cao, D. Dissolution-enhanced emission of 1,3,6,8-Tetrakis(p-benzoic acid)pyrene for detecting arginine and lysine amino acids. Dyes Pigm. 2020, 175, 108131. [Google Scholar] [CrossRef]
- Gong, Y.; Du, C.; Wang, X.; Guo, H.; Yang, F. First stable (Z)-configuration of cyanostilbene derivative: An effective “turn-on” fluorescent sensor for lysine in aqueous media. Microchem. J. 2021, 162, 105866. [Google Scholar] [CrossRef]
- Wang, T.; Pang, Q.; Tong, Z.; Xiang, H.; Xiao, N. A hydrazone-based spectroscopic off-on probe for sensing of basic arginine and lysine. Spectrochim. Acta Part A 2021, 258, 119824. [Google Scholar] [CrossRef]
- Ferlin, M.; Gatto, B.; Chiarelotto, G.; Palumbo, M. Pyrrolo-quinoline derivatives as potential antineoplastic drugs. Bioorg. Med. Chem. 2000, 8, 1415–1422. [Google Scholar]
- Ferlin, M.; Gatto, B.; Chiarelotto, G.; Palumbo, M. Novel pyrrolo [3, 2-f] quinolines: Synthesis and antiproliferative activity. Bioorg. Med. Chem. 2001, 9, 1843–1848. [Google Scholar] [CrossRef]
Figure 1.
Synthetic route of PQP-1. Reagent and condition: (a) POCl3, DMF, 30 °C, 8 h, 90%; (b) ethyl cyanoacetate, EtOH, reflux, 5 h, 85%.
Figure 1.
Synthetic route of PQP-1. Reagent and condition: (a) POCl3, DMF, 30 °C, 8 h, 90%; (b) ethyl cyanoacetate, EtOH, reflux, 5 h, 85%.
Figure 2.
(a) The fluorescence spectra of PQP-1 (10 μM) in deionized water after treatment with L-lysine (0–1000 μM) for 30 min; (b) The fluorescence intensity at around 420 nm has a good linear relationship with L-lysine concentrations (50–1000 μM). The data come from three parallel experiments.
Figure 2.
(a) The fluorescence spectra of PQP-1 (10 μM) in deionized water after treatment with L-lysine (0–1000 μM) for 30 min; (b) The fluorescence intensity at around 420 nm has a good linear relationship with L-lysine concentrations (50–1000 μM). The data come from three parallel experiments.
Figure 3.
The selectivity of PQP-1 for Lys compared with various ions, Hcy, GSH, glucose (GLu), and other amino acids. (a) PQP-1: 10 μM, Lys: 400 μM, other: 1 mM, (1) F−, (2) Cl−, (3) Br−, (4) I−, (5) NO3−, (6) NO2−, (7) HCO3−, (8) CO32−, (9) SO42−, (10) S2O32−, (11) S2−, (12) Ac−, (13) −OOCCOO−, (14) EDTA2−, (15) H2O2, (16) Lys; (b) PQP-1: 10 μM, Lys: 400 μM, other: 1 mM, (1) K+, (2) Na+, (3) Ca+, (4) Ba2+, (5) Cu2+, (6) Mn2+, (7) Zn2+, (8) Mg2+, (9) NH4+, (10) Lys; (c) PQP-1: 10 μM, Lys: 400 μM, other: 1 mM; (d) PQP-1: 10 μM.
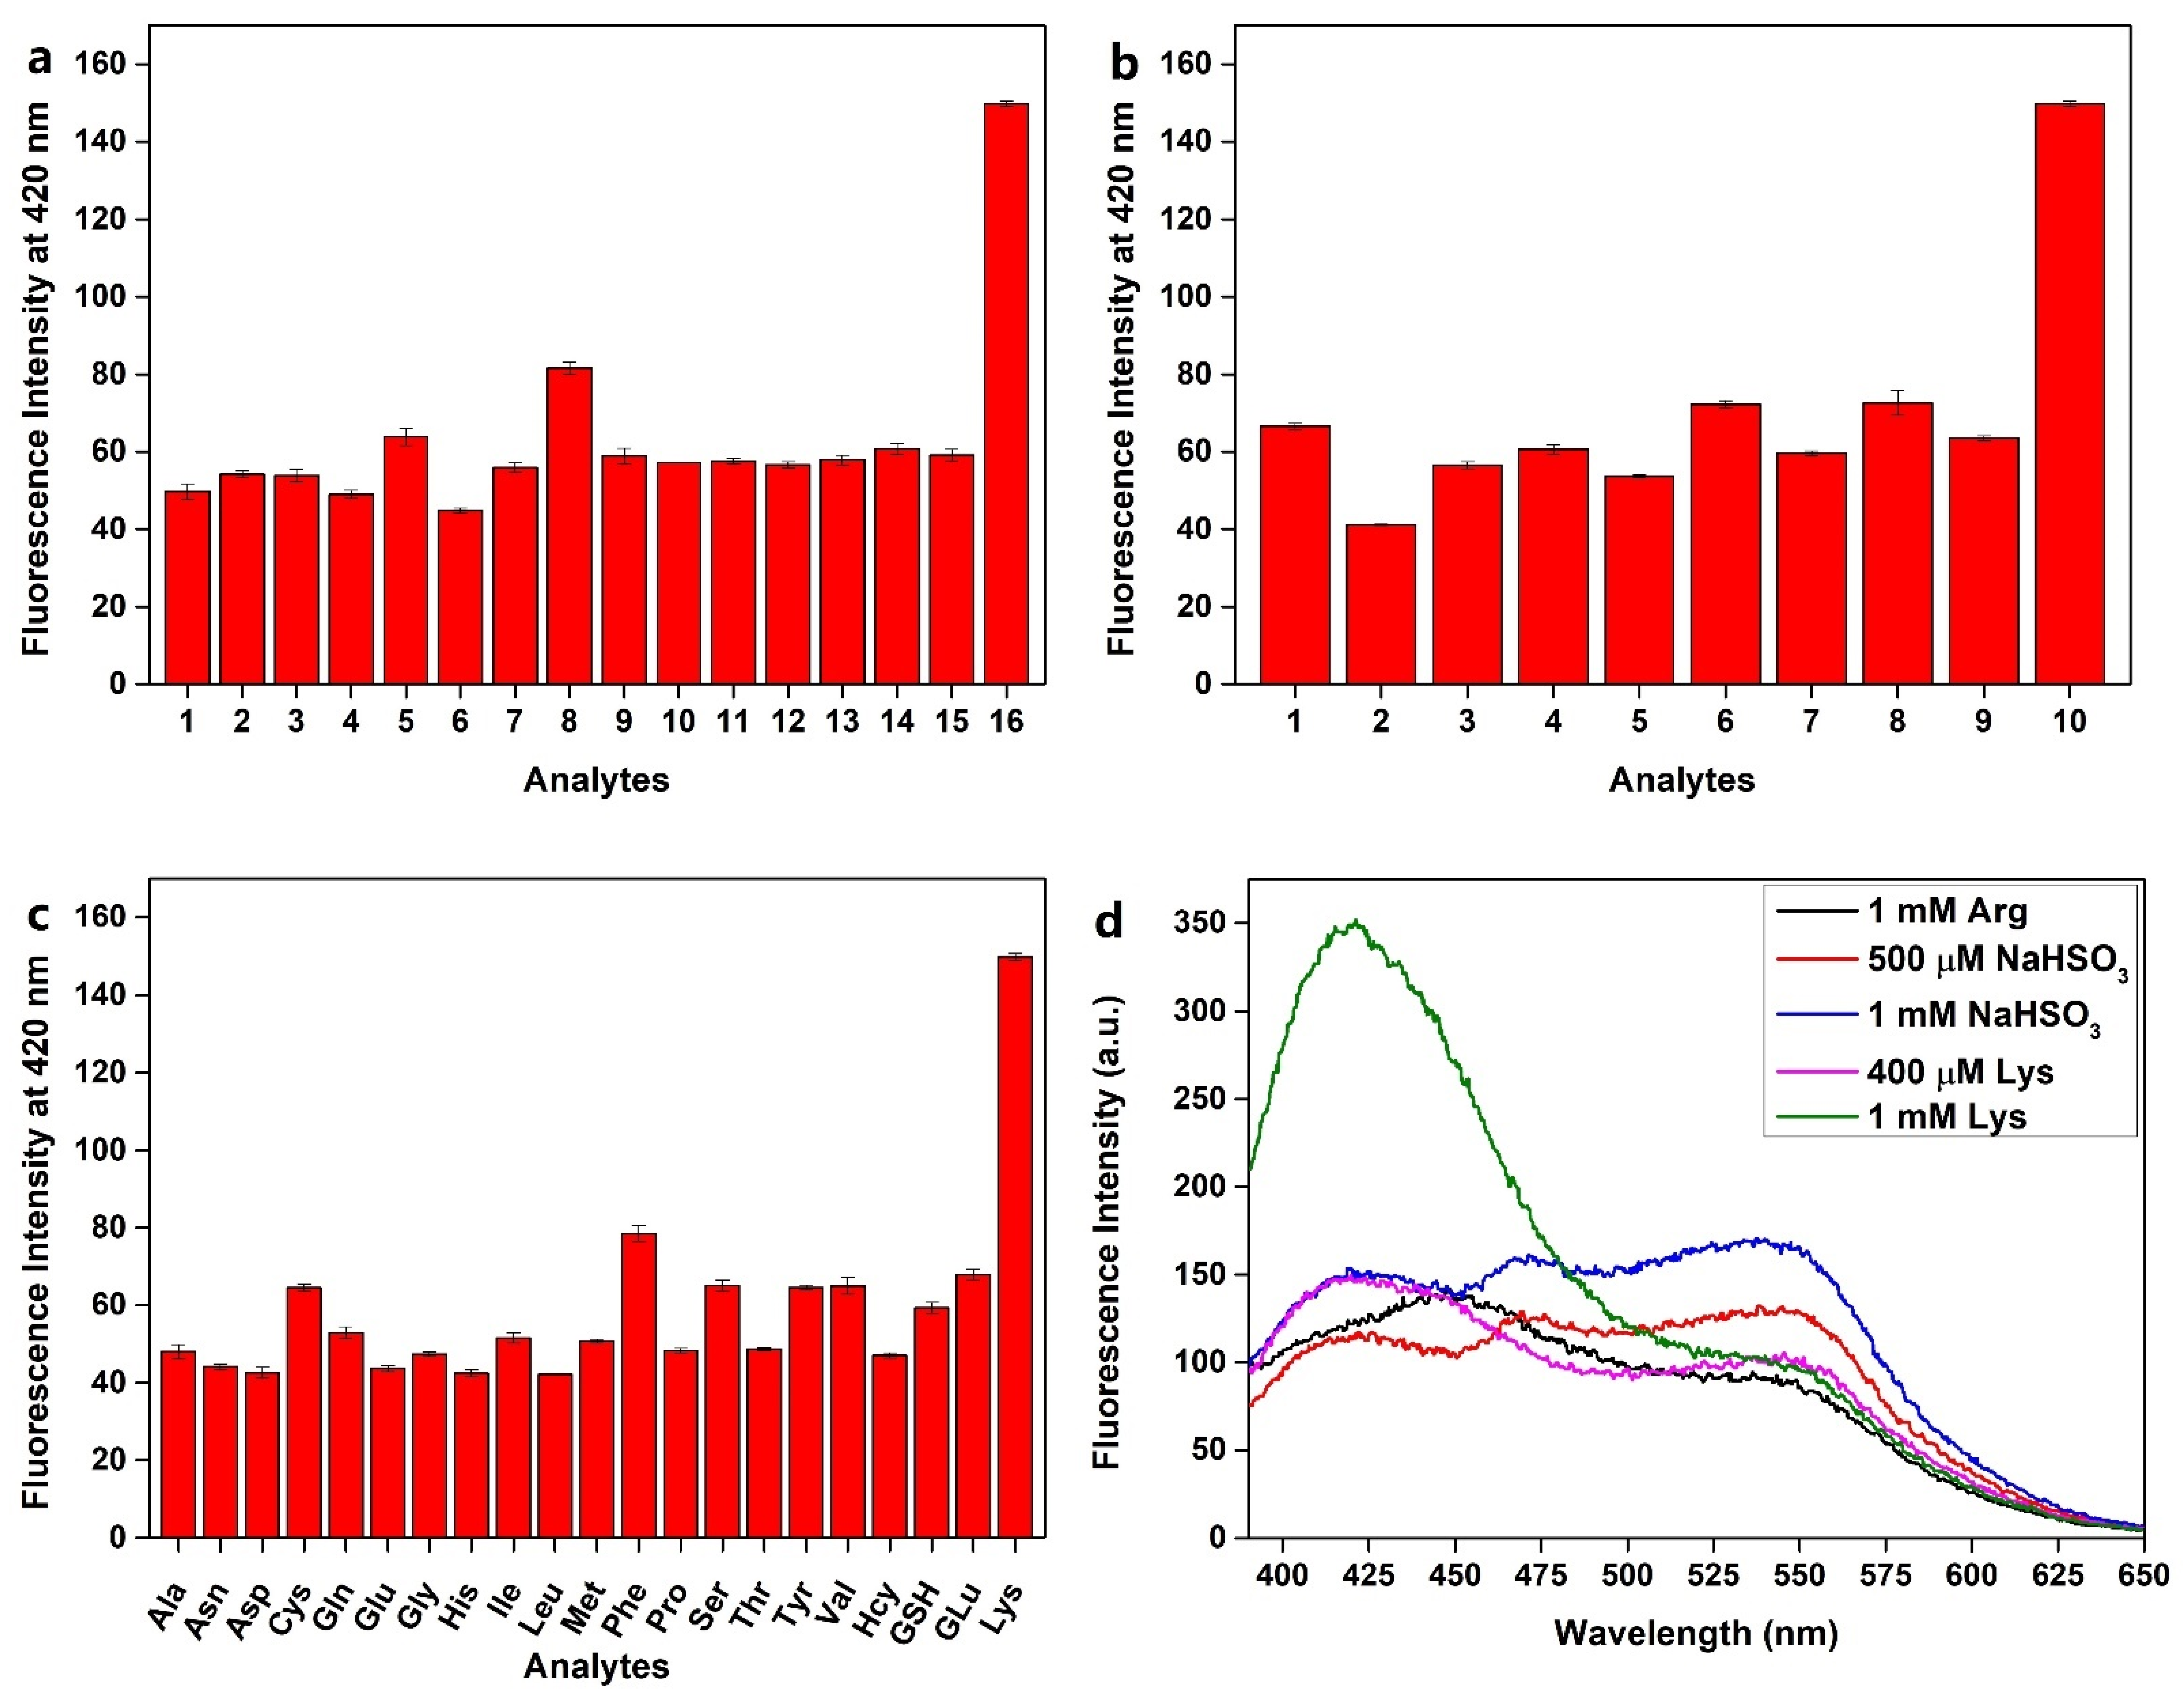
Figure 4.
Proposed response mechanism between PQP-1 and lysine.
Figure 5.
1H NMR titration experiments of PQP-1 in DMSO-d6 (0.55 mL) on lysine. PQP-1: 0.0051 g, 15 μmol. (a) The comparison of 1H NMR spectra of PQP-1 and the mixture after adding different concentrations of lysine. (b) The changes of peak type of Hb.
Figure 5.
1H NMR titration experiments of PQP-1 in DMSO-d6 (0.55 mL) on lysine. PQP-1: 0.0051 g, 15 μmol. (a) The comparison of 1H NMR spectra of PQP-1 and the mixture after adding different concentrations of lysine. (b) The changes of peak type of Hb.
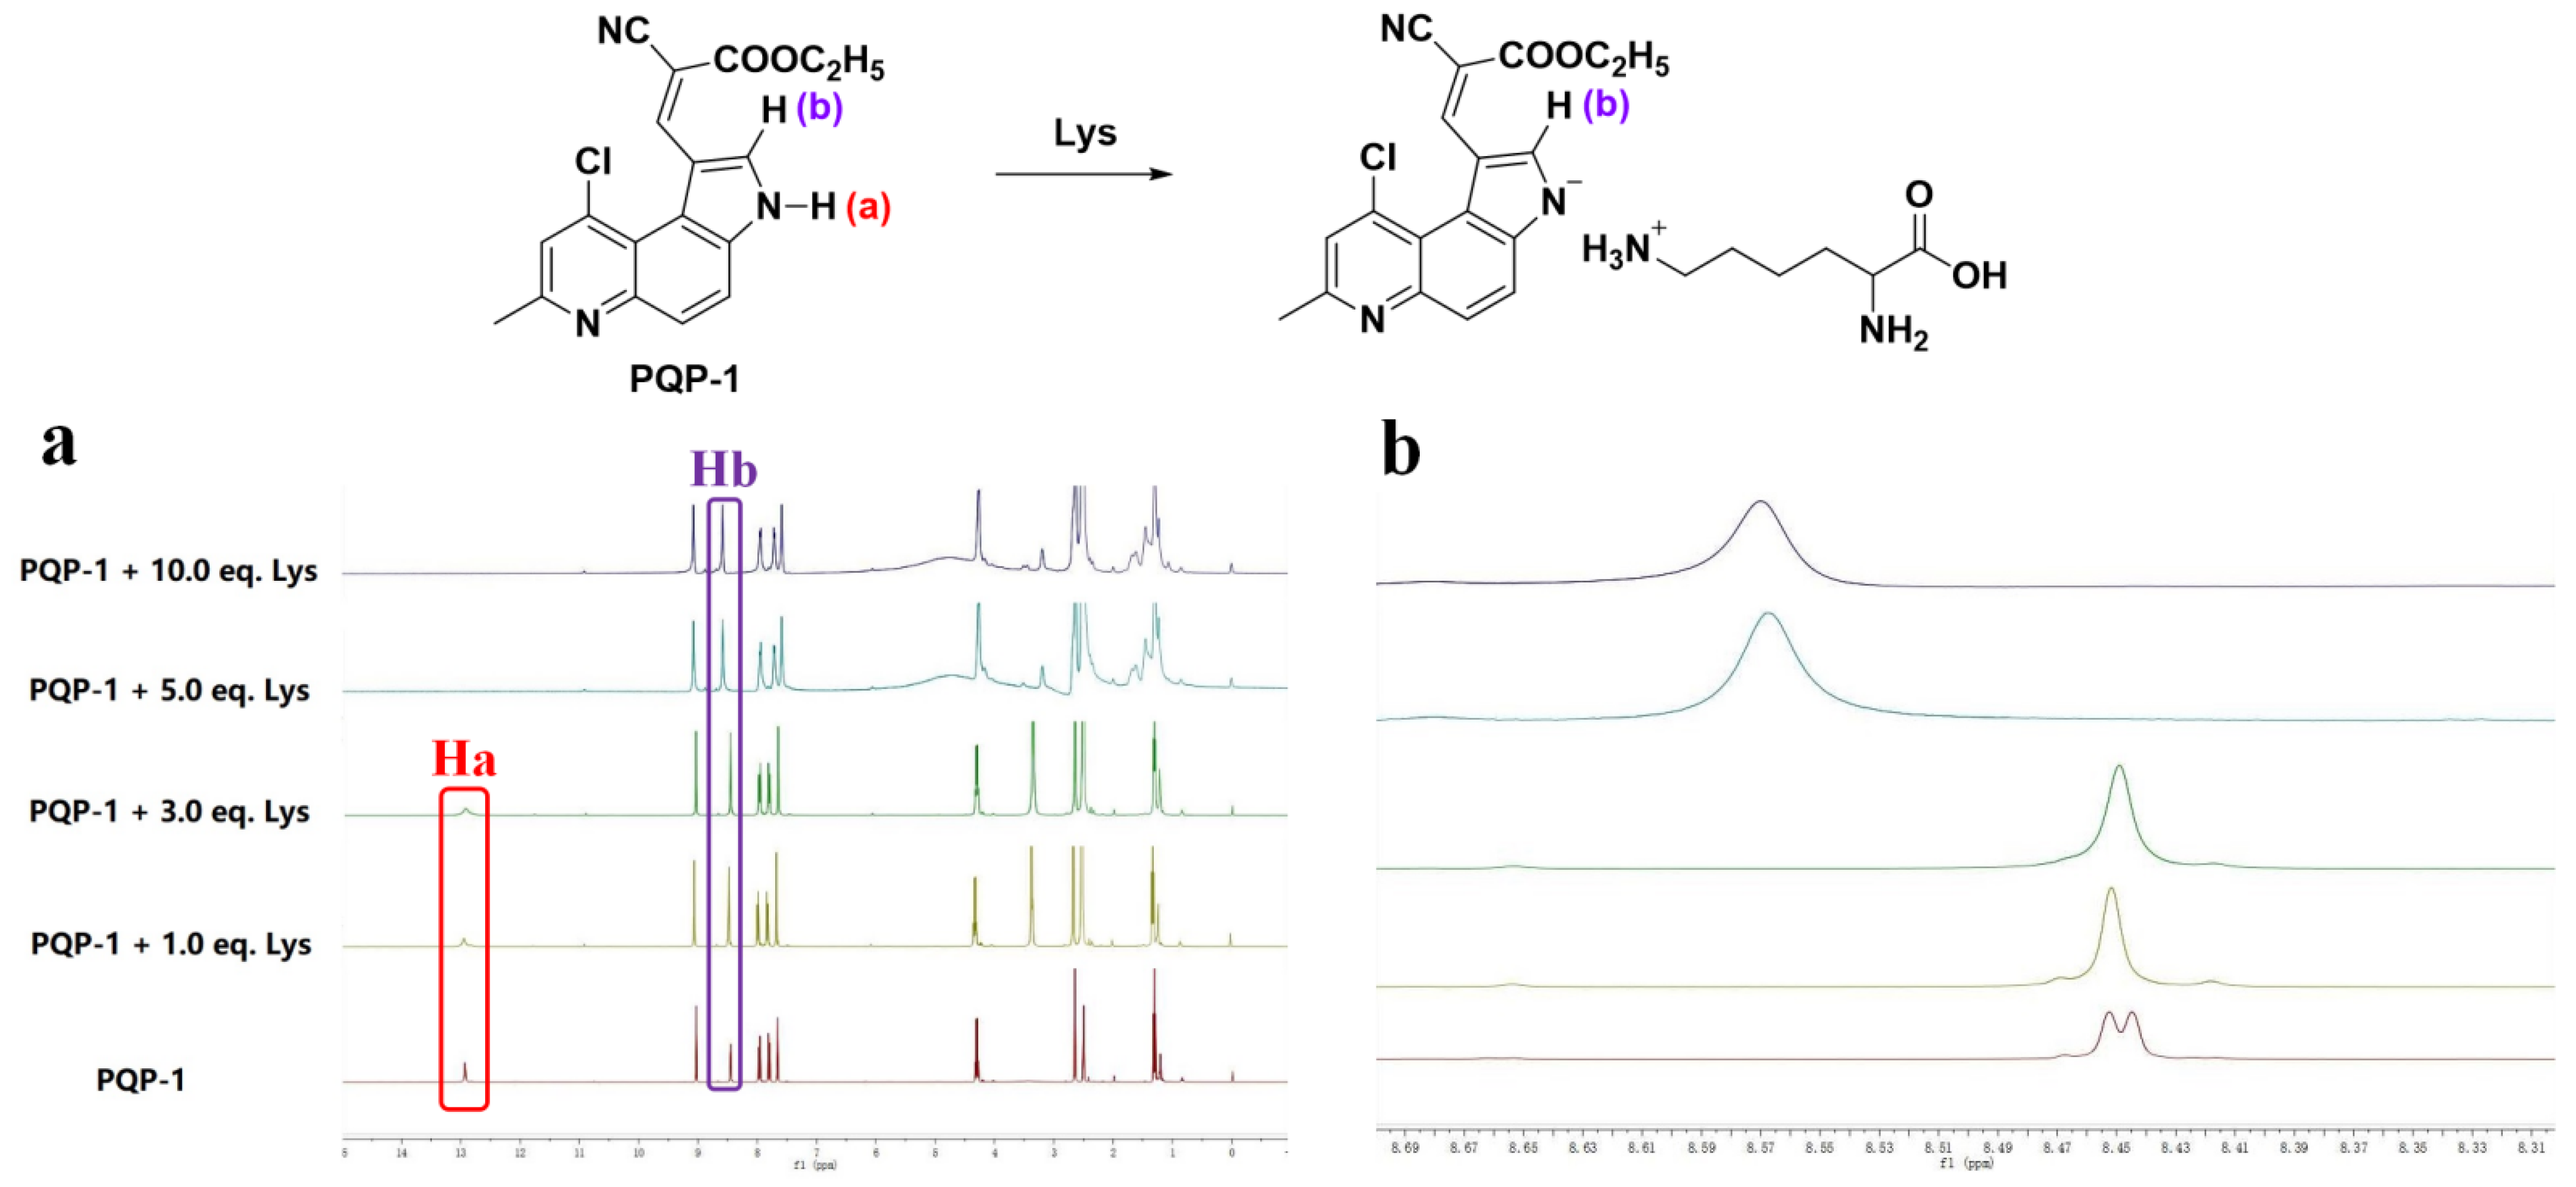
Figure 6.
Fluorescence imaging of lysine in living HeLa cells. (a–c) images of HeLa cells treated with PQP-1 (10 μM) for 30 min; (d–f) images of HeLa cells pretreated with PQP-1 (10 μM) for 30 min, then incubated with 500 μM L-lysine for an additional 30 min; (g–i) images of HeLa cells pre-incubated with PQP-1 (10 μM) for 30 min, then treated with 1 mM l-lysine for an additional 30 min. Excitation at 405 nm; Scale bar: 50 μm.

Table 1.
Detection of l-lysine concentrations in natural mineral water for drinking. l-lysine with known concentrations was added into the natural mineral water for drinking. The concentration of PQP-1 was 10 μM. The data come from three parallel experiments.
Table 1.
Detection of l-lysine concentrations in natural mineral water for drinking. l-lysine with known concentrations was added into the natural mineral water for drinking. The concentration of PQP-1 was 10 μM. The data come from three parallel experiments.
| Entry | Added Concentrations (μM) | Detected Concentrations (μM) | Recovery (%) |
|---|---|---|---|
| 1 | 80 | 80.37 ± 1.43 | 100.46 |
| 2 | 220 | 224.25 ± 2.86 | 101.93 |
| 3 | 490 | 484.95 ± 0.45 | 98.97 |
| 4 | 750 | 724.84 ± 3.04 | 96.65 |
Publisher’s Note: MDPI stays neutral with regard to jurisdictional claims in published maps and institutional affiliations. |
© 2022 by the authors. Licensee MDPI, Basel, Switzerland. This article is an open access article distributed under the terms and conditions of the Creative Commons Attribution (CC BY) license (https://creativecommons.org/licenses/by/4.0/).
Share and Cite
MDPI and ACS Style
Yang, B.; Zhou, J.; Huang, X.; Chen, Z.; Tian, S.; Shi, Y. A New Pyrroloquinoline-Derivative-Based Fluorescent Probe for the Selective Detection and Cell Imaging of Lysine. Pharmaceuticals 2022, 15, 474. https://doi.org/10.3390/ph15040474
AMA Style
Yang B, Zhou J, Huang X, Chen Z, Tian S, Shi Y. A New Pyrroloquinoline-Derivative-Based Fluorescent Probe for the Selective Detection and Cell Imaging of Lysine. Pharmaceuticals. 2022; 15(4):474. https://doi.org/10.3390/ph15040474
Chicago/Turabian StyleYang, Bing, Jiahua Zhou, Xu Huang, Zhongping Chen, Shu Tian, and Yujun Shi. 2022. "A New Pyrroloquinoline-Derivative-Based Fluorescent Probe for the Selective Detection and Cell Imaging of Lysine" Pharmaceuticals 15, no. 4: 474. https://doi.org/10.3390/ph15040474
Note that from the first issue of 2016, this journal uses article numbers instead of page numbers. See further details here.