
Identification of Novel Arachidonic Acid 15-Lipoxygenase Inhibitors Based on the Bayesian Classifier Model and Computer-Aided High-Throughput Virtual Screening

Abstract
:1. Introduction
2. Results
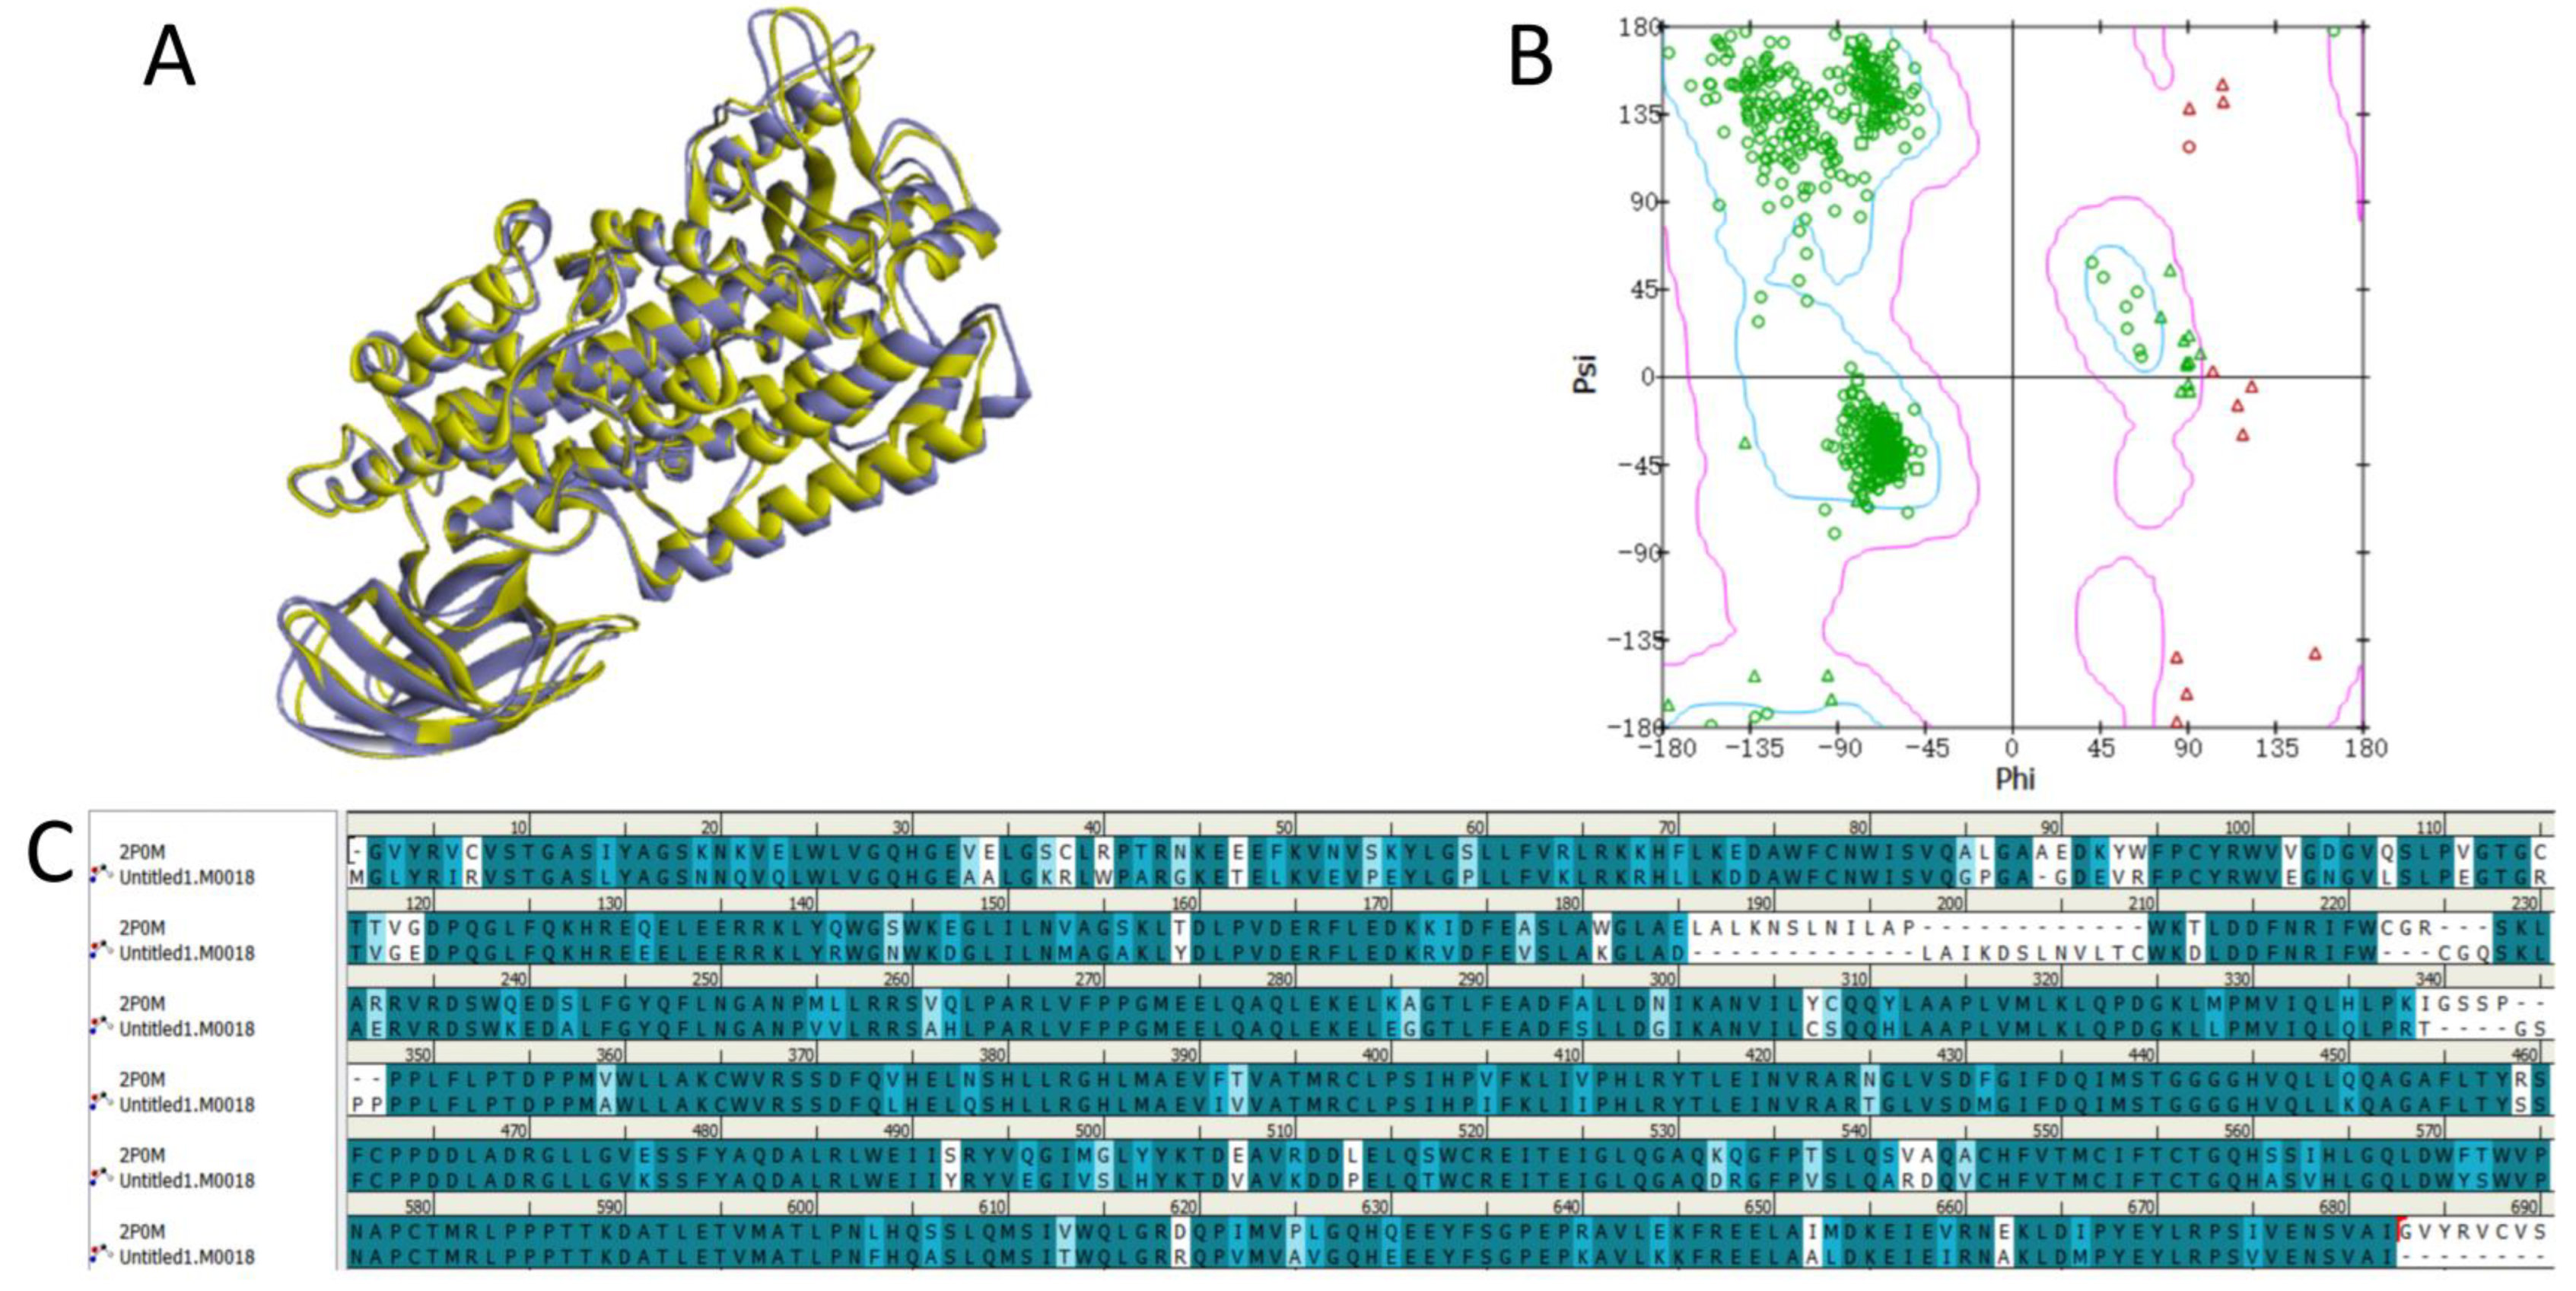
2.1. Protein Homology Modeling
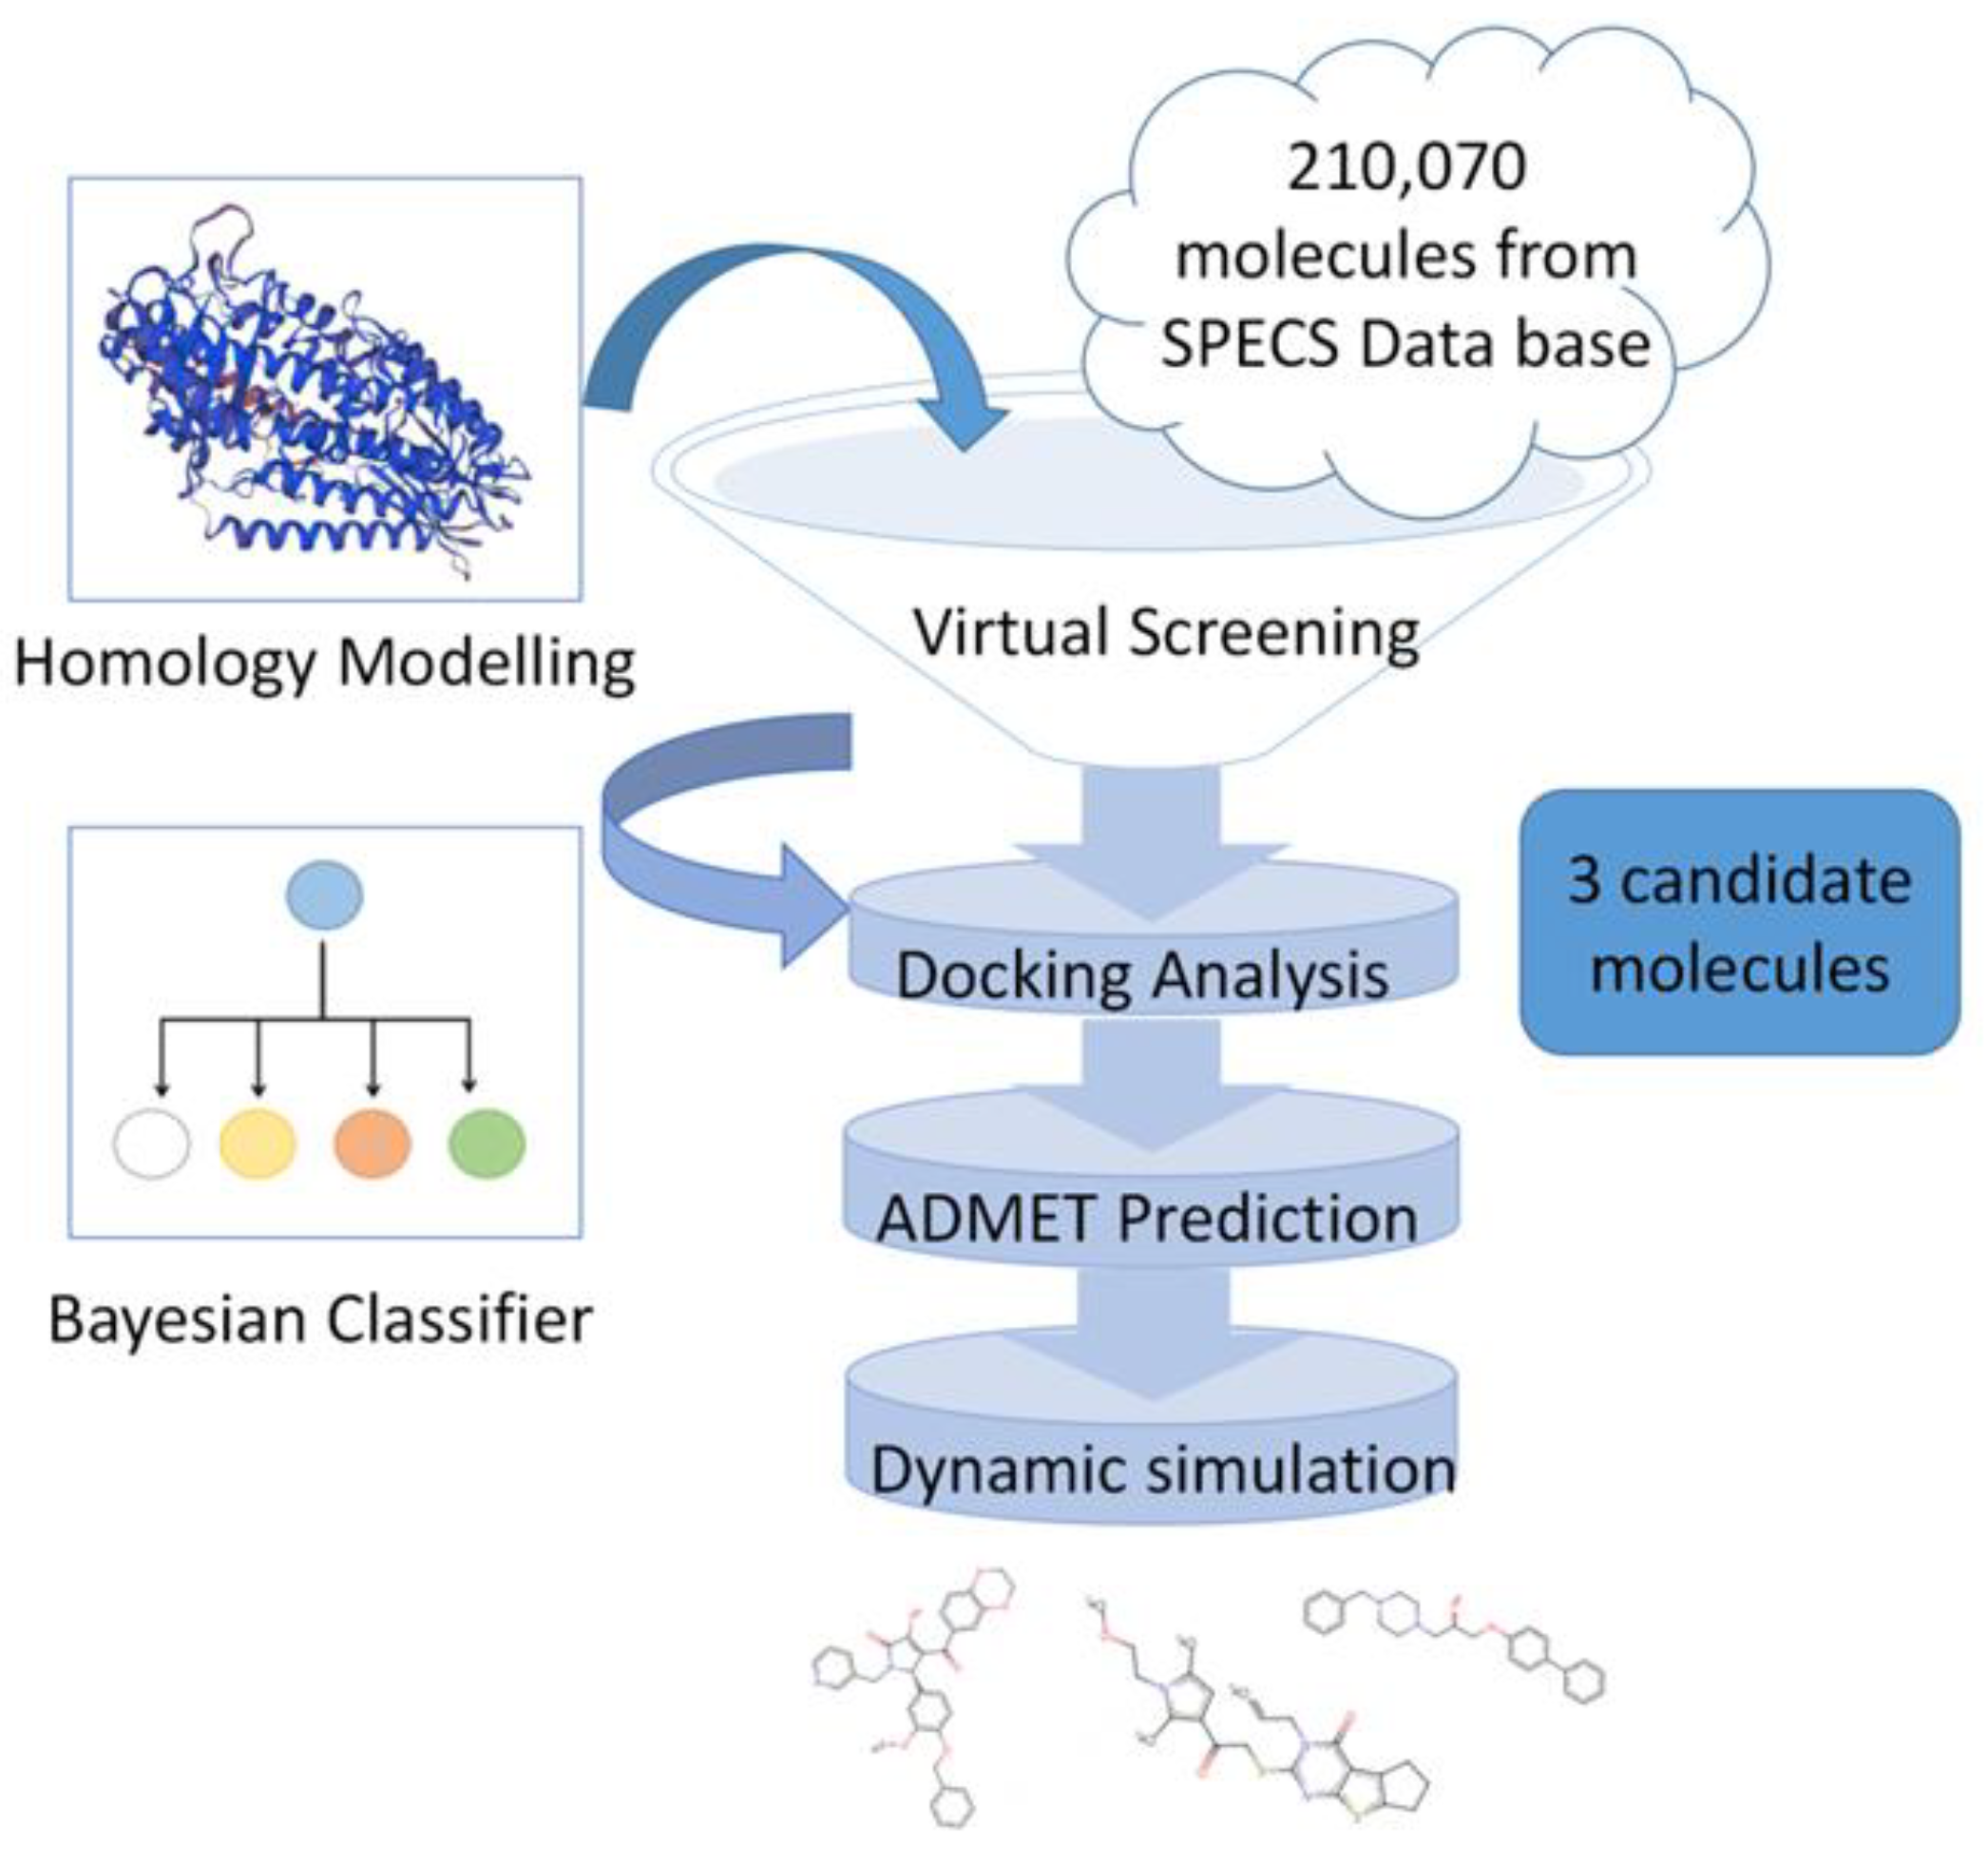
2.2. Structure-Based, High-Throughput Virtual Screening
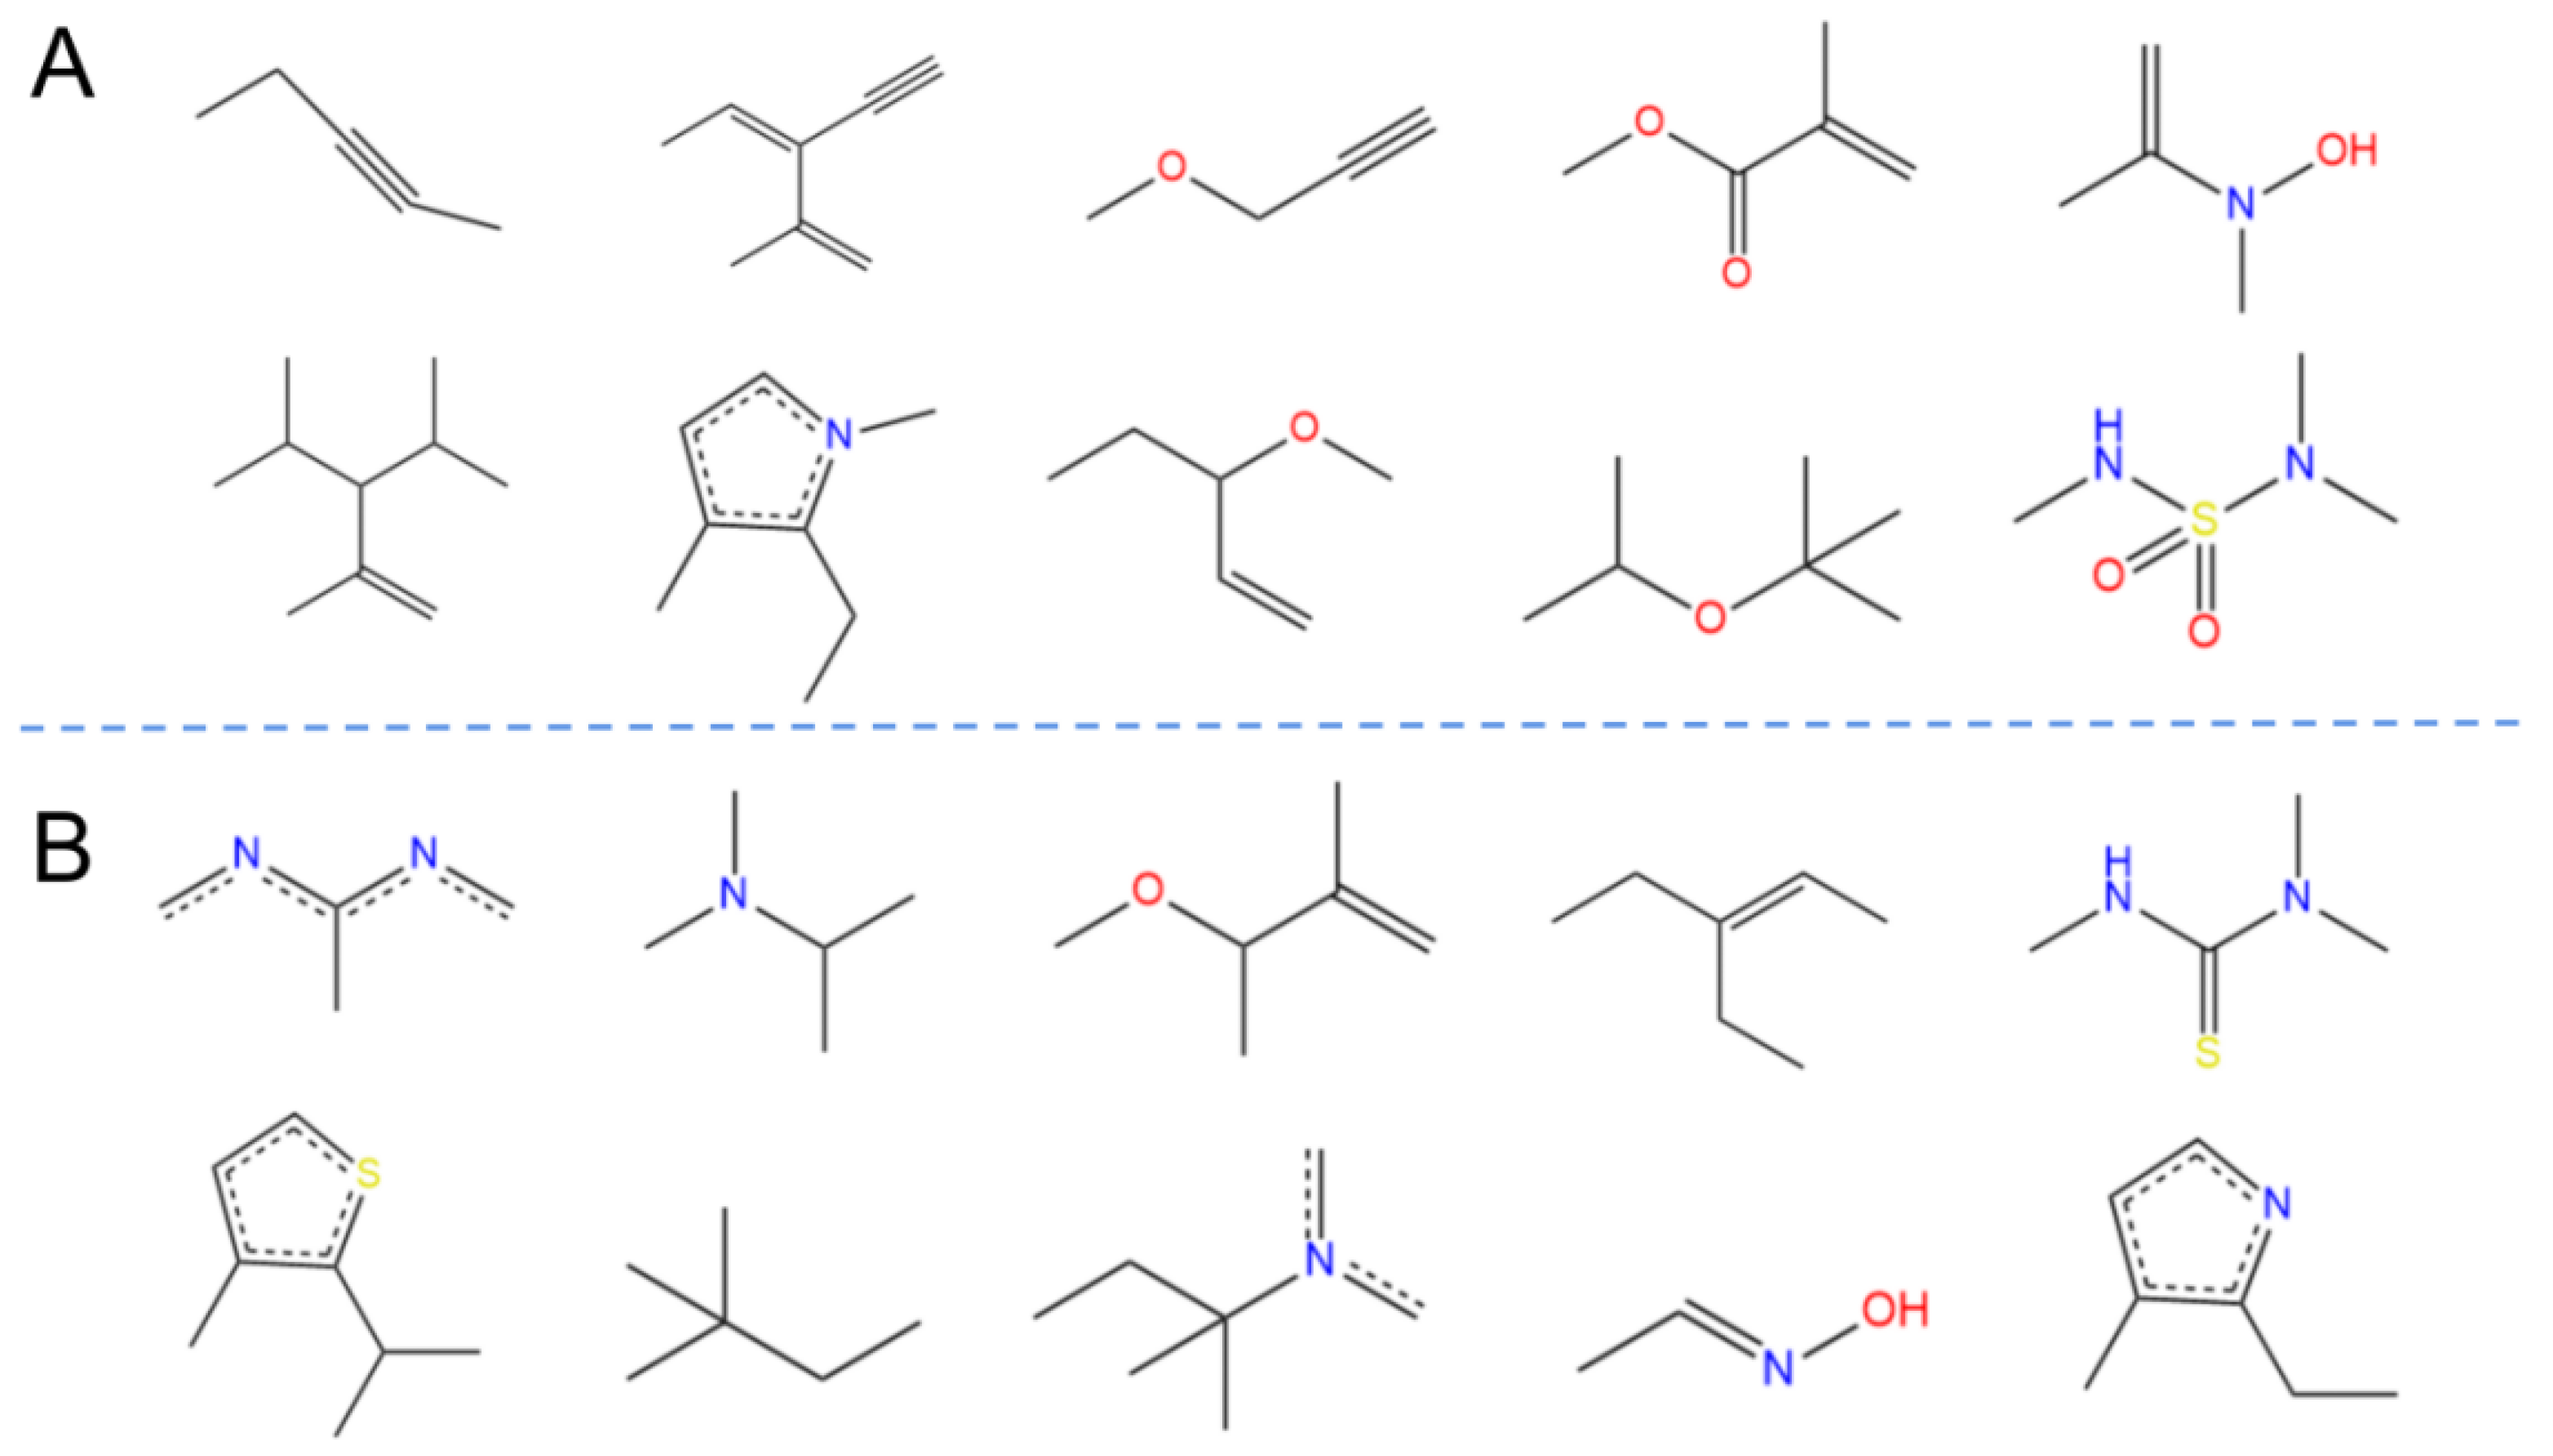
2.3. Chemical Spatial Distribution Analysis
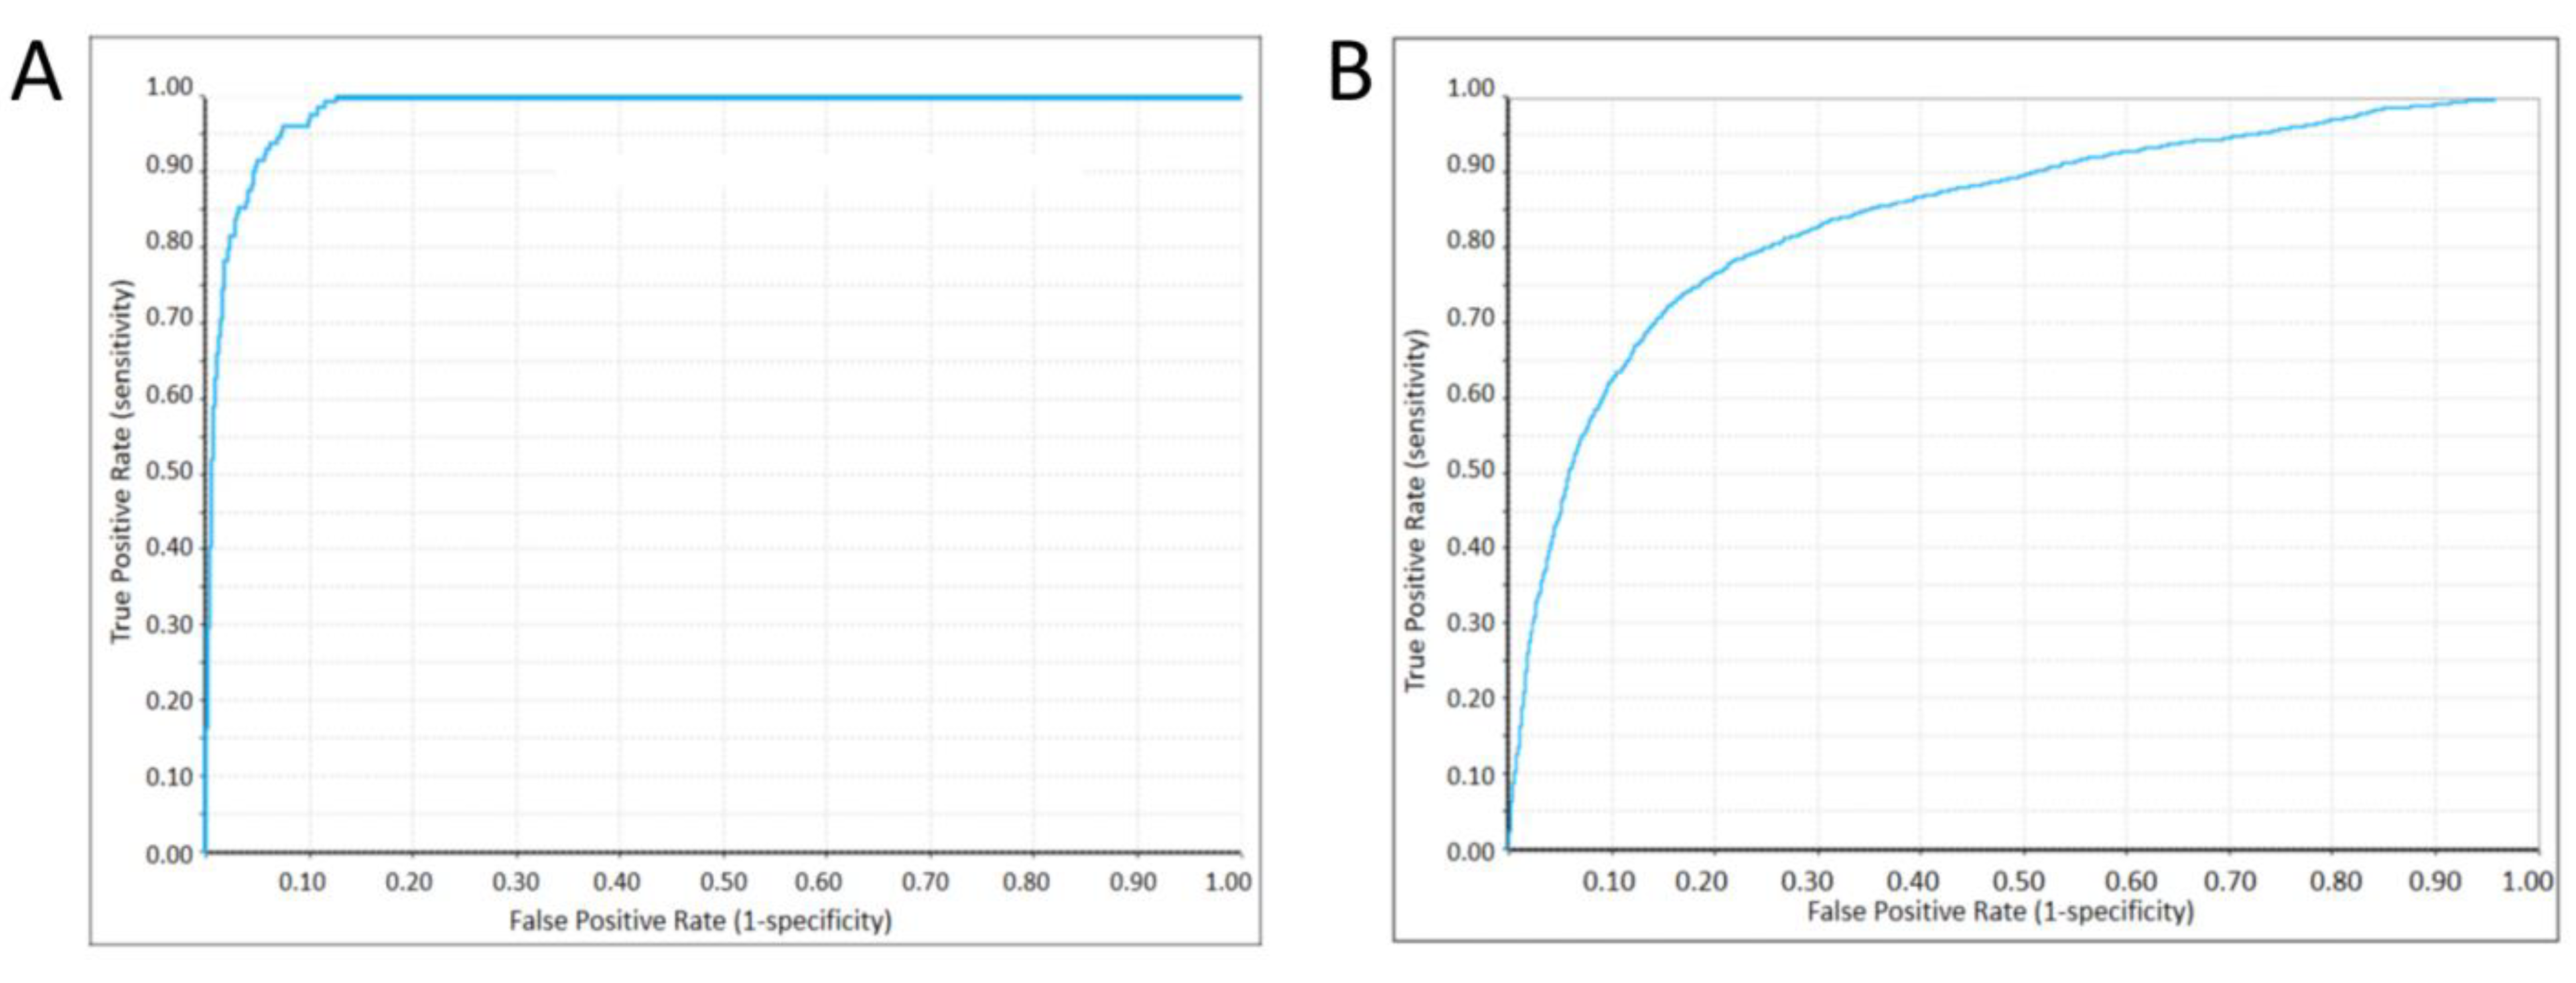
2.4. Machine Learning Classifier Models
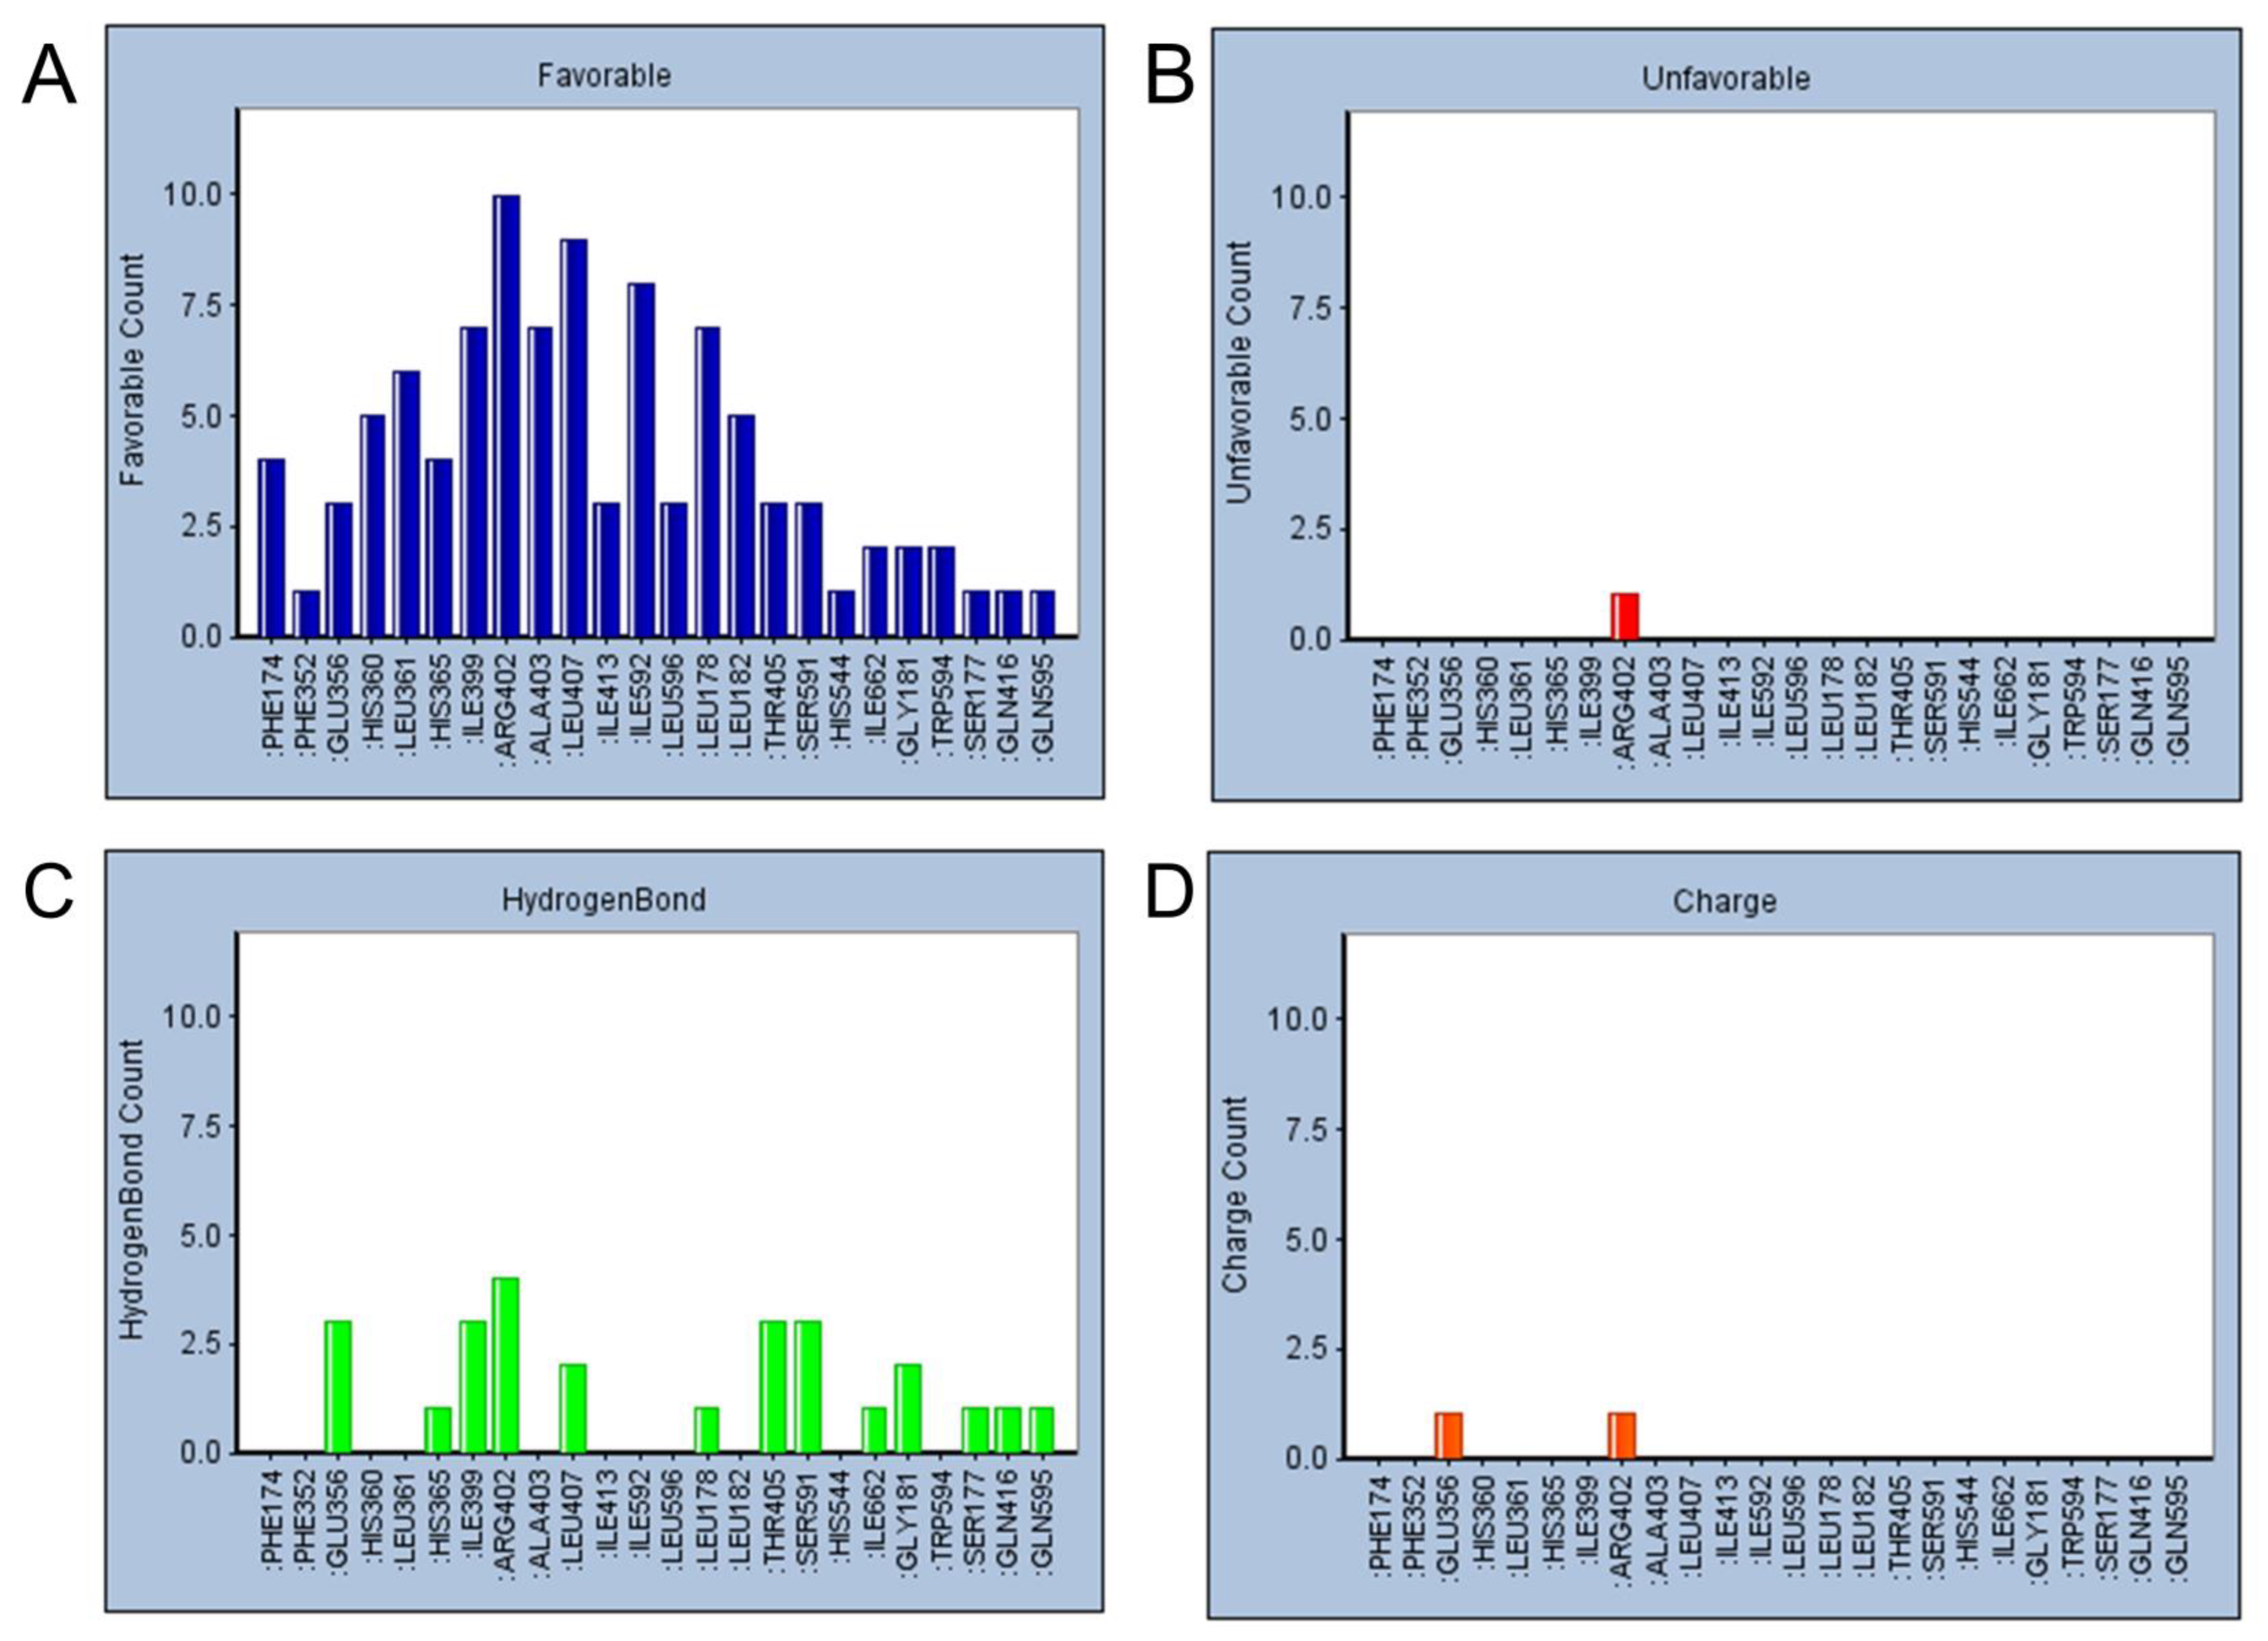
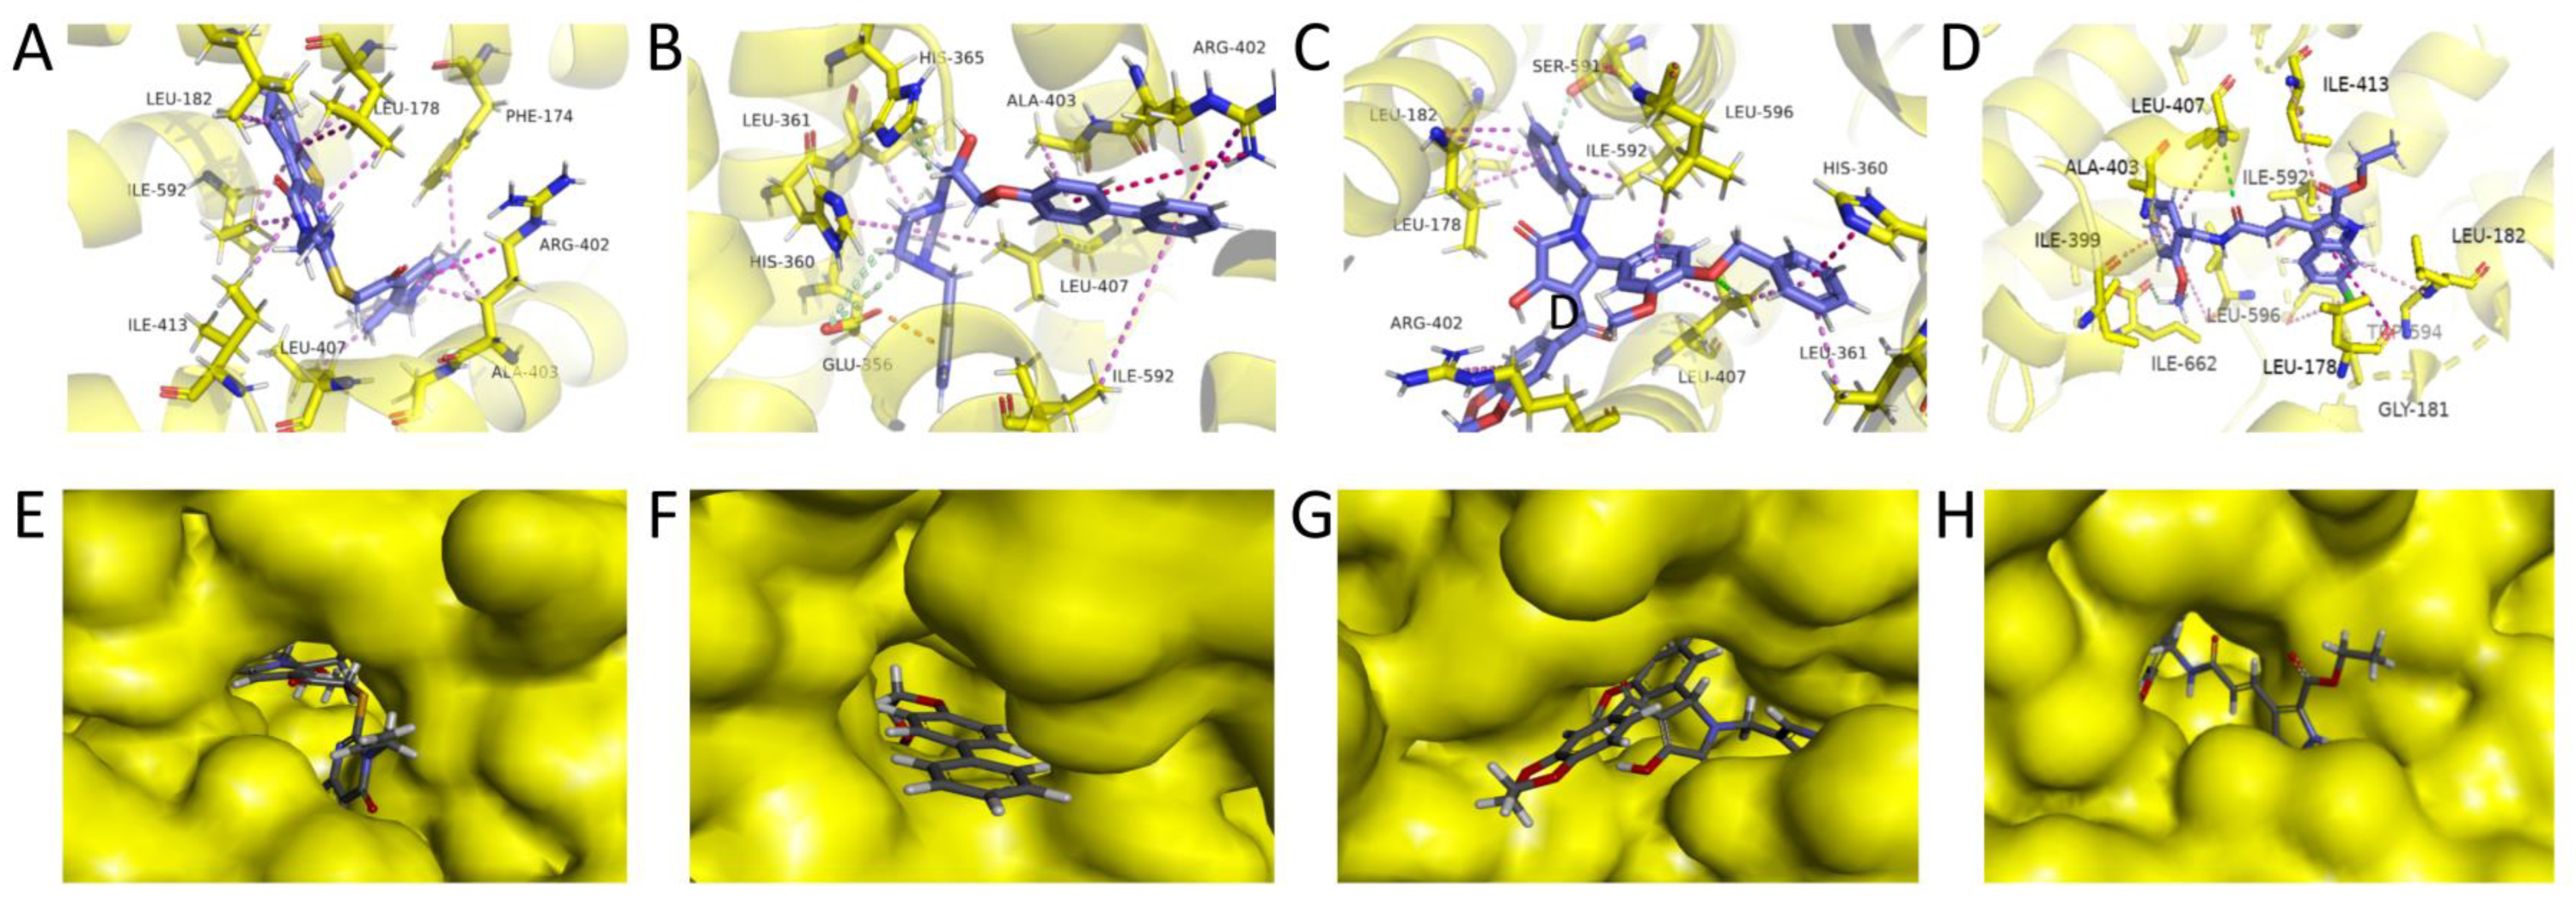
2.5. Refined Molecular Docking Analysis
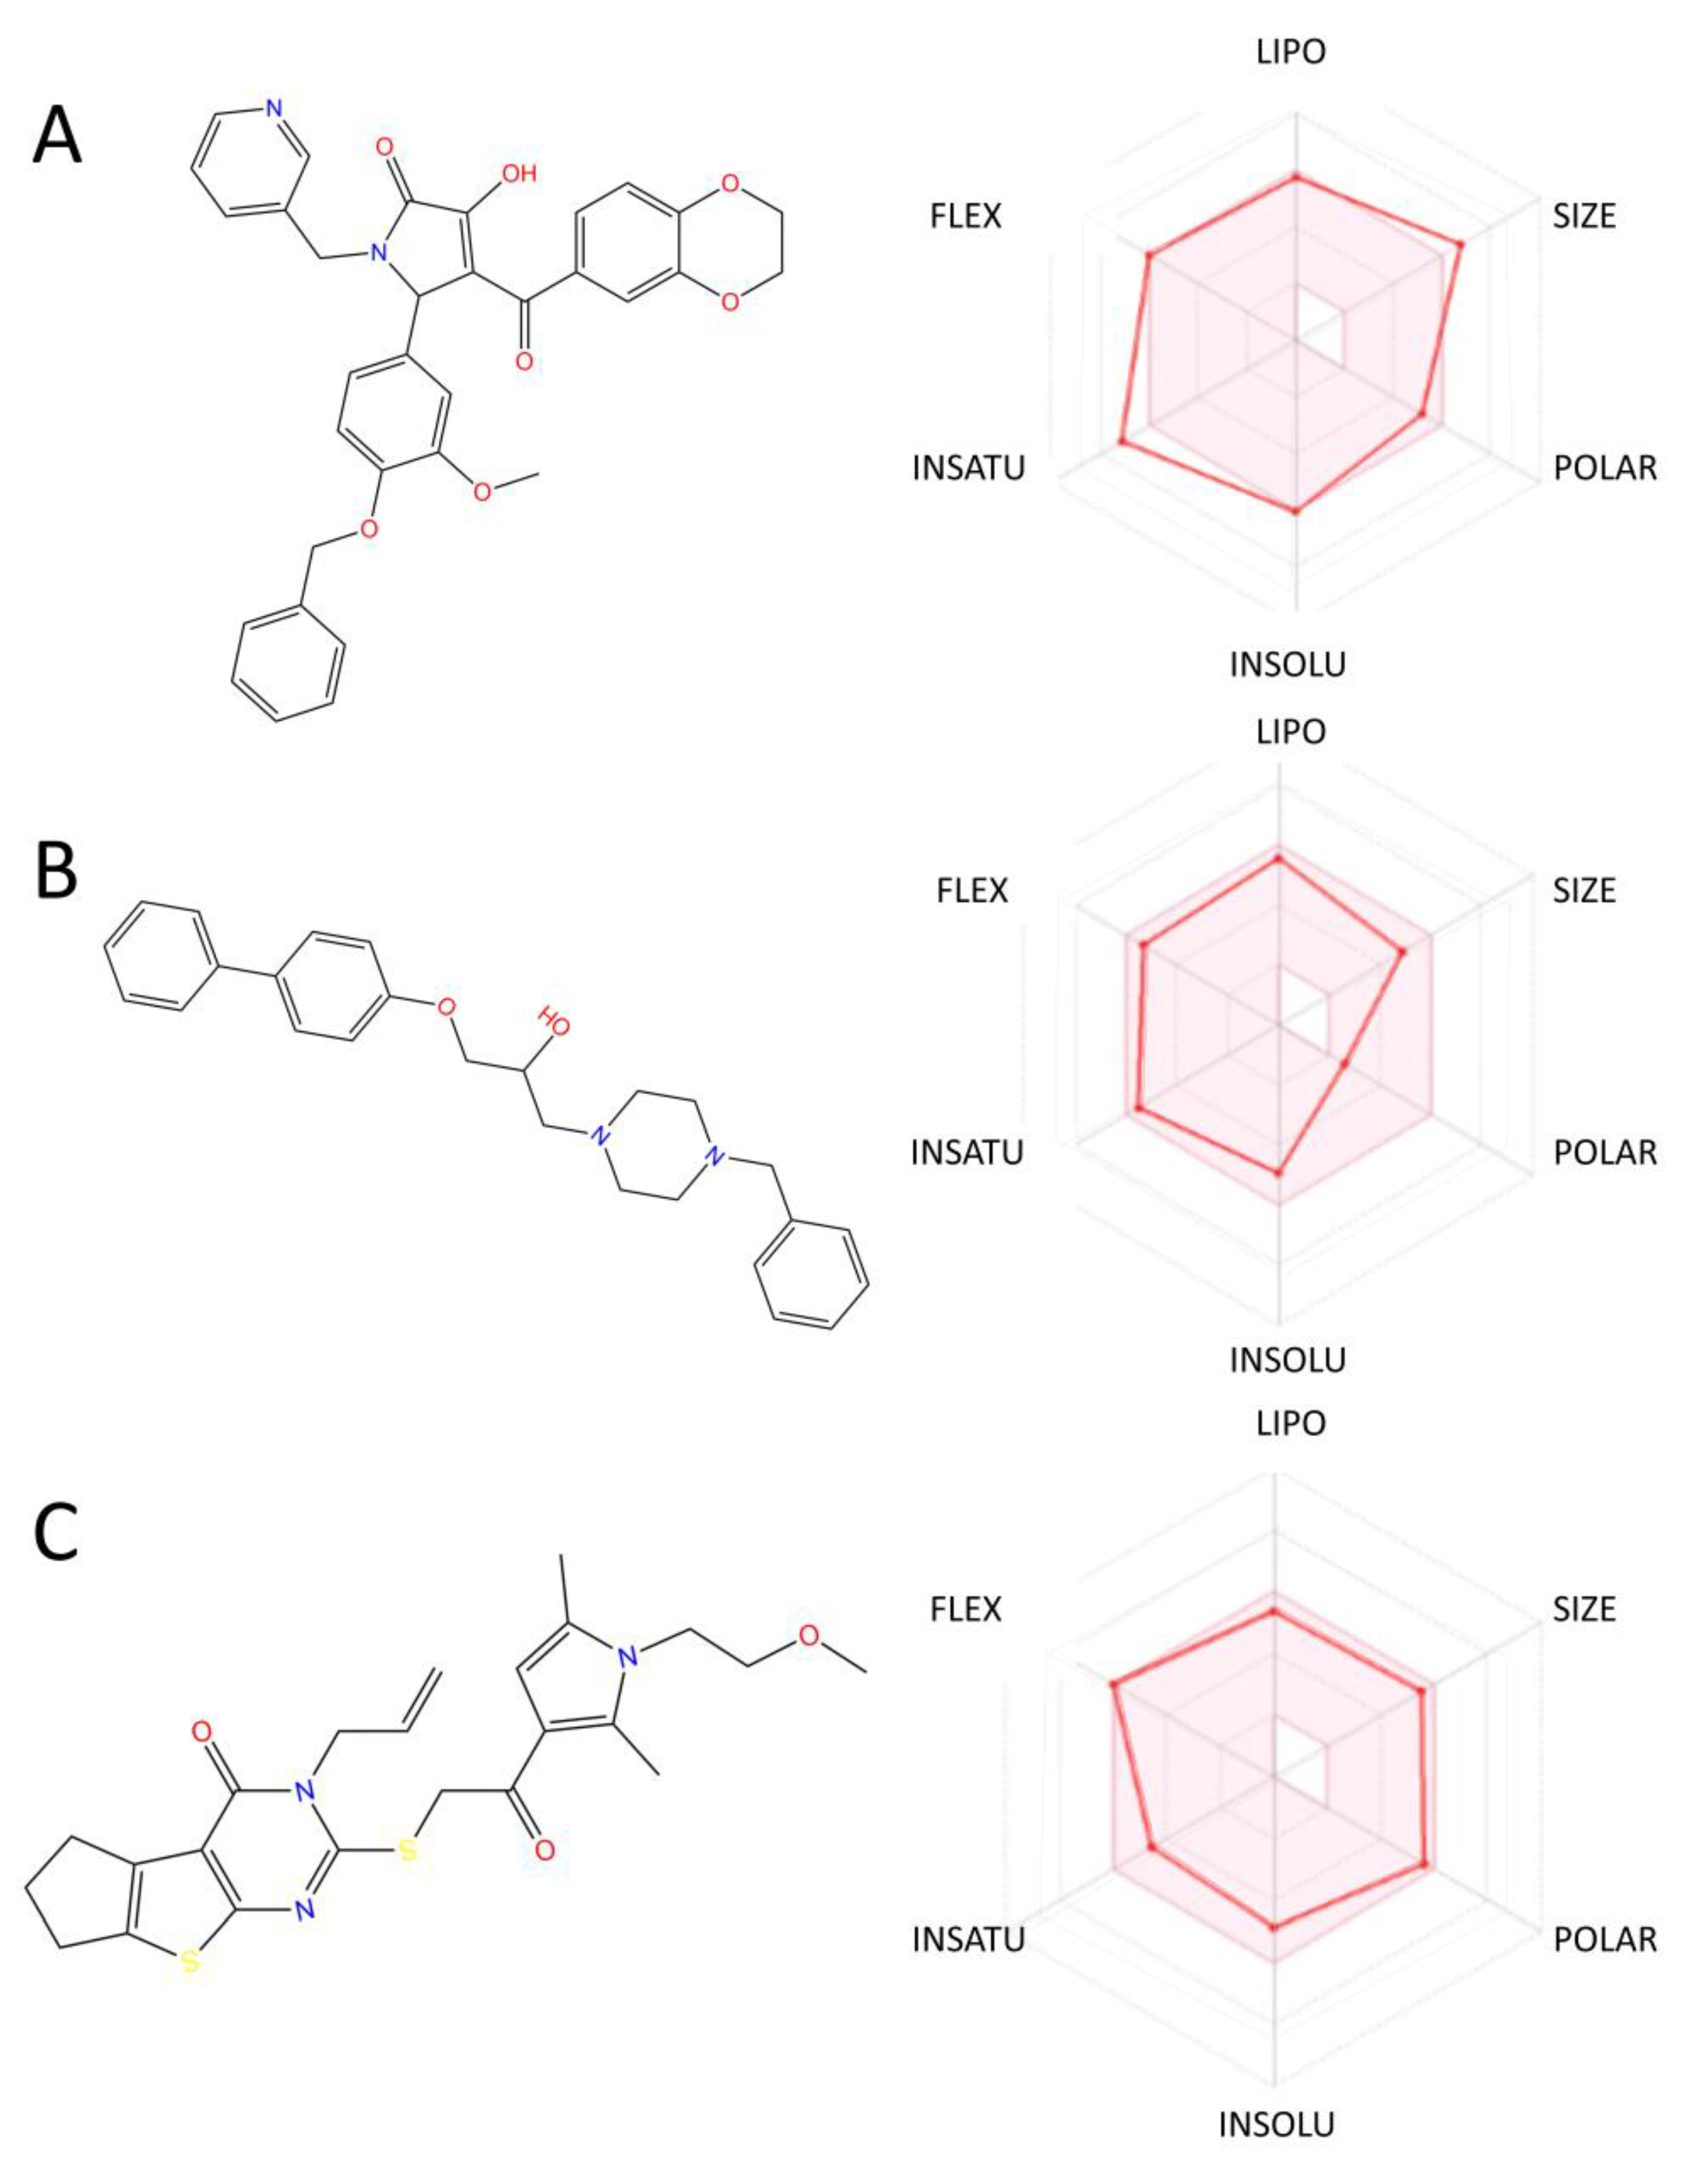
2.6. ADMET Property Prediction
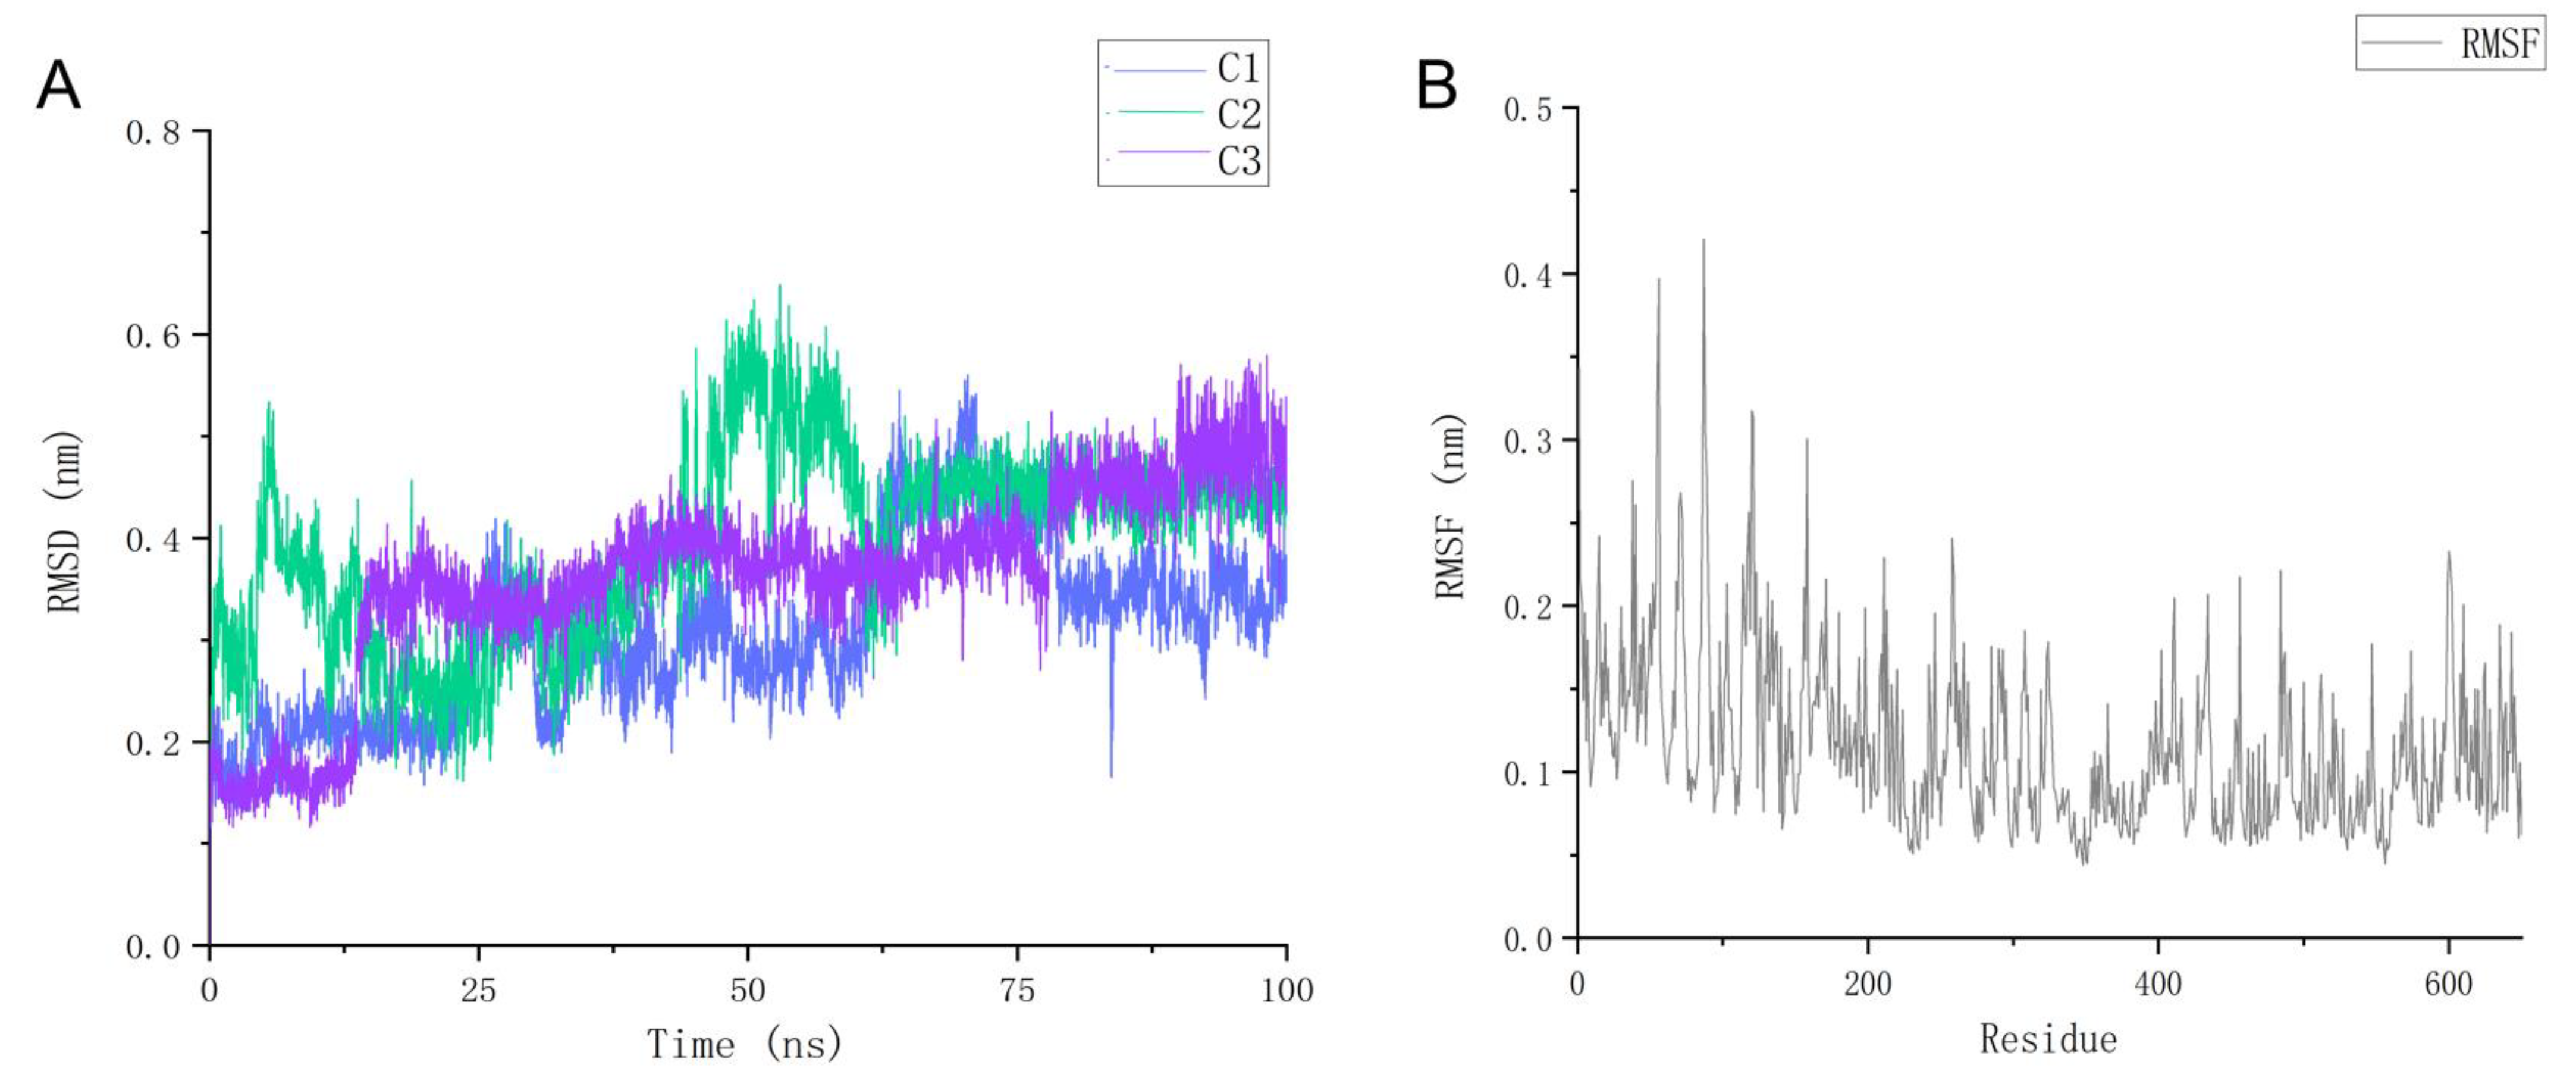
2.7. Molecular Dynamics Simulation
3. Discussion
4. Materials and Methods
4.1. Protein Homology Modeling
4.2. Protein Model Validation
4.3. Structure-Based High-Throughput Molecular Screening
4.4. Molecular Descriptor Calculation and Principal Component Analysis
4.5. Machine Learning Classifier Construction
4.6. High Accuracy Molecular Docking
4.7. ADMET Property Prediction
4.8. Molecular Kinetic Simulations
5. Conclusions
Supplementary Materials
Author Contributions
Funding
Institutional Review Board Statement
Informed Consent Statement
Data Availability Statement
Acknowledgments
Conflicts of Interest
References
- Dixon, S.J.; Lemberg, K.M.; Lamprecht, M.R.; Skouta, R.; Zaitsev, E.M.; Gleason, C.E.; Patel, D.N.; Bauer, A.J.; Cantley, A.M.; Yang, W.S.; et al. Ferroptosis: An iron-dependent form of nonapoptotic cell death. Cell 2012, 149, 1060–1072. [Google Scholar] [CrossRef] [Green Version]
- Basit, F.; van Oppen, L.M.; Schockel, L.; Bossenbroek, H.M.; van Emst-de Vries, S.E.; Hermeling, J.C.; Grefte, S.; Kopitz, C.; Heroult, M.; Hgm Willems, P.; et al. Mitochondrial complex I inhibition triggers a mitophagy-dependent ROS increase leading to necroptosis and ferroptosis in melanoma cells. Cell Death Dis. 2017, 8, e2716. [Google Scholar] [CrossRef] [Green Version]
- Park, E.; Chung, S.W. ROS-mediated autophagy increases intracellular iron levels and ferroptosis by ferritin and transferrin receptor regulation. Cell Death Dis. 2019, 10, 822. [Google Scholar] [CrossRef] [Green Version]
- Sui, X.; Zhang, R.; Liu, S.; Duan, T.; Zhai, L.; Zhang, M.; Han, X.; Xiang, Y.; Huang, X.; Lin, H.; et al. RSL3 Drives Ferroptosis Through GPX4 Inactivation and ROS Production in Colorectal Cancer. Front. Pharmacol. 2018, 9, 1371. [Google Scholar] [CrossRef] [Green Version]
- Xu, G.; Wang, H.; Li, X.; Huang, R.; Luo, L. Recent progress on targeting ferroptosis for cancer therapy. Biochem. Pharmacol. 2021, 190, 114584. [Google Scholar] [CrossRef]
- Sun, Y.; Chen, P.; Zhai, B.; Zhang, M.; Xiang, Y.; Fang, J.; Xu, S.; Gao, Y.; Chen, X.; Sui, X.; et al. The emerging role of ferroptosis in inflammation. Biomed. Pharmacol. 2020, 127, 110108. [Google Scholar] [CrossRef]
- Mou, Y.; Wang, J.; Wu, J.; He, D.; Zhang, C.; Duan, C.; Li, B. Ferroptosis, a new form of cell death: Opportunities and challenges in cancer. J. Hematol. Oncol. 2019, 12, 34. [Google Scholar] [CrossRef] [Green Version]
- Li, D.; Li, Y. The interaction between ferroptosis and lipid metabolism in cancer. Signal Transduct. Target. Ther. 2020, 5, 108. [Google Scholar] [CrossRef]
- Jiang, X.; Stockwell, B.R.; Conrad, M. Ferroptosis: Mechanisms, biology and role in disease. Nat. Rev. Mol. Cell Biol. 2021, 22, 266–282. [Google Scholar] [CrossRef]
- Qiu, Y.; Cao, Y.; Cao, W.; Jia, Y.; Lu, N. The Application of Ferroptosis in Diseases. Pharmacol. Res. 2020, 159, 104919. [Google Scholar] [CrossRef]
- Yang, W.S.; Kim, K.J.; Gaschler, M.M.; Patel, M.; Shchepinov, M.S.; Stockwell, B.R. Peroxidation of polyunsaturated fatty acids by lipoxygenases drives ferroptosis. Proc. Natl. Acad. Sci. USA 2016, 113, E4966–E4975. [Google Scholar] [CrossRef] [Green Version]
- Coffey, R.; Nam, H.; Knutson, M.D. Microarray analysis of rat pancreas reveals altered expression of Alox15 and regenerating islet-derived genes in response to iron deficiency and overload. PLoS ONE 2014, 9, e86019. [Google Scholar] [CrossRef] [Green Version]
- Shintoku, R.; Takigawa, Y.; Yamada, K.; Kubota, C.; Yoshimoto, Y.; Takeuchi, T.; Koshiishi, I.; Torii, S. Lipoxygenase-mediated generation of lipid peroxides enhances ferroptosis induced by erastin and RSL3. Cancer Sci. 2017, 108, 2187–2194. [Google Scholar] [CrossRef]
- Ma, X.H.; Liu, J.H.; Liu, C.Y.; Sun, W.Y.; Duan, W.J.; Wang, G.; Kurihara, H.; He, R.R.; Li, Y.F.; Chen, Y.; et al. ALOX15-launched PUFA-phospholipids peroxidation increases the susceptibility of ferroptosis in ischemia-induced myocardial damage. Signal Transduct. Target. Ther. 2022, 7, 288. [Google Scholar] [CrossRef]
- Gao, S.; Zhou, L.A.-O.; Lu, J.; Fang, Y.; Wu, H.; Xu, W.; Pan, Y.; Wang, J.; Wang, X.; Zhang, J.A.-O.; et al. Cepharanthine Attenuates Early Brain Injury after Subarachnoid Hemorrhage in Mice via Inhibiting 15-Lipoxygenase-1-Mediated Microglia and Endothelial Cell Ferroptosis. Oxid. Med. Cell Longev. 2022, 2022, 4295208. [Google Scholar] [CrossRef]
- Zhuravlev, A.; Golovanov, A.; Toporkov, V.; Kuhn, H.; Ivanov, I. Functionalized Homologues and Positional Isomers of Rabbit 15- Lipoxygenase RS75091 Inhibitor. Med. Chem. 2022, 18, 406–416. [Google Scholar] [CrossRef]
- Golovanov, A.; Zhuravlev, A.; Cruz, A.; Aksenov, V.; Shafiullina, R.; Kakularam, K.R.; Lluch, J.M.; Kuhn, H.; Gonzalez-Lafont, A.; Ivanov, I. N-Substituted 5-(1H-Indol-2-yl)-2-methoxyanilines Are Allosteric Inhibitors of the Linoleate Oxygenase Activity of Selected Mammalian ALOX15 Orthologs: Mechanism of Action. J. Med. Chem. 2022, 65, 1979–1995. [Google Scholar] [CrossRef]
- Hosseinymehr, M.; Matin, M.M.; Sadeghian, H.; Bahrami, A.R.; Kaseb-Mojaver, N. 8-Farnesyloxycoumarin induces apoptosis in PC-3 prostate cancer cells by inhibition of 15-lipoxygenase-1 enzymatic activity. Anti-Cancer Drugs 2016, 27, 854–862. [Google Scholar] [CrossRef] [Green Version]
- Gomeni, R.; Bani, M.; D’Angeli, C.; Corsi, M.; Bye, A. Computer-assisted drug development (CADD): An emerging technology for designing first-time-in-man and proof-of-concept studies from preclinical experiments. Eur. J. Pharm. Sci. 2001, 13, 261–270. [Google Scholar] [CrossRef]
- Li, J.; Fu, A.; Zhang, L. An Overview of Scoring Functions Used for Protein-Ligand Interactions in Molecular Docking. Interdiscip. Sci. 2019, 11, 320–328. [Google Scholar] [CrossRef]
- Usha, T.; Shanmugarajan, D.; Goyal, A.K.; Kumar, C.S.; Middha, S.K. Recent Updates on Computer-aided Drug Discovery: Time for a Paradigm Shift. Curr. Top. Med. Chem. 2017, 17, 3296–3307. [Google Scholar] [CrossRef]
- Zhao, L.; Ciallella, H.L.; Aleksunes, L.M.; Zhu, H. Advancing computer-aided drug discovery (CADD) by big data and data-driven machine learning modeling. Drug Discov. Today 2020, 25, 1624–1638. [Google Scholar] [CrossRef]
- Sun, H.; Pan, P.; Tian, S.; Xu, L.; Kong, X.; Li, Y.; Dan, L.; Hou, T. Constructing and Validating High-Performance MIEC-SVM Models in Virtual Screening for Kinases: A Better Way for Actives Discovery. Sci. Rep. 2016, 6, 24817. [Google Scholar] [CrossRef] [Green Version]
- Kapsiani, S.; Howlin, B.J. Random forest classification for predicting lifespan-extending chemical compounds. Sci. Rep. 2021, 11, 13812. [Google Scholar] [CrossRef]
- Dalecki, A.G.; Zorn, K.M.; Clark, A.M.; Ekins, S.; Narmore, W.T.; Tower, N.; Rasmussen, L.; Bostwick, R.; Kutsch, O.; Wolschendorf, F. High-throughput screening and Bayesian machine learning for copper-dependent inhibitors of Staphylococcus aureus. Metallomics 2019, 11, 696–706. [Google Scholar] [CrossRef]
- Vamathevan, J.; Clark, D.; Czodrowski, P.; Dunham, I.; Ferran, E.; Lee, G.; Li, B.; Madabhushi, A.; Shah, P.; Spitzer, M.; et al. Applications of machine learning in drug discovery and development. Nat. Rev. Drug Discov. 2019, 18, 463–477. [Google Scholar] [CrossRef]
- Cruz, A.; Di Venere, A.; Mei, G.; Zhuravlev, A.; Golovanov, A.; Stehling, S.; Heydeck, D.; Lluch, J.M.; Gonzalez-Lafont, A.; Kuhn, H.; et al. A role of Gln596 in fine-tuning mammalian ALOX15 specificity, protein stability and allosteric properties. Biochim. Biophys. Acta Mol. Cell. Biol. Lipids 2020, 1865, 158680. [Google Scholar] [CrossRef]
- Guo, H.; Verhoek, I.C.; Prins, G.G.H.; van der Vlag, R.; van der Wouden, P.E.; van Merkerk, R.; Quax, W.J.; Olinga, P.; Hirsch, A.K.H.; Dekker, F.J. Novel 15-Lipoxygenase-1 Inhibitor Protects Macrophages from Lipopolysaccharide-Induced Cytotoxicity. J. Med. Chem. 2019, 62, 4624–4637. [Google Scholar] [CrossRef]
- Rathod, S.; Desai, H.; Patil, R.; Sarolia, J. Non-ionic Surfactants as a P-Glycoprotein(P-gp) Efflux Inhibitor for Optimal Drug Delivery-A Concise Outlook. AAPS PharmSciTech 2022, 23, 55. [Google Scholar] [CrossRef]
- Chagas, C.M.; Moss, S.; Alisaraie, L. Drug metabolites and their effects on the development of adverse reactions: Revisiting Lipinski’s Rule of Five. Int. J. Pharm. 2018, 549, 133–149. [Google Scholar] [CrossRef]
- Aghasizadeh, M.; Moghaddam, T.; Bahrami, A.R.; Sadeghian, H.; Alavi, S.J.; Matin, M.M. 8-Geranyloxycarbostyril as a potent 15-LOX-1 inhibitor showed great anti-tumor effects against prostate cancer. Life Sci. 2022, 293, 120272. [Google Scholar] [CrossRef] [PubMed]
- Wang, Y.; Wang, Q.; Huang, H.; Huang, W.; Chen, Y.; McGarvey, P.B.; Wu, C.H.; Arighi, C.N.; UniProt, C. A crowdsourcing open platform for literature curation in UniProt. PLoS Biol. 2021, 19, e3001464. [Google Scholar] [CrossRef] [PubMed]
- Hulsen, T.; de Vlieg, J.; Leunissen, J.A.; Groenen, P.M. Testing statistical significance scores of sequence comparison methods with structure similarity. BMC Bioinform. 2006, 7, 444. [Google Scholar] [CrossRef] [Green Version]
- Janson, G.; Grottesi, A.; Pietrosanto, M.; Ausiello, G.; Guarguaglini, G.; Paiardini, A. Revisiting the “satisfaction of spatial restraints” approach of MODELLER for protein homology modeling. PLoS Comput. Biol. 2019, 15, e1007219. [Google Scholar] [CrossRef] [PubMed] [Green Version]
- Vanommeslaeghe, K.; Hatcher, E.; Acharya, C.; Kundu, S.; Zhong, S.; Shim, J.; Darian, E.; Guvench, O.; Lopes, P.; Vorobyov, I.; et al. CHARMM general force field: A force field for drug-like molecules compatible with the CHARMM all-atom additive biological force fields. J. Comput. Chem. 2010, 31, 671–690. [Google Scholar] [CrossRef] [Green Version]
- Ho, B.K.; Thomas, A.; Brasseur, R. Revisiting the Ramachandran plot: Hard-sphere repulsion, electrostatics, and H-bonding in the alpha-helix. Protein Sci. 2003, 12, 2508–2522. [Google Scholar] [CrossRef]
- Rao, S.N.; Head, M.S.; Kulkarni, A.; LaLonde, J.M.; LaLonde, J.M. Validation studies of the site-directed docking program LibDock. J. Chem. Inf. Model 2007, 47, 2159–2171. [Google Scholar] [CrossRef] [Green Version]
- Ivanov, I.; Cruz, A.; Zhuravlev, A.; Di Venere, A.; Nicolai, E.; Stehling, S.; Lluch, J.M.; González-Lafont, À.; Kuhn, H. Conformational Heterogeneity and Cooperative Effects of Mammalian ALOX15. Int. J. Mol. Sci. 2021, 22, 3285. [Google Scholar] [CrossRef]
- Sun, J.; Jeliazkova, N.; Chupakin, V.; Golib-Dzib, J.F.; Engkvist, O.; Carlsson, L.; Wegner, J.; Ceulemans, H.; Georgiev, I.; Jeliazkov, V.; et al. ExCAPE-DB: An integrated large scale dataset facilitating Big Data analysis in chemogenomics. J. Cheminformatics 2017, 9, 17. [Google Scholar] [CrossRef] [Green Version]
- Adler, J.; Parmryd, I. Quantifying colocalization by correlation: The Pearson correlation coefficient is superior to the Mander’s overlap coefficient. Cytom. A 2010, 77, 733–742. [Google Scholar] [CrossRef]
- Vogt, M.; Bajorath, J. Modeling Tanimoto Similarity Value Distributions and Predicting Search Results. Mol. Inf. 2017, 36, 1600131. [Google Scholar] [CrossRef] [PubMed]
- Rogers, D.; Hahn, M. Extended-connectivity fingerprints. J. Chem. Inf. Model 2010, 50, 742–754. [Google Scholar] [CrossRef] [PubMed]
- Smith, T.C.; Frank, E. Introducing Machine Learning Concepts with WEKA. Methods Mol. Biol. 2016, 1418, 353–378. [Google Scholar] [CrossRef] [PubMed] [Green Version]
- Hemmer, P.; Tauber, S.; Steyvers, M. Moving beyond qualitative evaluations of Bayesian models of cognition. Psychon. Bull. Rev. 2015, 22, 614–628. [Google Scholar] [CrossRef] [PubMed]
- Kidwell, K.M.; Roychoudhury, S.; Wendelberger, B.; Scott, J.; Moroz, T.; Yin, S.; Majumder, M.; Zhong, J.; Huml, R.A.; Miller, V. Application of Bayesian methods to accelerate rare disease drug development: Scopes and hurdles. Orphanet. J. Rare Dis. 2022, 17, 186. [Google Scholar] [CrossRef]
- Krstajic, D.; Buturovic, L.J.; Leahy, D.E.; Thomas, S. Cross-validation pitfalls when selecting and assessing regression and classification models. J. Cheminformatics 2014, 6, 10. [Google Scholar] [CrossRef] [Green Version]
- Chicco, D.; Jurman, G. The advantages of the Matthews correlation coefficient (MCC) over F1 score and accuracy in binary classification evaluation. BMC Genom. 2020, 21, 6. [Google Scholar] [CrossRef] [Green Version]
- Wu, Y.; Brooks, C.L., III. Flexible CDOCKER: Hybrid Searching Algorithm and Scoring Function with Side Chain Conformational Entropy. J. Chem. Inf. Model. 2021, 61, 5535–5549. [Google Scholar] [CrossRef]
- Ferreira, L.L.G.; Andricopulo, A.D. ADMET modeling approaches in drug discovery. Drug Discov. Today 2019, 24, 1157–1165. [Google Scholar] [CrossRef]
- Daina, A.; Michielin, O.; Zoete, V. SwissADME: A free web tool to evaluate pharmacokinetics, drug-likeness and medicinal chemistry friendliness of small molecules. Sci. Rep. 2017, 7, 42717. [Google Scholar] [CrossRef]
- Venkatapathy, R.; Moudgal, C.J.; Bruce, R.M. Assessment of the oral rat chronic lowest observed adverse effect level model in TOPKAT, a QSAR software package for toxicity prediction. J. Chem. Inf. Comput. Sci. 2004, 44, 1623–1629. [Google Scholar] [CrossRef] [PubMed]
- Van Der Spoel, D.; Lindahl, E.; Hess, B.; Groenhof, G.; Mark, A.E.; Berendsen, H.J. GROMACS: Fast, flexible, and free. J. Comput. Chem. 2005, 26, 1701–1718. [Google Scholar] [CrossRef] [PubMed]
- O’Boyle, N.M.; Banck, M.; James, C.A.; Morley, C.; Vandermeersch, T.; Hutchison, G.R. Open Babel: An open chemical toolbox. J. Cheminformatics 2011, 3, 33. [Google Scholar] [CrossRef] [PubMed] [Green Version]
- Sousa da Silva, A.W.; Vranken, W.F. ACPYPE-AnteChamber Python Parser interface. BMC Res. Notes 2012, 5, 367. [Google Scholar] [CrossRef] [PubMed]


| Name | Verify Score | Verify Expected High Score | Verify Expected Low Score |
|---|---|---|---|
| M0018 | 278.82 | 303.15 | 136.417 |
| Protein | 2P0M | M0018 |
|---|---|---|
| 2P0M | -- | 1.1630 |
| M0018 | 1.2990 | -- |
| Class | Precision | Recall | F-Measure | AUC | MCC |
|---|---|---|---|---|---|
| Active | 0.847 | 0.925 | 0.884 | 0.895 | 0.838 |
| Inactive | 0.958 | 0.913 | 0.935 | ||
| Weighted Avg | 0.903 | 0.919 | 0.910 |
| Classification | Predicted Active | Predicted Inactive |
|---|---|---|
| Active | 1697 | 138 |
| Inactive | 305 | 3220 |
| Class | Precision | Recall | F-Measure | AUC | MCC |
|---|---|---|---|---|---|
| Active | 0.782 | 0.855 | 0.817 | 0.745 | 0.478 |
| Inactive | 0.920 | 0.876 | 0.897 | ||
| Weighted Avg | 0.851 | 0.866 | 0.857 |
| Classification | Predicted Active | Predicted Inactive |
|---|---|---|
| Active | 1569 | 266 |
| Inactive | 437 | 3088 |
| Index | Name | Structure | LibDock Score | CDOCKER Energy | CDOCKER Interaction Energy |
|---|---|---|---|---|---|
| 1 | 5-[4-(benzyloxy)-3-methoxyphenyl]-4-(2,3-dihydro-1,4-benzodioxin-6-ylcarbonyl)-3-hydroxy-1-(3-pyridinylmethyl)-1,5-dihydro-2H-pyrrol-2-one (C1) | 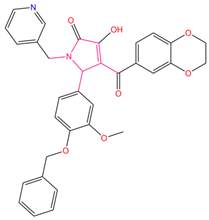 | 156.52 | −43.897 | −36.283 |
| 2 | 1-(4-benzylpiperazin-1-yl)-3-([1,1′-biphenyl]-4-yloxy)propan-2-ol (R) (C2) | 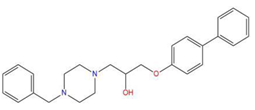 | 129.364 | −32.940 | −25.541 |
| 3 | 3-allyl-2-({2-[1-(2-methoxyethyl)-2,5-dimethyl-1H-pyrrol-3-yl]-2-oxoethyl}sulfanyl)-3,5,6,7-tetrahydro-4H-cyclopenta [4,5]thieno [2,3-d]pyrimidin-4-one (C3) | 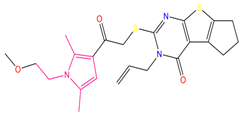 | 133.492 | −35.653 | −29.243 |
| 4 | 1-{7-acetyl-9-[4-(octyloxy)benzylidene]-9H-fluoren-2-yl}ethanone | 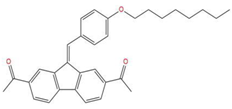 | 127.735 | −34.728 | −20.403 |
| 5 | 2-chloro-N-[2-({2-oxo-2-[(1-phenylethyl)amino]ethyl}sulfanyl)-1,3-benzothiazol-6-yl]benzamide | 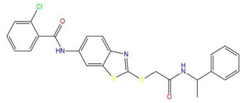 | 118.925 | −23.495 | −15.965 |
| 6 | 4-bromo-N-[2-(2-cyclooctylidenehydrazino)-2-oxoethyl]-N-(4-ethoxyphenyl)benzenesulfonamide | 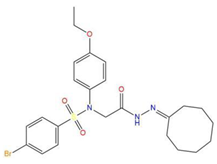 | 121.455 | −25.582 | −8.780 |
| 7 | 6-(4-(3-fluoro-4-methoxyphenyl)-2-{[3-(trifluoromethyl)phenyl]imino}-1,3-thiazol-3(2H)-yl)-1-hexanol | 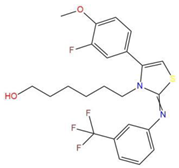 | 117.047 | −21.340 | −13.951 |
| 8 | 4-{(2,5-dioxo-1-phenyl-3-pyrrolidinyl)[2-(4-methoxyphenyl)ethyl]amino}-4-oxo-2-butenoic acid | 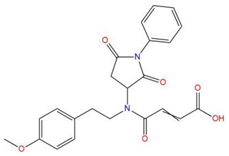 | 120.938 | −31.054 | −19.390 |
| 9 | ethyl2-({4-[(dipropylamino)sulfonyl]benzoyl}amino)-5-ethyl-3-thiophenecarboxylate | 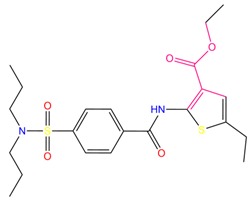 | 123.222 | −27.384 | −19.071 |
| 10 | 4-tert-butyl-N-{2-[(2-{[2-(4-chlorophenoxy)ethyl]amino}-2-oxoethyl)sulfanyl]-1,3-benzothiazol-6-yl}benzamide |  | 118.664 | −29.755 | −20.632 |
| 11 | i472 | 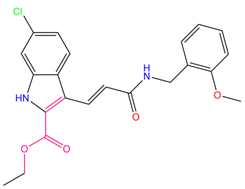 | 119.591 | −37.382 | −26.544 |
| Molecule | Molecular Formula | Molecule Weight (g/mol) | Log Po/w (iLOGP) | Log S (ESOL) | Solubility | BBB Permeant | Number of Hydrogen Bond Acceptor | Number of Hydrogen Bond Donor | Number of Rotatable Bond | Bioavailability Score | GI Absorption | P-gp Substrate |
|---|---|---|---|---|---|---|---|---|---|---|---|---|
| C1 | C33H28N2O7 | 564.58 | 3.25 | −6.05 | Poorly soluble | No | 8 | 1 | 9 | 0.56 | High | Yes |
| C2 | C23H27N3O3S2 | 457.61 | 4.28 | −4.87 | Moderately soluble | No | 4 | 0 | 9 | 0.55 | High | No |
| C3 | C26H30N2O2 | 402.53 | 4.06 | −4.92 | Moderately soluble | Yes | 4 | 1 | 8 | 0.55 | High | Yes |
| Molecule | Ames_Prediction | Ames_Probability | Ames_TOPKAT Score | Carcinogen_Prediction (Male/Female Mouse) | Carcinogen_Probability | Carcinogen_TOPKAT Score | Hepatotoxic_Prediction | Predicted Hepatotoxic Value |
|---|---|---|---|---|---|---|---|---|
| C1 | Non-Mutagen | 0.0764858 | −18.3544 | Non-Carcinogen/Non-Carcinogen | 0.130807 | −11.1785 | false | −5.65242 |
| C2 | Non-Mutagen | 0.655966 | −3.35449 | Non-Carcinogen/Single Carcinogen | 0.211263 | −4.29546 | true | −2.59417 |
| C3 | Non-Mutagen | 0.402773 | −9.6271 | Non-Carcinogen/Non-Carcinogen | 0.18041 | −6.31686 | false | −11.614 |
Publisher’s Note: MDPI stays neutral with regard to jurisdictional claims in published maps and institutional affiliations. |
© 2022 by the authors. Licensee MDPI, Basel, Switzerland. This article is an open access article distributed under the terms and conditions of the Creative Commons Attribution (CC BY) license (https://creativecommons.org/licenses/by/4.0/).
Share and Cite
Liao, Y.; Cao, P.; Luo, L. Identification of Novel Arachidonic Acid 15-Lipoxygenase Inhibitors Based on the Bayesian Classifier Model and Computer-Aided High-Throughput Virtual Screening. Pharmaceuticals 2022, 15, 1440. https://doi.org/10.3390/ph15111440
Liao Y, Cao P, Luo L. Identification of Novel Arachidonic Acid 15-Lipoxygenase Inhibitors Based on the Bayesian Classifier Model and Computer-Aided High-Throughput Virtual Screening. Pharmaceuticals. 2022; 15(11):1440. https://doi.org/10.3390/ph15111440
Chicago/Turabian StyleLiao, Yinglin, Peng Cao, and Lianxiang Luo. 2022. "Identification of Novel Arachidonic Acid 15-Lipoxygenase Inhibitors Based on the Bayesian Classifier Model and Computer-Aided High-Throughput Virtual Screening" Pharmaceuticals 15, no. 11: 1440. https://doi.org/10.3390/ph15111440