
Quantitative Structure–Toxicity Relationship in Bioactive Molecules from a Conceptual DFT Perspective

1
Advanced Technology Development Centre, Indian Institute of Technology Kharagpur, Kharagpur 721302, India
2
Department of Chemistry, Indian Institute of Technology Kharagpur, Kharagpur 721302, India
*
Author to whom correspondence should be addressed.
Pharmaceuticals 2022, 15(11), 1383; https://doi.org/10.3390/ph15111383
Submission received: 28 September 2022
/
Revised: 1 November 2022
/
Accepted: 7 November 2022
/
Published: 10 November 2022
(This article belongs to the Special Issue Applications of Conceptual Density Functional Theory to the Chemistry and Discovery of Bioactive Compounds)
Abstract
:The preclinical drug discovery stage often requires a large amount of costly and time-consuming experiments using huge sets of chemical compounds. In the last few decades, this process has undergone significant improvements by the introduction of quantitative structure-activity relationship (QSAR) modelling that uses a certain percentage of experimental data to predict the biological activity/property of compounds with similar structural skeleton and/or containing a particular functional group(s). The use of machine learning tools along with it has made life even easier for pharmaceutical researchers. Here, we discuss the toxicity of certain sets of bioactive compounds towards Pimephales promelas and Tetrahymena pyriformis in terms of the global conceptual density functional theory (CDFT)-based descriptor, electrophilicity index (ω). We have compared the results with those obtained by using the commonly used hydrophobicity parameter, logP (where P is the n-octanol/water partition coefficient), considering the greater ease of computing the ω descriptor. The Human African trypanosomiasis (HAT) curing activity of 32 pyridyl benzamide derivatives is also studied against Tryphanosoma brucei. In this review article, we summarize these multiple linear regression (MLR)-based QSAR studies in terms of electrophilicity (ω, ω2) and hydrophobicity (logP, (logP)2) parameters.
1. Introduction
With the progress of modern science, especially biochemistry and synthetic organic chemistry, the field of drug discovery has witnessed huge advances in the use of statistical approaches. The process of clinical drug screening has always been an exhaustive and time-consuming process. Thus, the involvement of statistics and computational techniques in predicting the activity of potential drug molecules with structural similarities has greatly accelerated the process.
In this regard, quantitative structure-activity relationship (QSAR) modeling that uses a certain percentage of experimental data plays a crucial role to predict the biological activity/property of compounds with similar structural skeletons and/or containing a particular functional group(s) [1,2,3,4,5,6]. They are applicable in the fields of molecular modelling, drug discovery, eco-toxicology, antitumor treatment, etc. Hansch et al. [7] in 1962 first reported a QSAR-based study through the correlation between n-octanol/water partition coefficient and biological activity exhibited by those compounds. Many scientists have since followed in his footsteps and reported several such experimental and theoretical studies that have shaped the field of modern QSAR [8,9,10,11,12,13,14,15,16,17,18,19,20,21,22,23,24,25,26,27,28,29,30,31,32,33,34,35,36].
Toxicity of organic compounds is measured in terms of parameters like pLC50, pIC50, and pIGC50 which essentially measure the negative logarithm of the concentration of the toxin needed to kill half of the target population. These measures of toxicity have been extensively used in QSAR studies [37,38,39,40,41,42]. In toxicology studies, the aforementioned concentration depends on the toxicokinetic and toxicodynamic processes in a linear fashion. A library of descriptors, namely, quantum chemical and electronic energy descriptors, thermodynamic potentials, hydrophobicity, shape, topology, etc., have been used in QSAR-based studies [43]. Several global and local reactivity parameters are available within the purview of conceptual density functional theory (CDFT) that act as effective descriptors for predicting biological and toxicological activities [44,45,46,47,48,49]. Electrophilicity index (ω) is one such important descriptor that quantifies the electro-deficient nature of a molecule [50,51]. It has been previously utilized in predicting the biological activity (in terms of relative binding affinity values) of testosterone and estrogen derivatives [40], and the toxicity of benzidine [52] and polychlorinated biphenyls [38], to name a few. In recent times, machine learning is also becoming an integral part of drug design and QSAR studies in general [53,54,55,56,57].
This article provides a concise discussion on the toxicity of certain sets of bioactive compounds in terms of the global and local electrophilicity indices, and the simple yet effective methods utilized in developing the models.
2. Theoretical Background
According to Hansch [58,59], any correlation drawn between the biological activity of any system and its physicochemical properties ideally includes a steric part, a hydrophobic part, and an electronic part, to model a proper mathematical representation of the bioactivity. Now, the percentages of these three will vary depending on the mechanism, the receptor site, the mode of action, and several other factors. The hydrophobicity (or lipophilicity) parameter has gained a lot of importance in its usage as a descriptor owing to the fact that it can effectively describe the protoplasmic environment within a biosystem. However, using only the hydrophobic parameter is not enough in several types of mechanisms. Both receptor- and non-receptor-mediated toxicological reactions can occur either via covalent or noncovalent mechanisms. The latter form is especially important in aqueous toxicity, where the inclusion of the electronic parameter is required to produce a statistically relevant SAR model since hydrophobicity alone cannot describe the narcotic properties of polar chemicals. Thus, evaluating the electronic state of a compound is extremely useful in the prediction of its biological/toxicological properties, especially in reaction mechanisms driven by electrophile–nucleophile interactions. In this regard, we have resorted to CDFT-based chemical concepts.
For a system containing N-electrons, chemical reactivity parameters such as electronegativity (χ) [60,61] and chemical hardness (η) [62] are obtained within the domain of CDFT [63]. The former describes the ability of an atom in a molecule to attract bonded electrons towards itself and is perhaps the most fundamental descriptor required for the analysis of chemical activity. In DFT, this parameter is defined as the first derivative of the total energy (E) with respect to the total number of electrons (N) while the external potential () is kept constant. Parr [64] made a connection of this formulation with the negative of chemical potential (µ) which describes the escaping tendency of the electron cloud (see Equation (1)). Over the years many scales of electronegativity have been developed, such as those provided by Pauling [60,65], Mulliken [66], Allred-Rochow [67], etc. The second derivative of E with respect to N at constant , on the other hand, describes the chemical hardness (η) of a system. This, by extension to Equation (1), becomes the first derivative of µ with respect to N (see Equation (2)). These definitions of electronegativity, chemical potential, and hardness lead up to the description of the electrophilicity index (ω) [64,68,69]. It first originated in the field of organic chemistry by Ingold’s [70,71] classification of organic chemical reactions in two groups: the electron-deficient species (electrophiles) characterized by their electrophilicity, and electron-rich species (nucleophiles) characterized by their nucleophilicity. These qualitative descriptions came long before any mathematical representation of electrophilicity was known. Finally, after Maynard’s [72] qualitative description of ω as the ratio between the square of electronegativity and hardness, Parr et al. [51] gave their quantitative description and defined it as the “electrophilic power” of a ligand (see Equation (3)), comparing it to the definition of power in classical electrostatics.
During computation, we evoke the finite difference approximation [73] where the is approximated as the transfer of one electron to or from the neutral system and the becomes the corresponding energy change (EN−1 − EN or EN − EN+1). This way, the differential equation can be transformed into a set of algebraic equations. The self-consistent field (SCF) energy of the neutral system (with N electrons) and total single point energies of the cationic (EN−1) and anionic (EN+1) systems are calculated to obtain the ionization potential (I) and electron affinity (A) of the system as follows:
Thus, the hardness, chemical potential, and electronegativity are approximated as
Alternatively, to avoid high computational cost, we sometimes employ Koopmans’ theorem [74] to calculate I and A as follows (EHOMO and ELUMO are the energies of the highest occupied and lowest unoccupied orbitals, respectively)
Equations (6) and (7) then transform to the following
3. Methodology
First and foremost, energy minimization by way of geometry optimization is performed on all the compounds present in the dataset, viz., a set of 15 benzene derivatives for studying the toxicity against Pimephales promelas (Figure 1) [56], datasets of polychlorinated dibenzofurans (PCDFs) (Table S1) and polychlorinated biphenyls (PCBs) (Table S2) against radio-labeled tetrachlorodibenzo-p-dioxin (TCDD) [77], a set of 252 aliphatic compounds (comprising alcohols, esters, acids, aldehydes, ketones, and amines; Table S3) against Tetrahymena pyriformis [78], and a set of 32 pyridyl benzamides (Table S4) against Trypanosoma brucei [79]. The levels of theory used for computation of the above datasets are B3LYP/6-31G(d) (for the first two datasets), HF/6-311G**, and HF/6-31G(d) for the third and fourth datasets, respectively. The geometry optimization is followed by a frequency calculation on the compounds at the respective levels of theory to ensure the absence of any imaginary frequency. These computations are performed using the Gaussian 16 program package [80]. Relevant CDFT descriptors are then evaluated with the help of the equations provided in the “Theoretical background” section. We have then employed the multiple linear regression (MLR) and neural network (NN) methods to construct statistically relevant, robust QSAR models for predicting toxicological/biological activities of several datasets.
The general formula of any QSAR model is as follows:
Activity/Property/Toxicity = f (physicochemical properties)
where xn are the descriptors and an are their corresponding coefficients.
= a0 + a1x1 + a2x2 + a3x3 + …
In our cases, the mathematical descriptors for toxicity are pLC50, pIC50, and pIGC50 acting as the dependent variables, whereas the global and local electrophilicity indices and hydrophobicity are the independent variables.
The efficacy of the constructed model is determined by some statistical parameters, viz., coefficient of determination (R2), adjusted R2 (R2adj), standard deviation (SD)
where Yobs and Ycalc are the experimental and predicted dependent variables, respectively (in our case, toxicities), N is the total number of observables, and p denotes the number of descriptors used in the model.
3.1. Multiple Linear Regression (MLR)
The simple yet most widely accepted method, multiple linear regression (MLR) [81,82,83,84], uses regression coefficient or the coefficient of determination (R2) and standard deviation (SD) as its statistical metrics to judge the efficacy of the generated QSAR model. An initial descriptor selection based on the knowledge of the reaction mechanism is followed by a mathematical screening where possible combinations of the selected descriptors are tried on the whole dataset. The relevance of each descriptor to the target activity is revealed in terms of the magnitude and sign of the respective coefficients. Models with higher R2 and lower SD values are selected for further use, while the rest are rejected. The selected combinations of descriptors are then employed on a training–test split of the dataset. The model is trained on the training set and is used to predict the activity of the compounds in the test set. Sometimes a validation set is also included. The regression model is generated on the training set with the experimental toxicity (pLC50 or pIGC50) or bioactivity as the dependent and the computed descriptors as the independent variables, followed by utilizing it to predict the activity of the test set compounds.
The above approach of splitting the data has the drawback that its SD may vary depending on which compounds are placed in the training and test sets. To remove any such bias, the model needs to be fitted several times with different combinations of training–test pairs each time, followed by evaluating the statistical metrics of the test set and averaging them out. This technique is known as cross-validation. Threefold cross-validation is employed by splitting the dataset into three equi-sized groups (sets A, B, and C), where two of them form the training set while the other forms the test set. Three such combinations are obtained. QSAR models are generated on all of them to obtain their respective R2 and SD values. Another specific case of cross-validation, known as the leave-one-out (LOO) cross-validation, is an exhaustive method that includes all possible combinations within the dataset. In this method, the dataset (of, say, N number of compounds) is split into a training set with N − 1 number of compounds, leaving only one compound for testing the trained model. This is repeated N number of times and the desired metric is averaged. However, being a very exhaustive process, it tends to be rather time-consuming and computationally expensive.
3.2. Neural Networks (NNs)
Apart from MLR, we have also utilized a supervised machine learning technique [85,86,87,88,89,90,91,92,93], the multilayer perceptron (MLP) neural network [53,54,94,95,96,97,98,99,100,101,102,103,104,105] for toxicological predictions by generating QSAR models with known values of hydrophobic (logP) and electronic (ω) parameters. An MLP comprises input, hidden, and output layers, where the units in the hidden layer are connected to those of the input layer by certain weights. The units in the output layer are connected in a similar fashion to those of the hidden layer. The hidden layer consists of a non-linear (most commonly, sigmoid) transfer function, y = 1/(1 + e−x), where x is the total weighted input for the unit. Such transfer functions allow the hidden layer to mimic bio-neurons, hence earning it the name “artificial neurons”. The output layer units also consist of transfer functions which vary depending on the desired application of the MLP, e.g., while sigmoid functions are preferred for classification problems, linear functions are better suited for regression problems to predict real-valued quantities (like pIGC50).
In our studies, we have initialized all the weights with random values. The training data of descriptor-activity pairs are supplied as input, and the output error is calculated for each input as the squared difference of the calculated output from the real output. This error value is then back-propagated to update the weights between hidden-output and input-hidden layers. The process is repeated until convergence is reached, where the final set of weights is the trained set of parameters for the MLP which is then ready to predict the target activity of the unknown molecules in the test set. This step is done by supplying the descriptor values which get multiplied by the weights and sent to the hidden layer, where the sigmoid function acts on them to predict the target activity.
4. Case Studies
4.1. Pimephales Promelas
The toxicity of a set of 15 benzene derivatives (optimized structures are shown in Figure 1) towards Pimephales promelas (fathead minnow) is studied by developing SAR models with pLC50 as the dependent variable and the hydrophobicity and electrophilicity indices as the descriptors [56]. Initially, a training–test split of 10 and 5 is considered, followed by the threefold cross-validation where each subdivision of the dataset (i.e., A, B, and C) has five molecules each. The training was done taking either of the two sets, and then the test was performed with the third set.
The prediction ability of the regression models generated is judged in terms of their R2, adjusted-R2, and SD values. Several combinations of the electrophilicity (ω, ω2, and ω3) and hydrophobicity (logP and (logP)2) are taken as the independent variables. The regression models obtained by applying the three-fold cross-validation technique reveal that ω2 (with an average R2 of 0.890) shows a higher correlation compared to that of ω (average R2 = 0.864) or ω3 (average R2 = 0.882). The results obtained considering logP and (logP)2 are comparable to those obtained by using the electrophilicity indices. Considering the fact that ω can be obtained much more easily through computation than obtaining the experimental values of logP, the former is more convenient, cheaper, and faster to use than the latter. The plot showing a good correlation between the experimental and predicted pLC50 values for different cases is provided in Figure 2. Analysis through the MLP neural network validates the results obtained from employing the simple MLR technique.
4.2. Tetrahymena Pyriformis
A total of 252 aliphatic compounds grouped into six different categories based on their primary functional group, viz., alcohols, esters, acids, aldehydes, ketones, and amines, are selected for studying their toxicity (log(IGC50−1)) against the ciliate Tetrahymena pyriformis [78]. CDFT-based electronic descriptors, electrophilicity, and local philicity are considered as the independent variables for the QSTR modeling for toxicity prediction. The study is performed for each group separately, and for the whole dataset as well. Each of the six aforementioned groups (and their respective subgroups) is designated as electron accepting or donating by comparing their electronegativity values with those of the nucleic acid bases/selected DNA base pairs. Depending on whether the compound has an electron accepting or donating tendency, the local philicity parameter, ωm+ or ωm−, respectively, is chosen as its descriptor of choice. To judge the model efficacy, the statistical parameter, viz., coefficient of determination (R2), is calculated. Figure 3 depicts the correlation between the experimental and calculated toxicity values of all the six aforementioned groups of compounds, along with those for the electron accepting and donating groups. R2 obtained in these cases are 0.831 (109 aliphatic alcohols), 0.787 (39 aliphatic acids), 0.766 (51 aliphatic esters), 0.803 (13 aliphatic aldehydes), 0.778 (15 ketones), and 0.791 (25 aliphatic amines). Similar calculations performed for all the electron acceptor compounds (171), irrespective of their functional group, delivers an R2 of 0.801. The same for all the electron donor compounds (81) is 0.870. From the correlations obtained, it is very clear that the global electrophilicity along with local philicity makes up a good pair of descriptors in explaining the toxicity of these aliphatic compounds against T. pyriformis, especially when previous studies [106,107,108,109] have reported SAR models with a higher number of predictors and/or with poor correlations. The toxicity of the entire dataset is analyzed in terms of the number of carbon atoms present in the respective compounds [110].
The global and local electrophilicity indices are also employed [77] on a dataset of polyaromatic hydrocarbons (PAH) to analyze the extent of their toxic effects towards displacing half of the radio-labeled tetrachlorodibenzo-p-dioxin (TCDD) from an arylhydrocarbon (Ah) receptor. For a dataset of electron acceptor [39,46] toxins, viz., polychlorinated dibenzofurans (PCDF), the model is trained using experimental pIC50 values as dependent and ω as the independent variables, respectively. The correlations obtained while using ω as the sole descriptor for the PCDFs, in the training–test split and the whole dataset, are R = 0.891 (for training; 0.834 for the test), and 0.891 (with an R2 of 0.786), respectively. An F-ratio of 96.743 is obtained, which is a good number for the given number of data points and compared to other parameters. Ponec’s [111] method is employed to calculate the probability of any random distribution producing the same R2, which turned out to be 10−6, ruling out the possibility of any chance correlation. The dataset of PCBs is then used as an external validation set to test the efficacy of the predictive ability of the QSAR model constructed for the training set of the PCDFs. A correlation of 0.834 is obtained for the same, suggesting the relevance of ω as the sole descriptor in such electrophile–nucleophile mechanism-driven processes (see Figure 4).
In the presence of biomolecules, while PCDFs and PCBs exhibit an electron-accepting nature [39,52,112,113], aliphatic amines behave as electron donors. The electron accepting/donating nature of these compounds is determined by analyzing the transfer of a fractional number of electrons (ΔN) from these compounds to the DNA base pairs/nucleic acid bases. A positive and negative ΔN represents the compounds as electron acceptors and donors, respectively. The toxicity of these amines towards T. pyriformis is also studied. They interact with the biomolecules through the donation of electrons [78]. Since there exists no reliable measure of global nucleophilicity, the maximum value of the local variant (ωmax−) at the N atom of the amines is considered as the independent variable of the regression model. A correlation (R) of 0.936 was obtained with the NPA-derived ωmax− values for the QSAR equation:
N = 18, SD = 0.1493, R = 0.9363, R2adj = 0.8689
A high F-ratio of 113.7066 is obtained, and a high Q2 value (leaving five points) of 0.8243 is obtained. The possibility of a chance correlation is ruled out by a probability value of 0.18 × 10⁻⁵. Further, models are also generated for the combined datasets of amines and amino alcohols, followed by a training–test split. The predictive ability of global and local electrophilicity indices is demonstrated for both electron acceptors and donors in both the gas and solution phases.
Another study [114] on T. pyriformis includes the performance of an extensive MLP neural network and an MLR study using electrophilicity indices in conjunction with the hydrophobicity parameters of 169 aliphatic compounds. The correlation coefficient of the models based on the hydrophobicity and electrophilicity parameters lies within 0.790–0.983 and 0.703–0.779. Among all possible descriptor combinations, the best QSTR models turned out to be the ones with {ω, logP}, {ω2, logP} and {logP, (logP)2} pairs of descriptors.
4.3. Trypanosoma Brucei
A total of 32 numbers of pyridyl benzamide derivatives are considered for the study against the sleeping sickness, Human African trypanosomiasis (HAT) causing parasite Trypanosoma brucei [79]. All possible combinations of ω, ω2 and other descriptors utilized by Masand and coworkers [115] (provided in Table 1) are utilized to generate relevant regression models through MLR. The R2 and SD values obtained for the undivided dataset and the three combinations of the training–test split in the three-fold CV are provided in Table 2, which indicates that the 1st, 3rd, 4th, 6th, 7th, and 10th models show good correlation, while for the rest of the models the R2 does not cross the threshold value of 0.6 and is thus statistically irrelevant. An important observation is noted that on the removal of the RDF55s descriptor, there is a drastic reduction in the model efficiency, which clearly suggests its importance in this study.
A technique for comparing the developed regression models, known as the sum of ranking differences (SRDs) [116,117], is carried out where the models are ranked in order of their efficacy. It requires the data to be arranged in a matrix structure with the rows representing the statistical metrics (R2 and SD), and the columns are the models to be ranked. An ideal or golden standard is chosen (here they are the highest R2 and least SD values) whose difference from the R2 and SD values of each of the models generates the SRD values. These SRD values are then compared to judge the models’ efficacy. In this ranking method, the lower the SRD value, the better is the model. Figure 5 represents the ranking of the models, showcasing their relative position and extent of the similarity.
Several other studies on QSAR modeling are reported on the effective use of ω as the electronic factor. The toxicity of arsenic ions is predicted using regression models based on atomic charge along with global and local electrophilicity indices. The model was trained on datasets of alkali and transition-metal ions [118]. The bio-activity of the derivatives of the sex hormones, testosterone and estrogen, are also successfully reported in terms of ω [40]. Several other quantum chemical descriptors, viz., IP, EA, η, softness (S), χ, along with ω are employed for studying the correlations in an alkane series, where it is noted that the IP performs best in describing various macroscopic properties [119].
5. Conclusions
The present article focuses on an analysis relating to the simplest yet effective regression techniques in the field of QSAR. Specifically, it delivers strong evidence for the effectiveness of both global and local electrophilicities in predicting toxicity and bioactivity. The ease of their computation compared to other common descriptors comes as an added bonus for their extensive usage. Employing them, either as solo descriptors in single-parameter models, or with other descriptors like the number of carbon atoms, charge transfer, hydrophobicity, etc., in multi-parameter regression models, has resulted in high coefficients of determination and low standard deviation. Needless to say, however, prior knowledge of the reaction mechanism is of the utmost importance in order to select appropriate descriptors for the target activity.
Supplementary Materials
The following supporting information can be downloaded at: https://www.mdpi.com/article/10.3390/ph15111383/s1, Table S1: Polychlorinated dibenzofurans with identity number (ID) representing the substitution pattern. (reprinted from ref. [77] with permission from Springer Nature. Copyright © 2006, Springer Science Business Media, Inc.); Table S2: Polychlorinated biphenyls with identity number (ID) rep- resenting the substitution pattern. (reprinted from ref. [77] with permission from Springer Nature. Copyright © 2006, Springer Science Business Media, Inc.). Table S3: Dataset of 252 aliphatic compounds considered against Tetrahymena pyriformis [78]. Table S4: The dataset of 32 pyridyl benzamides considered against Trypanosoma brucei (reprinted from Ref. [79]. © 2019, IGI Global).
Author Contributions
Conceptualization, P.K.C., R.P. and S.G.P.; methodology, R.P. and S.G.P.; software, R.P.; validation, P.K.C., R.P. and S.G.P.; formal analysis, R.P. and S.G.P.; investigation, R.P. and S.G.P.; resources, P.K.C.; data curation, R.P. and S.G.P.; writing—original draft preparation, R.P. and S.G.P.; writing—review and editing, P.K.C., R.P. and S.G.P.; visualization, P.K.C.; supervision, P.K.C.; project administration, P.K.C.; funding acquisition, P.K.C. All authors have read and agreed to the published version of the manuscript.
Funding
This research was funded by Department of Science and Technology (DST), New Delhi, grant number SR/S2/JCB-09/2009.
Institutional Review Board Statement
Not applicable.
Informed Consent Statement
Not applicable.
Data Availability Statement
Data is contained within the article and supplementary material.
Acknowledgments
P.K.C. thanks Chia Ming Chang for kindly inviting him to contribute a review article to the Special Issue of Pharmaceuticals on “Applications of Conceptual Density Functional Theory to the Chemistry and Discovery of Bioactive Compounds”. R.P. and S.G.P. thank CSIR and IIT Kharagpur, respectively, for their fellowships.
Conflicts of Interest
The authors declare that they have no conflict of interest regarding the publication of this article, financial, and/or otherwise.
References
- Karcher, W.; Devillers, J. SAR and QSAR in environmental chemistry and toxicology: Scientific tool or wishful thinking? In Practical Applications of Quantitative Structure–Activity Relationships (QSAR) in Environmental Chemistry and Toxicology; Karcher, W., Devillers, J., Eds.; Kluwer Academic: Dordrecht, The Netherlands, 1990; pp. 1–12. [Google Scholar]
- Selassie, C.; Mekapati, S.; Verma, R. QSAR: Then and Now. Curr. Top. Med. Chem. 2002, 2, 1357–1379. [Google Scholar] [CrossRef]
- Roy, K.; Mitra, I. Advances in quantitative structure–activity relationship models of antioxidants. Expert Opin. Drug Discov. 2009, 4, 1157–1175. [Google Scholar] [CrossRef]
- Schultz, T.W.; Cronin, M.T.D.; Walker, J.D.; Aptula, A.O. Quantitative structure–activity relationships (QSARs) in toxicology: A historical perspective. J. Mol. Struct. THEOCHEM 2003, 622, 1–22. [Google Scholar] [CrossRef]
- Schultz, T.W.; Cronin, M.T.D.; Netzeva, T.I. The present status of QSAR in toxicology. J. Mol. Struct. THEOCHEM 2003, 622, 23–38. [Google Scholar] [CrossRef]
- Gombar, V.K.; Mattioni, B.E.; Zwickl, C.; Deahl, J.T. Computational Approaches for Assessment of Toxicity: A Historical Perspective and Current Status. In Computational Toxicology; John Wiley & Sons, Inc.: Hoboken, NJ, USA, 2006; pp. 183–215. [Google Scholar]
- Hansch, C.; Maloney, P.P.; Fujita, T.; Muir, R.M. Correlation of Biological Activity of Phenoxyacetic Acids with Hammett Substituent Constants and Partition Coefficients. Nature 1962, 194, 178–180. [Google Scholar] [CrossRef]
- Hansch, C.; Hoekman, D.; Leo, A.; Weininger, D.; Selassie, C.D. Chem-bioinformatics: Comparative QSAR at the interface between chemistry and biology. Chem. Rev. 2002, 102, 783–812. [Google Scholar] [CrossRef]
- Katritzky, A.R.; Kuanar, M.; Slavov, S.; Hall, C.D.; Karelson, M.; Kahn, I.; Dobchev, D.A. ChemInform Abstract: Quantitative Correlation of Physical and Chemical Properties with Chemical Structure: Utility for Prediction. ChemInform 2011, 42. [Google Scholar] [CrossRef]
- Fujita, T.; Winkler, D.A. Understanding the Roles of the “two QSARs”. J. Chem. Inf. Model. 2016, 56, 269–274. [Google Scholar] [CrossRef]
- Wang, L.; Ding, J.; Pan, L.; Cao, D.; Jiang, H.; Ding, X. Quantum chemical descriptors in quantitative structure–activity relationship models and their applications. Chemom. Intell. Lab. Syst. 2021, 217, 104384. [Google Scholar] [CrossRef]
- Tropsha, A. Best practices for QSAR model development, validation, and exploitation. Mol. Inform. 2010, 29, 476–488. [Google Scholar] [CrossRef]
- Verina, J.; Malde, A.; Khedkar, S.; Iyer, R.; Coutinho, E. Local indices for similarity analysis (LISA)-A 3D-QSAR formalism based on local molecular similarity. J. Chem. Inf. Model. 2009, 49, 2695–2707. [Google Scholar] [CrossRef]
- Verma, R.P.; Hansch, C. Use of 13C NMR chemical shift as QSAR/QSPR descriptor. Chem. Rev. 2011, 111, 2865–2899. [Google Scholar] [CrossRef]
- McFarland, J.W. On the parabolic relationship between drug potency and hydrophobicity. J. Med. Chem. 1970, 13, 1192–1196. [Google Scholar] [CrossRef]
- Itskowitz, P.; Tropsha, A. K nearest neighbors QSAR modeling as a variational problem: Theory and applications. J. Chem. Inf. Model. 2005, 45, 777–785. [Google Scholar] [CrossRef]
- Ruggiu, F.; Gizzi, P.; Galzi, J.L.; Hibert, M.; Haiech, J.; Baskin, I.; Horvath, D.; Marcou, G.; Varnek, A. Quantitative structure-property relationship modeling: A valuable support in high-throughput screening quality control. Anal. Chem. 2014, 86, 2510–2520. [Google Scholar] [CrossRef] [Green Version]
- Nieto-Draghi, C.; Fayet, G.; Creton, B.; Rozanska, X.; Rotureau, P.; De Hemptinne, J.C.; Ungerer, P.; Rousseau, B.; Adamo, C. A General Guidebook for the Theoretical Prediction of Physicochemical Properties of Chemicals for Regulatory Purposes. Chem. Rev. 2015, 115, 13093–13164. [Google Scholar] [CrossRef]
- Shahlaei, M.; Fassihi, A. QSAR analysis of some 1-(3,3-diphenylpropyl)-piperidinyl amides and ureas as CCR5 inhibitors using genetic algorithm-least square support vector machine. Med. Chem. Res. 2013, 22, 4384–4400. [Google Scholar] [CrossRef]
- Katritzky, A.R.; Maran, U.; Lobanov, V.S.; Karelson, M. Structurally Diverse Quantitative Structure-Property Relationship Correlations of Technologically Relevant Physical Properties. J. Chem. Inf. Comput. Sci. 2000, 40, 1–18. [Google Scholar] [CrossRef]
- Shahlaei, M.; Madadkar-Sobhani, A.; Fassihi, A.; Saghaie, L.; Shamshirian, D.; Sakhi, H. Comparative quantitative structure-activity relationship study of some 1-aminocyclopentyl-3-carboxyamides as CCR2 inhibitors using stepwise MLR, FA-MLR, and GA-PLS. Med. Chem. Res. 2012, 21, 100–115. [Google Scholar] [CrossRef]
- Simarro, P.P.; Franco, J.; Diarra, A.; Postigo, J.A.R.; Jannin, J. Update on field use of the available drugs for the chemotherapy of human African trypanosomiasis. Parasitology 2012, 139, 842–846. [Google Scholar] [CrossRef]
- Vigneresse, J.L. Revisiting immiscibility through DFT chemical descriptors. Theor. Chem. Acc. 2020, 139, 1–15. [Google Scholar] [CrossRef]
- Gupta, S.P. Quantitative Structure–Activity Relationship Studies on Na+, K+-ATPase Inhibitors. Chem. Rev. 2012, 112, 3171–3192. [Google Scholar] [CrossRef] [PubMed]
- Gholivand, K.; Ebrahimi Valmoozi, A.A.; Mahzouni, H.R.; Ghadimi, S.; Rahimi, R. Molecular docking and QSAR studies: Noncovalent interaction between acephate analogous and the receptor site of human acetylcholinesterase. J. Agric. Food Chem. 2013, 61, 6776–6785. [Google Scholar] [CrossRef] [PubMed]
- Ahmed, A.; Sandler, S.I. Physicochemical properties of hazardous energetic compounds from molecular simulation. J. Chem. Theory Comput. 2013, 9, 2389–2397. [Google Scholar] [CrossRef] [PubMed]
- Gupta, S.P. QSAR Studies on Hydroxamic Acids: A Fascinating Family of Chemicals with a Wide Spectrum of Activities. Chem. Rev. 2015, 115, 6427–6490. [Google Scholar] [CrossRef]
- Hu, J.; Zhang, X.; Wang, Z. A review on progress in QSPR studies for surfactants. Int. J. Mol. Sci. 2010, 11, 1020–1047. [Google Scholar] [CrossRef] [Green Version]
- Bo, W.; Chen, L.; Qin, D.; Geng, S.; Li, J.; Mei, H.; Li, B.; Liang, G. Application of quantitative structure-activity relationship to food-derived peptides: Methods, situations, challenges and prospects. Trends Food Sci. Technol. 2021, 114, 176–188. [Google Scholar] [CrossRef]
- Belfield, S.J.; Enoch, S.J.; Firman, J.W.; Madden, J.C.; Schultz, T.W.; Cronin, M.T.D. Determination of “fitness-for-purpose” of quantitative structure-activity relationship (QSAR) models to predict (eco-)toxicological endpoints for regulatory use. Regul. Toxicol. Pharmacol. 2021, 123, 104956. [Google Scholar] [CrossRef]
- Cherkasov, A.; Muratov, E.N.; Fourches, D.; Varnek, A.; Baskin, I.I.; Cronin, M.; Dearden, J.; Gramatica, P.; Martin, Y.C.; Todeschini, R.; et al. QSAR modeling: Where have you been? Where are you going to? J. Med. Chem. 2014, 57, 4977–5010. [Google Scholar] [CrossRef] [Green Version]
- Bruce, C.L.; Melville, J.L.; Pickett, S.D.; Hirst, J.D. Contemporary QSAR Classifiers Compared. J. Chem. Inf. Model. 2007, 47, 219–227. [Google Scholar] [CrossRef]
- Ferrins, L.; Gazdik, M.; Rahmani, R.; Varghese, S.; Sykes, M.L.; Jones, A.J.; Avery, V.M.; White, K.L.; Ryan, E.; Charman, S.A.; et al. Pyridyl benzamides as a novel class of potent inhibitors for the kinetoplastid Trypanosoma brucei. J. Med. Chem. 2014, 57, 6393–6402. [Google Scholar] [CrossRef] [PubMed]
- Escuder-Gilabert, L.; Sagrado, S.; Villanueva-Camañas, R.M.; Medina-Hernández, M.J. Quantitative Retention-Structure and Retention-Activity Relationship Studies of Local Anesthetics by Micellar Liquid Chromatography. Anal. Chem. 1998, 70, 28–34. [Google Scholar] [CrossRef] [PubMed]
- Guo, X.D.; Zhang, L.J.; Qian, Y. Systematic Multiscale Method for Studying the Structure–Performance Relationship of Drug-Delivery Systems. Ind. Eng. Chem. Res. 2012, 51, 4719–4730. [Google Scholar] [CrossRef]
- Burden, F.R. Quantitative Structure-Activity Relationship Studies Using Gaussian Processes. J. Chem. Inf. Comput. Sci. 2001, 41, 830–835. [Google Scholar] [CrossRef] [PubMed]
- Khadikar, P.V.; Mather, K.C.; Singh, S.; Phadnis, A.; Shrivastava, A.; Mandaloi, M. Study on quantitative structure–toxicity relationships of benzene derivatives acting by narcosis. Bioorg. Med. Chem. 2002, 10, 1761–1766. [Google Scholar] [CrossRef]
- Padmanabhan, J.; Parthasarathi, R.; Subramanian, V.; Chattaraj, P.K. Group Philicity and Electrophilicity as Possible Descriptors for Modeling Ecotoxicity Applied to Chlorophenols. Chem. Res. Toxicol. 2006, 19, 356–364. [Google Scholar] [CrossRef]
- Parthasarathi, R.; Padmanabhan, J.; Subramanian, V.; Maiti, B.; Chattaraj, P.K. Chemical Reactivity Profiles of Two Selected Polychlorinated Biphenyls. J. Phys. Chem. A 2003, 107, 10346–10352. [Google Scholar] [CrossRef]
- Parthasarathi, R.; Subramanian, V.; Roy, D.R.; Chattaraj, P.K. Electrophilicity index as a possible descriptor of biological activity. Bioorg. Med. Chem. 2004, 12, 5533–5543. [Google Scholar] [CrossRef]
- Russom, C.L.; Bradbury, S.P.; Broderius, S.J.; Hammermeister, D.E.; Drummond, R.A. Predicting modes of toxic action from chemical structure: Acute toxicity in the fathead minnow (Pimephales Promelas). Environ. Toxicol. Chem. 1997, 16, 948–967. [Google Scholar] [CrossRef]
- Zhao, Y.H.; Cronin, M.T.D.; Dearden, J.C. Quantitative Structure-Activity Relationships of Chemicals Acting by Non-polar Narcosis—Theoretical Considerations. Quant. Struct. Relatsh. 1998, 17, 131–138. [Google Scholar] [CrossRef]
- Karelson, M.; Lobanov, V.S.; Katritzky, A.R. Quantum-Chemical Descriptors in QSAR/QSPR Studies. Chem. Rev. 1996, 96, 1027–1044. [Google Scholar] [CrossRef] [PubMed]
- Chakraborty, A.; Giri, S.; Duley, S.; Anoop, A.; Bultinck, P.; Chattaraj, P.K. Aromaticity in all-metal annular systems: The counter-ion effect. Phys. Chem. Chem. Phys. 2011, 13, 14865–14878. [Google Scholar] [CrossRef] [PubMed]
- Chattaraj, P.K.; Roy, D.R. Update 1 of: Electrophilicity Index. Chem. Rev. 2007, 107, PR46–PR74. [Google Scholar] [CrossRef]
- Chattaraj, P.K.; Sarkar, U.; Roy, D.R. Electrophilicity Index. Chem. Rev. 2006, 106, 2065–2091. [Google Scholar] [CrossRef]
- Geerlings, P.; De Proft, F.; Langenaeker, W. Conceptual Density Functional Theory. Chem. Rev. 2003, 103, 1793–1874. [Google Scholar] [CrossRef]
- Parr, R.G.; Yang, W. Density-Functional Theory of Atoms and Molecules; Oxford University Press: New York, NY, USA; Oxford, UK, 1989. [Google Scholar]
- Geerlings, P.; Chamorro, E.; Chattaraj, P.K.; De Proft, F.; Gázquez, J.L.; Liu, S.; Morell, C.; Toro-Labbé, A.; Vela, A.; Ayers, P. Conceptual density functional theory: Status, prospects, issues. Theor. Chem. Acc. 2020, 139, 36. [Google Scholar] [CrossRef]
- Parthasarathi, R.; Padmanabhan, J.; Elango, M.; Chitra, K.; Subramanian, V.; Chattaraj, P.K. p K a Prediction Using Group Philicity. J. Phys. Chem. A 2006, 110, 6540–6544. [Google Scholar] [CrossRef]
- Parr, R.G.; Szentpály, L.V.; Liu, S. Electrophilicity Index. J. Am. Chem. Soc. 1999, 121, 1922–1924. [Google Scholar] [CrossRef]
- Parthasarathi, R.; Padmanabhan, J.; Sarkar, U.; Maiti, B.; Subramanian, V.; Chattaraj, P.K. Toxicity analysis of benzidine through chemical reactivity and selectivity profiles: A DFT approach. Internet Electron. J. Mol. Des. 2003, 2, 798–813. [Google Scholar]
- Bansal, S.; Dixit, R. Performance enhancement of the pattern recalling efficiency of Hopfield neural network using genetic algorithm for cursive handwritten character recognition. Int. J. Appl. Pattern Recognit. 2016, 3, 59. [Google Scholar] [CrossRef]
- Gridach, M. Character-level neural network for biomedical named entity recognition. J. Biomed. Inform. 2017, 70, 85–91. [Google Scholar] [CrossRef] [PubMed]
- Hertz, J.; Krogh, A.; Palmer, R.G. Introduction to the Theory of Neural Computation; CRC Press: Boca Raton, FL, USA, 2018; Volume 44, ISBN 9780429968211. [Google Scholar]
- Pal, R.; Jana, G.; Sural, S.; Chattaraj, P.K. Hydrophobicity versus electrophilicity: A new protocol toward quantitative structure–toxicity relationship. Chem. Biol. Drug Des. 2019, 93, 1083–1095. [Google Scholar] [CrossRef] [PubMed]
- Bianucci, A.M.; Micheli, A.; Sperduti, A.; Starita, A. A Novel Approach to QSPR/QSAR Based on Neural Networks for Structures. In Soft Computing Approaches in Chemistry; Springer: Berlin/Heidelberg, Germany, 2003; pp. 265–296. [Google Scholar]
- Hansch, C.; Fujita, T. p-σ-π Analysis. A Method for the Correlation of Biological Activity and Chemical Structure. J. Am. Chem. Soc. 1964, 86, 1616–1626. [Google Scholar] [CrossRef]
- Kubinyi, H. Methods and Principles in Medicinal Chemistry. In QSAR: Hansch Analysis and Related Approaches; Wiley-VCH: Weinheim, Germany; New York, NY, USA, 1993; p. 438. ISBN 352730035X. [Google Scholar]
- Pauling, L. The Nature of the Chemical Bond, 3rd ed.; Cornell University Press: Ithica, NY, USA, 1960. [Google Scholar]
- Sen, K.; Jorgenson, C. Electronegativity. In Structure and Bonding Bonding; Springer: Berlin/Heidelberg, Germany, 1987. [Google Scholar]
- Pearson, R.G. Chemical Hardness; WileyVCH: Weinheim, Germany, 1997. [Google Scholar]
- Chattaraj, P.K. (Ed.) Chemical Reactivity Theory; CRC Press: Boca Raton, FL, USA, 2009; ISBN 9780429137228. [Google Scholar]
- Parr, R.G.; Donnelly, R.A.; Levy, M.; Palke, W.E. Electronegativity: The density functional viewpoint. J. Chem. Phys. 1977, 68, 3801–3807. [Google Scholar] [CrossRef]
- Pauling, L. The nature of the chemical bond. IV. the energy of single bonds and the relative electronegativity of atoms. J. Am. Chem. Soc. 1932, 54, 3570–3582. [Google Scholar] [CrossRef]
- Mulliken, R.S. A New Electroaffinity Scale; Together with Data on Valence States and on Valence Ionization Potentials and Electron Affinities. J. Chem. Phys. 1934, 2, 782–793. [Google Scholar] [CrossRef]
- Allred, A.L.; Rochow, E.G. A scale of electronegativity based on electrostatic force. J. Inorg. Nucl. Chem. 1958, 5, 264–268. [Google Scholar] [CrossRef]
- Hohenberg, P.; Kohn, W. Inhomogeneous Electron Gas. Phys. Rev. 1964, 136, B864–B871. [Google Scholar] [CrossRef] [Green Version]
- Kohn, W.; Sham, L.J. Self-Consistent Equations Including Exchange and Correlation Effects. Phys. Rev. 1965, 140, A1133–A1138. [Google Scholar] [CrossRef] [Green Version]
- Ingold, C.K. 266. Significance of tautomerism and of the reactions of aromatic compounds in the electronic theory of organic reactions. J. Chem. Soc. 1933, 1120–1127. [Google Scholar] [CrossRef]
- Ingold, C.K. Principles of an Electronic Theory of Organic Reactions. Chem. Rev. 1934, 15, 225–274. [Google Scholar] [CrossRef]
- Maynard, A.T.; Huang, M.; Rice, W.G.; Covell, D.G. Reactivity of the HIV-1 nucleocapsid protein p7 zinc finger domains from the perspective of density-functional theory. Proc. Natl. Acad. Sci. USA 1998, 95, 11578–11583. [Google Scholar] [CrossRef] [Green Version]
- Atoms, D.T.; Parr, M.R.G.; Yang, W. Book Review. Density Funct. Theory Atoms Mol. 1989, 47, 10101. [Google Scholar]
- Koopmans, T. Über die Zuordnung von Wellenfunktionen und Eigenwerten zu den Einzelnen Elektronen Eines Atoms. Physica 1934, 1, 104–113. [Google Scholar] [CrossRef]
- Mačernis, M. Nonlinear correlations between ν 1 Raman band and global scalar properties for different length carotenoids. Lith. J. Phys. 2019, 58, 358–378. [Google Scholar] [CrossRef] [Green Version]
- Flores-Holguín, N.; Frau, J.; Glossman-Mitnik, D. Conceptual DFT-Based Computational Peptidology of Marine Natural Compounds: Discodermins A–H. Molecules 2020, 25, 4158. [Google Scholar] [CrossRef]
- Roy, D.R.; Sarkar, U.; Chattaraj, P.K.; Mitra, A.; Padmanabhan, J.; Parthasarathi, R.; Subramanian, V.; Van Damme, S.; Bultinck, P. Analyzing toxicity through electrophilicity. Mol. Divers. 2006, 10, 119–131. [Google Scholar] [CrossRef]
- Roy, D.R.; Parthasarathi, R.; Maiti, B.; Subramanian, V.; Chattaraj, P.K. Electrophilicity as a possible descriptor for toxicity prediction. Bioorg. Med. Chem. 2005, 13, 3405–3412. [Google Scholar] [CrossRef]
- Pal, R.; Pal, G.; Jana, G.; Chattaraj, P.K. An In Silico QSAR Model Study Using Electrophilicity as a Possible Descriptor Against T. Brucei. Int. J. Chemoinform. Chem. Eng. 2019, 8, 57–68. [Google Scholar] [CrossRef] [Green Version]
- Frisch, M.J.; Trucks, G.W.; Schlegel, H.B.; Scuseria, G.E.; Robb, M.A.; Cheeseman, J.R.; Scalmani, G.; Barone, V.; Petersson, G.A.; Nakatsuji, H.; et al. Gaussian 16; Gaussian Inc.: Wallingford, UK, 2016. [Google Scholar]
- Duchowicz, P. Linear Regression QSAR Models for Polo-Like Kinase-1 Inhibitors. Cells 2018, 7, 13. [Google Scholar] [CrossRef] [Green Version]
- Peter, S.C.; Dhanjal, J.K.; Malik, V.; Radhakrishnan, N.; Jayakanthan, M.; Sundar, D. Quantitative Structure-Activity Relationship (QSAR): Modeling Approaches to Biological Applications. In Encyclopedia of Bioinformatics and Computational Biology; Elsevier: Amsterdam, The Netherlands, 2019; pp. 661–676. [Google Scholar]
- Liu, P.; Long, W. Current mathematical methods used in QSAR/QSPR studies. Int. J. Mol. Sci. 2009, 10, 1978–1998. [Google Scholar] [CrossRef] [PubMed]
- Luco, J.M.; Ferretti, F.H. QSAR Based on Multiple Linear Regression and PLS Methods for the Anti-HIV Activity of a Large Group of HEPT Derivatives. J. Chem. Inf. Comput. Sci. 1997, 37, 392–401. [Google Scholar] [CrossRef]
- Liman, W.; Oubahmane, M.; Hdoufane, I.; Bjij, I.; Villemin, D.; Daoud, R.; Cherqaoui, D.; El Allali, A. Monte Carlo Method and GA-MLR-Based QSAR Modeling of NS5A Inhibitors against the Hepatitis C Virus. Molecules 2022, 27, 2729. [Google Scholar] [CrossRef] [PubMed]
- Liu, S.S.; Yin, C.S.; Wang, L.S. Combined MEDV-GA-MLR method for QSAR of three panels of steroids, dipeptides, and COX-2 inhibitors. J. Chem. Inf. Comput. Sci. 2002, 42, 749–756. [Google Scholar] [CrossRef] [PubMed]
- Ambure, P.; Gajewicz-Skretna, A.; Cordeiro, M.N.D.S.; Roy, K. New workflow for QSAR model development from small data sets: Small dataset curator and small dataset modeler. Integration of data curation, exhaustive double cross-validation, and a set of optimal model selection techniques. J. Chem. Inf. Model. 2019, 59, 4070–4076. [Google Scholar] [CrossRef] [PubMed]
- Tsou, L.K.; Yeh, S.H.; Ueng, S.H.; Chang, C.P.; Song, J.S.; Wu, M.H.; Chang, H.F.; Chen, S.R.; Shih, C.; Chen, C.T.; et al. Comparative study between deep learning and QSAR classifications for TNBC inhibitors and novel GPCR agonist discovery. Sci. Rep. 2020, 10, 16771. [Google Scholar] [CrossRef] [PubMed]
- Mao, J.; Akhtar, J.; Zhang, X.; Sun, L.; Guan, S.; Li, X.; Chen, G.; Liu, J.; Jeon, H.N.; Kim, M.S.; et al. Comprehensive strategies of machine-learning-based quantitative structure-activity relationship models. iScience 2021, 24, 103052. [Google Scholar] [CrossRef]
- Chakravarti, S.K.; Alla, S.R.M. Descriptor Free QSAR Modeling Using Deep Learning with Long Short-Term Memory Neural Networks. Front. Artif. Intell. 2019, 2, 17. [Google Scholar] [CrossRef] [Green Version]
- Stitou, M.; Toufik, H.; Bouachrine, M.; Bih, H.; Lamchouri, F. Machine learning algorithms used in Quantitative structure—Activity relationships studies as new approaches in drug discovery. In Proceedings of the 2019 International Conference on Intelligent Systems and Advanced Computing Sciences (ISACS), Taza, Morocco, 26–27 December 2019; pp. 1–8. [Google Scholar] [CrossRef]
- Ancuceanu, R.; Dinu, M.; Neaga, I.; Laszlo, F.G.; Boda, D. Development of QSAR machine learning-based models to forecast the effect of substances on malignant melanoma cells. Oncol. Lett. 2019, 17, 4188–4196. [Google Scholar] [CrossRef]
- Keyvanpour, M.R.; Shirzad, M.B. An Analysis of QSAR Research Based on Machine Learning Concepts. Curr. Drug Discov. Technol. 2021, 18, 17–30. [Google Scholar] [CrossRef]
- Mosier, P.D.; Jurs, P.C. QSAR/QSPR studies using probabilistic neural networks and generalized regression neural networks. J. Chem. Inf. Comput. Sci. 2002, 42, 1460–1470. [Google Scholar] [CrossRef] [PubMed]
- Lowe, R.; Mussa, H.Y.; Mitchell, J.B.O.; Glen, R.C. Classifying molecules using a sparse probabilistic kernel binary classifier. J. Chem. Inf. Model. 2011, 51, 1539–1544. [Google Scholar] [CrossRef] [PubMed]
- Ghasemi, J.; Saaidpour, S. Artificial neural network-based quantitative structural property relationship for predicting boiling points of refrigerants. QSAR Comb. Sci. 2009, 28, 1245–1254. [Google Scholar] [CrossRef]
- Shahlaei, M.; Fassihi, A.; Saghaie, L. Application of PC-ANN and PC-LS-SVM in QSAR of CCR1 antagonist compounds: A comparative study. Eur. J. Med. Chem. 2010, 45, 1572–1582. [Google Scholar] [CrossRef]
- Ajmani, S.; Jadhav, K.; Kulkarni, S.A. Three-dimensional QSAR using the k-nearest neighbor method and its interpretation. J. Chem. Inf. Model. 2006, 46, 24–31. [Google Scholar] [CrossRef]
- Myint, K.Z.; Wang, L.; Tong, Q.; Xie, X.Q. Molecular fingerprint-based artificial neural networks QSAR for ligand biological activity predictions. Mol. Pharm. 2012, 9, 2912–2923. [Google Scholar] [CrossRef]
- Yaffe, D.; Cohen, Y. Neural network based temperature-dependent quantitative structure property relations (QSPRs) for predicting vapor pressure of hydrocarbons. J. Chem. Inf. Comput. Sci. 2001, 41, 463–477. [Google Scholar] [CrossRef]
- Burden, F.R.; Ford, M.G.; Whitley, D.C.; Winkler, D.A. Use of Automatic Relevance Determination in QSAR Studies Using Bayesian Neural Networks. J. Chem. Inf. Comput. Sci. 2000, 40, 1423–1430. [Google Scholar] [CrossRef]
- Espinosa, G.; Yaffe, D.; Arenas, A.; Cohen, Y.; Giralt, F. A fuzzy ARTMAP-based Quantitative Structure-Property Relationship (QSPR) for predicting physical properties of organic compounds. Ind. Eng. Chem. Res. 2001, 40, 2757–2766. [Google Scholar] [CrossRef]
- Burden, F.R.; Winkler, D.A. Robust QSAR models using bayesian regularized neural networks. J. Med. Chem. 1999, 42, 3183–3187. [Google Scholar] [CrossRef]
- Koutsoukas, A.; Lowe, R.; Kalantarmotamedi, Y.; Mussa, H.Y.; Klaffke, W.; Mitchell, J.B.O.; Glen, R.C.; Bender, A. Erratum: “in silico target predictions: Defining a benchmarking data set and comparison of performance of the multiclass naïve bayes and parzen-rosenblatt window”. J. Chem. Inf. Model. 2014, 54, 2180–2182. [Google Scholar] [CrossRef]
- Ghasemi, F.; Mehridehnavi, A.; Fassihi, A.; Pérez-Sánchez, H. Deep neural network in QSAR studies using deep belief network. Appl. Soft Comput. J. 2018, 62, 251–258. [Google Scholar] [CrossRef]
- Netzeva, T.I.; Schultz, T.W.; Aptula, A.O.; Cronin, M.T.D. Partial Least Squares modelling of the acute toxicity of aliphatic compounds to Tetrahymena pyriformis. SAR QSAR Environ. Res. 2003, 14, 265–283. [Google Scholar] [CrossRef] [PubMed]
- Schultz, T.W.; Cronin, M.T.D.; Netzeva, T.I.; Aptula, A.O. Structure-toxicity relationships for aliphatic chemicals evaluated with Tetrahymena pyriformis. Chem. Res. Toxicol. 2002, 15, 1602–1609. [Google Scholar] [CrossRef] [PubMed]
- Toropov, A.A.; Benfenati, E. QSAR modelling of aldehyde toxicity against a protozoan, Tetrahymena pyriformis by optimization of correlation weights of nearest neighboring codes. J. Mol. Struct. THEOCHEM 2004, 679, 225–228. [Google Scholar] [CrossRef]
- Castro, E.A.; Toropov, A.A.; Nesterova, A.I.; Nazarov, A.U. QSAR study of the toxic action of aliphatic compounds to the bacteria Vibrio fisheri based on correlation weighting of local graph invariants. J. Mol. Struct. THEOCHEM 2003, 639, 129–135. [Google Scholar] [CrossRef]
- Chattaraj, P.K.; Roy, D.R.; Giri, S.; Mukherjee, S.; Subramanian, V.; Parthasarathi, R.; Bultinck, P.; Van Damme, S. An atom counting and electrophilicity based QSTR approach. J. Chem. Sci. 2007, 119, 475–488. [Google Scholar] [CrossRef]
- Pecka, J.; Ponec, R. Simple analytical method for evaluation of statistical importance of correlations in QSAR studies. J. Math. Chem. 2000, 27, 13–22. [Google Scholar] [CrossRef]
- Parthasarathi, R.; Padmanabhan, J.; Subramanian, V.; Maiti, B.; Chattaraj, P.K. Toxicity analysis of 33′44′5-pentachloro biphenyl through chemical reactivity and selectivity profiles. Curr. Sci. 2004, 86, 535–542. [Google Scholar]
- Russell, R.C.G.; Williams, N.S.; Bulstrode, C.J.K. (Eds.) Bailey & Love’s Short Practice of Surgery, 23rd ed.; Arnold: London, UK, 2000. [Google Scholar]
- Jana, G.; Pal, R.; Sural, S.; Chattaraj, P.K. Quantitative structure-toxicity relationship: An “in silico study” using electrophilicity and hydrophobicity as descriptors. Int. J. Quantum Chem. 2020, 120, e26097. [Google Scholar] [CrossRef]
- Masand, V.H.; Mahajan, D.T.; Maldhure, A.K.; Rastija, V. Quantitative structure–activity relationships (QSARs) and pharmacophore modeling for human African trypanosomiasis (HAT) activity of pyridyl benzamides and 3-(oxazolo [4,5-b]pyridin-2-yl)anilides. Med. Chem. Res. 2016, 25, 2324–2334. [Google Scholar] [CrossRef]
- Héberger, K. Sum of ranking differences compares methods or models fairly. TrAC Trends Anal. Chem. 2010, 29, 101–109. [Google Scholar] [CrossRef]
- Kollár-Hunek, K.; Héberger, K. Method and model comparison by sum of ranking differences in cases of repeated observations (ties). Chemom. Intell. Lab. Syst. 2013, 127, 139–146. [Google Scholar] [CrossRef]
- Roy, D.R.; Giri, S.; Chattaraj, P.K. Arsenic toxicity: An atom counting and electrophilicity-based protocol. Mol. Divers. 2009, 13, 551–556. [Google Scholar] [CrossRef] [PubMed]
- Thanikaivelan, P.; Subramanian, V.; Raghava Rao, J.; Unni Nair, B. Application of quantum chemical descriptor in quantitative structure activity and structure property relationship. Chem. Phys. Lett. 2000, 323, 59–70. [Google Scholar] [CrossRef]
Figure 1.
Geometries of the substituted benzene derivatives optimized at the B3LYP/6-31G(d) level of theory (reprinted from ref. [56] with permission from John Wiley & Sons. © 2018 John Wiley & Sons A/S).
Figure 1.
Geometries of the substituted benzene derivatives optimized at the B3LYP/6-31G(d) level of theory (reprinted from ref. [56] with permission from John Wiley & Sons. © 2018 John Wiley & Sons A/S).
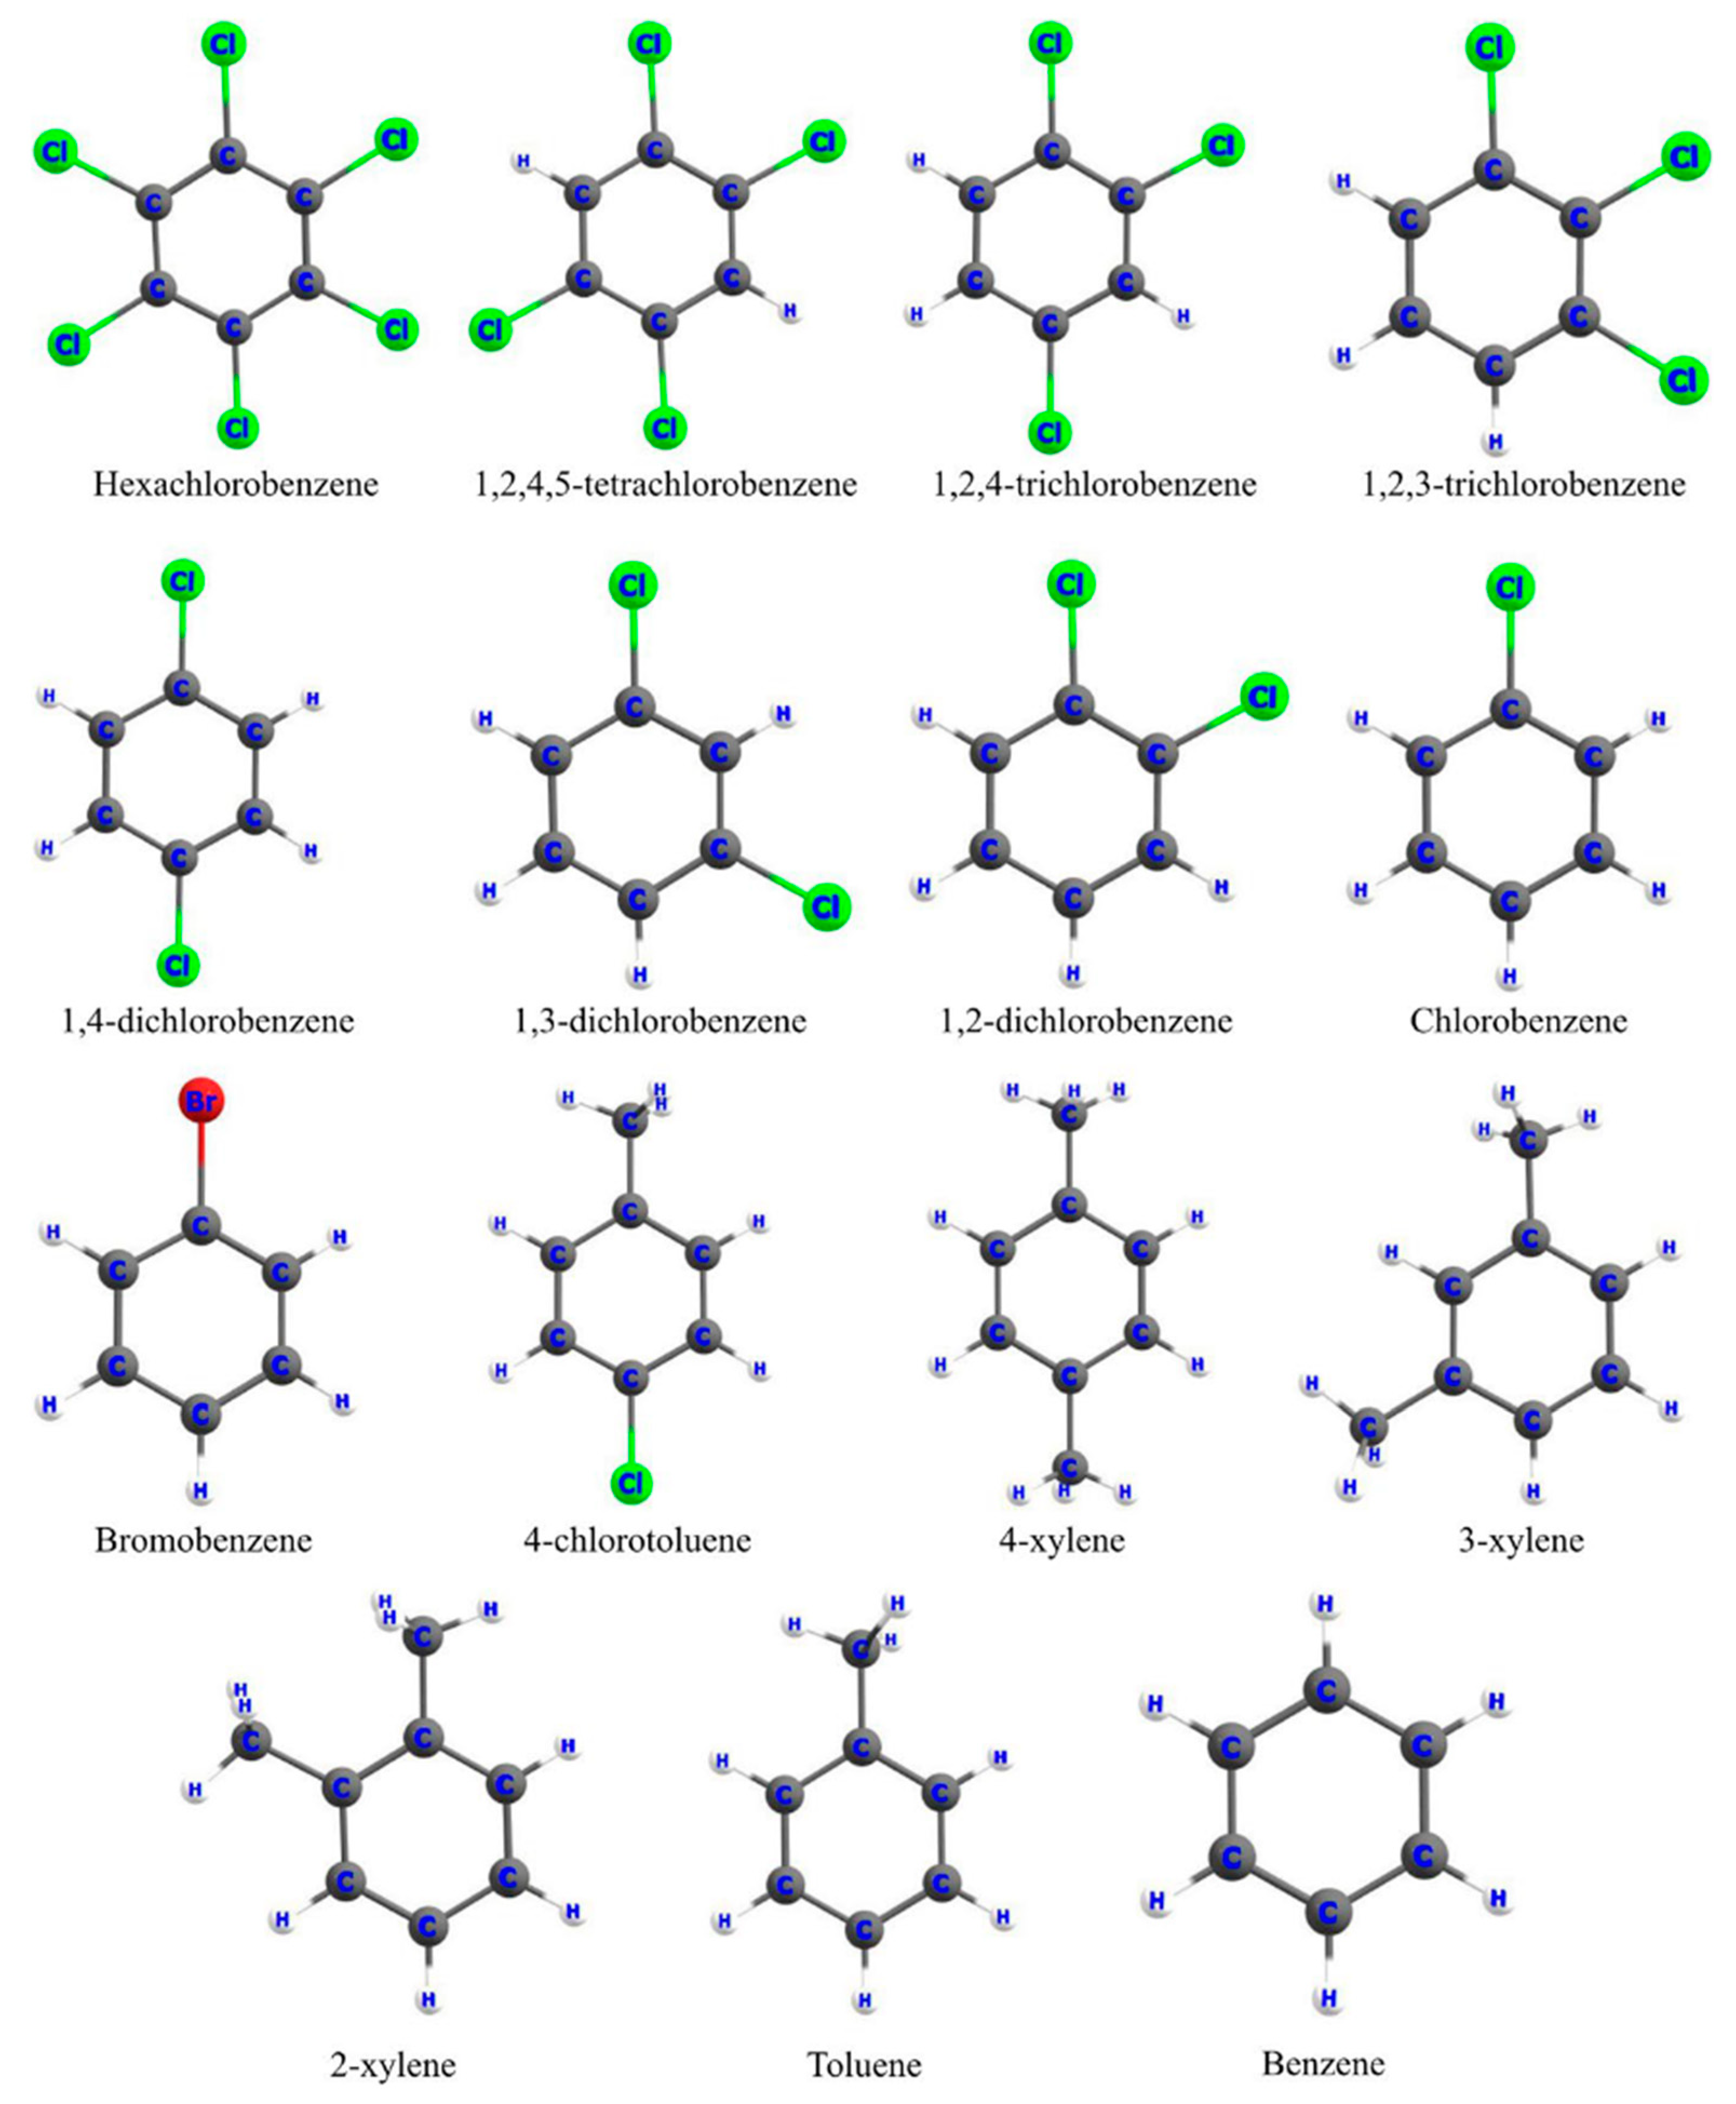
Figure 2.
Experimental vs. calculated pLC50 plots with respect to (a) ω, (b) ω2, (c) logP, and (d) (logP)2, for the test set with regression models developed using the training set in all three cases of the three-fold CV (reprinted from ref. [56] with permission from John Wiley & Sons. © 2018 John Wiley & Sons A/S).
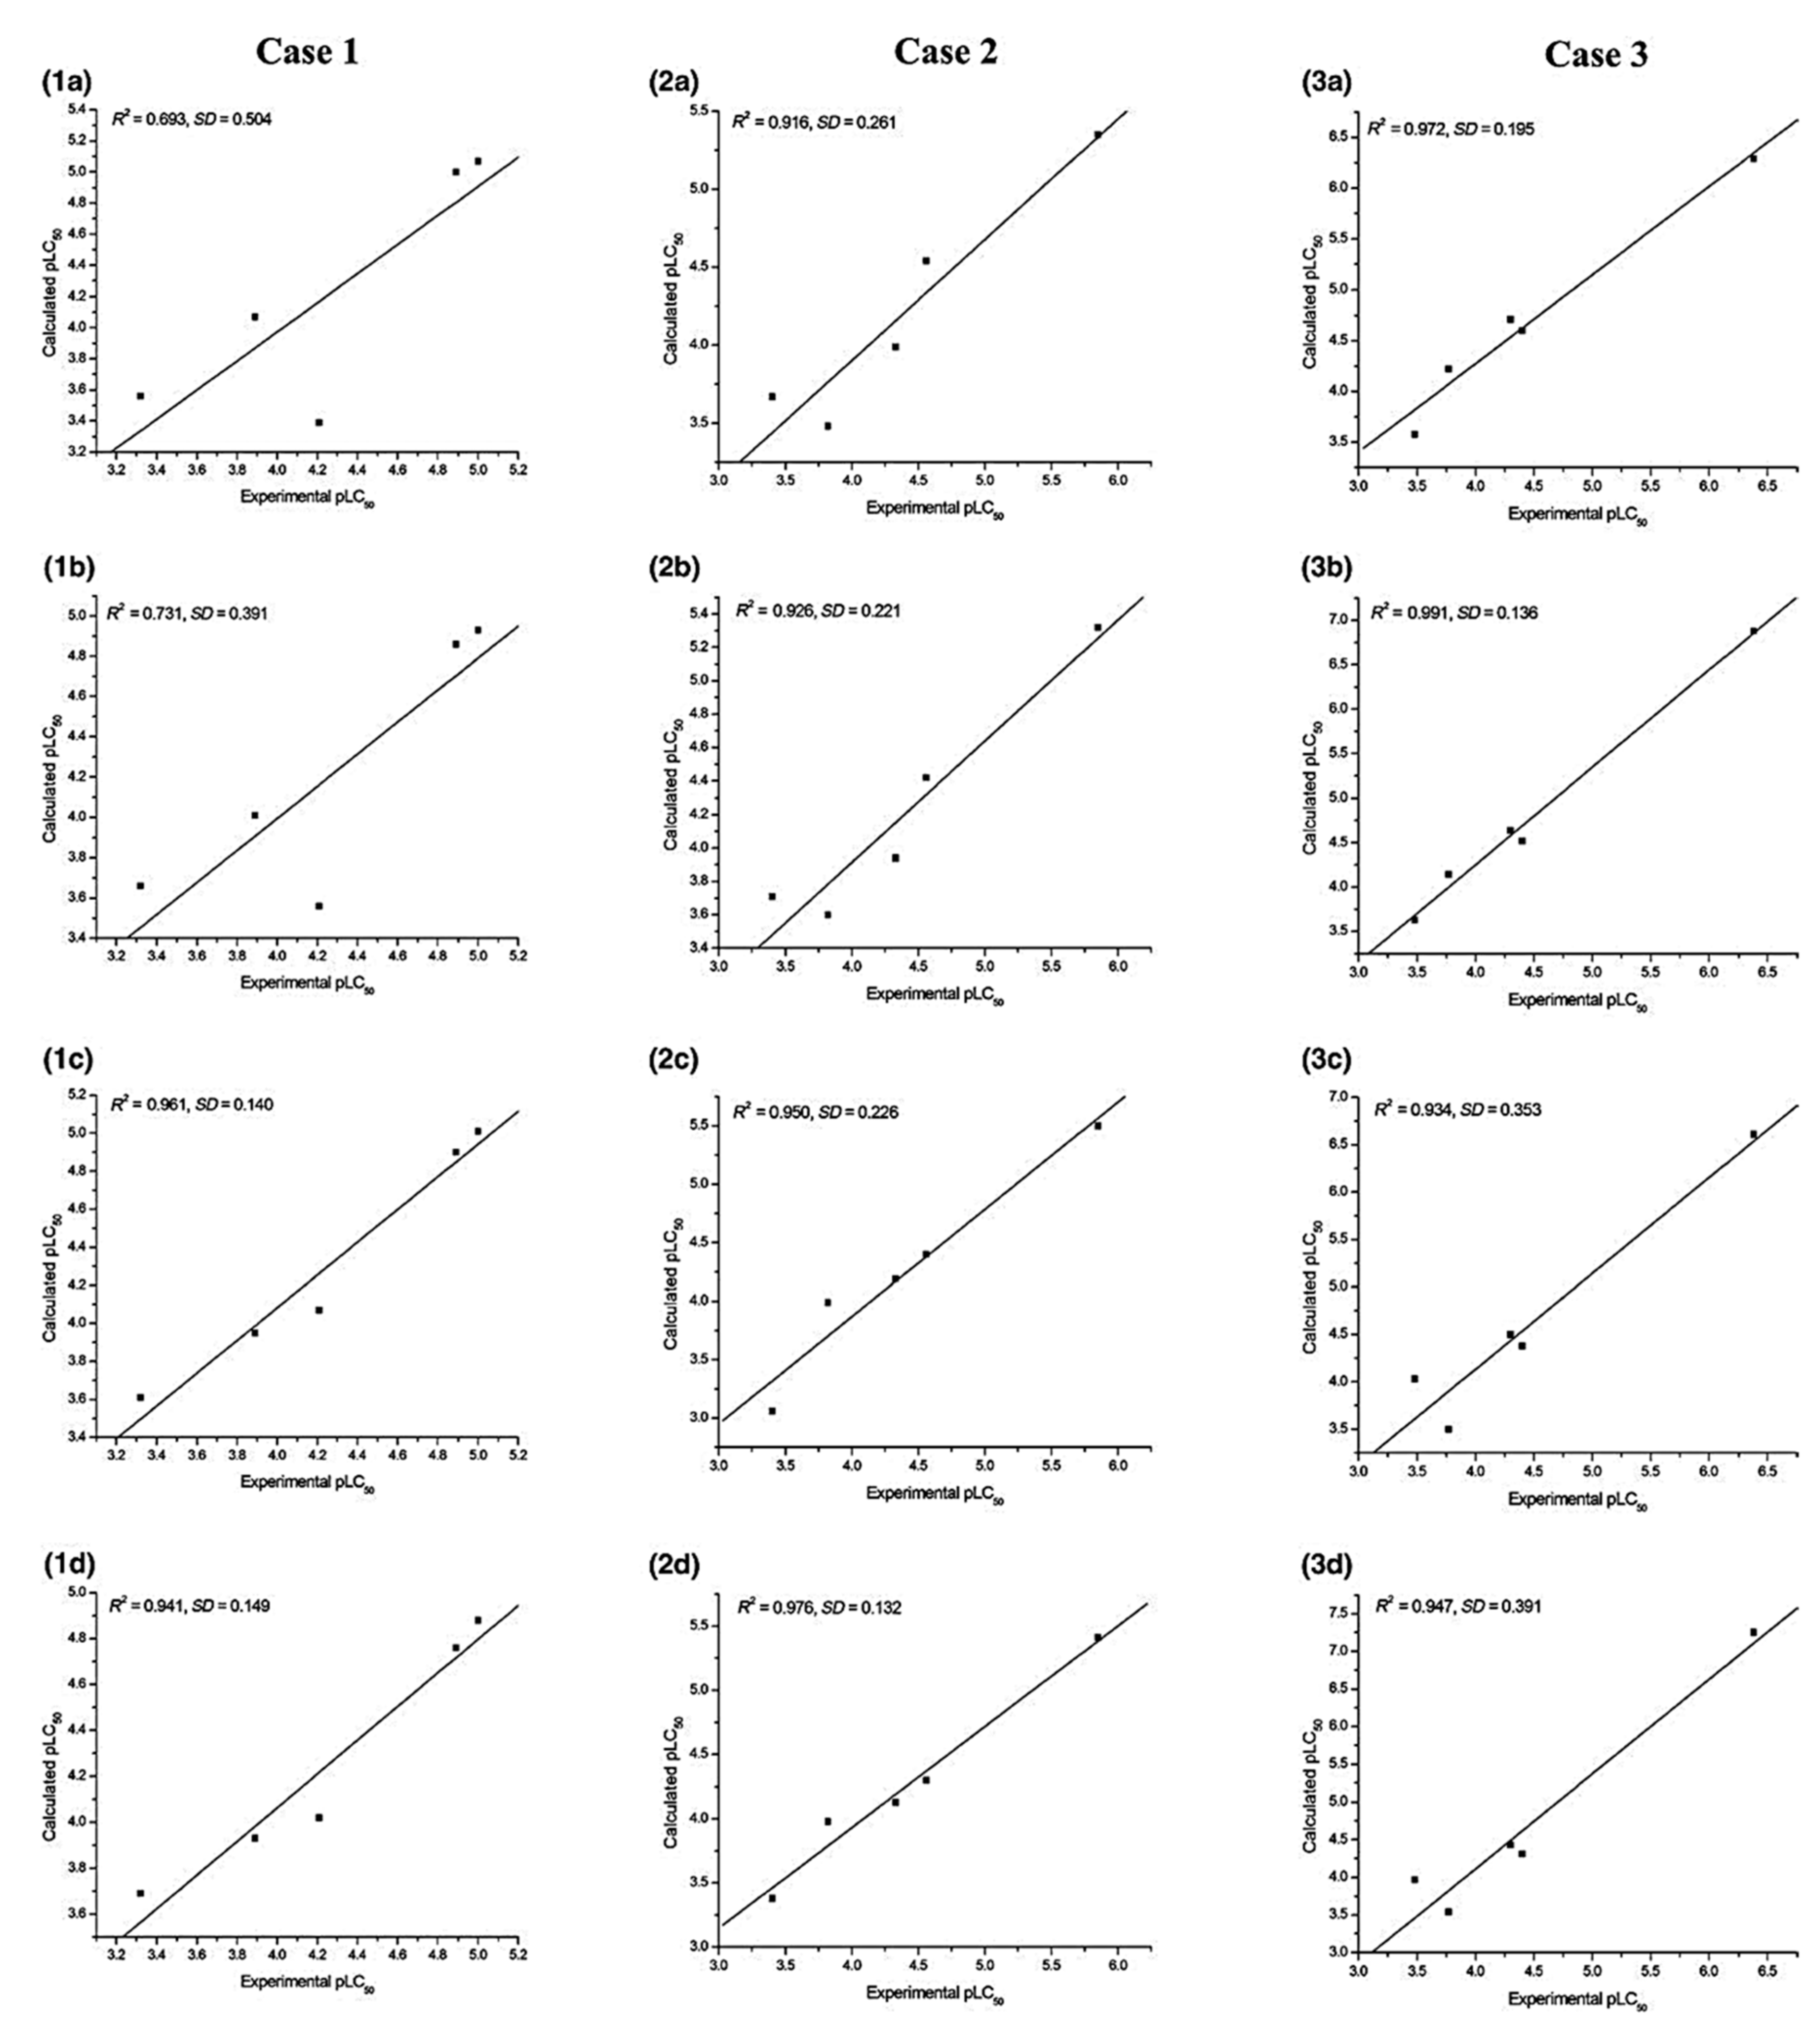
Figure 3.
Correlation between the experimental and calculated log((IGC50)−1) of (a) alcohols, (b) esters, (c) acids, (d) aldehydes, (e) ketones, (f) amines, (g) all electron accepting compounds, and (h) all electron donating compounds (assorted from Ref. [78] Copyright © 2005 Elsevier Ltd.).
Figure 3.
Correlation between the experimental and calculated log((IGC50)−1) of (a) alcohols, (b) esters, (c) acids, (d) aldehydes, (e) ketones, (f) amines, (g) all electron accepting compounds, and (h) all electron donating compounds (assorted from Ref. [78] Copyright © 2005 Elsevier Ltd.).

Figure 4.
Plots of calculated vs. observed pIC50 for (a) training set of PCDFs, (b) test set of PCBs, (c) training set of aliphatic amines, and (d) test set of amino alcohols (adapted from Ref. [77] with permission from Springer Nature. © 2006, Springer Science Business Media, Inc.).
Figure 4.
Plots of calculated vs. observed pIC50 for (a) training set of PCDFs, (b) test set of PCBs, (c) training set of aliphatic amines, and (d) test set of amino alcohols (adapted from Ref. [77] with permission from Springer Nature. © 2006, Springer Science Business Media, Inc.).

Figure 5.
Descriptors choice evaluation using SRD with ties and a scaling between 0–100. The different colored lines represent ranking of different regression models, showcasing their relative position and extent of the similarity. The respective model numbers are provided as per Table 2. (reprinted from Ref. [79]. © 2019, IGI Global).


Table 1.
List of descriptors obtained from Ref. [115] used along with the electrophilicity index to develop QSTR models describing the HAT activity of pyridyl benzamide derivatives.
Table 1.
List of descriptors obtained from Ref. [115] used along with the electrophilicity index to develop QSTR models describing the HAT activity of pyridyl benzamide derivatives.
| GATS8c | Geary autocorrelation of lag-8/weighted by atomic charges |
| RDF40p | Radial distribution function-040/weighted by relative polarizabilities |
| RDF55s | Radial distribution function-055/weighted by relative I-state |
| E1 | 1st component accessibility directional WHIM index/weighted by relative I-state |
| RDF40m | Radial distribution function-040/weighted by relative mass |
Table 2.
R2 and SD values obtained for the undivided dataset and the three combinations of training–test split in the three-fold cross-validation (reprinted from Ref. [79]. © 2019, IGI Global).
Table 2.
R2 and SD values obtained for the undivided dataset and the three combinations of training–test split in the three-fold cross-validation (reprinted from Ref. [79]. © 2019, IGI Global).
| Model No. | Generalized Regression Equations | Undivided | Case 1 | Case 2 | Case 3 | ||||
|---|---|---|---|---|---|---|---|---|---|
| R2 | SD | R2 | SD | R2 | SD | R2 | SD | ||
| 1 | pIC50 = a + b*GATS8c + c*RDF40p + d*RDF55s | 0.8284 | 0.1960 | 0.9182 | 0.1320 | 0.8216 | 0.1877 | 0.6971 | 0.2213 |
| 2 | pIC50 = a + b*GATS8c + c*RDF40p + d*ω | 0.3743 | 0.3742 | 0.4839 | 0.1872 | 0.3764 | 0.1546 | 0.2351 | 0.4378 |
| 3 | pIC50 = a + b*GATS8c + c*ω + d*RDF55s | 0.7599 | 0.2318 | 0.8325 | 0.1768 | 0.7829 | 0.2063 | 0.5114 | 0.2415 |
| 4 | pIC50 = a + b*ω + c*RDF40p + d*RDF55s | 0.7113 | 0.2542 | 0.7644 | 0.1983 | 0.7098 | 0.2283 | 0.4961 | 0.2529 |
| 5 | pIC50 = a + b*GATS8c + c*RDF40p + d*ω2 | 0.3650 | 0.3770 | 0.4825 | 0.1827 | 0.3901 | 0.1447 | 0.2211 | 0.4098 |
| 6 | pIC50 = a + b*GATS8c + c*ω2 + d*RDF55s | 0.7592 | 0.2322 | 0.8323 | 0.1762 | 0.7853 | 0.2058 | 0.5817 | 0.2299 |
| 7 | pIC50 = a + b*ω2 + c*RDF40p + d*RDF55s | 0.7068 | 0.2562 | 0.7620 | 0.1977 | 0.7101 | 0.2301 | 0.4645 | 0.2575 |
| 8 | pIC50 = a + b*GATS8c + c*ω + d*ω2 | 0.3285 | 0.3877 | 0.4334 | 0.1888 | 0.2506 | 0.1882 | 0.1725 | 0.4421 |
| 9 | pIC50 = a + b*ω + c*RDF40p + d*ω2 | 0.3660 | 0.3767 | 0.4746 | 0.1781 | 0.2911 | 0.1800 | 0.1810 | 0.4594 |
| 10 | pIC50 = a + b*ω + c*ω2 + d*RDF55s | 0.6836 | 0.2661 | 0.7637 | 0.2014 | 0.6962 | 0.2212 | 0.5163 | 0.2364 |
| 11 | pIC50 = a + b*E1s + c*RDF40m + d*GATS6m | 0.3056 | 0.3942 | 0.3991 | 0.1983 | 0.3199 | 0.2404 | 0.1159 | 0.2055 |
| 12 | pIC50 = a + b*E1s + c*RDF40m + d*ω | 0.3647 | 0.3771 | 0.4949 | 0.1839 | 0.3196 | 0.1784 | 0.2793 | 0.3939 |
| 13 | pIC50 = a + b*E1s + c*ω + d*GATS6m | 0.4847 | 0.3396 | 0.5936 | 0.2275 | 0.5415 | 0.2138 | 0.3369 | 0.3171 |
| 14 | pIC50 = a + b*ω + c*RDF40m + d*GATS6m | 0.4758 | 0.3425 | 0.5824 | 0.2177 | 0.5019 | 0.2127 | 0.3263 | 0.3134 |
| 15 | pIC50 = a + b*E1s + c*RDF40m + d*ω2 | 0.3571 | 0.3793 | 0.4997 | 0.1769 | 0.3241 | 0.1706 | 0.2135 | 0.4273 |
| 16 | pIC50 = a + b*E1s + c*ω2 + d*GATS6m | 0.4763 | 0.3424 | 0.5839 | 0.2266 | 0.5473 | 0.2083 | 0.2648 | 0.3481 |
| 17 | pIC50 = a + b*ω2 + c*RDF40m + d*GATS6m | 0.4666 | 0.3455 | 0.5708 | 0.2181 | 0.5105 | 0.2030 | 0.2518 | 0.3441 |
| 18 | pIC50 = a + b*E1s + c*ω + d*ω2 | 0.3421 | 0.3421 | 0.4673 | 0.1865 | 0.2898 | 0.1777 | 0.1339 | 0.4681 |
| 19 | pIC50 = a + b*ω + c*ω2 + d*GATS6m | 0.4784 | 0.3417 | 0.5861 | 0.2301 | 0.4044 | 0.2680 | 0.1784 | 0.3648 |
| 20 | pIC50 = a + b*ω + c*RDF40m + d*ω2 | 0.3583 | 0.3790 | 0.4822 | 0.1844 | 0.2185 | 0.2091 | 0.1454 | 0.4405 |
| 21 | pIC50 = a + b*ω + c*ω2 | 0.3272 | 0.3813 | 0.4540 | 0.1813 | 0.2922 | 0.1765 | 0.1288 | 0.4612 |
Publisher’s Note: MDPI stays neutral with regard to jurisdictional claims in published maps and institutional affiliations. |
© 2022 by the authors. Licensee MDPI, Basel, Switzerland. This article is an open access article distributed under the terms and conditions of the Creative Commons Attribution (CC BY) license (https://creativecommons.org/licenses/by/4.0/).
Share and Cite
MDPI and ACS Style
Pal, R.; Patra, S.G.; Chattaraj, P.K. Quantitative Structure–Toxicity Relationship in Bioactive Molecules from a Conceptual DFT Perspective. Pharmaceuticals 2022, 15, 1383. https://doi.org/10.3390/ph15111383
AMA Style
Pal R, Patra SG, Chattaraj PK. Quantitative Structure–Toxicity Relationship in Bioactive Molecules from a Conceptual DFT Perspective. Pharmaceuticals. 2022; 15(11):1383. https://doi.org/10.3390/ph15111383
Chicago/Turabian StylePal, Ranita, Shanti Gopal Patra, and Pratim Kumar Chattaraj. 2022. "Quantitative Structure–Toxicity Relationship in Bioactive Molecules from a Conceptual DFT Perspective" Pharmaceuticals 15, no. 11: 1383. https://doi.org/10.3390/ph15111383
Note that from the first issue of 2016, this journal uses article numbers instead of page numbers. See further details here.