Anodic Voltammetry of Thioacetamide and its Amperometric Determination in Aqueous Media

Abstract
:1. Introduction
2. Experimental Section
3. Results and Discussion
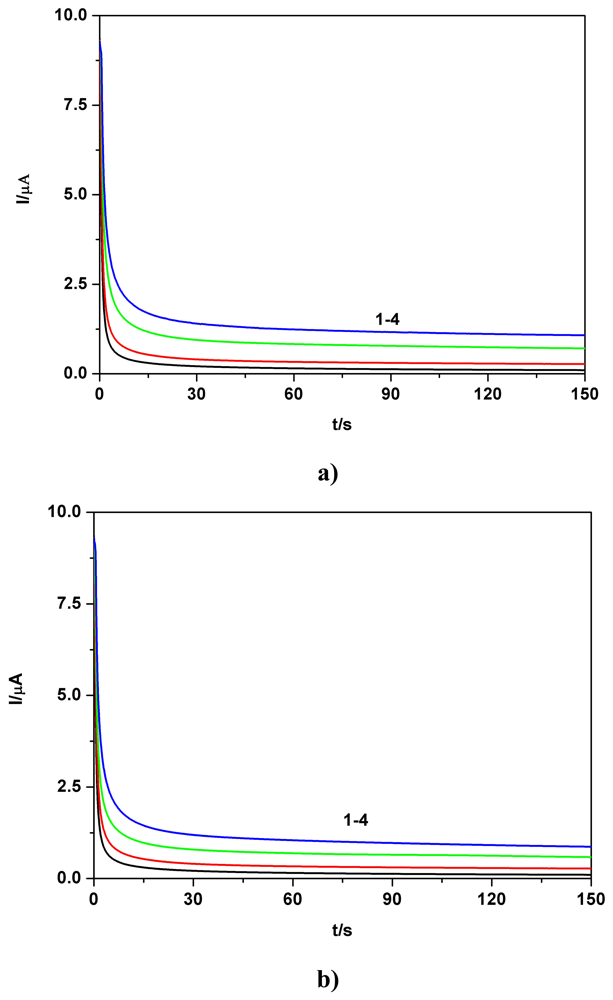
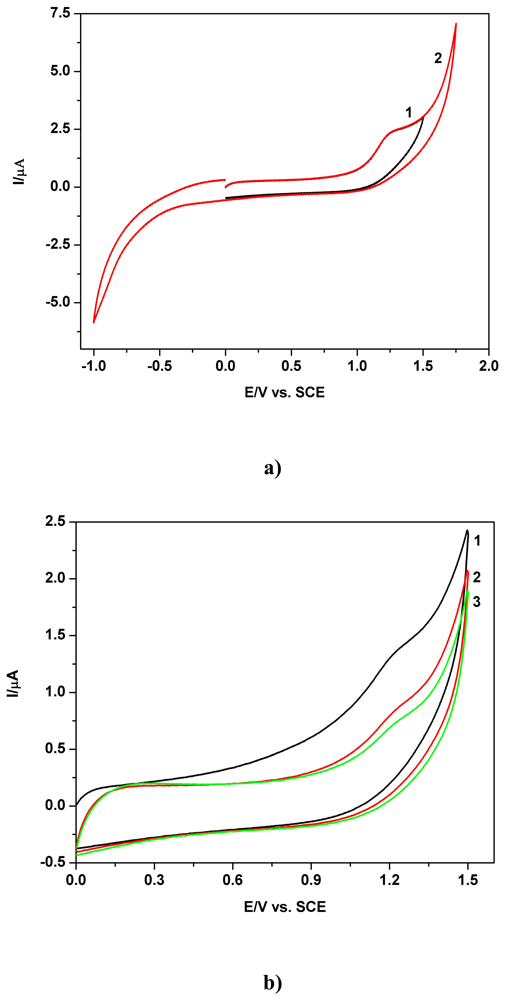
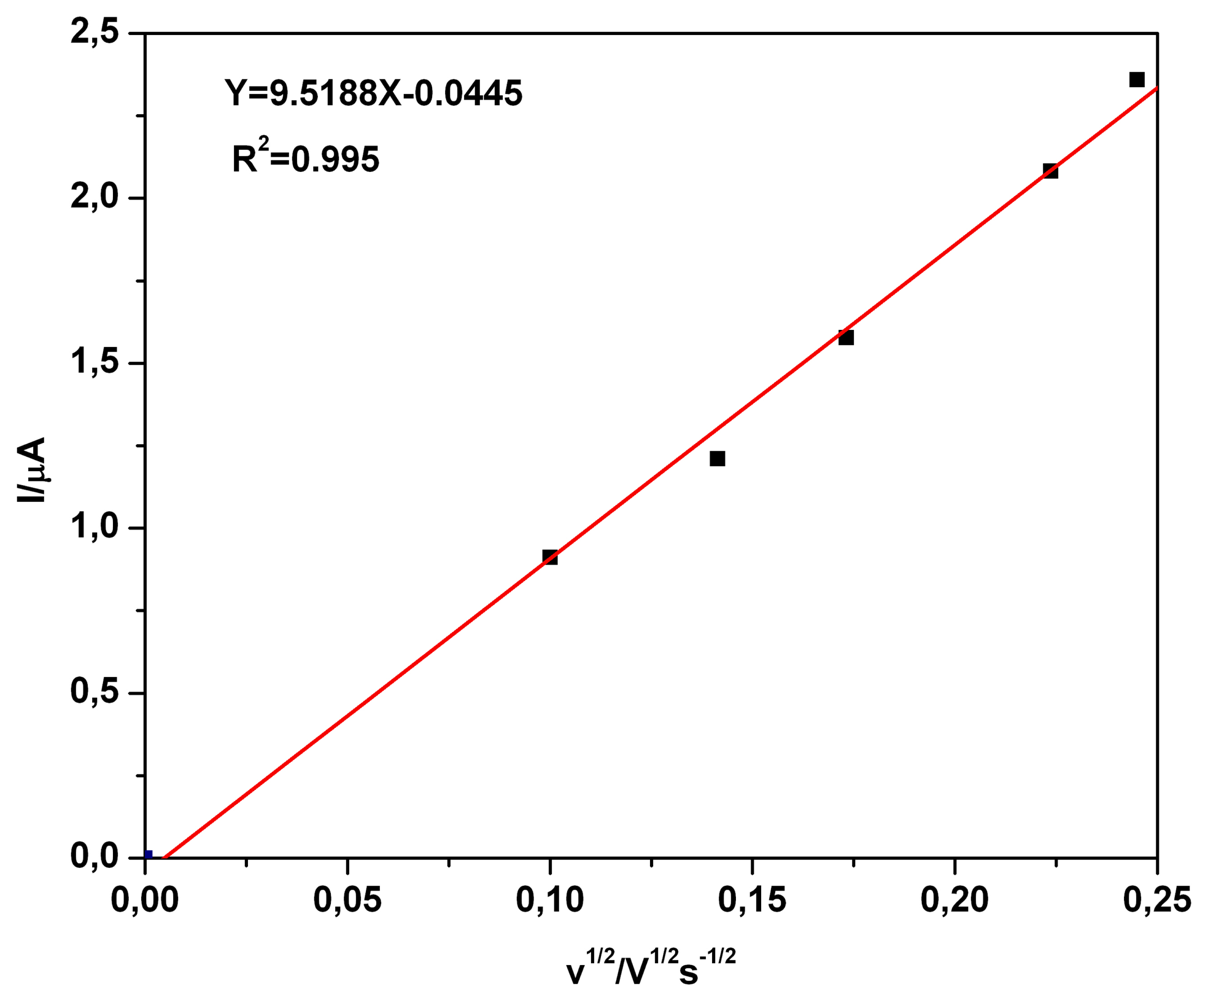
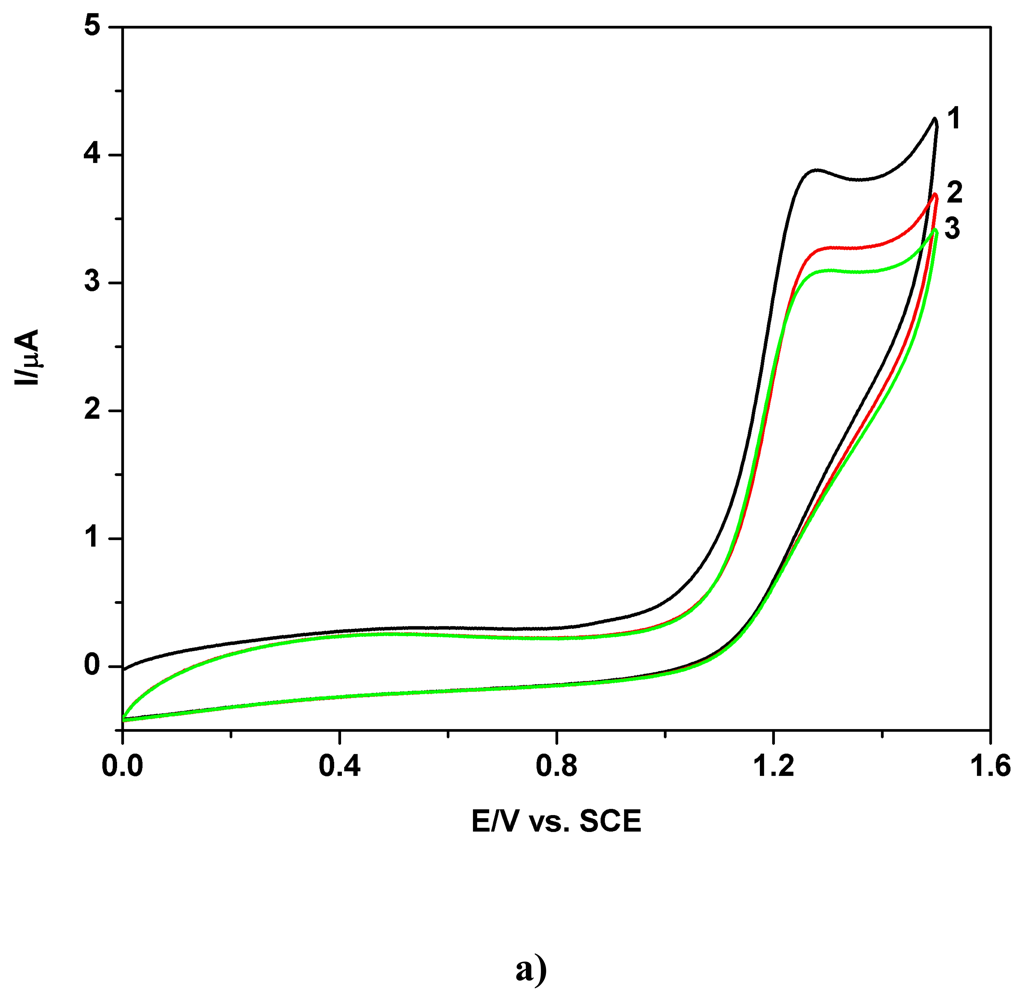
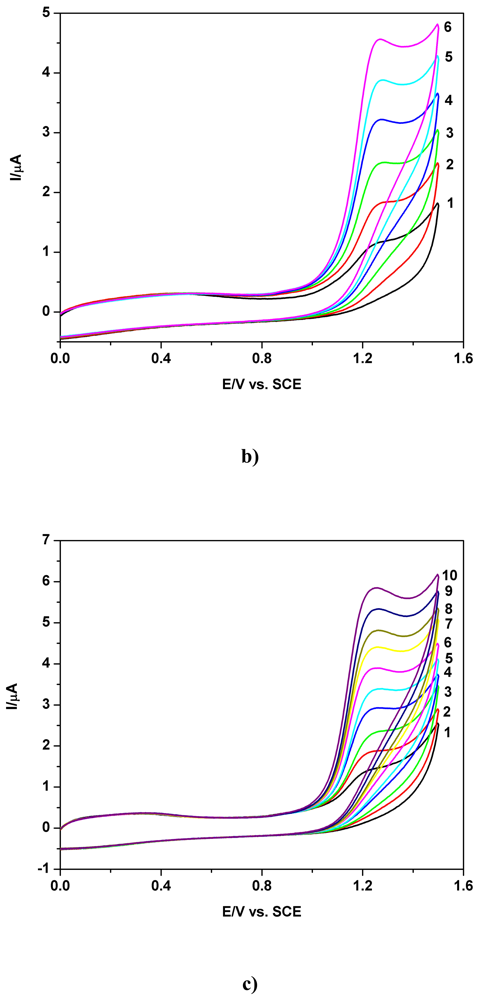
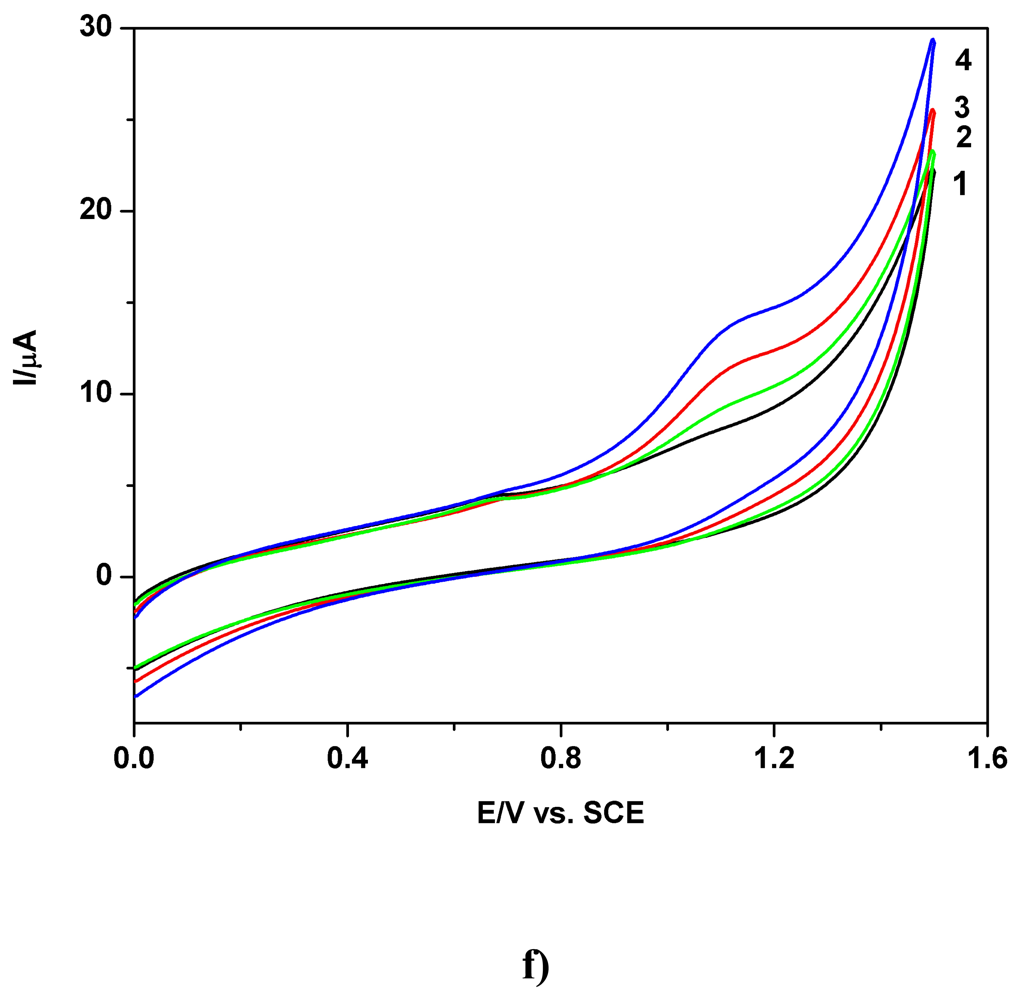
a) Voltammetric and chronoamperometric data
b) Short mechanistic consideration
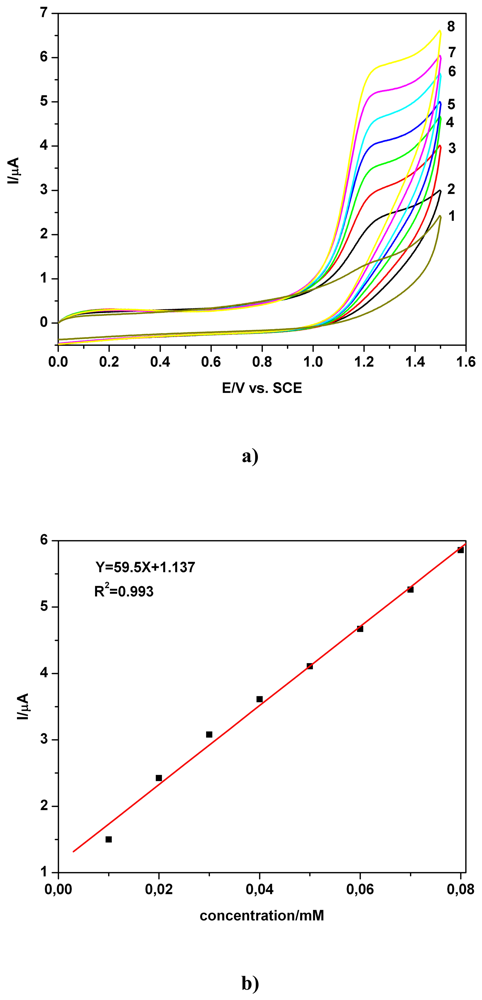
c) Applicative aspects
d) Additional comments
4. Conclusions
Acknowledgments
References and Notes
- Sharma, V. K.; Rendom, R. A.; Millero, F. J.; Vasquez, F. G. Oxidation of thioacetamide by ferrate (VI). Marine Chem. 2000, 70, 235–242. [Google Scholar]
- Manea, F.; Radovan, C.; Schoonman, J. Amperometric determination of thiourea in alkaline media on a copper oxide-copper electrode. J. Appl. Electrochem. 2006, 36, 1075–1081. [Google Scholar]
- Spataru, N.; Spataru, T.; Fujishima, A. Voltammetric determination of thiourea at conductive diamond electrodes. Electroanalysis. 2005, 17, 800–8005. [Google Scholar]
- Farawati, R. A.; Van Den Berg, C. M. G. Thiols in coastal waters of the western North Sea and English channel. Environm. Sc. Technol. 2001, 35, 1902–1911. [Google Scholar]
- Dodge, A. G.; Richman, J. E.; Johnson, G.; Wackett, L. P. Metabolism of thioamides by Ralstonia picketii TA. Appl. Environm. Microbiol. 2006, 72, 7468–7476. [Google Scholar]
- Zaleska, A.; Gorska, P.; Sobczak, J. W.; Hupka, J. Thioacetamide and thiourea impact on visible light activity of TiO2. Appl. Catal. B: Environm. 2007, 76, 1–8. [Google Scholar]
- Houskova, V.; Stengl, V.; Bakaradjieva, S.; Murafa, N.; Kalendova, A.; Oplustil, F. Nanostructure materials of warfare agents and eco-toxins prepared by homogeneous hydrolysis with thioacetamide: Part 1-zinc oxide. J. Phys. Chem. Solids. 2007, 68, 716–720. [Google Scholar]
- Stengel., V.; Bakardjieva, S.; Murafa, N.; Houskova, V.; Lang, K. Visible-light photocatalytic activity of TiO2/ZnS nanocomposites prepared by homogeneous hydrolysis. Micropor. Mesopor. Mat. 2008, 110, 370–378. [Google Scholar]
- Mane, R. S.; Sankapal, B. R.; Lokhande, C. D. Thickness dependent properties of chemically deposited As2S3 thin films from thioacetamide bath. Mat. Chem. Phys. 2000, 64, 215–221. [Google Scholar]
- Sathyabhama, S.; Padmanaban, G. Effect of thioacetamide on cytochrome P-450 synthesis in rat liver. Biochem. J. 1984, 218, 371–377. [Google Scholar]
- Wang, T.; Shankar, K.; Ronis, M. J. J.; Mehendale, H. M. Potentiation of Thioacetamide Liver Injury in Diabetic Rats is due to induced CYP2E1. J. Pharm. EXPERIM. Therap. 2000, 294, 473–479. [Google Scholar]
- Li, X.; Benjamin, I. S.; Alexander, B. Reproducible production of thioacetamide-induced macronodular cirrhosis in the rat with no mortality. J. Hepat. 2002, 36, 488–493. [Google Scholar]
- Rahman, T. M.; Hodgson, H. J. F. The effects of early and late administration of inhibitors of inducible nitric oxide synthase in a thioacetamide-induced model of acute hepatic failure in the rat. J. Hepat. 2003, 38, 583–590. [Google Scholar]
- Yeh., C.-N; Maitra, A.; Lee, K.-F.; Jan, Y.-Y.; Chen, M.-F. Thioacetamide-induced intestinal-type cholangiocarcinoma in rat: an animal model recapitulating the multi-stage progression of human cholangiocarcinoma. Carcinogenesis. 2004, 25, 631–636. [Google Scholar]
- Constantinou., M. A.; Theocharis, S. E.; Mikros, E. Application of metabonomics on a experimental model of fibrosis and cirrhosis induced by thioacetamide in rats. Toxic. Appl. Pharm. 2007, 218, 11–19. [Google Scholar]
- Tunez, I.; Munoz, M. C.; Villavivicencio, M. A.; Medina, F. J.; Prado, E. P.; Espejo, I.; Barcos, M.; Salcedo, M.; Feijo, M.; Montilla, P. Hepato- and neurotoxicity induced by thioacetamide: Protective effects of melatonin and dimethylsulfoxide. Pharm. Res. 2005, 52, 223–228. [Google Scholar]
- Huang, H.-C.; Wang, S.-S.; Chan, C.-Y.; Chen, Y.-C.; Lee, F.-Y.; Chang, F.-Y.; Chu, C.-J.; Lien, H.-C.; Lu, R.-H.; Lee, S.-D. Role of hepatic nitric oxide synthases in rats with thioacetamide-induced acute liver failure and encephalopathy. J. Chin. Med. Assoc. 2007, 760, 16–23. [Google Scholar]
- Rosenthal, D.; Taylor, I. V. A study of the Mechanism and Kinetics of thioacetamide Hydrolisis Reaction. J. Amer. Chem. Soc. 1957, 79, 2684–2690. [Google Scholar]
- Butler, E. A.; Petter, D. G.; Swift, E. H. Hydrolisis reactions of thioacetamide in aqueous solutions. Anal. Chem. 1958, 30, 1379–1383. [Google Scholar]
- Lopreore, C.; Byers, L. D. The urease-catalyzed hydrolysis of thiourea and thioacetamide. Arch. Biochem. Biophys. 1998, 349, 299–303. [Google Scholar]
- Cyganski, A. Determination of some organic thio-compounds by precipitation of mercuric sulphide from mercury (II) ammine complexes-I Determination of thioacetamide and thioacetanilide. Talanta. 1976, 23, 868–869. [Google Scholar]
- Coutler, B.; Bush, D. G. Titrimetric determination of mercury (II) with thioacetamide. Anal. Chim. Acta. 1970, 51, 449–454. [Google Scholar]
- Pryszczewska, M. Amperometric determination of thioacetamide with copper (I). Talanta. 1966, 13, 1700–1702. [Google Scholar]
- Pryszczewska, M. Amperometrische bestimmungsmethode des thioacetamid. Talanta. 1965, 12, 569–572. [Google Scholar]
- King, D. M.; Eaton, W. S. Argentometric coulometric titration of thioacetamide. Talanta. 1968, 15, 347–349. [Google Scholar]
- Thibert, R. J.; Sarwar, M. Bromosuccinimide as a direct titrant for thiourea and thioacetamide using Bordeaux red as an indicator. Microchem. J. 1969, 14, 271–274. [Google Scholar]
- Jacob, T. J.; Nair, C. G. R. Determination of thioacetamide by oxidation with chloramines-T. Talanta. 1966, 13, 154–156. [Google Scholar]
- Papay, M. K.; Toth, K.; Izvekov, V.; Pungor, E. Potentiometric studies on thioacetamide by means of a sulphide ion-selective membrane electrode. Anal. Chim. Acta. 1973, 64, 409–415. [Google Scholar]
- Coutler, B.; Bush, D. G. The titrimetric of mercury (II) with thioacetamide. Anal. Chim. Acta. 1970, 51, 449–454. [Google Scholar]
- Burriel-Marti, F.; Vidan, A. M. Precipitation from homogenous solution. Precipitation of molybdenum as sulfide with thioacetamide. Anal. Chim. Acta. 1962, 26, 163–167. [Google Scholar]
- Krijn, G. C.; den Boef, G. Determination of metal ions in solution by means of TAA and EDTA I. General introduction and determination of zinc. Anal. Chim. Acta. 1960, 23, 35–41. [Google Scholar]
- Flaschka, H.; Jakobljevich, H. Die verwendung von thioacetamid in der quantitativen analyse des antimons. Anal. Chim. Acta. 1950, 4, 351–355. [Google Scholar]
- King, D. M.; Kolby, N. I.; Price, J. W. Anodization of mercury in thioacetamide solutions. J. Electroanal. Chem. 1972, 40, 295–301. [Google Scholar]
- Hapel, M.; Bruckenstein, S. Mechanistic studies of the deposition and cathodic stripping of thioacetamide at a silver electrode in alkaline media. Electroanalysis. 1989, 1, 117–123. [Google Scholar]
- Iwamoto, M.; Osteryoung, R. A. Cathodic stripping voltammetry of thioamides on a rotating silver disk electrode. J. Electroanal. Chem. 1984, 169, 181–194. [Google Scholar]
- Polta, T. Z.; Johnson, D. C. Pulsed amperometric Detection of Sulfur compounds. J. Electroanal. Chem. 1986, 209, 159–169. [Google Scholar]
- Nicholson, M. M. Diffusion Currents at cylindrical Electrodes. A study of Organic Sulfides. J. Am. Chem. Soc. 1964, 76, 2539–2545. [Google Scholar]
- Waterston, K.; Bejan, D.; Bunce, N. Electrochemical oxidation of sulfide ion at a boron-doped diamond electrode. J. Appl. Electrochem. 2007, 37, 367–373. [Google Scholar]
- Bukun, N.; Dobrovolsky, Y.; Levchenko, A.; Leonova, L.; Osadckii, E. Electrochemical process of H2S detection in air and solution. J. Solid State Electrochem. 2003, 7, 122–124. [Google Scholar]
- Chailapakul, O.; Aksharanandana, P.; Frelink, T.; Einaga, Y.; Fujishima, A. The electroxidation of sulfur-containing compounds at boron-doped diamond electrode. Sensors Act. B 2001, 80, 193–201. [Google Scholar]
- Spataru, N.; Sarada, B. V.; Popa, E.; Tryk, D. A.; Fujishima, A. Voltammetric determination of L-cysteine at conductive diamond electrode. Anal. Chem. 2001, 73, 514–519. [Google Scholar]
- Pleskov, Yu. V. Electrochemistry of Diamond. Russ. J. Electrochem. 2002, 38, 1275–1291. [Google Scholar]
- Granger, M. C.; Xu, J.; Strojek, J. W.; Swain, G. M. Polycrystalline Diamond Electrodes: Basic Properties and Applications as Amperometric Detector in Flow Injection Analysis and Liquid Chromatography. Anal. Chim. Acta. 1999, 397, 145–161. [Google Scholar]
- Compton, R. G.; Foord, J. S.; Marken, F. Electroanalysis at Diamond-Like and Doped-Diamond Electrodes. Electroanalysis. 2003, 15, 1349–1363. [Google Scholar]
- Kraft, A. Doped Diamond: a Compact Review on a Versatile Electrode Material. Int. J. Electrochem. Sci. 2007, 2, 355–385. [Google Scholar]
- Radovan, C.; Manea, F. Determination of Sodium Diethyldithiocarbamate in Water by Anodic Voltammetry Using a Boron-Doped Diamond Electrode. Electroanalysis. 2007, 19, 91–95. [Google Scholar]
- Radovan, C.; Cofan, C.; Cinghita, D. Simultaneous Determination of Acetaminophen and Ascorbic Acid at an Unmodified Boron-Doped Diamond Electrode by Differential Pulse Voltammetry in Buffered Media. Electroanalysis. 2008, 20, 1346–1353. [Google Scholar]
- Radovan, C.; Cinghita, D.; Manea, F.; Mincea, M.; Cofan, C.; Ostafe, V. Electrochemical Sensing and Assessment of Parabens in Hydro-Alcoholic Solutions and Water Using a Boron-Doped Diamond Electrode. Sensors 2008, 8. in press. [Google Scholar]
- Suryanarayanan, V.; Zhang, Y. D.; Yoshihara, S. C.; Shirakashi, T. Amperometric determination of sodium thiosulphate usig boron-doped diamond electrodes applied to flow injection analysis. Sensors and Actuators B. 2004, 102, 169–173. [Google Scholar]
- Yu, H.; Wang, H.; Quan, X.; Chen, S.; Zhang, Y. Amperometric Determination of Chemical oxygen demand Using Boron-Doped Diamond (BDD) Sensor. Electrochem. Comm. 2007, 9, 2280–2285. [Google Scholar]


| Electrode | Concentration range (mM) | Regression equation of linear calibration plot*(μA) | Sensitivity (μA/mM) | R2 | LOD (μM) | Supporting electrolyte | Method |
|---|---|---|---|---|---|---|---|
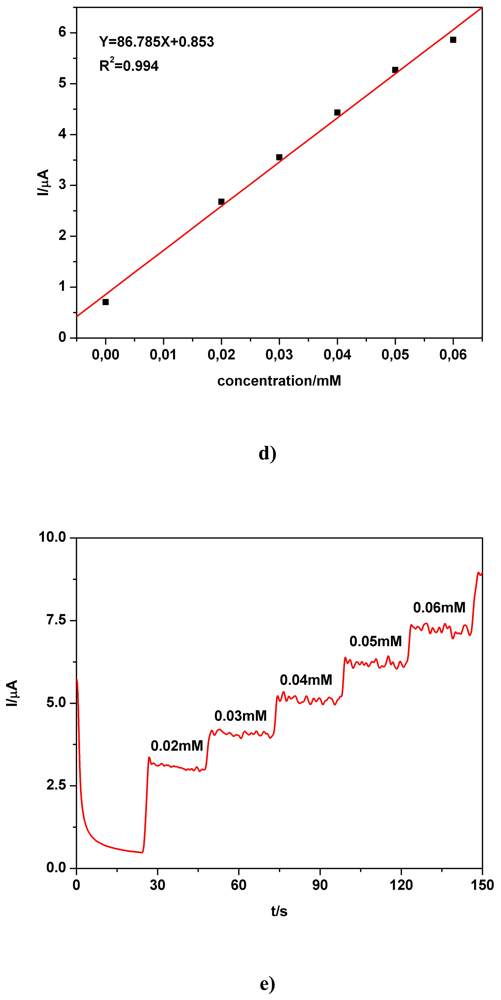
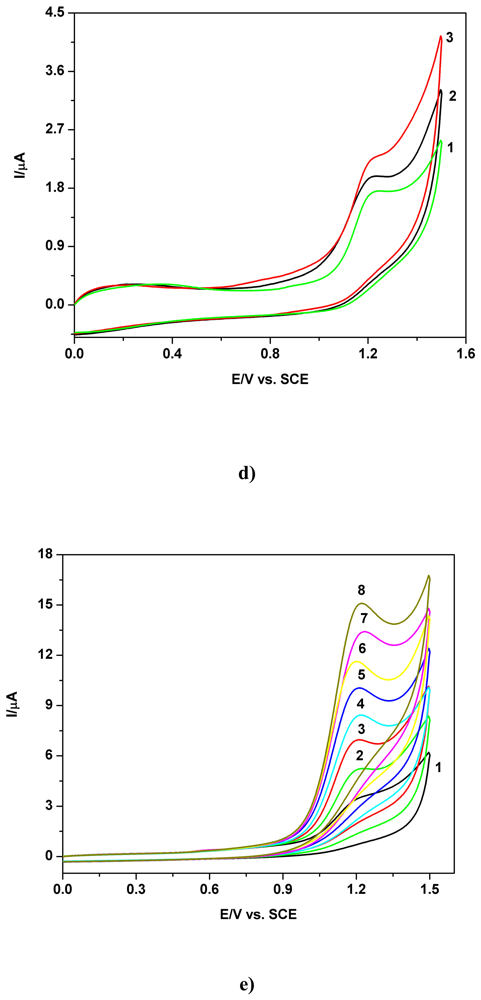
| BDD | 0.02-0.08 | I = 59.5C + 1.137 | 59.5 | 0.993 | 1.89 | 0.1 M Na2SO4 | CV |
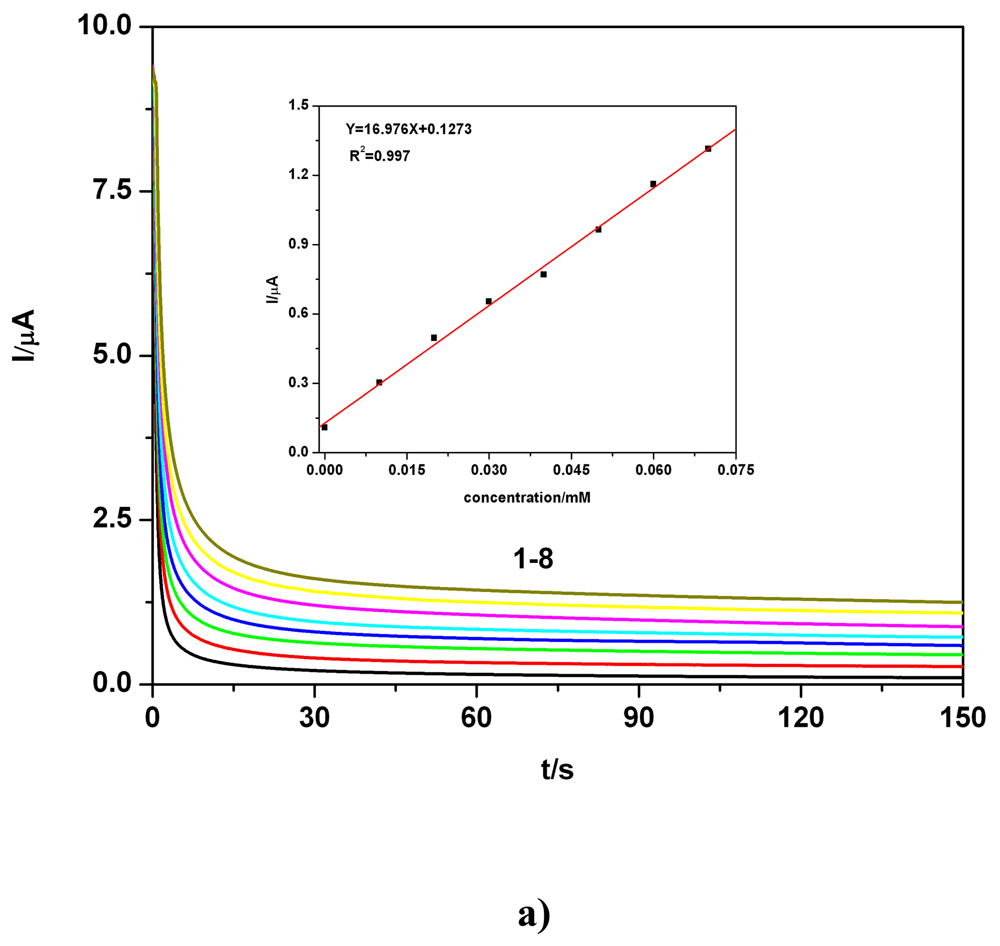
| BDD | 0.01-0.07 | I = 16.97C + 0.127 | 16.97 | 0.997 | 1.61 | 0.1 M Na2SO4 | CAa** |
| BDD | 0.01-0.07 | I=16.8109C+0.1281 | 16.8109 | 0.9979 | 1.585 | 0.1 M Na2SO4 | CAb** |
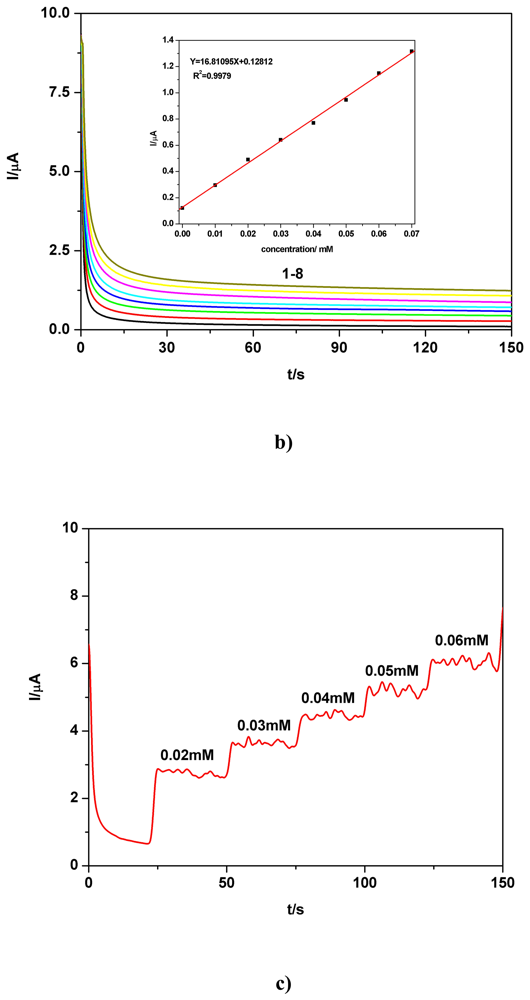
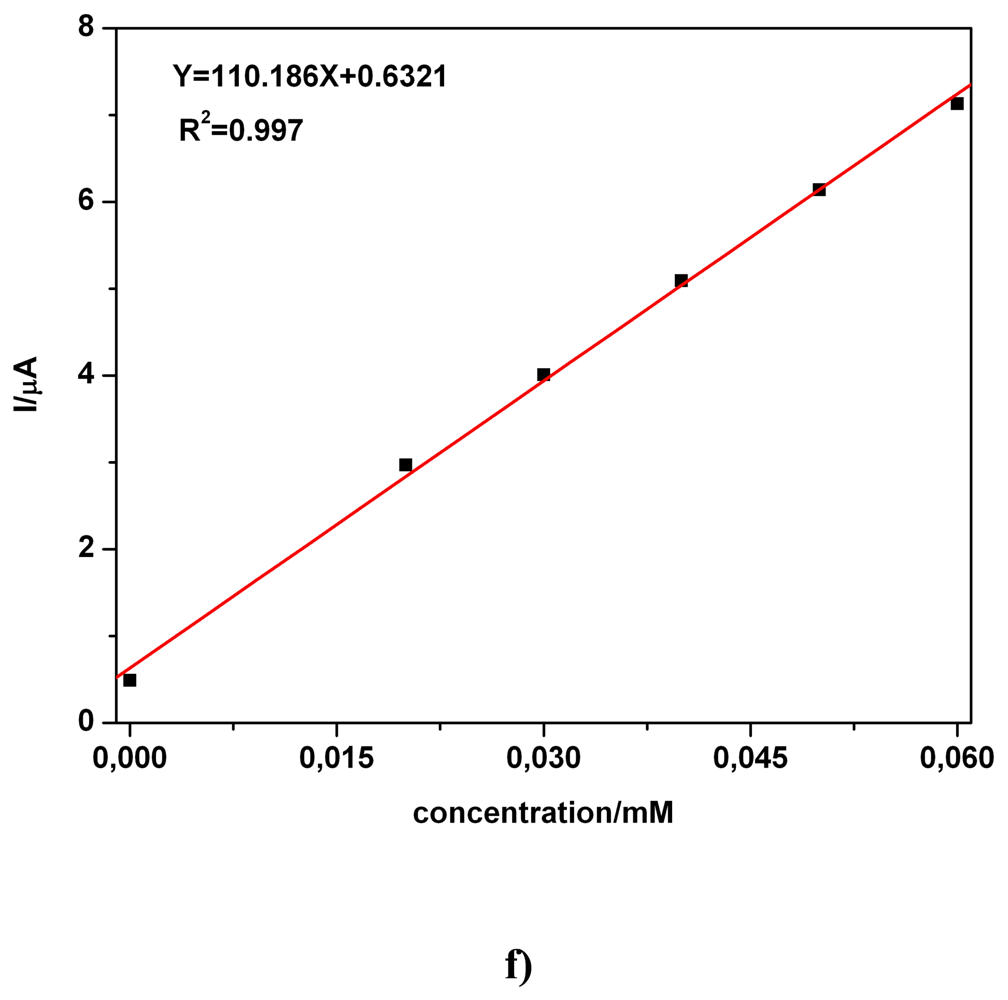
| BDD | 0.02-0.06 | I = 110.18C + 0.632 | 110.18 | 0.997 | - | 0.1 M Na2SO4 | CA1 |
| BDD | 0.02-0.06 | I = 86.785C + 0.853 | 86.785 | 0.994 | - | 0.1 M Na2SO4 | CA2 |
| BDD | 0.01-0.06 | I = 67.97C + 0.4797 | 67.97 | 0.999 | 1.42 | BR1 pH 1.96 | CV |
| BDD | 0.01-0.06 | I = 18.23C + 0.078 | 18.23 | 0.995 | 1.21 | BR1 pH 1.96 | CA** |
| BDD | 0.01-0.10 | I = 49.45C + 0.905 | 49.45 | 0.998 | 2.59 | BR2 pH 2.16 | CV |
| BDD | 0.005-0.06 | I = 14.32C + 0.0016 | 14.32 | 0.998 | 0.84 | BR2 pH 2.16 | CA** |
| BDD | 0.05-0.40 | I = 32.83C + 1.90 | 32.83 | 0.999 | 8.70 | PHB pH 7 | CV |
| GC | 0.05-0.20 | I = 31.38C + 7.48 | 31.38 | 0.994 | 25.81 | PHB pH 7 | CV |
© 2008 by the authors; licensee Molecular Diversity Preservation International, Basel, Switzerland. This article is an open-access article distributed under the terms and conditions of the Creative Commons Attribution license ( http://creativecommons.org/licenses/by/3.0/).
Share and Cite
Cinghită, D.; Radovan, C.; Dascălu, D. Anodic Voltammetry of Thioacetamide and its Amperometric Determination in Aqueous Media. Sensors 2008, 8, 4560-4581. https://doi.org/10.3390/s8084560
Cinghită D, Radovan C, Dascălu D. Anodic Voltammetry of Thioacetamide and its Amperometric Determination in Aqueous Media. Sensors. 2008; 8(8):4560-4581. https://doi.org/10.3390/s8084560
Chicago/Turabian StyleCinghită, Dan, Ciprian Radovan, and Daniela Dascălu. 2008. "Anodic Voltammetry of Thioacetamide and its Amperometric Determination in Aqueous Media" Sensors 8, no. 8: 4560-4581. https://doi.org/10.3390/s8084560
APA StyleCinghită, D., Radovan, C., & Dascălu, D. (2008). Anodic Voltammetry of Thioacetamide and its Amperometric Determination in Aqueous Media. Sensors, 8(8), 4560-4581. https://doi.org/10.3390/s8084560