Article

Development and Demonstration of Measurement-Time Efficient Methods for Impedance Spectroscopy of Electrode and Sensor Arrays

Scribner Associates Inc., 150 E. Connecticut Avenue, Southern Pines, North Carolina 28387, USA
*
Author to whom correspondence should be addressed.
Sensors 2008, 8(3), 1774-1796; https://doi.org/10.3390/s8031774
Submission received: 12 February 2008 / Accepted: 11 March 2008 / Published: 14 March 2008

Abstract

:
The development of impedance-based array devices is hindered by a lack of robust platforms and methods upon which to evaluate and interrogate sensors. One aspect to be addressed is the development of measurement-time efficient techniques for broadband impedance spectroscopy of large electrode arrays. The objective of this work was to substantially increase the low frequency impedance measurement throughput capability of a large channel count array analyzer by developing true parallel measurement methods. The goal was achieved by Fourier transform-based analysis of simultaneously-acquired multi-channel time-based current and voltage data. Efficacy and quantitative analysis of the parallel approach at frequencies less than ca. 10 Hz as well as a combined sequential + parallel approach for efficient broadband impedance spectroscopy over 5-orders of magnitude in frequency is demonstrated through complex impedance measurement of arrays consisting of up to 100 elements.

1. Introduction

Impedance-based measurement approaches, which are non-invasive, can substantially improve the selectivity and sensitivity [1-3] and yield shorter response times and more stable readings [4] when applied to chemiresistor and other sensor types. Impedance data acquired over a broad range of frequencies (i.e., impedance spectroscopy) contains more information than a DC-based measurement because the technique probes many aspects of the system investigated (i.e., the sensor as it interacts with its environment) including reaction kinetics and charge transfer processes; resistive, capacitive and dielectric properties of the sensor materials; and transport effects [5]. For example, changes in the permittivity of oxide mixtures have been used for thin and thick-film semiconductor-based sensors for gases such as NOx, H2S, COx, SOx, NH3, and other organic and combustible gases [5]. Because of these advantages, there has been growing interest in impedance-based sensors and sensor array systems [6].
Commercially-available, general purpose multi-channel analyzers capable of DC and AC impedance interrogation of arrays with up to 100 electrodes have been used to study complex electrochemical phenomenon such as metallurgical and spatiotemporal interactions in localized corrosion [7-11], combinatorial electrochemistry for discovery of improved corrosion inhibitors [12, 13], lithium-ion battery electrode materials [14-17], and fuel cell catalyst [18]. These works employ DC electrochemical measurement methods, such as linear or cyclic polarization techniques. To the authors knowledge, only one publication [19] describes impedance spectroscopy of large-channel count arrays, i.e., where N ∼ 100 electrodes.
To date, impedance spectroscopy measurements of arrays have been based on sequential interrogation of each array element at each frequency [19]. The advantage of this approach is that only one impedance analyzer is required, which substantially reduces the cost, size, mass and power consumption of the analytical instrumentation. However, a limitation of this serial approach is that the data acquisition time can be substantial at low frequency when interrogating large numbers of array elements, i.e., ca. tens of minutes to tens of hours when interrogating 100 channels to sub-Hertz frequencies.
There are numerous reasons why time-efficient methods are required for impedance spectroscopy of large electrode arrays. First, there is a need to be able to make the measurement in an experimentally practicable duration. It is beyond the patience of most researchers and experimental systems to spend hours or even days to conduct a single experiment, as is conceivable when performing impedance spectroscopy measurements at sub-Hertz frequencies sequentially on arrays with a large number of elements (see discussion on section 1.1). Second, one criteria for valid impedance measurements is a stable, unchanging system. That is, the system must be stable over the timeframe of the experiment. When the impedance of each array element is determined by sequential interrogation of each element at each frequency prior to moving to the next lowest frequency, it becomes increasingly difficult to satisfy the stability criteria because of the extended time required to complete the experiment. Similarly, transient events are more likely to either be missed or misinterpreted (due to failure to meet the stability criteria) when the measurement takes a long time to perform. Finally, some applications are restricted in their power availability and/or are required to function for an extended period of time on a fixed energy budget. Such applications include battery-powered or low-power sourced sensor array systems as well as systems for space exploration. For these applications, it is highly desirable if not essential to minimize the measurement duration. Thus, there are various reasons to address development of measurement-time efficient techniques for broadband impedance spectroscopy for large electrode arrays.
The objective of this work was to substantially increase the low frequency impedance measurement throughput capability of a large channel count array analyzer by developing true parallel measurement methods. The goal of true parallel impedance measurement at frequencies less than ∼ 10 Hz was achieved through development of Fourier transform-based analysis of simultaneously-acquired time-based multi-channel current and voltage data. In addition, we demonstrate a two-pronged measurement approach consisting of the standard sequential measurement method at high frequencies (∼ 1 kHz to 10 Hz) combined with the parallel method at low frequencies (< 10 Hz) for measurement-time efficient broadband impedance spectroscopy of large arrays. Arrays of resistor-capacitor dummy cells exhibiting frequency-dependent complex impedance characteristics consistent with chemiresistor and other sensors were used to demonstrate the efficacy of the approach.

1.1. Technique for time-efficient impedance spectroscopy of arrays

The current state-of-the-art array analyzer is the Model 910 Multi-channel Microelectrode Analyzer (MMA, Scribner Associates, Inc.). The MMA is a general purpose instrument capable of DC and AC impedance interrogation of arrays with up to 100 electrodes or sensors [19]. Impedance spectroscopy measurements with the MMA are based on sequential interrogation of each array element at each frequency. This method is referred to as the “standard” impedance measurement approach. The advantage of this approach is that only one impedance analyzer is required, which substantially reduces the cost, size, mass, and power demand of the instrument.
However, the limitation of this approach is that at low frequency (less than ∼ 1 Hz), the data acquisition time can be substantial when interrogating large numbers of array elements (∼ 10s of minutes to 10s of hours). As an example, it takes 100 seconds per electrode to perform an impedance measurement at 0.01 Hz assuming one integration cycle (more integration cycles leads to improved signal-to-noise ratio but at the cost of increased data acquisition time). An impedance measurement at this frequency performed sequentially on a 100-electrode array takes 2.8 hours. This example demonstrates that non-parallel approaches to impedance measurement of large-channel count arrays leads to unacceptable data acquisition times at low frequencies.
Table 1 demonstrates the impact on the time required to measure the impedance spectrum of 100 electrodes using the standard sequential method alone vs. a combined approach consisting of the standard sequential method at high frequencies plus a parallel measurement technique at low frequencies. The following parameters were used to estimate the measurement time as a function of method:
i. Standard (sequential) method only
  ■ Initial frequency:106 Hz
  ■ Final frequency:as indicated in Table 1
  ■ Measurement duration:0.3 s integration time or minimum of 3 cycles
ii. Standard method + Parallel method
 ◦ Standard method portion
  ■ Initial frequency:106 Hz
  ■ Final frequency:10 Hz
  ■ Measurement duration:0.3 s integration time or minimum of 3 cycles
 ◦ Parallel method portion
  ■ Initial frequency:10 Hz
  ■ Final frequency:as indicated in Table 1
  ■ Measurement duration:20 s integration time or minimum of 1 cycle
As will be demonstrated below, 10 Hz is a reasonable choice for the transition frequency from the standard sequential method to the parallel technique.
It is obvious from the results shown in Table 1 that there are substantial gains in measurement time efficiency that can be achieved through implementation for a true parallel measurement approach for large electrode arrays. The benefit afforded by the parallel method increases substantially as the minimum frequency decreases; this is because as the minimum AC frequency gets smaller (sub-Hertz), the measurement time grows exponentially for the standard method whereas it increases nearly linearly for the parallel method.
As demonstrated by the results in Table 1, to be time-efficient, low frequency impedance measurement of arrays must be performed in parallel. Therefore, the objective of this work was to develop a practicable multi-channel impedance measurement method.
To achieve this, we developed and evaluated a fast Fourier transform (FFT)-based method [20, 21]. The FFT approach uses nearly simultaneously-acquired time-domain current and voltage data permitting true parallel impedance analysis of multielectrode arrays. In this method, a common AC voltage excitation of known magnitude and frequency is imposed simultaneously on each element in the array for which an impedance measurement will be made. The current response from each sensor and the voltage are acquired in real-time. Fourier transform of the time-based voltage and current signals into the frequency domain recovers the original frequency-dependent applied AC voltage and AC current response of each channel, which are subsequently used to calculate the complex impedance of each electrode within the array.
The method is based on the well-established FFT algorithm approach to calculate the complex impedance Z(jω) from time-domain based data:
Z ( j ω ) = V ( j ω ) I ( j ω ) = F [ V ( t ) ] F [ I ( t ) ]
Here, denotes the Fourier transform, V is the system voltage, and I is the current response. The variable indicates a complex frequency-domain parameter, where j is the complex operator = √-1, and t indicates a time-domain parameter. Equation [1] reveals that the ratio of the Fourier transforms of the measured time-domain voltage and current is equal to the impedance [20, 21].
The fundamental equations are the Fourier transform coefficients [22, 23],
a n = 2 0 1 F ( x ) cos ( 2 π n x ) d x
b n = 2 0 1 F ( x ) sin ( 2 π n x ) d x
where n is a multiple of the base frequency ω and F(x) is the waveform to be correlated. Because only the fundamental (applied) frequency is analyzed, n = 1 in all cases. In discrete form,
a = 2 m 1 m F [ x ] cos ( T [ x ] ) Δ t
b = 2 m 1 m F [ x ] sin ( T [ x ] ) Δ t
where F[x] is an array of m measured values, T[x] is the time of each measured point, and Δt is the time between points. A single complex voltage and multiple current signals are calculated separately,
V = a V + j b V
I k = a I , k + j b I , k
where k is the kth channel (i.e., the kth electrode, sensor, etc.) measured. The impedance of the kth channel at the applied frequency ω is then calculated from Equation [1].

2. Experimental

2.1. Instrumentation

All experimental work was performed using a using a commercially available PC-controlled Multi-channel Microelectrode Analyzer, MMA (Model 910, Scribner Associates Inc.). Application software for the MMA instrument (MMALive®, Scribner Associates Inc.) was modified by the authors to implement the measurement schemes presented below. For all tests described below, all 100 channels of the MMA were monitored while the AC signal was applied to the array. Time-stamped multi-channel current and single-channel voltage data were acquired at a rate of ∼ 22 frames/second. That is, the current from each of the 100 channels and the common voltage signal were sampled more then 20 times per second.
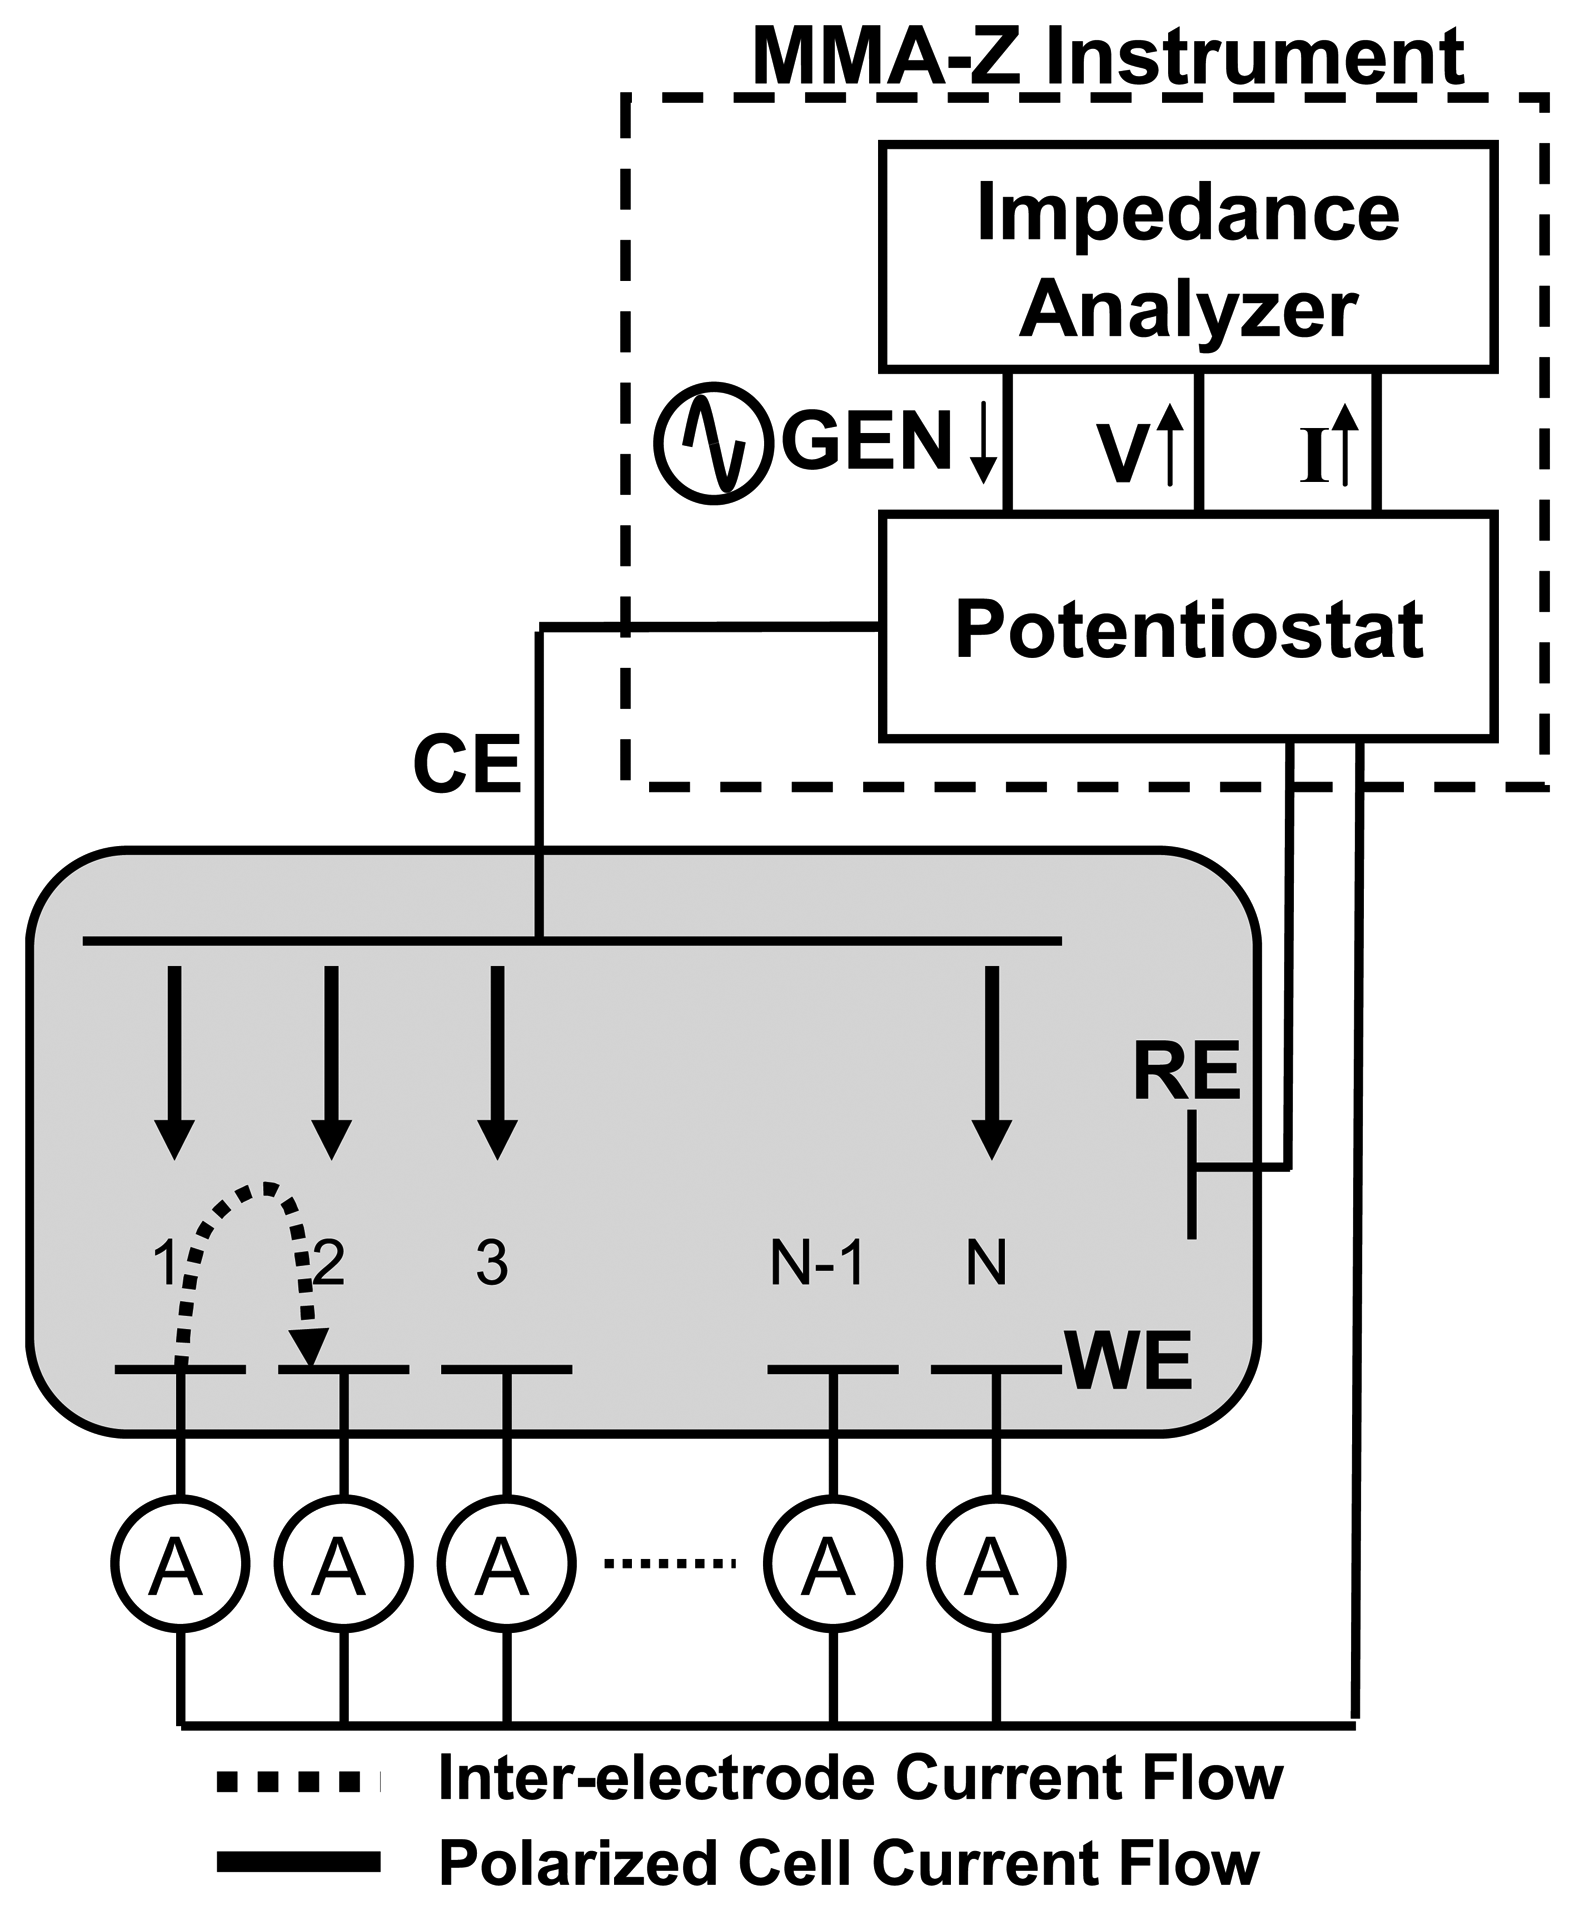
Figure 1 illustrates the typical set-up for electrochemical testing of a microelectrode or sensor array. Shown are the analytical instrument, an array and the electrochemical cell. During an experiment, the current of up to 100 separate working electrodes is measured nearly simultaneously with in-line ZRAs. For the configuration illustrated in Figure 1, the measured open circuit potential is the mixed potential of all N working electrodes, i.e., the electrode are galvanically coupled together. A DC polarization or bias can be applied to all or a subset of working electrodes with respect to a reference electrode and/or other electrode groups. Because all working electrodes are electrically coupled through the zero resistance ammeters (ZRAs), both inter-electrode and polarized cell currents can exist within the cell depending on the relative potentials imposed on the array elements.
The MMA incorporates a digital signal processor (DSP)-based impedance analyzer with a frequency range of 10 kHz to 1 mHz and a measurable impedance range of 500 to 107 Ω. The standard sequential impedance measurement method is based on the single-sine digital correlation technique used in many commercial impedance analyzers. Synchronization of the generator and analyzer is critical to ensure that signals of frequency not being generated are strongly rejected by the analyzer as noise. A small AC voltage signal of known frequency is simultaneously imposed on each array element for which the impedance is to be measured and the AC current response of each electrode sequentially evaluated by the impedance analyzer. Impedance spectroscopy measurements are performed sequentially from highest to lowest frequency. In other words, the instrument sequentially interrogates the impedance response of each electrode at a single frequency before stepping to the next lower frequency. In this way, the majority of the data is obtained for each electrode over a relative short period of time (i.e., at high frequency). A method for time-efficient low frequency impedance measurement of large arrays was described in Section 1.1.

2.2. Testing and evaluation of parallel and time-efficient impedance measurement methods

Because the focus of this work is evaluation of the performance of the analytical instrumentation and developed measurement techniques, testing was conducted using arrays of dummy cells. Dummy cells composed of electrical components (resistors and capacitors) have the advantage that the impedance of the circuit is known. Therefore, the performance of the analytical instrument and measurement methods can be accurately judged. As described below, a variety of dummy cells were employed in this work.
For the initial experiments, two of the dummy cells consisted of a 1 MΩ resistor, one was an open circuit condition (i.e., very large impedance), and the final dummy cell was a 1 nF capacitor. A 10 Hz, 25 mV AC signal was imposed on the array and the data recorded for 5 s.
A second array consisted of one hundred 100 kΩ (±1 % rated accuracy) resistors while a third array consisted of 98 resistors ranging from 1 MΩ to 10 MΩ. During these experiments, for each frequency down to 0.2 Hz, all 100 channels were measured for 5 seconds; for frequencies less than 0.2 Hz, up to 10 second acquisition time was required to get at least one full cycle.
For the second part of this work, described in section 3.2, circuits composed of resistors and capacitors were used to evaluate impedance measurement of test elements with frequency-dependent complex impedance values consistent with typical chemiresistor sensors [1-4, 24, 25]. The circuit chosen for this work consisted of a resistor (Rs) in series with a parallel resistor-capacitor element (Rp‖Cp); such an equivalent circuit is commonly used to represent an electrochemical half-cell with a single time constant and negligible mass transport resistance [21].
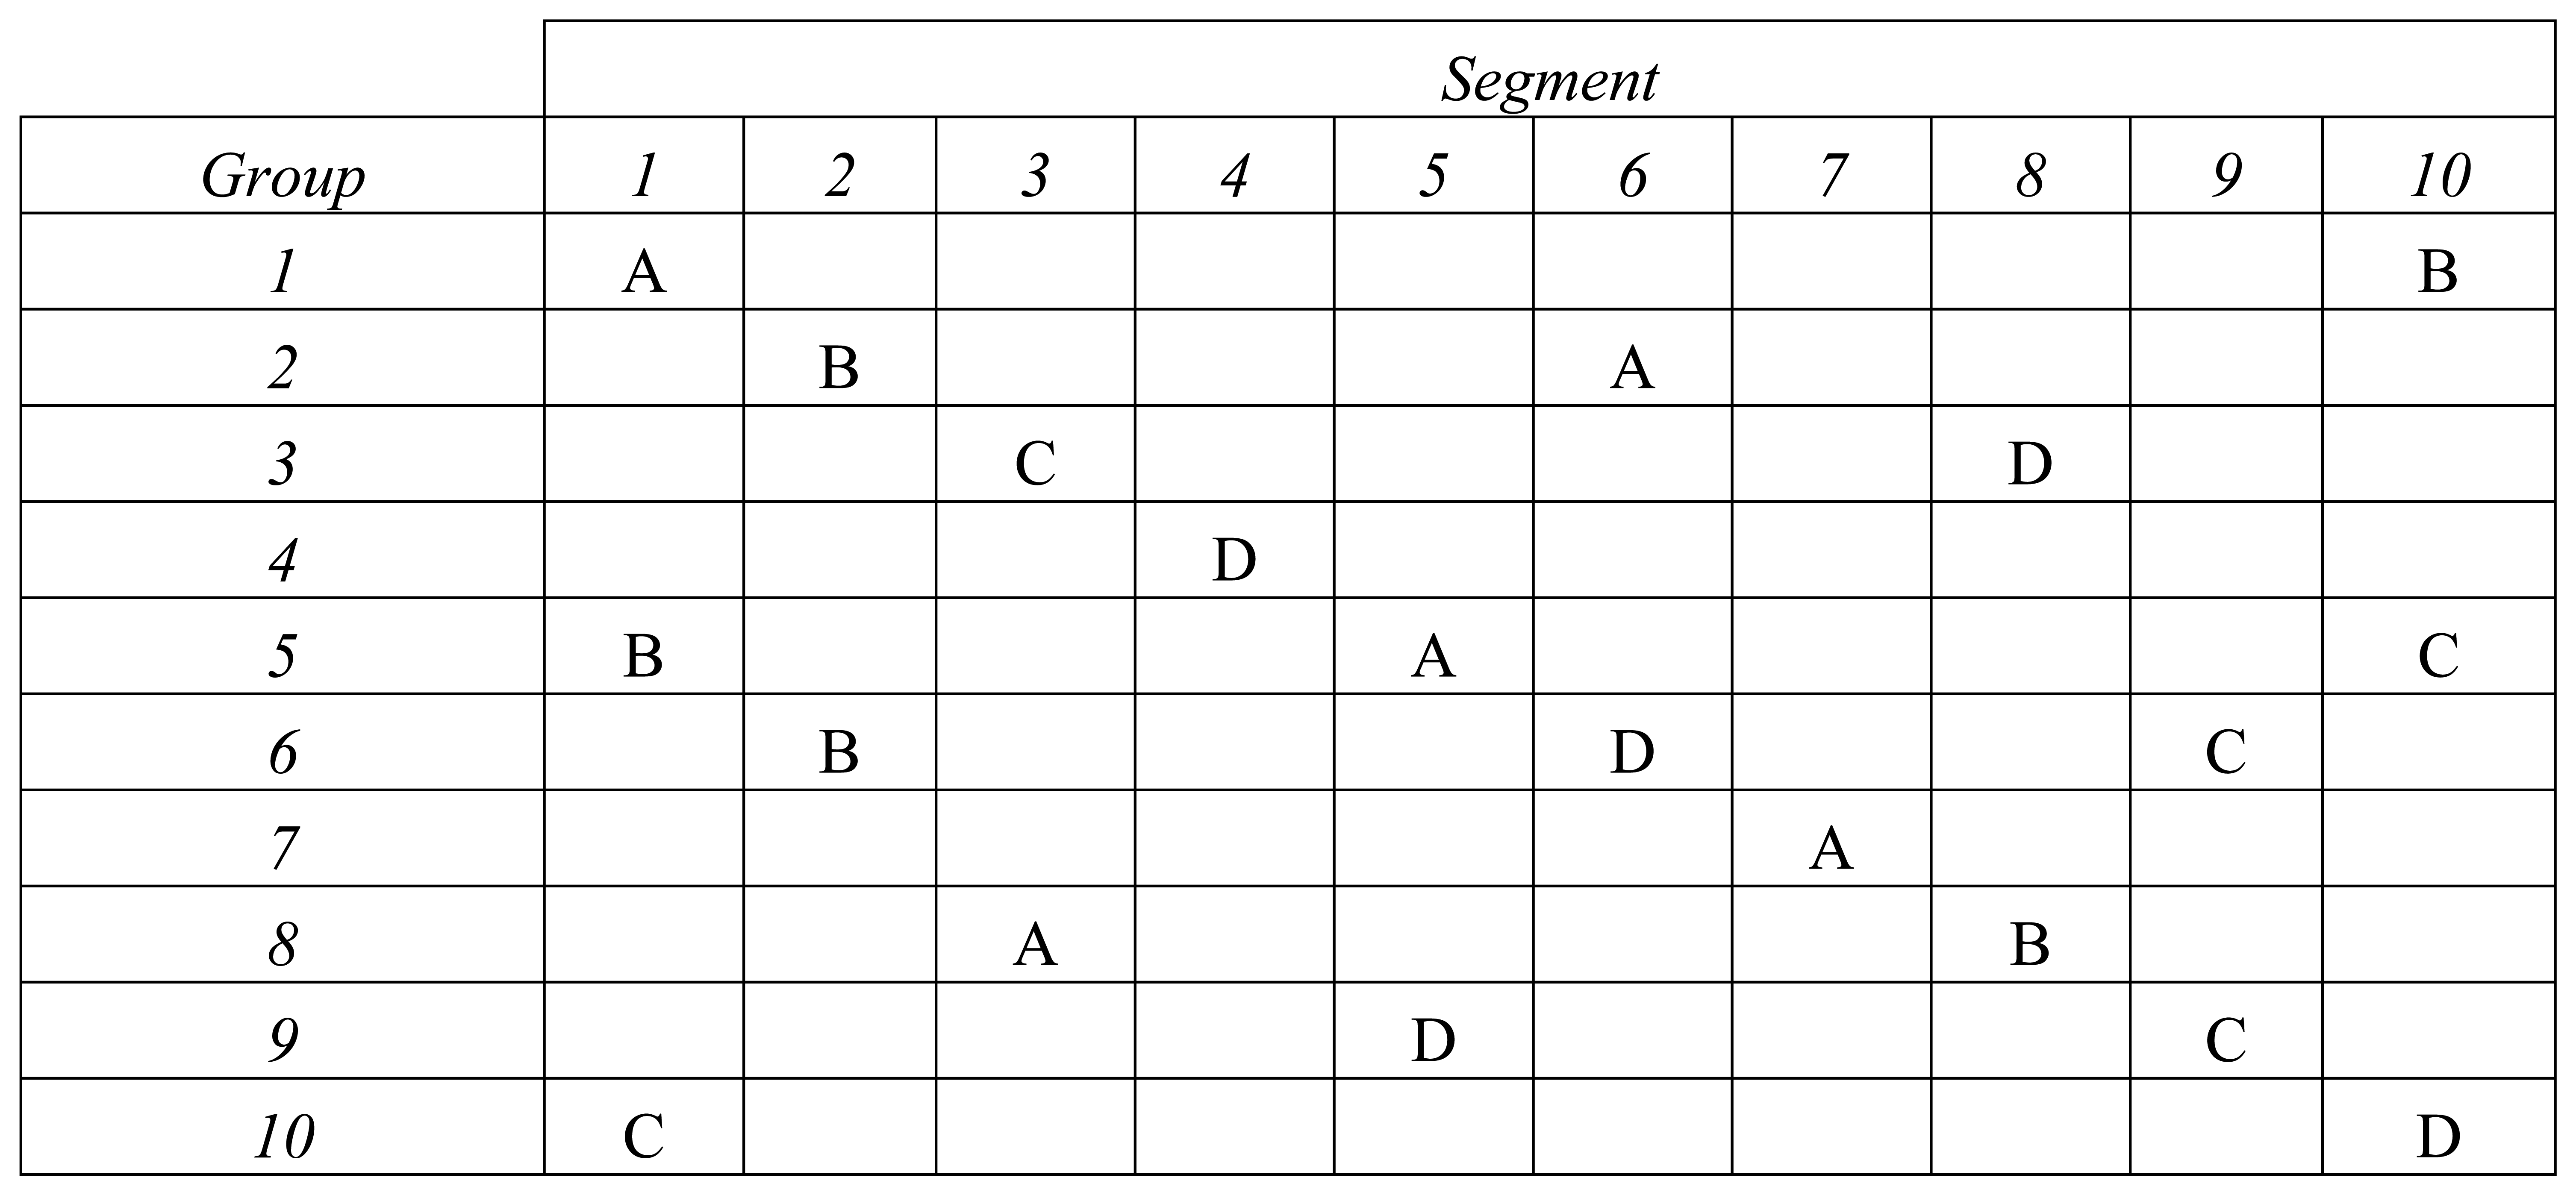
Five replicates each of 4 different dummy circuits were fabricated using resistors and capacitors with rated accuracy of ±1 %. Table 2 summarizes the four different kinds (labeled A through D) and Figure 2 shows the layout of the twenty equivalent circuits distributed across the 100-channels of the array analyzer. The intent was to distribute the dummy cells among the measurement channels to determine if there was any influence of channel or channel-order on the impedance measurement. Broadband impedance spectroscopy measurements were made using the MMA instrument described above. The standard sequential measurement approach (10 kHz to 10 Hz; 1 s integration or minimum 3 cycles) in combination with the parallel approach (10 Hz to 0.1 Hz, 20 s integration or minimum 1 cycles) was used to efficiently probe the impedance of the dummy cell array over a broad range of AC frequencies. These experiments were conducted with a 50 mV AC signal at 0 V DC bias.
The authors recognize that for highly non-linear systems, such as an electrochemical system, 50 or 250 mV AC perturbation is a large excitation signal that may result in violation of the criteria for linearity. This excitation signal was selected based on the range of impedances under investigation in relation to the dynamic range and resolution of the current measuring circuitry. Of course, impedance measurement of real systems would necessitate an AC voltage perturbation that did not displace the system from its steady-state condition in violation of the criteria for linearity. As discussed in section 3.2, this will require matching the dynamic range of the current measuring circuitry with the expected range of impedances for a given (acceptable) AC voltage perturbation signal.

3. Results and Discussion

The results of this work are presented in two parts. First we describe implementation and demonstration of the parallel multi-channel impedance measurement approach detailed in section 1.1. The benefits and challenges associated with practicable implementation of the parallel method, such as measurement time efficiency and time skew, respectively, are presented. The second part describes experiments designed to demonstrate the efficacy of a combined sequential + parallel measurement approach on dummy cells composed of resistor-capacitor networks that mimic in their frequency-dependent impedance response typical sensor and/or electrochemical systems.

3.1. Implementation of a method for parallel multi-channel low frequency impedance spectroscopy

The parallel multi-channel impedance measurement approach described in Section 1.1 was implemented in the MMA. Initial tests were performed on 4 simple dummy cells: two of the dummy cells consisted of a 1 MΩ resistor, an open circuit condition reproduced a very high impedance condition, and the final dummy cell was a 1 nF capacitor. Multi-channel current and the common voltage signal were acquired at a rate of approximately 22 samples/second.
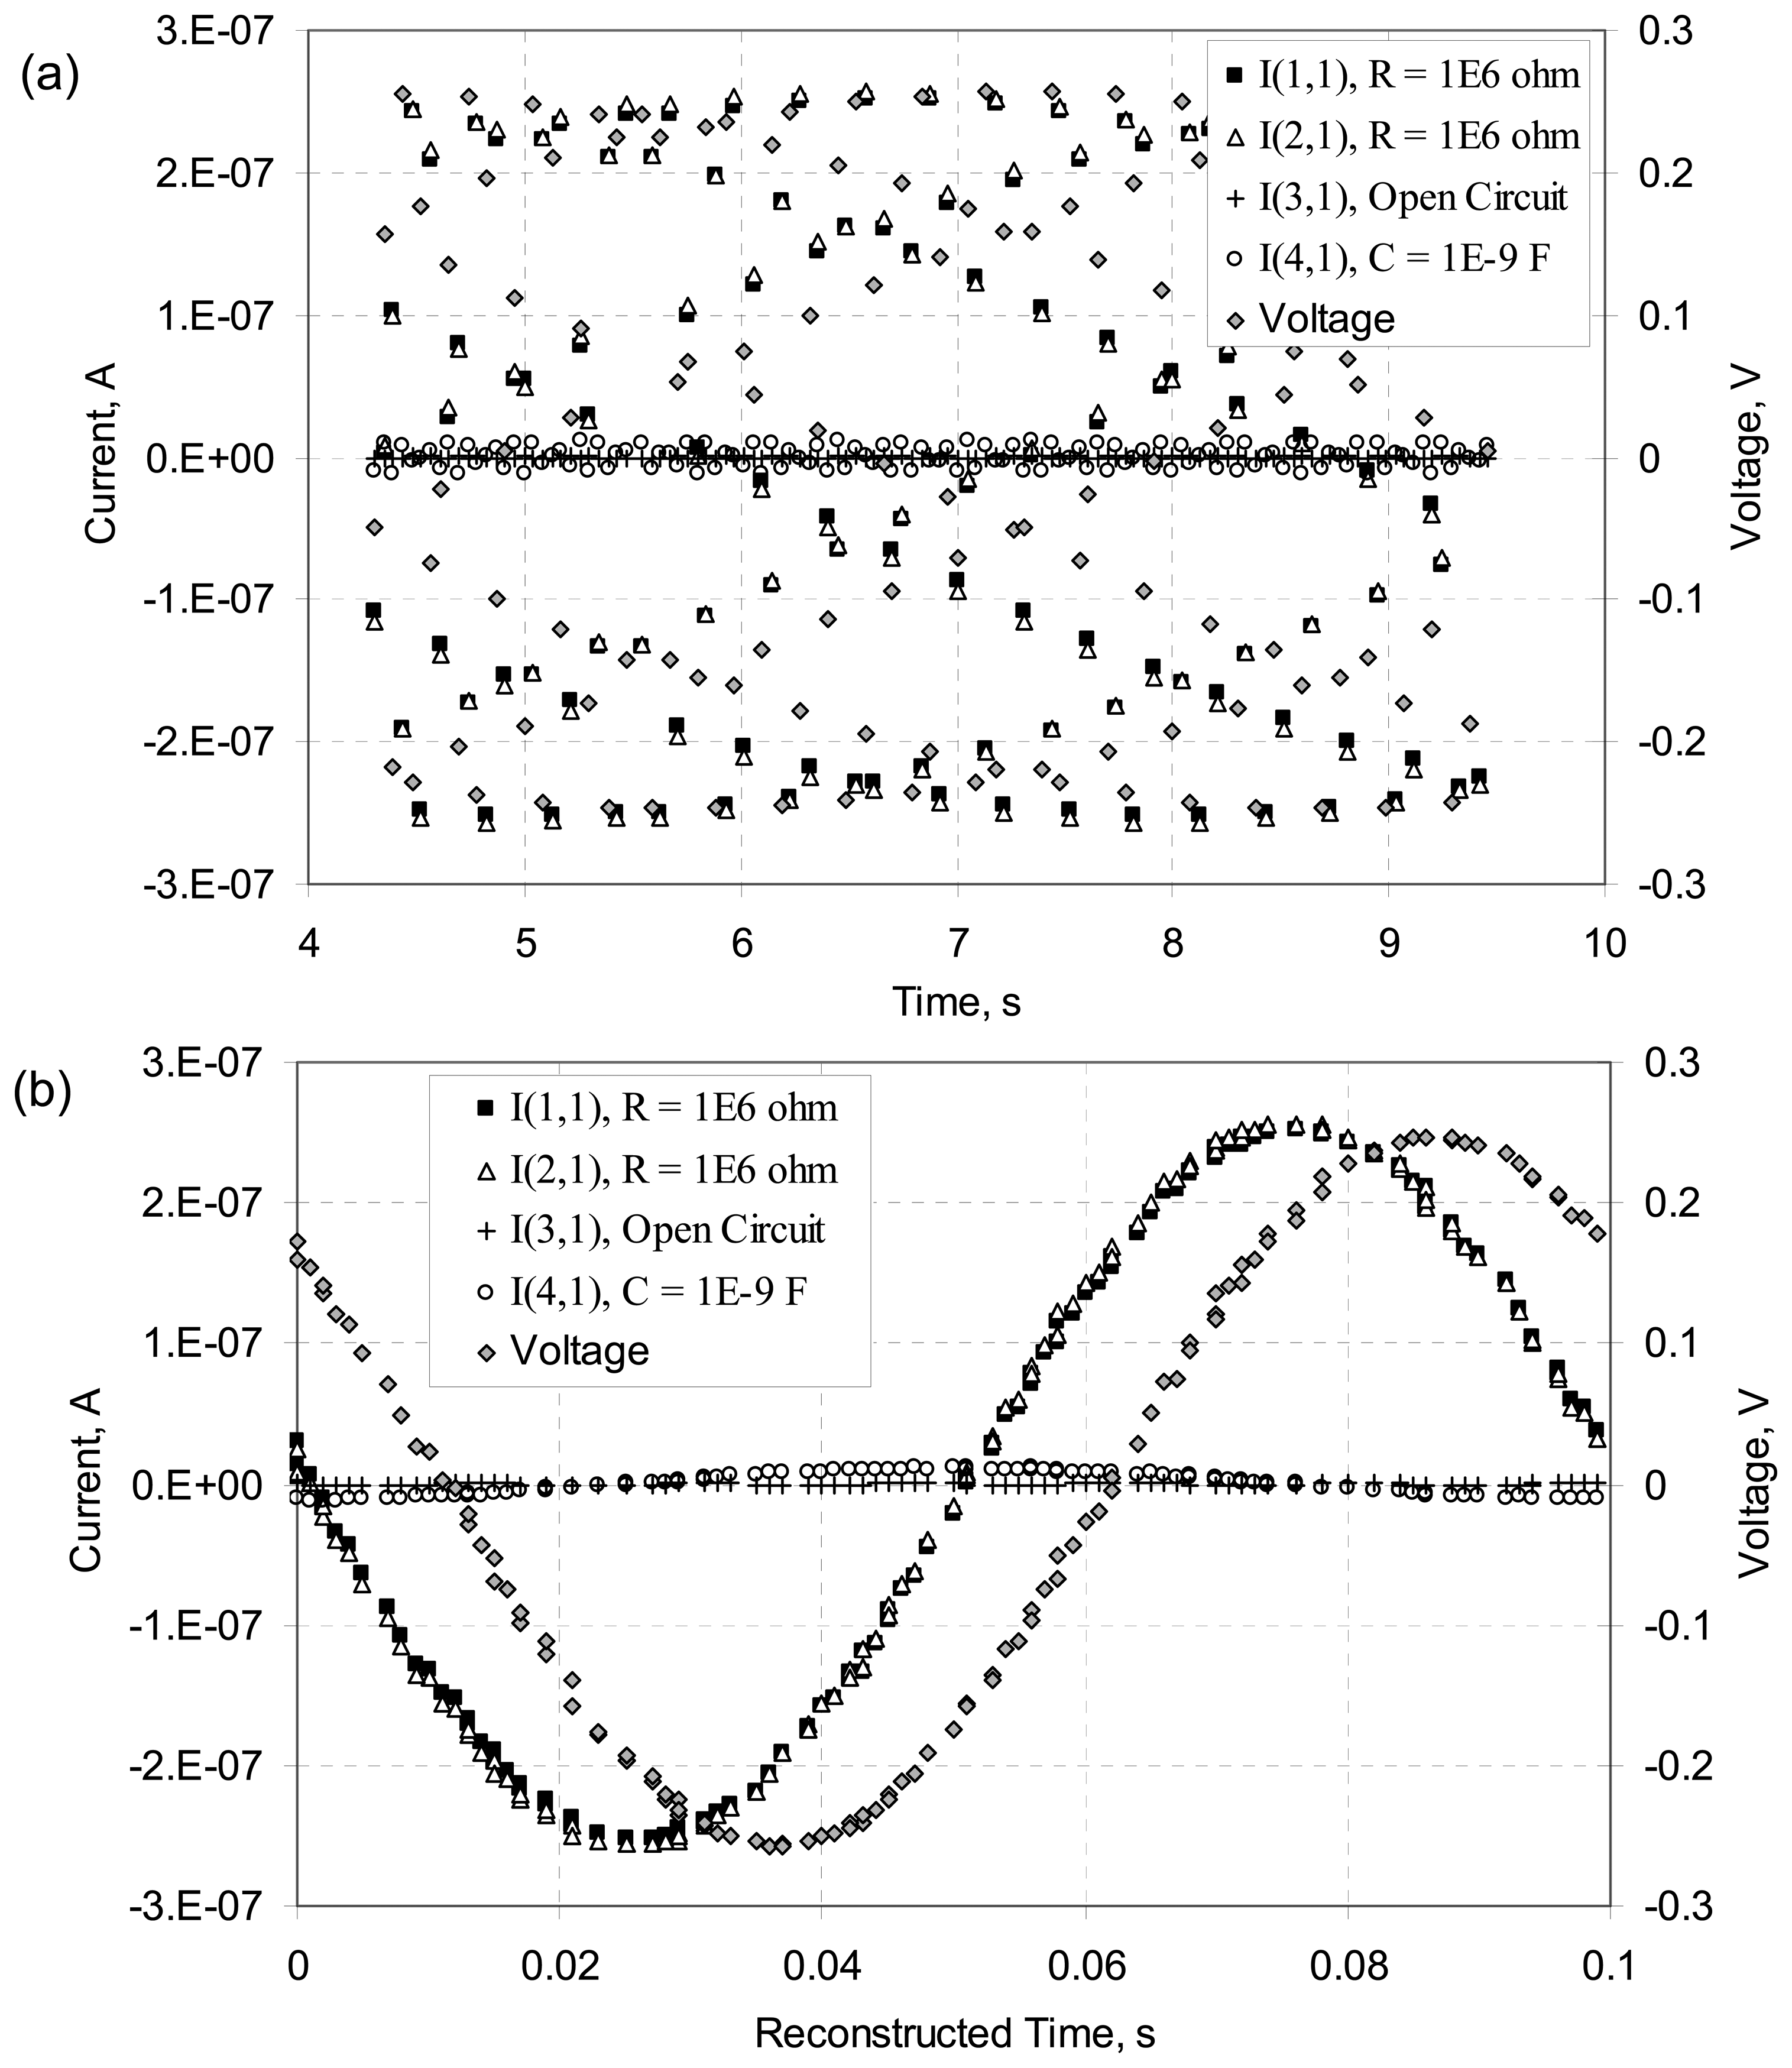
Figure 3(a) shows the original time series. As expected, for any given channel of current (I(x,y)) or the voltage data (Voltage;, there are ca. 22 data points for every second of data acquisition. The frequency dependence of the current, if any, is not revealed in the raw time-based data, however. The raw time-based data appears as pure noise. Figure 3(b) shows a reconstructed, single sine wave generated from the raw time-based data shown in part (a). The time base is reconstructed by subtracting a multiple of the known period of the waveform. The reconstructed time for each data point is the time since the start of the most recent waveform. The imposed 10 Hz sine wave is evident in the reconstructed data.
Note that an exact sampling rate is not necessary, and in fact could be detrimental. It is very important to know exactly when a signal was sampled, but sampling at a particular frequency is not required. That is, sampling at approximately 22 frames/second is better than measuring at exactly 22 (or 10, 20, etc.) frames/second. Consider the case in which each frame (or channel) was measured at exactly 20 times/second. For an applied AC frequency of 10 Hz, such a sampling rate would result in all of the points for a particular channel to coincide at exactly 2 locations (i.e., 2 times) within the reconstructed waveform. Such a data set would confound the subsequent FFT data analysis required for the calculation of the complex impedance. In contrast, a sample rate that is not a whole multiple of the measurement frequency causes the samples to be distributed within the reconstructed waveform.
There are two relatively simple approaches to dealing with the need for a non-perfect sampling. The first is to incorporate a small (∼ 0.01 second) random delay to the triggering of each frame. An alternative approach would use a precise sample rate that is not a multiple of the applied AC frequency. For example, sampling for 10 s at 20.01 frames/second would spread the data for any given channel over 0.1 s within the reconstructed time-base. Thus, although an exact sampling rate is not required, there is a constraint to know precisely when a signal is sampled, as demonstrated further below.
Within the reconstructed time-base of Figure 3(b) we observe that there is an obvious phase difference between the current data for the resistors (channels I(1,1) and I(2,1)) and the capacitor (channel I(4,1)) with respect to the voltage data. That is, the current data for the resistor channels and the voltage channel data are not in-phase; ideally, current and voltage are in-phase for a purely resistive element. Likewise, current data for the channel with the capacitor element is not -90° out-of-phase with the voltage data; ideally, current and voltage are exactly out-of-phase for a purely capacitive element. The phase shift is suggestive of time skew in the data. Such time skew confounds further processing of the data for extraction of the component impedance, which is the property of interest. For each frame, all 100 currents followed by the voltage are measured in very rapid succession. Time skew in the data acquired between channels occurs because a small finite amount of time (∼ 100 μs) is required to execute each sample event.
Figure 3(b) further reveals that the time skew between the two channels with 1 MΩ resistors (I(1,1,) and I(1,2)) was small compared to the time skew between each of these channels and the voltage data; this occurs because these two current channels were measured one after the other at the start of each frame while the voltage signal was measured at the end of each frame. Fortunately, the time skew was consistent and could be accounted for.
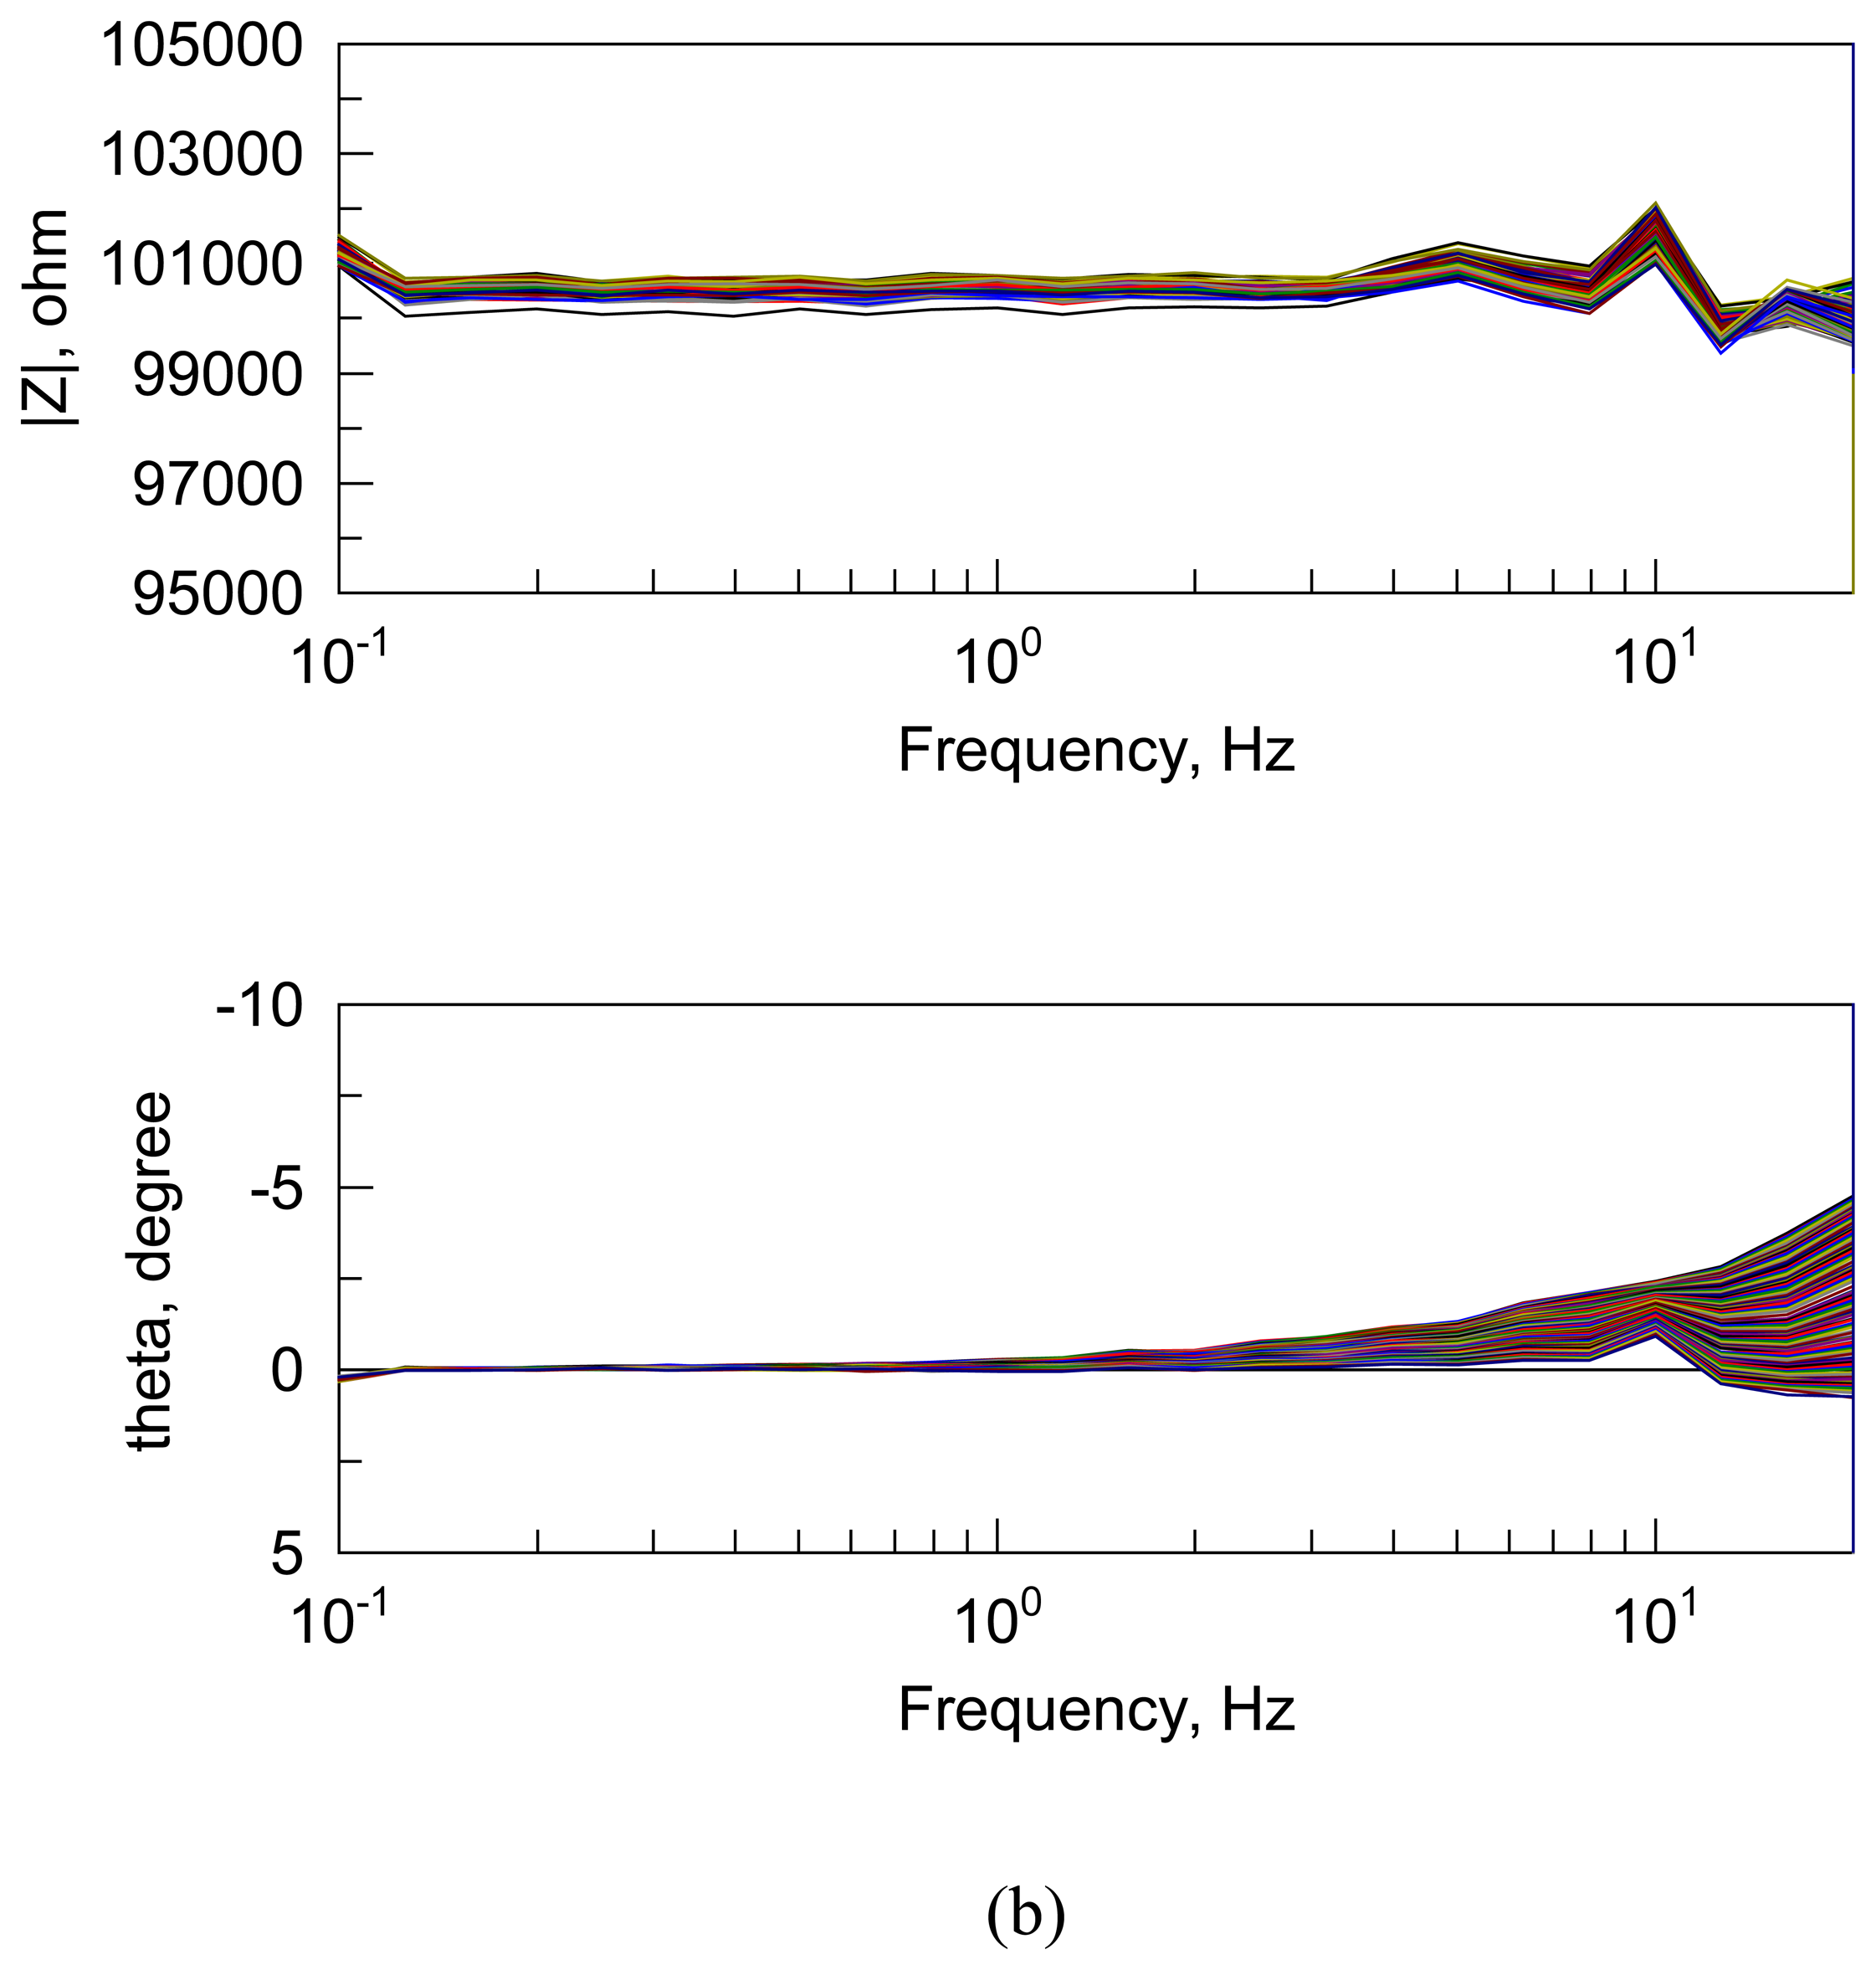
To address the issue of time skew between channels, we determined a series of correction factors by measuring the time delay between each current sample and the voltage sample, determining the order in which each channel of current and the voltage was sampled, and assessing how the number of channels sampled influenced the time skew between samples. The MMA application software was modified to use these correction factors to automatically account for time skew between measurements in the raw time-based data. As presented below, testing with 100-element resistor arrays verified the efficacy of this approach. Figure 4 shows the results of a set of impedance experiments with and without the time skew correction factors applied. As described previously, time-based data was acquired in real-time at ∼ 22 frames per second and the frequency-dependence reconstructed from time-based data. Equations [1] and [4]-[7] were used to calculate the impedance. The figure shows the impedance from 100 channels each connected to a 100 kΩ resistor (±1 % rated accuracy).
The effect of time skew is particularly evident by comparing the phase angle vs. frequency graph of Figure 4(a) and (b). These results reveal that accounting for the time skew between channels significantly improves the measurement accuracy and increases the upper frequency at which this approach may be successfully implemented. It is evident that the FFT approach to parallel low frequency impedance measurement of large arrays is feasible at frequencies less than about 20 Hz, although it should be noted that the frequency limit is hardware dependent as discussed below. At frequencies greater than 20 Hz, it is believed that time resolution and/or the accuracy of the time stamp are the dominant sources of error. The timer in the host PC is used to record the time, but there is ∼ 1 millisecond (ms) randomness between when a measurement actually starts, and when the PC “thinks” it starts. At 20 Hz (50 ms period), a 1 ms noise corresponds to about 2 % error, which is consistent with the error obtained in impedance measurements using the parallel approach at ∼ 20 Hz (see Figure 4(b)). Future work in this area includes using a more accurate clock for the time-stamp measurement, either from the host PC/operating system or via an on-board clock, which will generate more accurate and higher resolution time-stamp information. This, along with faster data acquisition capability (more frames/second), is expected to increase the practicable upper frequency limit of the parallel impedance measurement approach.
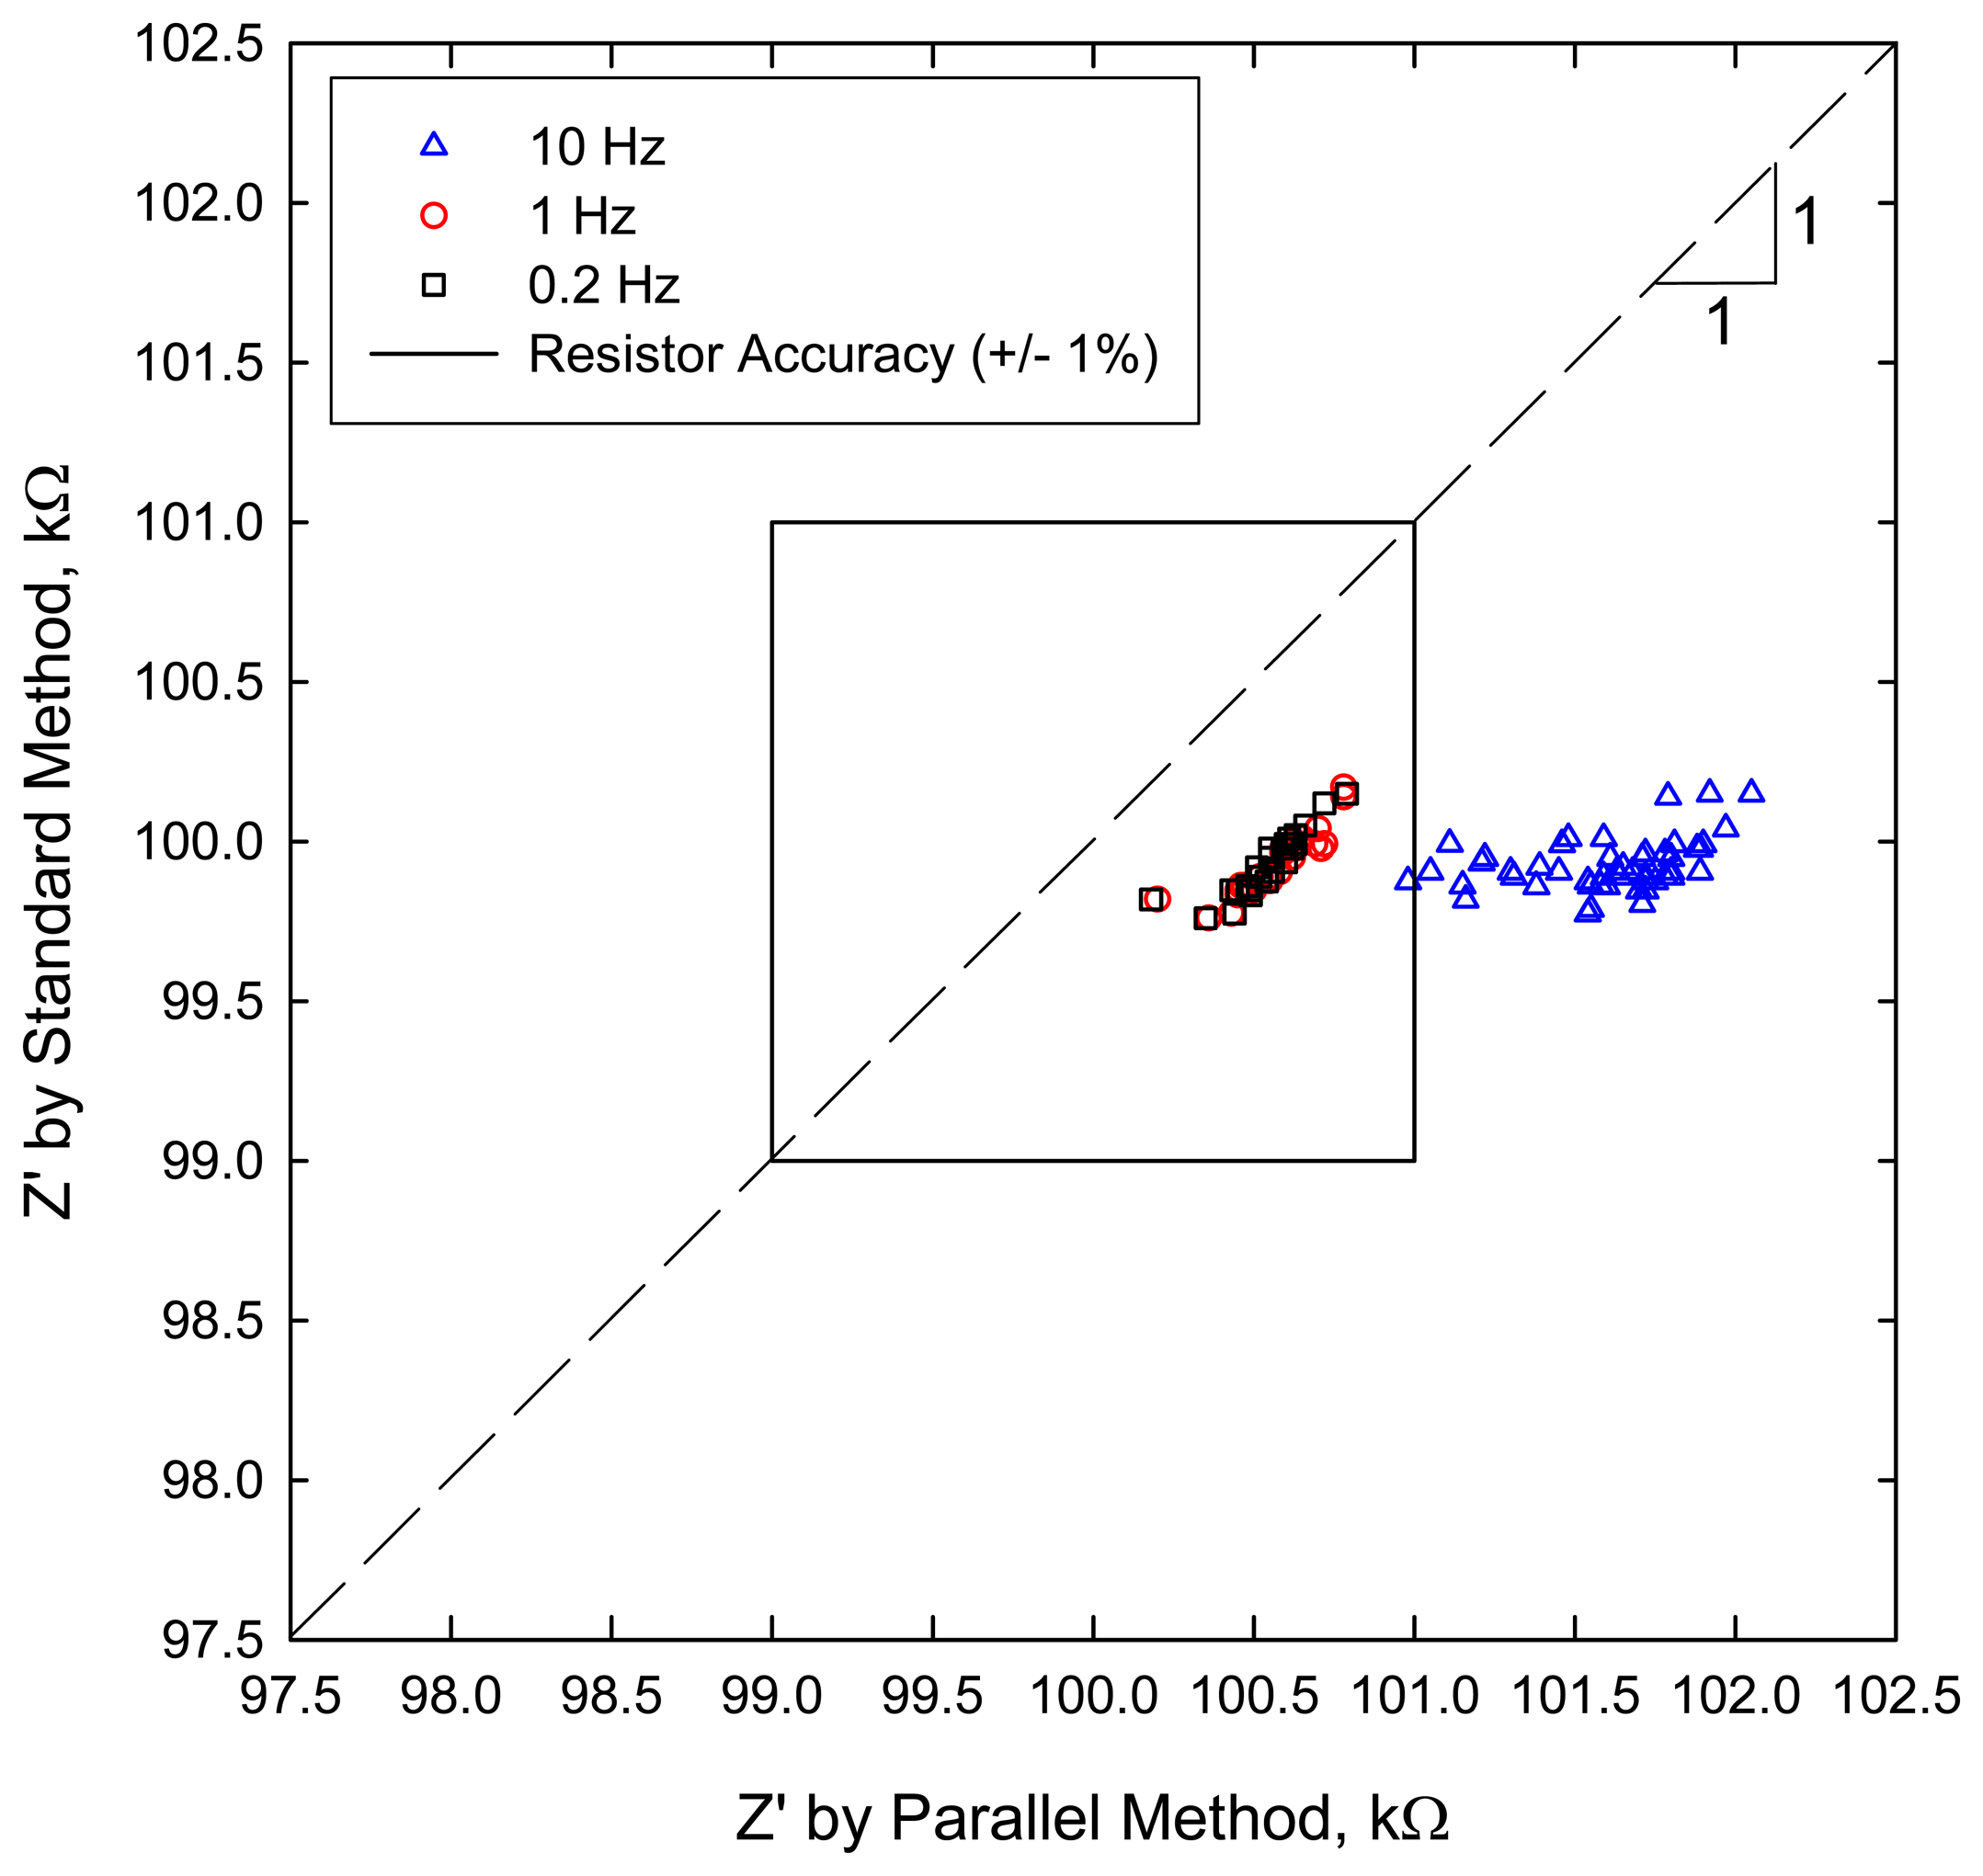
We can quantify the accuracy of the parallel method by comparing its results to that obtained with the standard method. Table 3 summarizes statistical properties of the real component of the impedance Z′ for the parallel and standard measurement methods when measuring an array composed of ninety-eight (98) 100 kΩ resistors (±1 % rated accuracy). In addition, Figure 5 shows the real impedance Z′ determined via the two methods where the box indicates the region of expected values based on the rated accuracy of the resistors.
Three frequencies were analyzed: 10, 1 and 0.2 Hz. Good agreement between the two methods is observed at the lowest frequencies, 0.2 and 1 Hz. In fact, close observation of the data sets at these frequencies reveals that they essentially overlap and are only slightly displaced from the 1:1 line. For these frequencies, there is less than 1 % difference between the mean of the result obtained from the parallel method and the standard method (see “% Difference” in Table 3).
At 10 Hz, the parallel method produced slightly greater values than the standard method. This is indicated by the larger positive % Difference value at 10 Hz shown in Table 3 as compared to the other frequencies as well as by the shift to the right of the 10 Hz data in Figure 5. The discrepancy in values at 10 Hz is due to increased phase error resulting from non-optimized time skew factors and/or the effects of error in the time-stamp data. Errors due to these sources are exacerbated at higher frequency. Improvements in these areas will improve the accuracy and highest frequency at which the parallel low frequency method can be successfully applied.
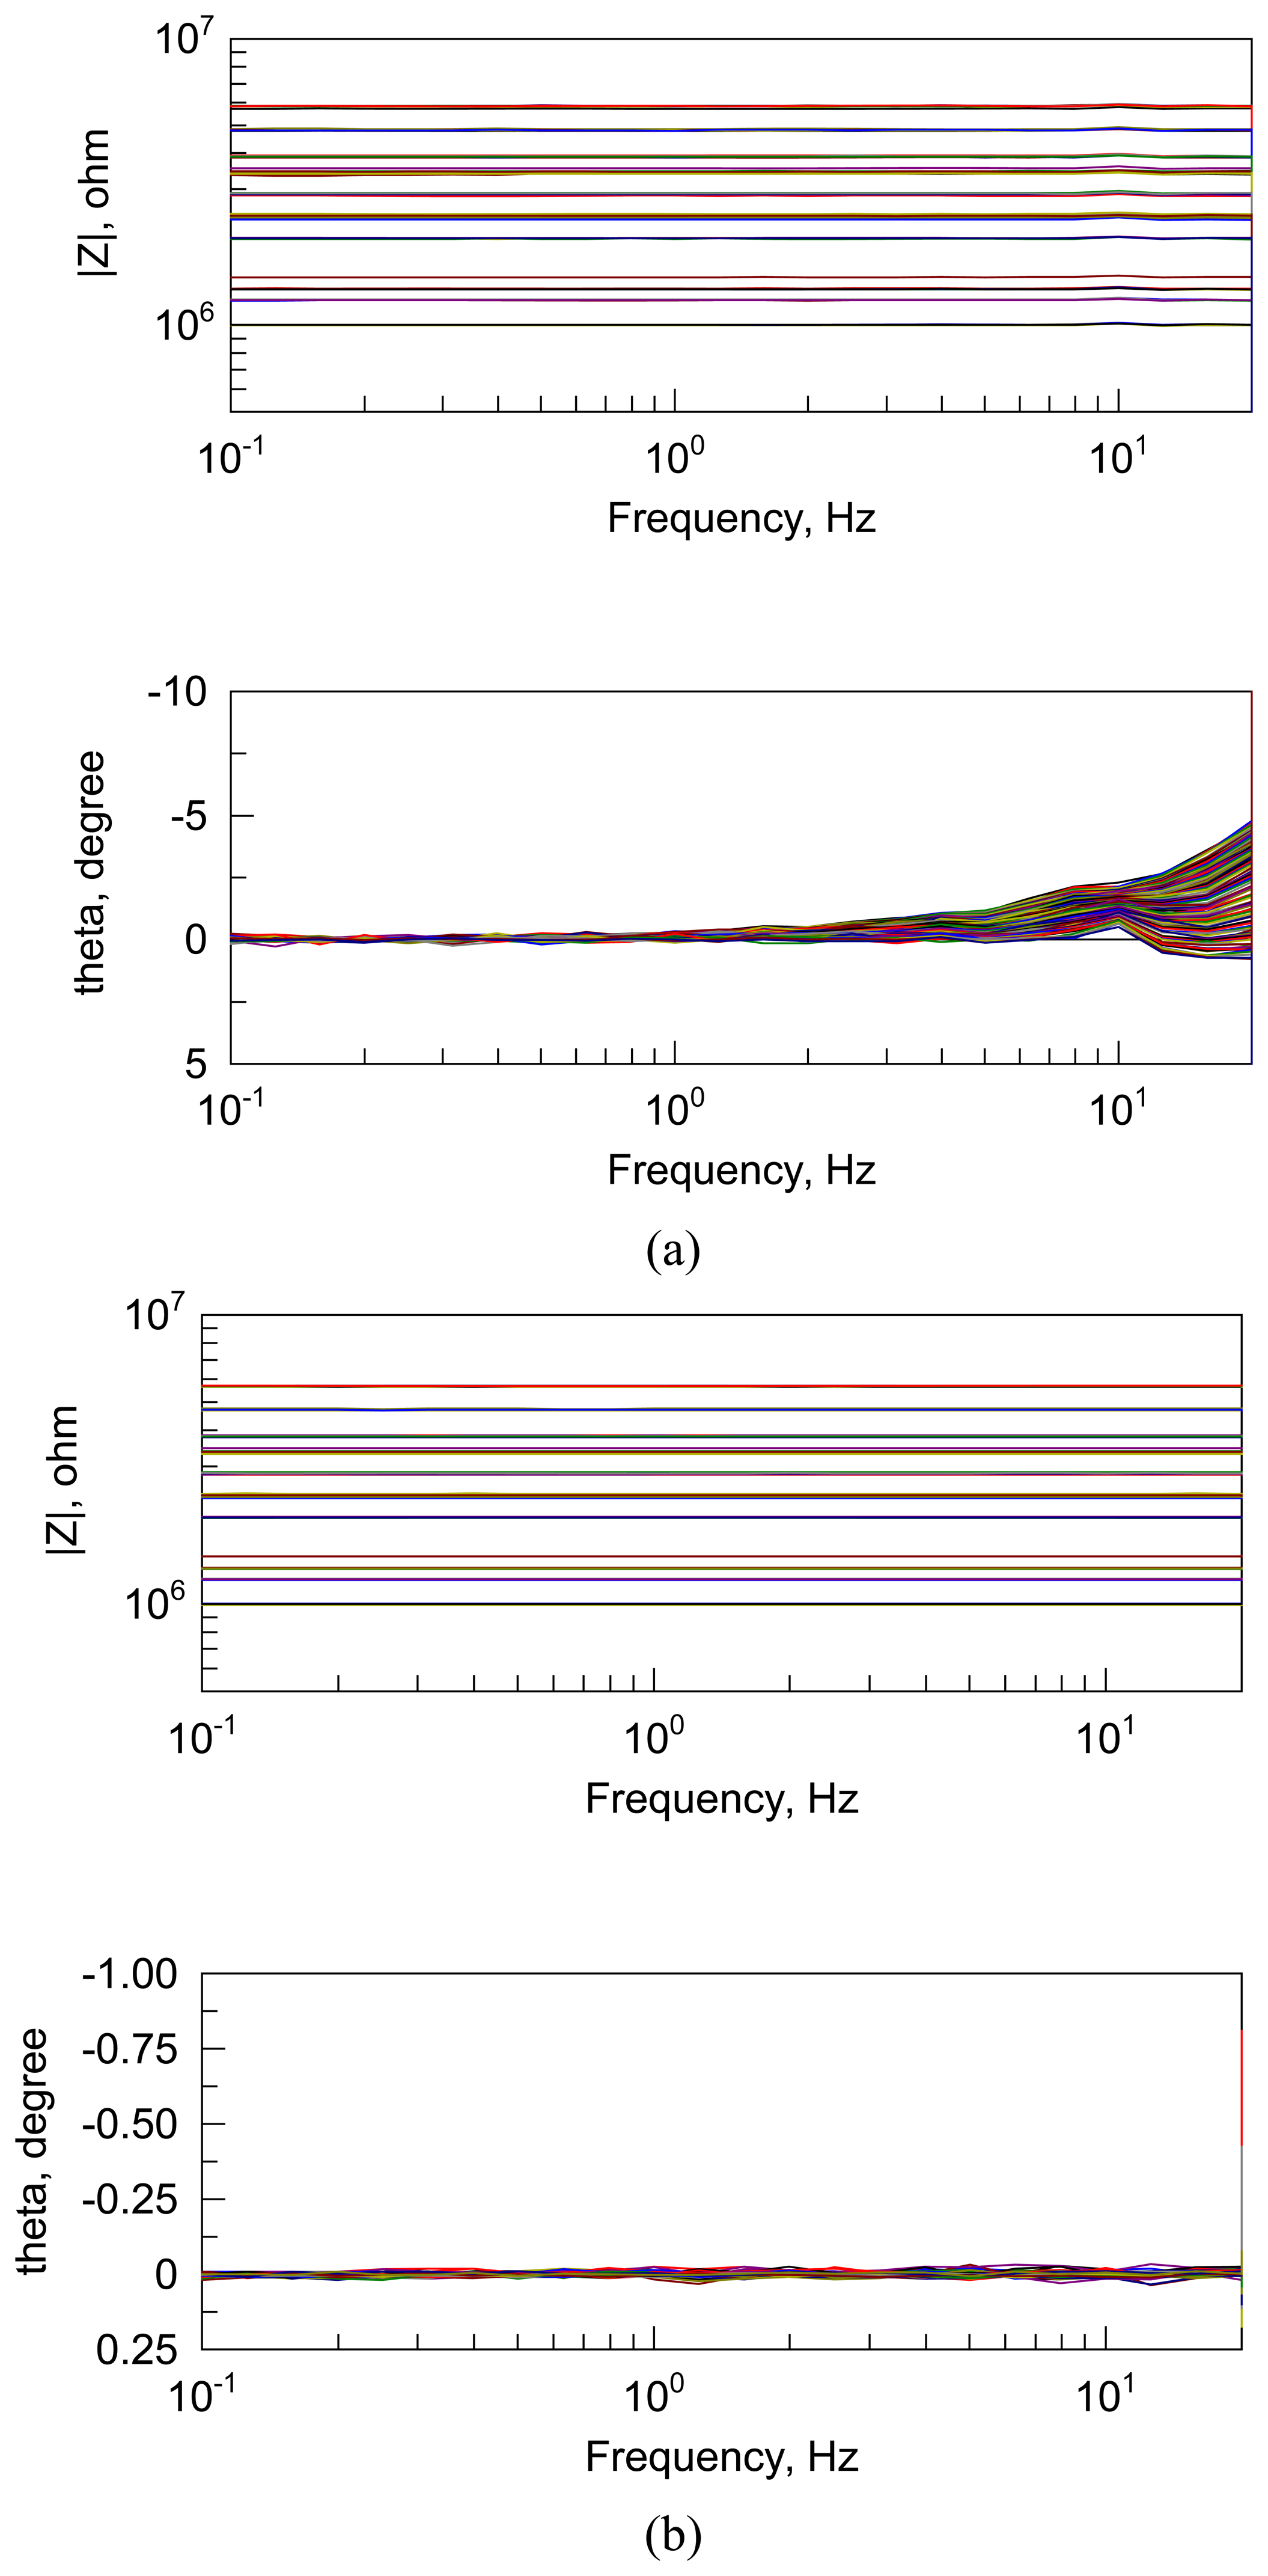
As further demonstration of the efficacy and advantage of the FFT-based parallel method for low frequency impedance measurement of electrode or sensor arrays, the impedance of an array composed of 100 resistors ranging from 1 MΩ to 50 MΩ was determined using the parallel and “standard” sequential approach. Recall that in the standard approach, at each frequency the impedance of each electrode within the array is determined before stepping to the next lower frequency. While this approach is efficient at high frequency, at low frequency the experimental time becomes significant.
Bode plots showing the impedance magnitude and phase angle (theta) as a function of frequency for both the standard sequential and parallel techniques are shown in Figure 6. Because these figures contain a large data set (100 channels) it is not feasible to compare the results of the two methods for a given resistor value or channel. However, the results qualitatively demonstrate that the parallel method provides results that are consistent with the standard approach, in particular at frequencies less than ∼ 10 Hz for which the phase angle < 2.5° (and ideally should be 0°).
It is worth reiterating the benefit of the parallel approach to low frequency impedance spectroscopy in multi-channel systems. The following conditions were used to measure the impedance of the two types of 100-element resistor arrays presented above: 1 kHz to 0.1 Hz; 10 steps/decade; duration: 5 second per frequency for parallel method, minimum of 0.3 second or 1 cycle for standard method. For these conditions, the parallel measurement method required 7 minutes of data acquisition time whereas the standard sequential method required 120 minutes. Thus, a 17-fold reduction in experimental time was achieved by the parallel measurement method. The increase in time-efficiency of the parallel method as compared to the standard method was derived at frequencies less than about 10 Hz.
Despite the forgoing discussion, it should be recognized that ultimately one probably would not want to apply the parallel method at frequencies greater than about 10 Hz because the advantages of the parallel method, with respect to measurement time efficiency gains, are not realized at higher frequencies and because errors caused by limitations in time-based measurement accuracy are exacerbated at higher frequencies. It is better to use the standard method of impedance measurement at frequencies greater than about 10 Hz and the parallel method at frequencies less than about 10 Hz. Implementation of the optimum solution to broad frequency sweep impedance measurement of large arrays will involve the use of the standard, sequential approach at high frequencies combined with a transition to the parallel approach for the low frequency range. This hybrid or two-pronged approach to time-efficient impedance spectroscopy of large arrays is addressed in the next section.

3.2. Demonstration of efficient broadband impedance spectroscopy of large arrays

Here, we assess the performance of a multi-channel impedance analyzer with an array of dummy cells that exhibit frequency-dependent response and with impedance and reactance values consistent with typical chemiresistor sensors [1-4, 24, 25]. Specifically, each dummy cell was composed of a resistor (Rs) in series with a parallel resistor-capacitor element (Rp‖Cp). This specific resistor-capacitor configuration is commonly used to represent an electrochemical half-cell with a single time constant and negligible mass transport resistance [21]. Dummy cells composed of electrical components (resistors and capacitors) have the advantage that we know a priori the (frequency-dependent) impedance of the circuit and therefore can accurately judge the performance of the analytical instrument.
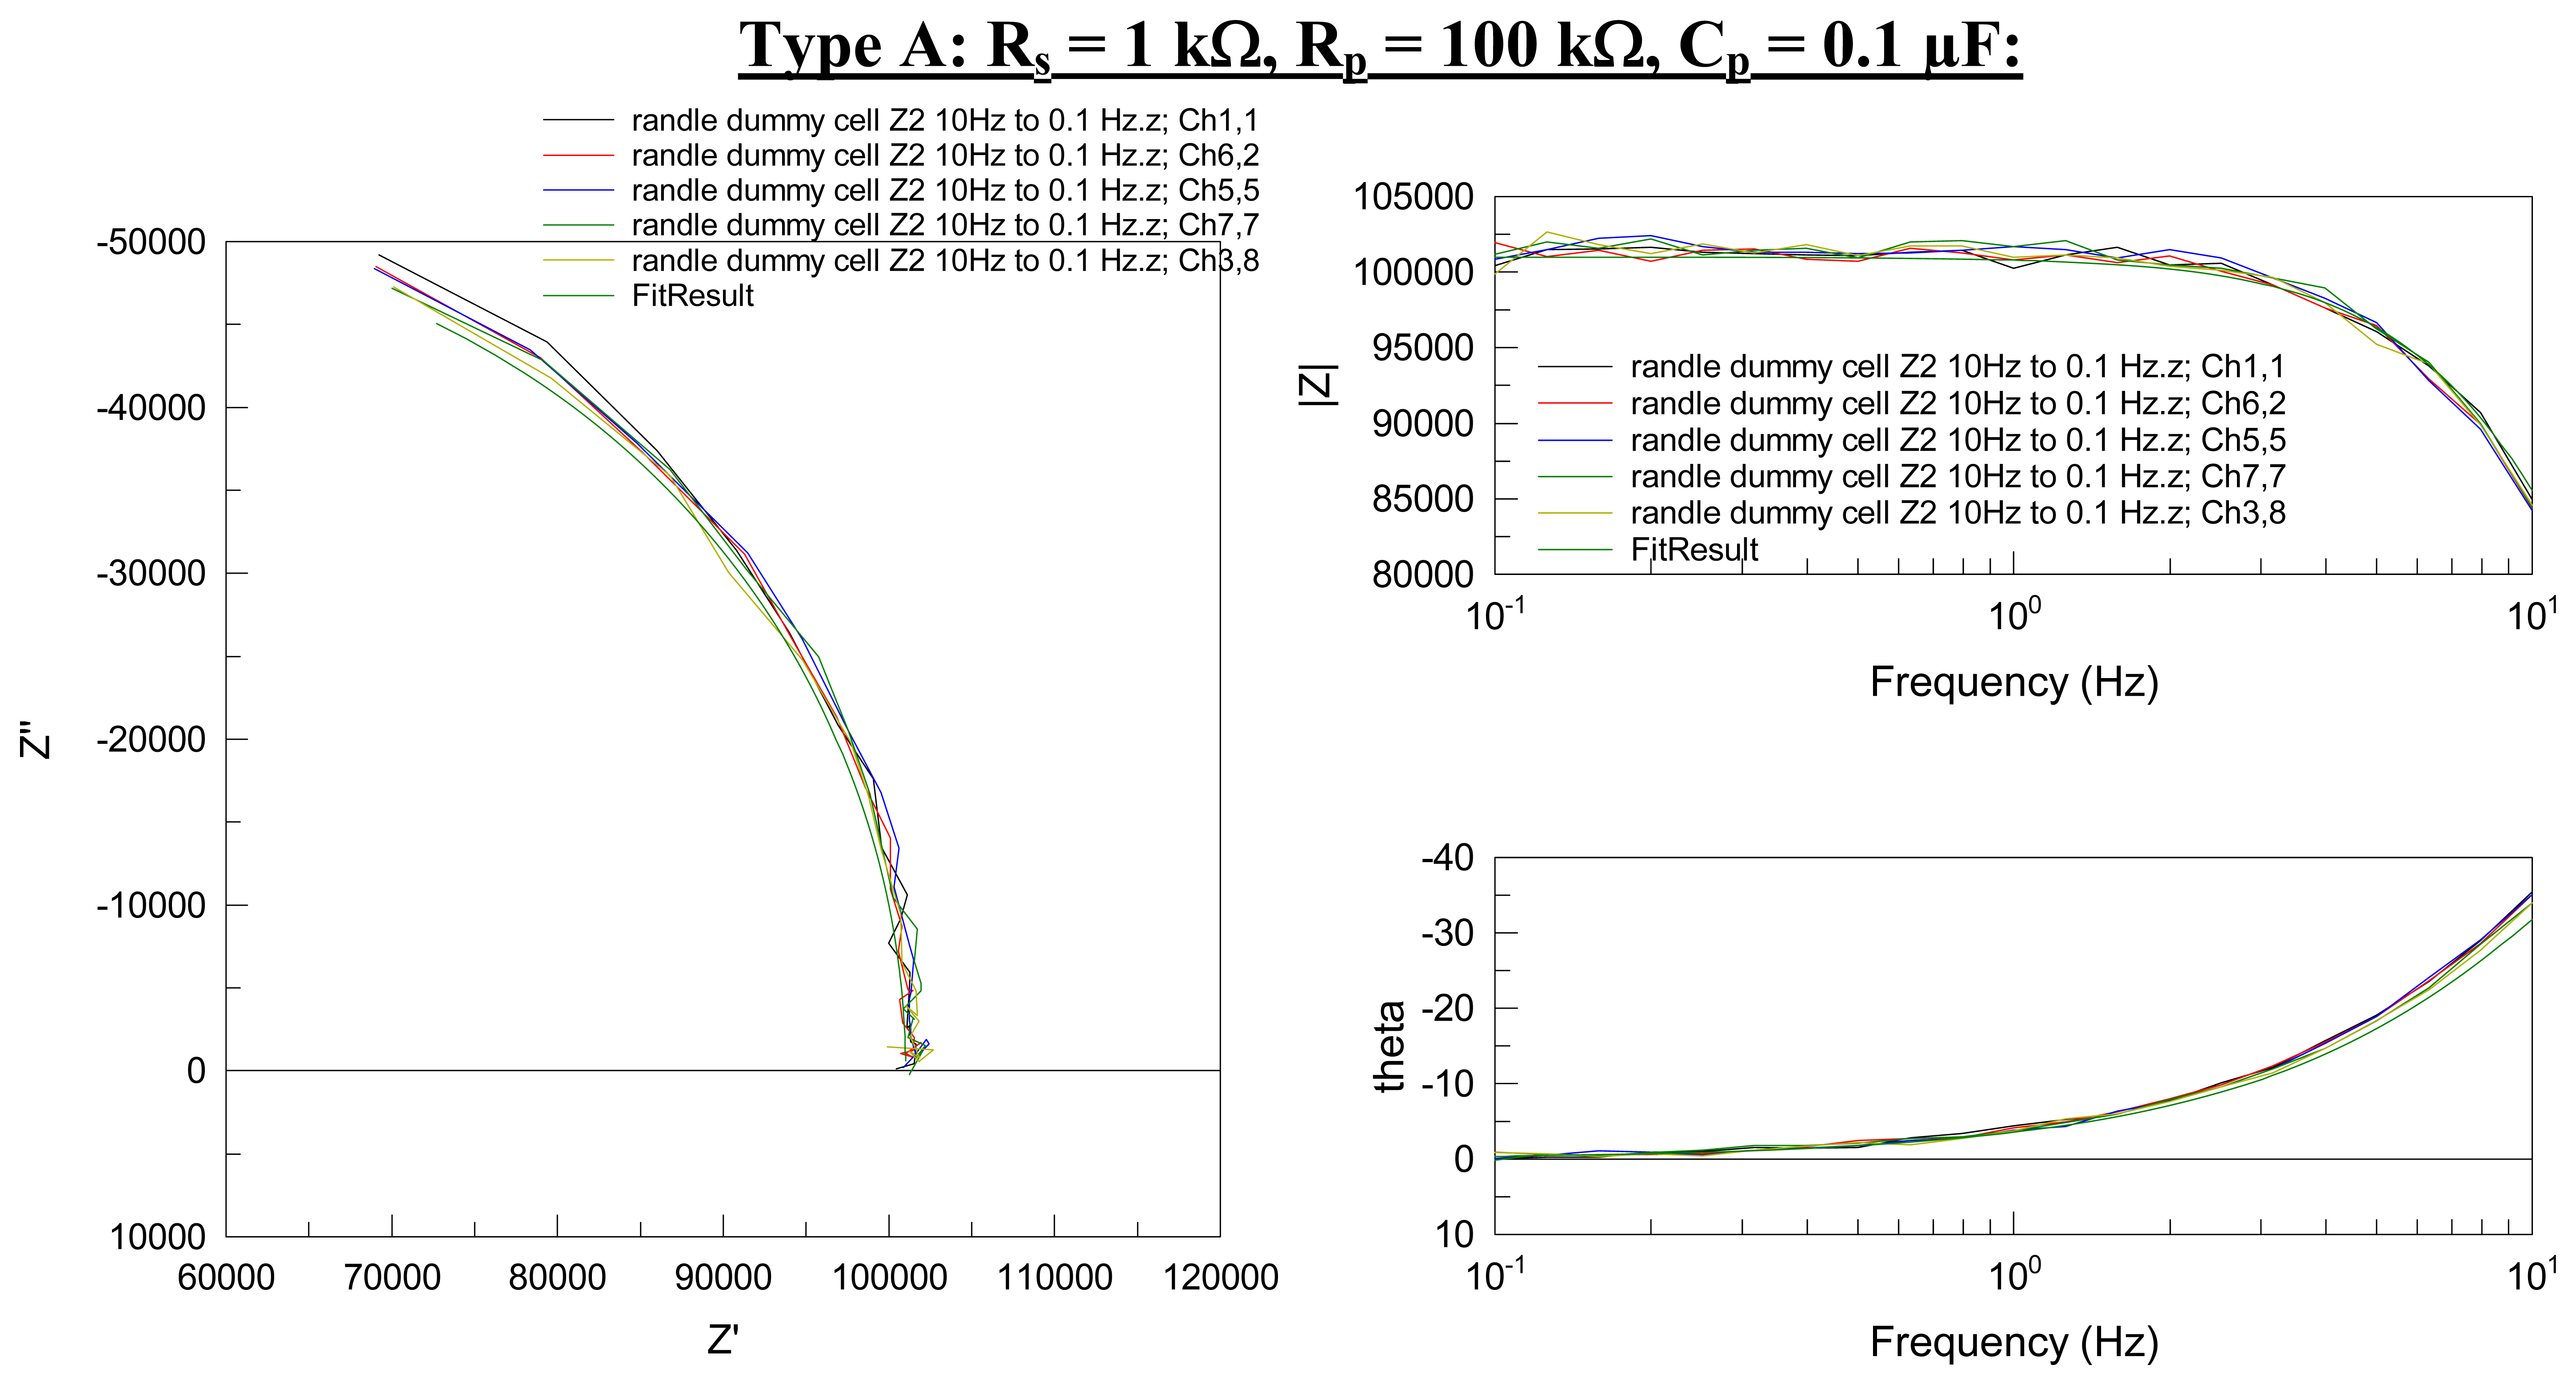
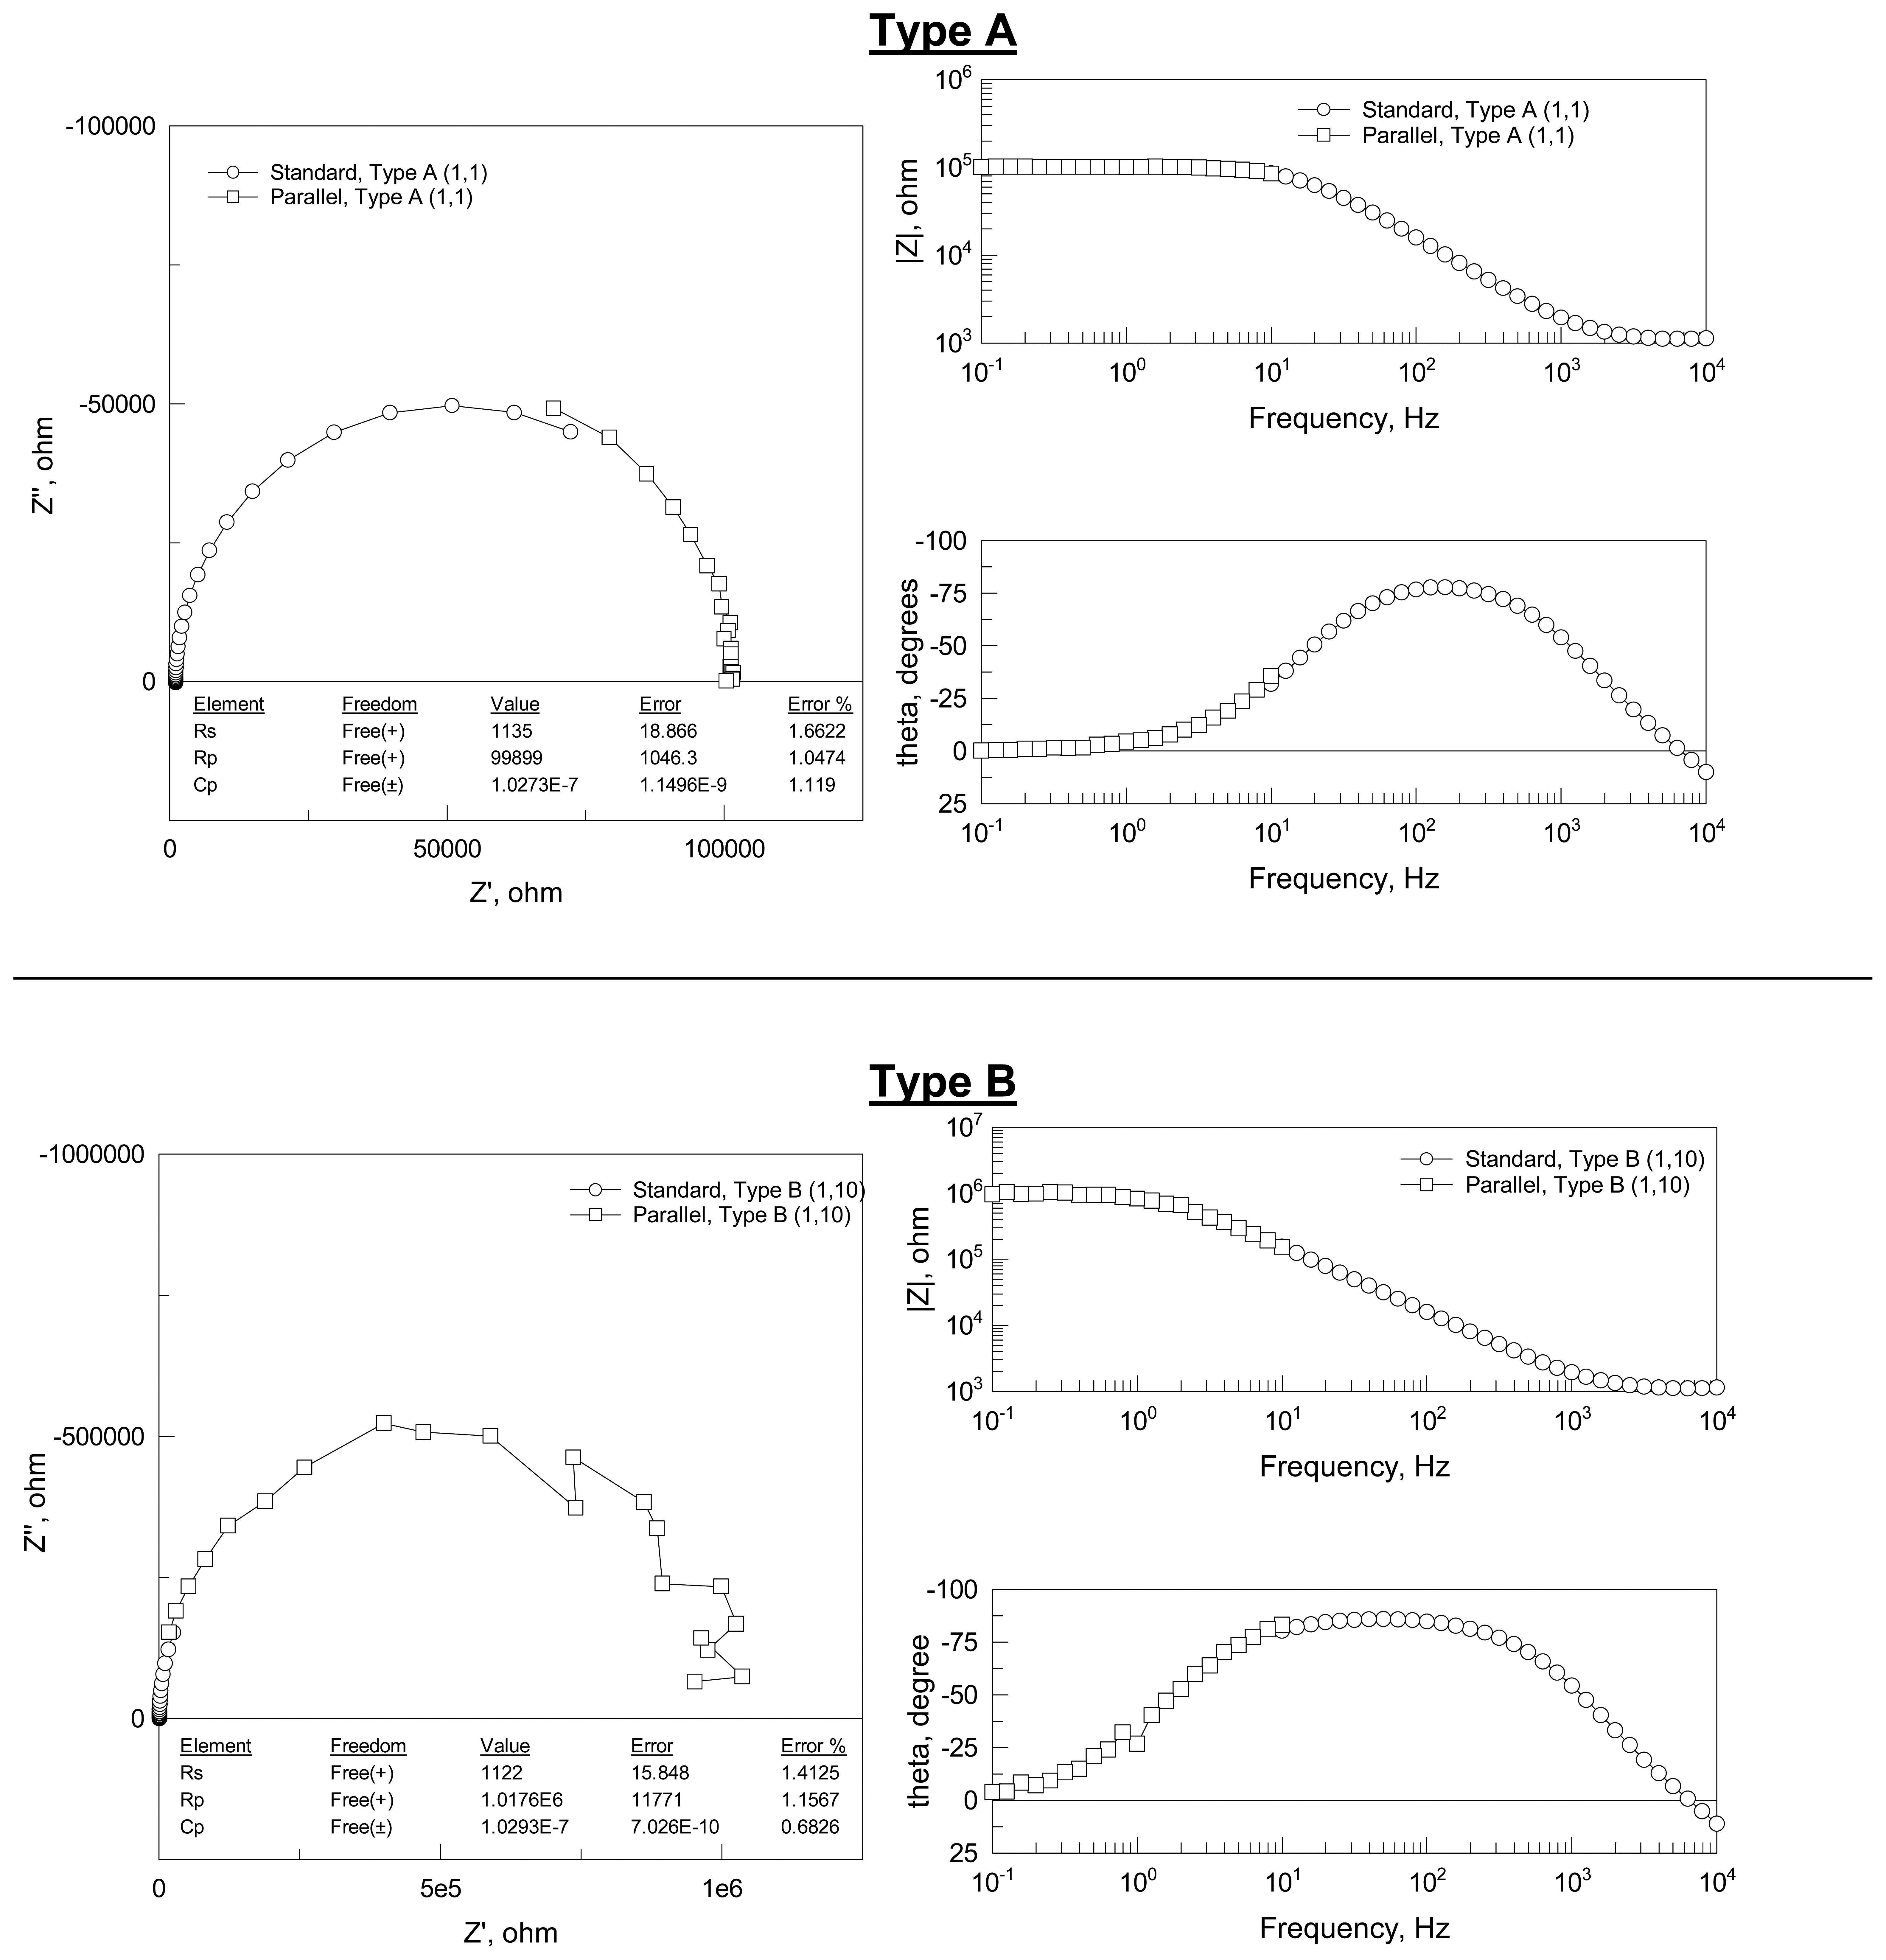
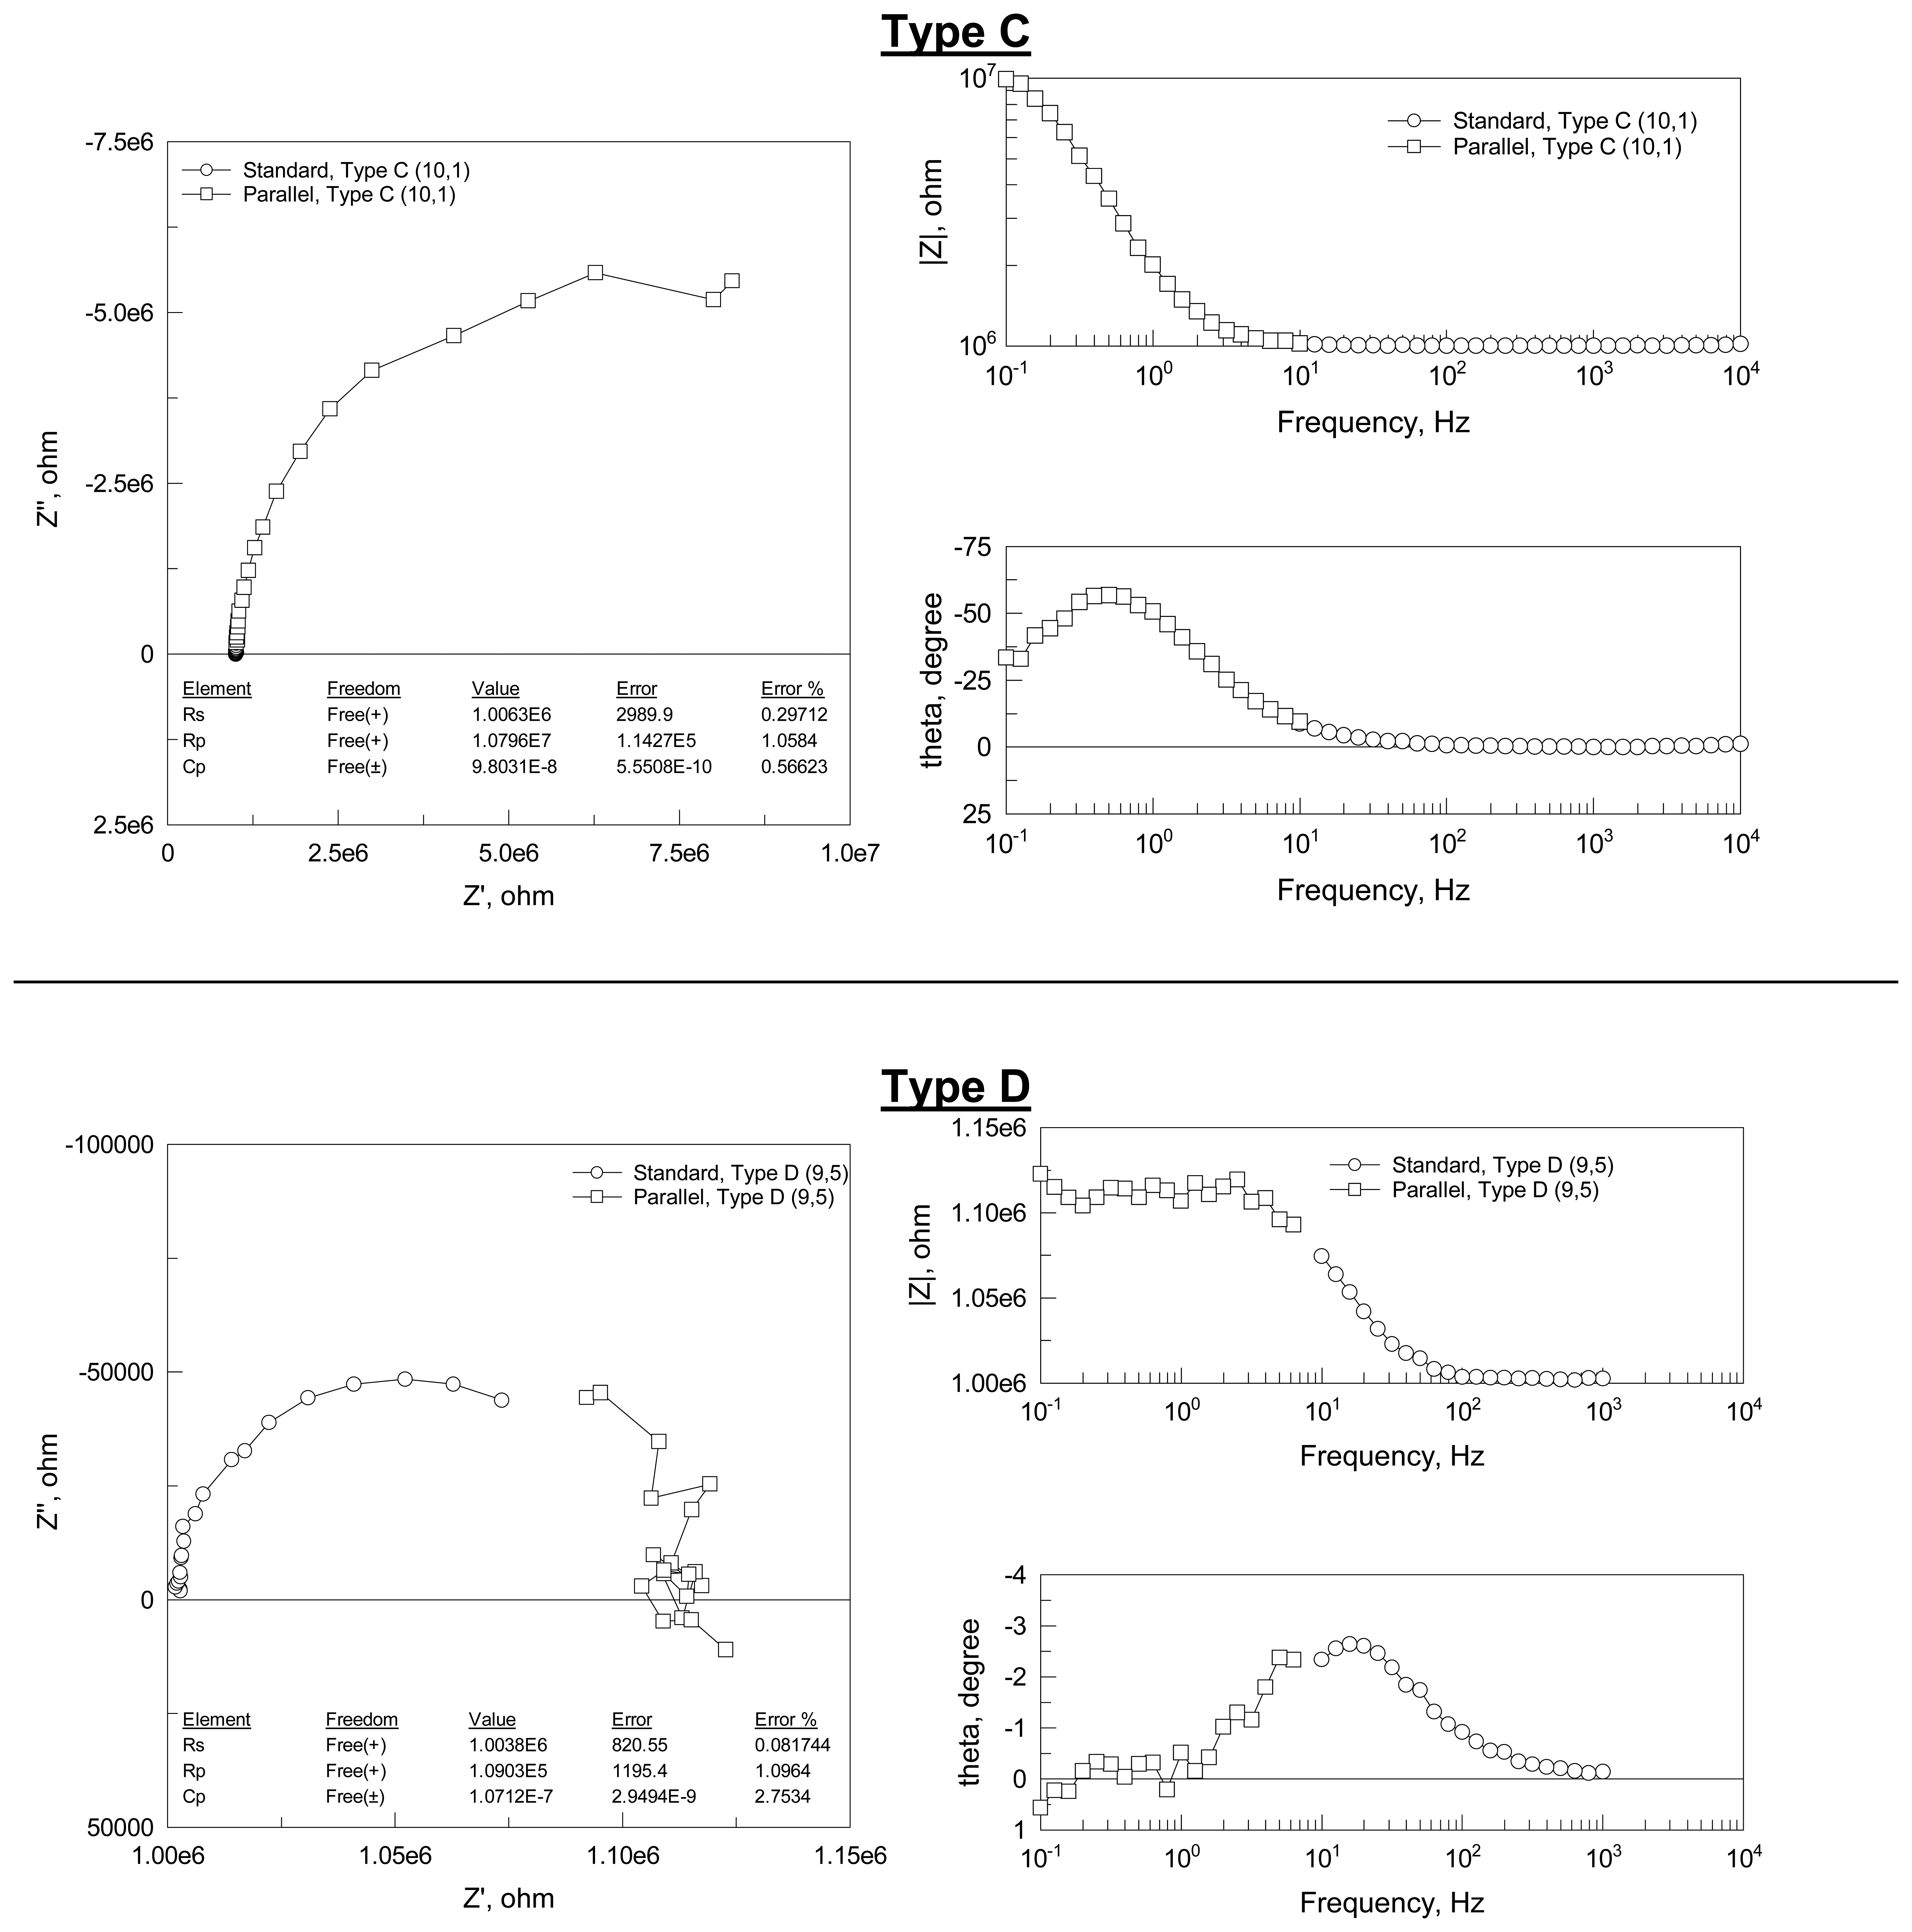
The results for the parallel low frequency impedance method are shown in Figure 7. Because of the very large range in values of impedance exhibited by the four different types (from 1 kΩ to 11 MΩ) the results for each type of equivalent circuit are presented separately in both complex plane and Bode plot format. In addition, for each of the four different dummy circuits, an equivalent circuit model was created and its impedance modeled (i.e., predicted) using impedance modeling software (ZView®, Scribner Associates Inc.) using nominal values for the resistors and capacitor used in the dummy cell. The predicted impedance spectra is shown as a dark green line and labeled “FitResult” in Figure 7.
Figure 7 summarizes the low frequency impedance of the four types of equivalent circuits determined via the parallel measurement method. Within a given type of equivalent circuit the results are very reproducible. Furthermore, despite the noise observed in some of the data sets, the absolute values are correct, as evidenced by the predicted impedance spectra labeled “FitResult” in each graph. The exception are the results for the Type D dummy cell in which the measured low frequency impedance consistently exceeded the predicted value by approximately 1.1 %. The source of the discrepancy is under investigation.
Noise in the data is evident, in particular at low frequencies and for the cells with very high impedance (e.g., Type B and D) where |Z| ≥ 1 MΩ. The source of noise is due to the magnitude of the AC voltage perturbation (50 mV) and the accuracy of current measuring ZRA circuitry. The ZRAs used here were 100 μA full-scale with a resolution of 3.3 nA. At 50 mV AC and Z ∼ 1 MΩ, the current was no more than ∼ 50 nA and generally much less than this value. Higher impedance results in even lower current signal. Such small currents approach the bit-resolution of the instrument and thus increase the noise in the data. The remedy to this problem is to match the current measurement circuitry and/or the magnitude of the AC voltage perturbation to the impedance to be measured. It should be noted that using a larger AC perturbation than used here would significantly reduce the noise (but may not be practical for real systems that exhibit non-linear response).
The array analyzers' ZRA circuitry has a limited number of ranges which it can use to optimize measurement of the current, thus limiting the measurable range of impedance to ∼ 5 to 6. As such there is an inherent challenge when one type of ZRA circuit is called upon to measure the impedance over 8 orders of magnitude. Fortunately, if the impedance range of a given sensor (or electrode system under study) is known, the current measuring circuitry and possibly the AC voltage perturbation can be selected for optimum measurement accuracy and resolution over the full range of the system response.
As indicated in the experimental section, two types of impedance experiments were conducted: the standard sequential measurement approach and the parallel low frequency approach described in detail above. The results of the equivalent circuit dummy cell impedance testing using the parallel approach are presented above. Next, we merged the results of the standard method covering the high frequency range (10 kHz to 10 Hz) with the results of the parallel method restricted to the low frequency range (10 Hz to 0.1 Hz) to demonstrate the efficacy of efficiently obtaining broadband impedance spectra.
Table 4 compares the total measurement time using the standard sequential approach over the whole frequency range (10 kHz to 0.1 Hz) vs. the combined standard + parallel approach over the indicated frequency ranges. As indicated there is an 11-fold reduction in measurement time when using the combined standard + parallel measurement approach in comparison to the standard sequential method alone. Note that measuring to lower frequencies would exponentially increase the time for the standard method but only linearly increase the time for the parallel method. Hence, even greater benefits in measurement time efficiencies are obtained at lower frequencies through implementation of the parallel method.
Figure 8 summarizes the impedance spectra obtained using the combined measurement approach. The data indicate that it is feasible to merge the results from the two different measurement approaches to produce complete, broadband impedance spectra of large electrode arrays in a time-efficient manner.
The results of equivalent circuit fitting of the combined standard + parallel experimental impedance data provide an indication of the accuracy of the measurement. The results of the fit along with the nominal dummy cell resistor and capacitor values for one of each of the four different types of circuit are shown in Table 5. In general, the fit results were very close to the nominal values of the component used to build the dummy cell. In all cases, the difference between the predicted value of the circuit capacitance (Cp) and the nominal value was 3 % or better for 3 of the 4 circuits. The exception was for type D which had an error ∼ 7 %. Likewise, the predicted value of the parallel resistor (Rp) was within 2 to 10 % of the nominal value.
There was, however, a > 10 % error in the fitted value of the 1 kΩ series resistor (Rs) used in the Type A and B dummy cells, which was observed in other experiments as well, and only occurs when measuring a dummy cell containing a parallel resistor-capacitor (Rp‖Cp) element. That is, this error is not evident when measuring a resistor alone. Neither was this error observed when Rs ≫ 1 kΩ, e.g., type C and D dummy cells. The source of this error is uncertain.
The results demonstrate that, in general, the large-channel count array analyzer used here was capable of accurately measuring the impedance of dummy cells designed to simulate typical chemiresistor (and other) sensors [1-4, 24, 25]. Equivalent circuit fit results of experimental data acquired using the combined standard + parallel approach resulted in predicted values of the circuit components that were very close to the nominal value used to fabricate the dummy cell.
4. Conclusions

This work demonstrates the technical feasibility of implementing an enhanced, time-efficient approach to low frequency impedance measurement of large channel-count electrodes and sensor arrays. When the impedance of a 100-electrode array was measured to 0.1 Hz, the measurement time was reduced nearly twenty-fold by the parallel method in comparison to the standard sequential method without sacrificing accuracy. To our knowledge, this is the first implementation of such an approach to electrode arrays. The use of the described parallel impedance measurement approach at sub-Hertz frequencies, which are required for some applications, yields significant gains in measurement-time efficiency.
Dummy cells that mimic a simple electrical / electrochemical cell or sensor were used to probe the impedance measurement capability of the general purpose laboratory multi-channel array analyzer. Four different dummy cells covering four orders of magnitude in resistance were used (1 kΩ to 10 MΩ); the resistor and capacitor values were consistent with typical chemiresistor-type sensors. The results demonstrated that the array analyzer technology and measurement approaches were capable of accurately determining the impedance of dummy cells designed to mimic such sensors. Employing the combined standard + parallel measurement approaches significantly reduced by more than an order of magnitude the data acquisition time in comparison to using the standard method alone. Finally, equivalent circuit fit results of experimental data acquired using the combined standard + parallel approach resulted in most cases in predicted values of the dummy cell circuit components within a few percent of the nominal value used to fabricate the dummy cell.
Acknowledgments

This work was funded by the United States National Aeronautics and Space Administration (NASA) under contract # NNC07QA56P. The technical support of F.J. Grunthaner (Jet Propulsion Laboratory-California Institute of Technology) and R. Quinn (NASA-Ames/SETI Institute) are gratefully acknowledged. The views and opinions of authors expressed herein do not necessarily state or reflect those of the U.S. Government or any agency thereof.

6. References

  1. Weimar, U.; Göpel, W. A.c. measurements on tin oxide sensors to improve selectivities and sensitivities. Sensors Actuat. B. 1995, 26-27, 13–18. [Google Scholar]
  2. Göpel, W.; Schierbaum, K. D. SnO2sensors: current status and future prospects. Sensors Actuat. B. 1995, 26-27, 1–12. [Google Scholar]
  3. Ishihara, T.; Sato, S.; Takita, Y. Capacitive-type sensors for the selective detection of nitrogen oxides. Sensors Actuat. B. 1995, 24-25, 392–395. [Google Scholar]
  4. Fleischer, M.; Wagner, V.; Hacker, B.; Meixner, H. Comparison of a.c. and d.c. measurement techniques using semiconducting Ga2O3sensors. Sensors Actuat. B. 1995, 26-27, 85–88. [Google Scholar]
  5. Janata, J.; Josowicz, M.; Vanýsek, P.; DeVaney, D. M. Chemical Sensors. Anal. Chem. 1998, 70, 179R–208R. [Google Scholar]
  6. Stetter, J.R.; Penrose, W. R.; Yao, S. Sensors, Chemical Sensors, Electrochemicals Sensors, and ECS. J. Electrochem. Soc. 2003, 150, S11–S16. [Google Scholar]
  7. Budiansky, N.; Hudson, J. L.; Scully, J. R. Origins of Persistent Interaction among Localized Corrosion Sites on Stainless Steel. J. Electrochem. Soc. 2004, 151, B233–B243. [Google Scholar]
  8. Budiansky, N. D.; Bocher, F.; Cong, H.; Hurley, M. F.; Scully, J. R. Use of Coupled Multi-Electrode Arrays to Advance the Understanding of Selected Corrosion Phenomena. In Corrosion/2006; NACE: Houston, TX, 2006; Paper No. 06677. [Google Scholar]
  9. Wall, F. D.; Martinez, M. A. A Statistics-Based Approach to Studying Aluminum Pit Initiation. Intrinsic and Defect-Driven Pit Initiation Phenomena. J. Electrochem. Soc. 2003, 150, B146–B157. [Google Scholar]
  10. Wall, F. D.; Martinez, M. A.; Johnson, C. M.; Barbour, J. C.; Missert, N.; Copeland, R. G. Does anything pin the pitting behavior of aluminum? Symposium on Corrosion and Protection of Light Metal Alloys held at 204th Meeting of the Electrochemical Society, The Electrochemical Society; 2004; PV2003-23, pp. 1–11. [Google Scholar]
  11. Zhang, W.; Hurley, B.; Buchheit, R. G. Characterization of Chromate Conversion Coating Formation and Breakdown Using Electrode Arrays. J. Electrochem. Soc. 2002, 149, B357–B356. [Google Scholar]
  12. Chambers, B. D.; Taylor, S. R. Multiple Electrode Methods to Massively Parallel Test Corrosion Inhibitors for AA2024-T3. In Corrosion 2006; National Association of Corrosion Engineers: Houston, TX, 2006; Paper No. 06678. [Google Scholar]
  13. Chambers, B. D.; Taylor, S. R.; Kendig, M. W. Rapid Discovery of Corrosion Inhibitors and Synergistic Combinations Using High-Throughput Screening Methods. Corrosion 2005, 61, 480–489. [Google Scholar]
  14. Fleischauer, M. D.; Dahn, J. R. Combinatorial Investigations of the Si-Al-Mn System for Li-Ion Battery Applications. J. Electrochem. Soc. 2004, 151, A1216–A1221. [Google Scholar]
  15. Fleischauer, M. D.; Hatchard, T. D.; Rockwell, G. P.; Topple, J. M.; Trussler, S.; Jericho, S. K.; Jericho, M. H.; Dahn, J. R. Design and Testing of a 64-Channel Combinatorial Electrochemical Cell. J. Electrochem. Soc. 2003, 150, A1465–A1469. [Google Scholar]
  16. Fleischauer, M.D.; Topple, J. M.; Dahn, J. R. Combinatorial Investigation of Si-M (M = Cr + Ni, Fe, Mn) Thin Film Negative Electrode Materials. Electrochem. Solid-State Lett. 2005, 8, A137–A140. [Google Scholar]
  17. Hatchard, T. D.; Dahn, J. R. Study of the Electrochemical Performance of Sputtered Si1-xSnx Films. J. Electrochem. Soc. 2004, 151, A1628–A1635. [Google Scholar]
  18. Cooper, J. S.; McGinn, P. J. Combinatorial screening of thin film electrocatalysts for a direct methanol fuel cell anode. J. Power Sour. 2006, 163, 330–338. [Google Scholar]
  19. Cooper, K. R.; Smith, M.; Budiansky, N. D.; Scully, J. R. Development of a Multi-Electrode Array Impedance Analyzer for Corrosion Science and Sensors. In Corrosion/2006; National Association of Corrosion Engineers: Houston, TX, 2006; Paper No. 06674. [Google Scholar]
  20. Gabrielli, C. Identification of Electrochemical Processes by Frequency Response Analysis -Technical Report No. 004/83; Solartron Instruments: U.K., 1984; p. 120. [Google Scholar]
  21. Barsoukov, E.; Macdonald, J. R. (Eds.) Impedance Spectroscopy - Theory, Experiment, and Applications; Wiley-Interscience: New York, NY, 2005.
  22. Daniel, S.; de Boor Conte, C. Elementary Numerical Analysis.; McGraw-Hill: New York, NY, 1980; p. 268. [Google Scholar]
  23. Derrick, W. R.; Grossman, S. I. Elementary Differential Equations with Applications; Addison-Wesley: New York, NY, 1981; pp. 451–452. [Google Scholar]
  24. Quinn, R. C.; Zent, A. P.; Grunthaner, F. J.; Ehrenfreund, P.; Taylor, C. J.; Garry, J. R. C. Detection and Characterization of Oxidizing Acids in the Atacama Desert using the Mars Oxidation Instrument. Planet. Space Sci. 2005, 53, 1376–1388. [Google Scholar]
  25. Zent, A. P.; Quinn, R. C.; Grunthaner, F. J.; Hecht, M. H.; Buehler, M. G.; McKay, C. P.; Ricco, A. J. Mars Atmospheric Oxidant Sensor (MAOS): An In-Situ Heterogeneous Chemistry Analysis. Planet. Space Sci. 2003, 51, 167–175. [Google Scholar]
Figure 1. Typical experimental set-up for electrical or electrochemical testing of a microelectrode or sensor array. The set-up is similar to a traditional 3-electrode configuration consisting of a working electrode (WE), counter electrode (CE) and reference electrode (RE) with the exception that the single WE is replaced with N working electrodes resulting in an N + 2 electrode configuration. Both inter-electrode and polarized cell currents can exist within the cell depending on the relative potentials imposed on the array elements.
Sensors 08 01774f1
Figure 2. Key to placement of twenty equivalent circuit dummy cells across array analyzer segments and groups (10 groups of 10 segments/group).
Sensors 08 01774f2
Figure 3. (a) Raw current I(x,y) and voltage data acquired at ∼ 22 frames/second with the MMA instrument imposing a 10 Hz, 0.25 V AC signal. The frequency-dependence of the data is not apparent in the raw data. (b) Post-FFT data processing, the time-dependent AC response is reproduced with the expected 0.1 second period. Time skew between the individual current channel data and the voltage channel data is apparent in the reconstructed data set.
Sensors 08 01774f3
Figure 4. Low frequency impedance of an array of one hundred 100 kΩ resistors determined from DC time-based Ik(ω),V(ω) data. (a) Without time skew correction factor the phase error approached 180° at 10 Hz. (b) With time skew correction factors the phase error is less than 2.5° at 10 Hz. Application of the time skew correction significantly improves the accuracy and decreases the phase angle error at all but the lowest frequencies.
Sensors 08 01774f4aSensors 08 01774f4b
Figure 5. Real(Z) by standard vs. parallel method at three frequencies. The box indicates the range of resistances expected based on ±1 % rated accuracy of the resistor.
Sensors 08 01774f5
Figure 6. Low frequency impedance of an array of one hundred resistors ranging from 1 MΩ to 50 MΩ. (a) Complex impedance obtained from parallel FFT method in 7 minutes. With time skew correction factors applied the phase error is less than 2.5° at 10 Hz indicating that the parallel measurement method can be used to simultaneously obtain the impedance of large array. (b) Complex impedance determined using standard sequential measurement approach in 120 minutes.
Sensors 08 01774f6
Figure 7. Complex plane plots (Z″ vs. Z′) and Bode plots (log |Z| and phase angle vs. log ω) of the equivalent circuit dummy cells. Impedance in ohms and phase angle theta in degree.
Sensors 08 01774f7aSensors 08 01774f7b
Figure 8. Impedance plots for standard method (○) + parallel (□) measurement method for one of each of 4 types of equivalent circuit dummy cells. This page: Type A and B, next page: Type C and D. Standard Method: 10 kHz to 10 Hz; Parallel Method: 10 Hz to 0.1 Hz. See text for impedance measurement conditions.
Sensors 08 01774f8aSensors 08 01774f8b
Table 1. Time required to measure the impedance of 100 electrodes vs. the minimum frequency using two approaches. In all cases the maximum (initial) frequency was 106 Hz.
Minimum (Final) Frequency10 Hz1.0 Hz0.1 Hz0.01 Hz

Measurement time, min
Standard Method Only26462642452
Standard Method + Parallel Method26293355
Time Reduction Factor1.0×1.6×45×
Table 2. Key to the nominal resistor and capacitor values used to fabricate the equivalent circuit dummy cells (±1 % rated accuracy).
DesignationRsRpCp
A1 kΩ100 kΩ0.1 μF
B1 kΩ1 MΩ0.1 μF
C1 MΩ10 MΩ0.1 μF
D1 MΩ100 kΩ0.1 μF
Table 3. Real component of the impedance Z′ at three frequencies via the parallel and standard impedance measurement method (N = 98).
Z′ by Parallel Method, ΩZ′ by Standard Method,Ω

10 Hz1 Hz0.2 Hz10 Hz1 Hz0.2 Hz
Mean101,659100,673100,67099,92799,99899,926
Median101,680100,550100,55099,90499,90599,905
Std. dev.547105112338175383
RSD, %0.541.041.220.080.750.08

% Difference11.70.70.7
1The difference, expressed as a percentage, in the real component of the impedance at a specific frequency obtained by the two methods = [Real(Z)parallel – Real(Z)standard] / [Real(Z)standard] x 100%.
Table 4. Comparison of measurement time for the impedance measurement parameters reported in the experimental section using just the standard sequential approach and a combined standard sequential (10 kHz to 10 Hz) plus the parallel method (10 Hz to 0.1 Hz).
Measurement MethodMeasurement time, min
Standard Sequential254
Standard sequential + Parallel low frequency16 + 7 = 23
Table 5. Fit results for the 4 equivalent circuit dummy cells shown in Figure 8. Nominal values are shown for comparison.
TypeDummy cell nominal valueFit result to experimental data
Rs, ΩRpCp, μFRsRpCp, μF
A (1,1)1×1031×1050.11.14×1030.99×1050.103
B (1,10)1×1031×1060.11.12×1031.02×1060.103
C (10,1)1×1061×1070.11.01×1061.08×1070.098
D (9,5)1×1061×1050.11.00×1061.09×1050.107