Article

Analysis of Mean Access Delay in Variable-Window CSM

AGH University of Science and Technology, Department of Electronics, al. Mickiewicza 30, 30-059 Kraków, Poland
Sensors 2007, 7(12), 3535-3559; https://doi.org/10.3390/s7123535
Submission received: 10 October 2007 / Accepted: 21 December 2007 / Published: 21 December 2007
(This article belongs to the Special Issue Intelligent Sensors)

Abstract

:
The paper addresses the problem of the mean access delay characteristics in term of the channel load for networked sensor/control systems in LonWorks/EIA-709 technology. The system modelling is focused on the Media Access Control protocol that provides the load prediction and determines the key network characteristics. The network model assumes the consistency of load prediction between the nodes, and that the Transaction Control Sublayer does not introduce limitations on the data transmission. The latter means that the numbers of concurrent outgoing transactions being in progress are unlimited. Furthermore, it is assumed that the destination addresses of transmitted messages are distributed rather than concentrated on particular nodes. The analytical approach based on Markov chains is applied. The calculation of transition probabilities of the Markov chain is exemplified by the load scenario where all the transactions are acknowledged, unicast, and the optional collision detection is enabled. On the basis of the stochastic analysis, the probabilities of a successful transmission and collision, respectively, are computed. Furthermore, the numerical results of the mean access delay are reported. The simulative validation of analytical results is provided.

1. Introduction

One of generic algorithms for random access control in networked systems is the p-persistent CSMA protocol. A node, contending for the shared channel according to the p-CSMA algorithm, transmits with the probability p, if the channel is idle, and defers a transmission with the probability (1-p) [12].
The channel utilization in the p-persistent CSMA is strongly affected by the p value which represents the persistence level of the protocol. In particular, large p values cause excessive collisions, while small p values degrade the bandwidth utilization forcing the channel to be idle. A tradeoff between large and small values is thus necessary to provide the bandwidth utilization at the satisfactory level. However, a given persistence level, p, maximizes the throughput only for a preselected number of contending nodes which significantly restricts the usefulness of the pure p-CSMA in practice. If a number of contenders is unknown a priori or varies in time, the p value cannot be set optimally, and consequently the performance of p-persistent CSMA may be considerably degraded. Therefore, the CSMA-based protocols with collision avoidance try to adapt to the number of contending nodes.
In the class of variable-window CSMA protocols, the persistence level, maintained by each node, is modified basing on the feedback information from the network. The modification of p value is usually accomplished by decreasing p in case of collisions, and by an increase of p after each successful transmission. The generic policies consist in additive or multiplicative tuning of p as a response to a result of a transmission attempt in the previous packet cycle. For example, most protocols halve the p value after collisions (e.g. 802.11, Ethernet) using the truncated exponential backoff.
The predictive p-persistent CSMA is an adaptive, variable-window version of the pure p-CSMA developed for systems of intelligent sensors and actuators. The probability p is variable and dynamically adjusted to the expected traffic load using the additive increase/additive decrease scheme [1]. This protocol has been designed for sensor/control networking [1,2] where the traffic produced by sensing devices might be bursty, especially if the application architecture is event-triggered, and data are transmitted in response to external events [8,11,22]. The predictive p-persistent CSMA is commercially implemented in MAC sublayer of LonTalk protocol [1] registered as ANSI/EIA 709.1 and ENV 13154-2 standards and exploited in Local Operating Networks (LonWorks) technology for communication between intelligent sensors and actuators [22].
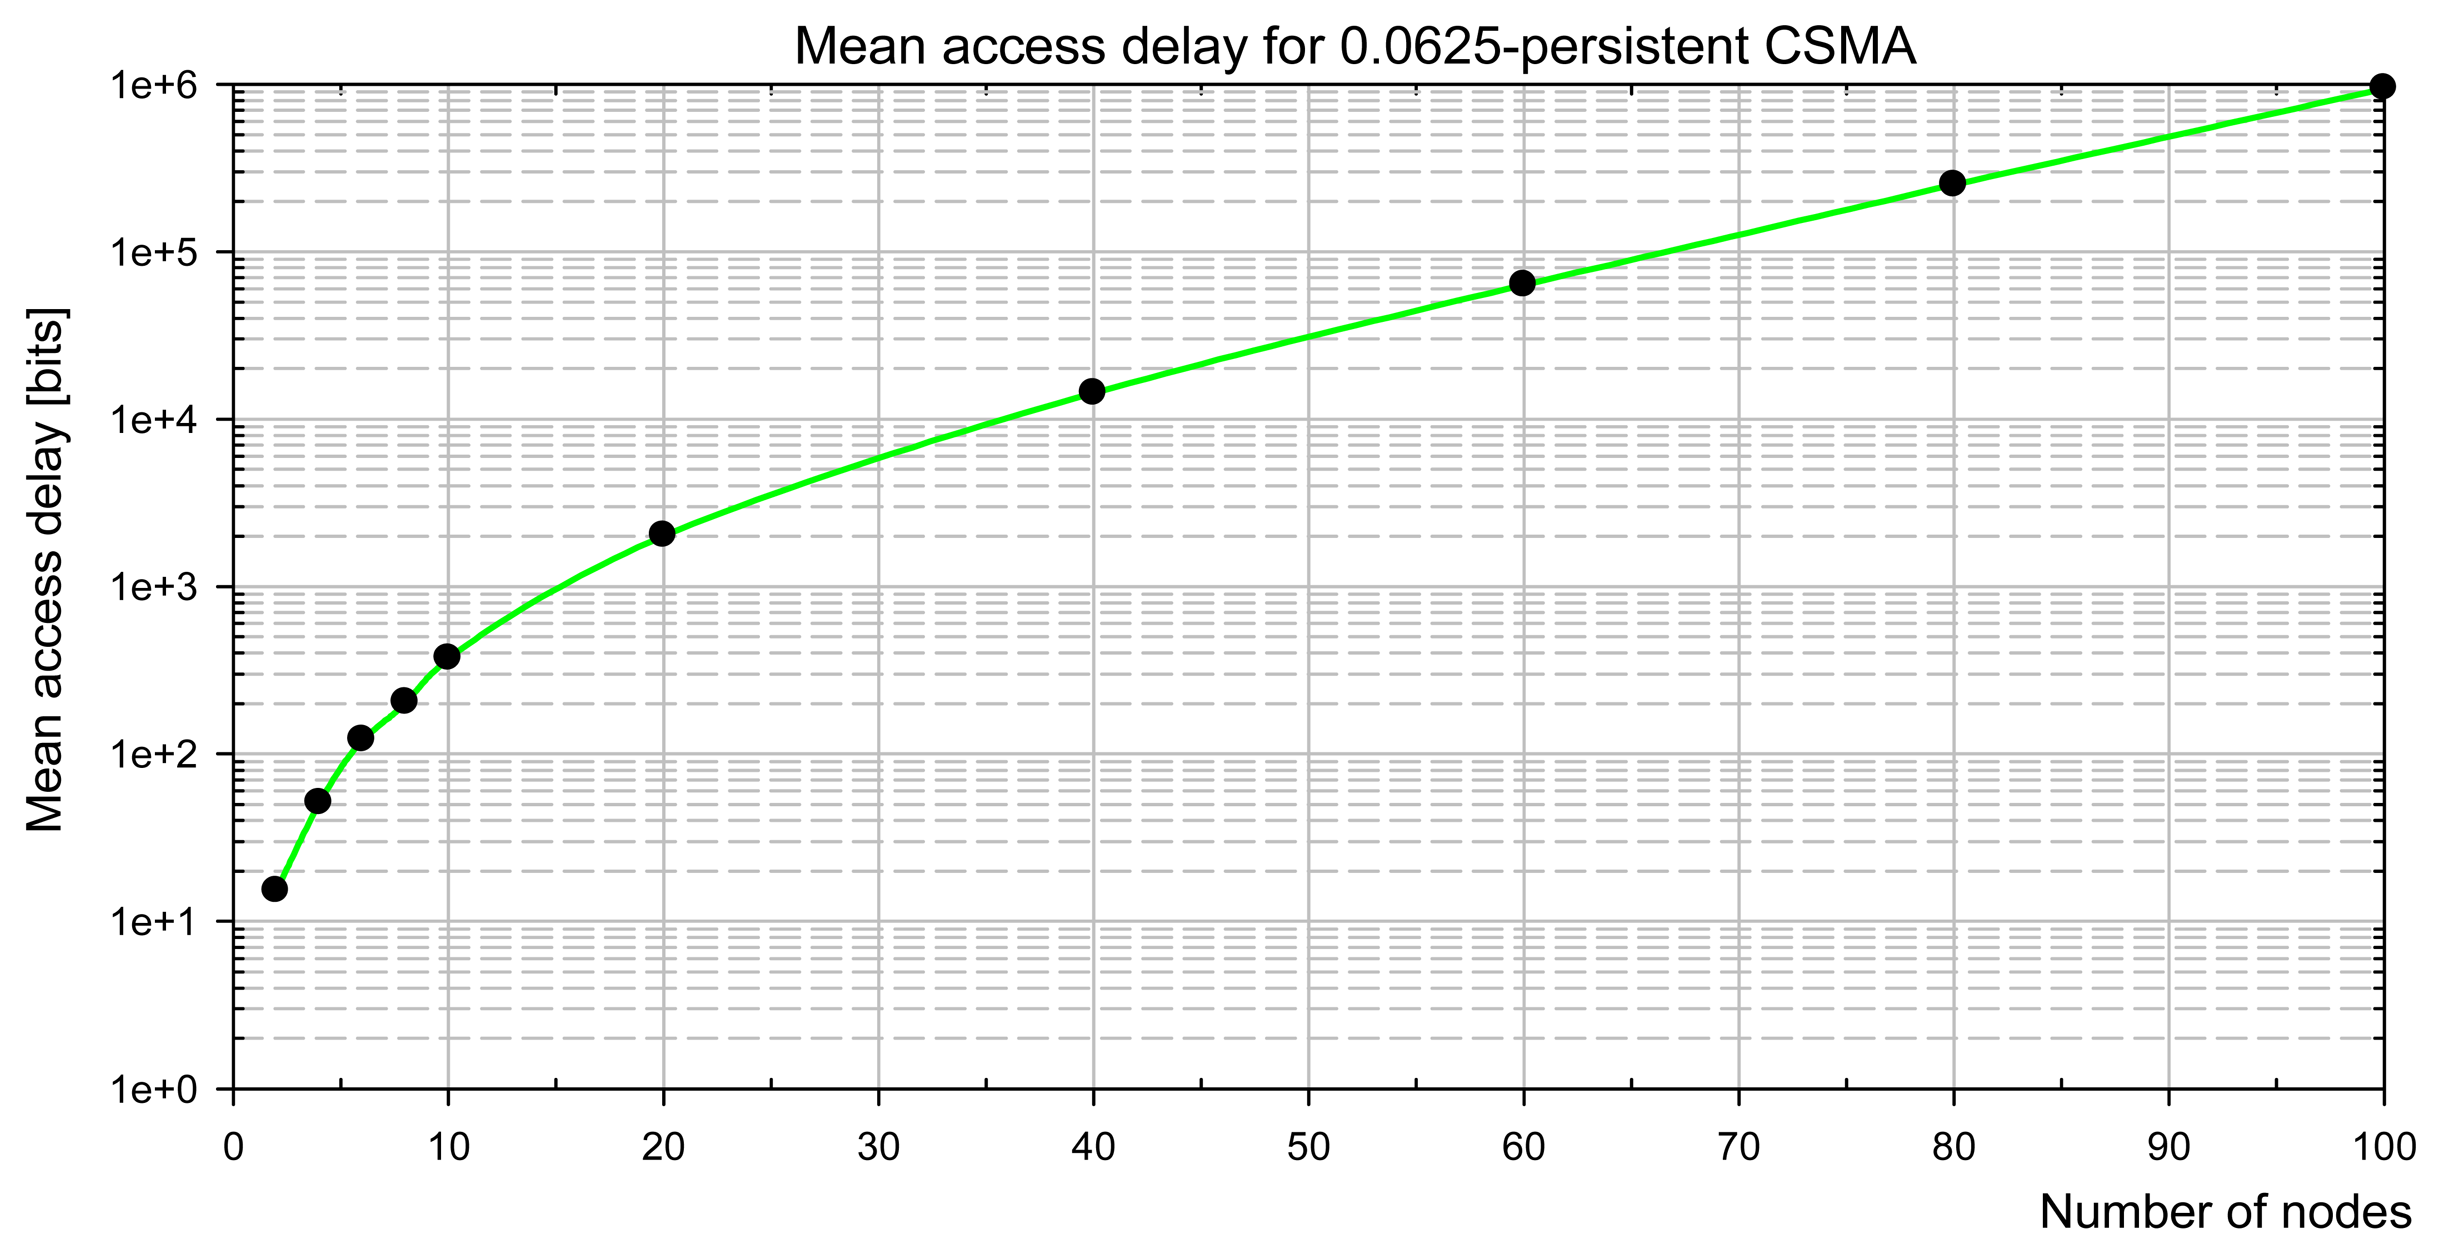
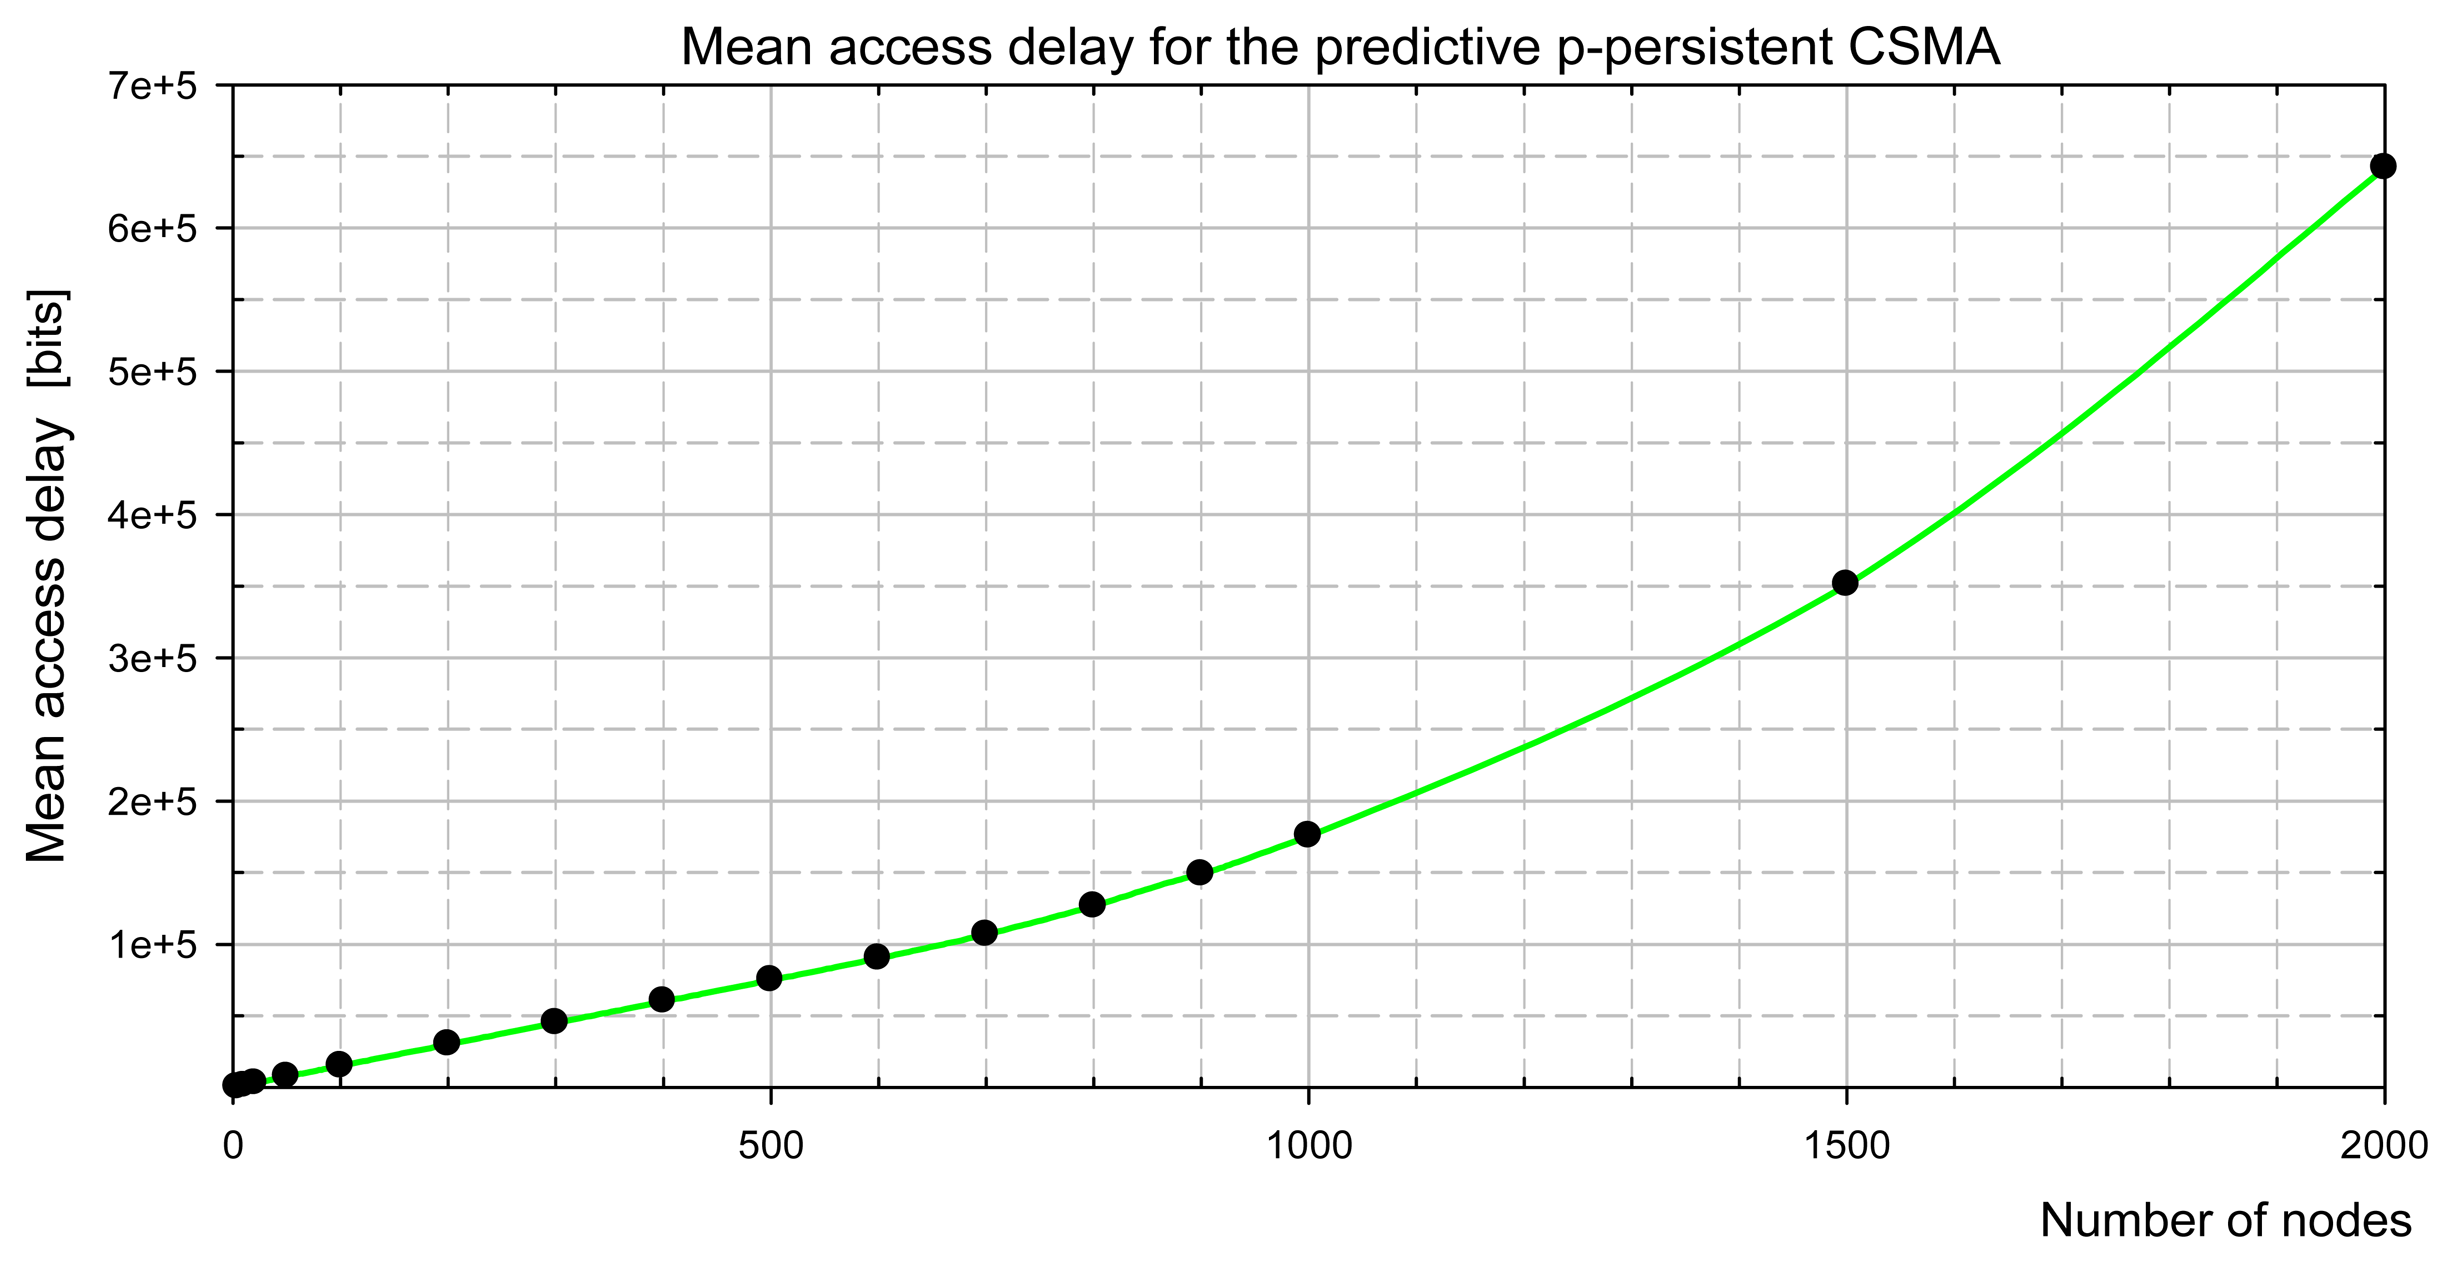
The present paper deals with the analytical evaluation of the mean access delay characteristic for the predictive p-persistent CSMA. In our approach, the analysis for the classical fixed-window p-CSMA is introduced firstly, and further the extension for the variable-window system is developed. We derive the analytical formulas for the medium access delay in term of the network load.
A delay in accessing the channel is one of the principal measures of real-time sensor/control networks. Undoubtedly, the medium access delay increases with the growing number of contending nodes. Due to the randomization of the access latency, a node that tries to send data according to the classical p-persistent CSMA defers a transmission even if only a single node wants to transmit. If more than one node tries to send their packets, the access delay increases due to collisions, and because of sharing the channel bandwidth among the contenders. As the maximum access delay in CSMA is generally unbounded, the mean access delay is chosen usually to evaluate the network access latency.
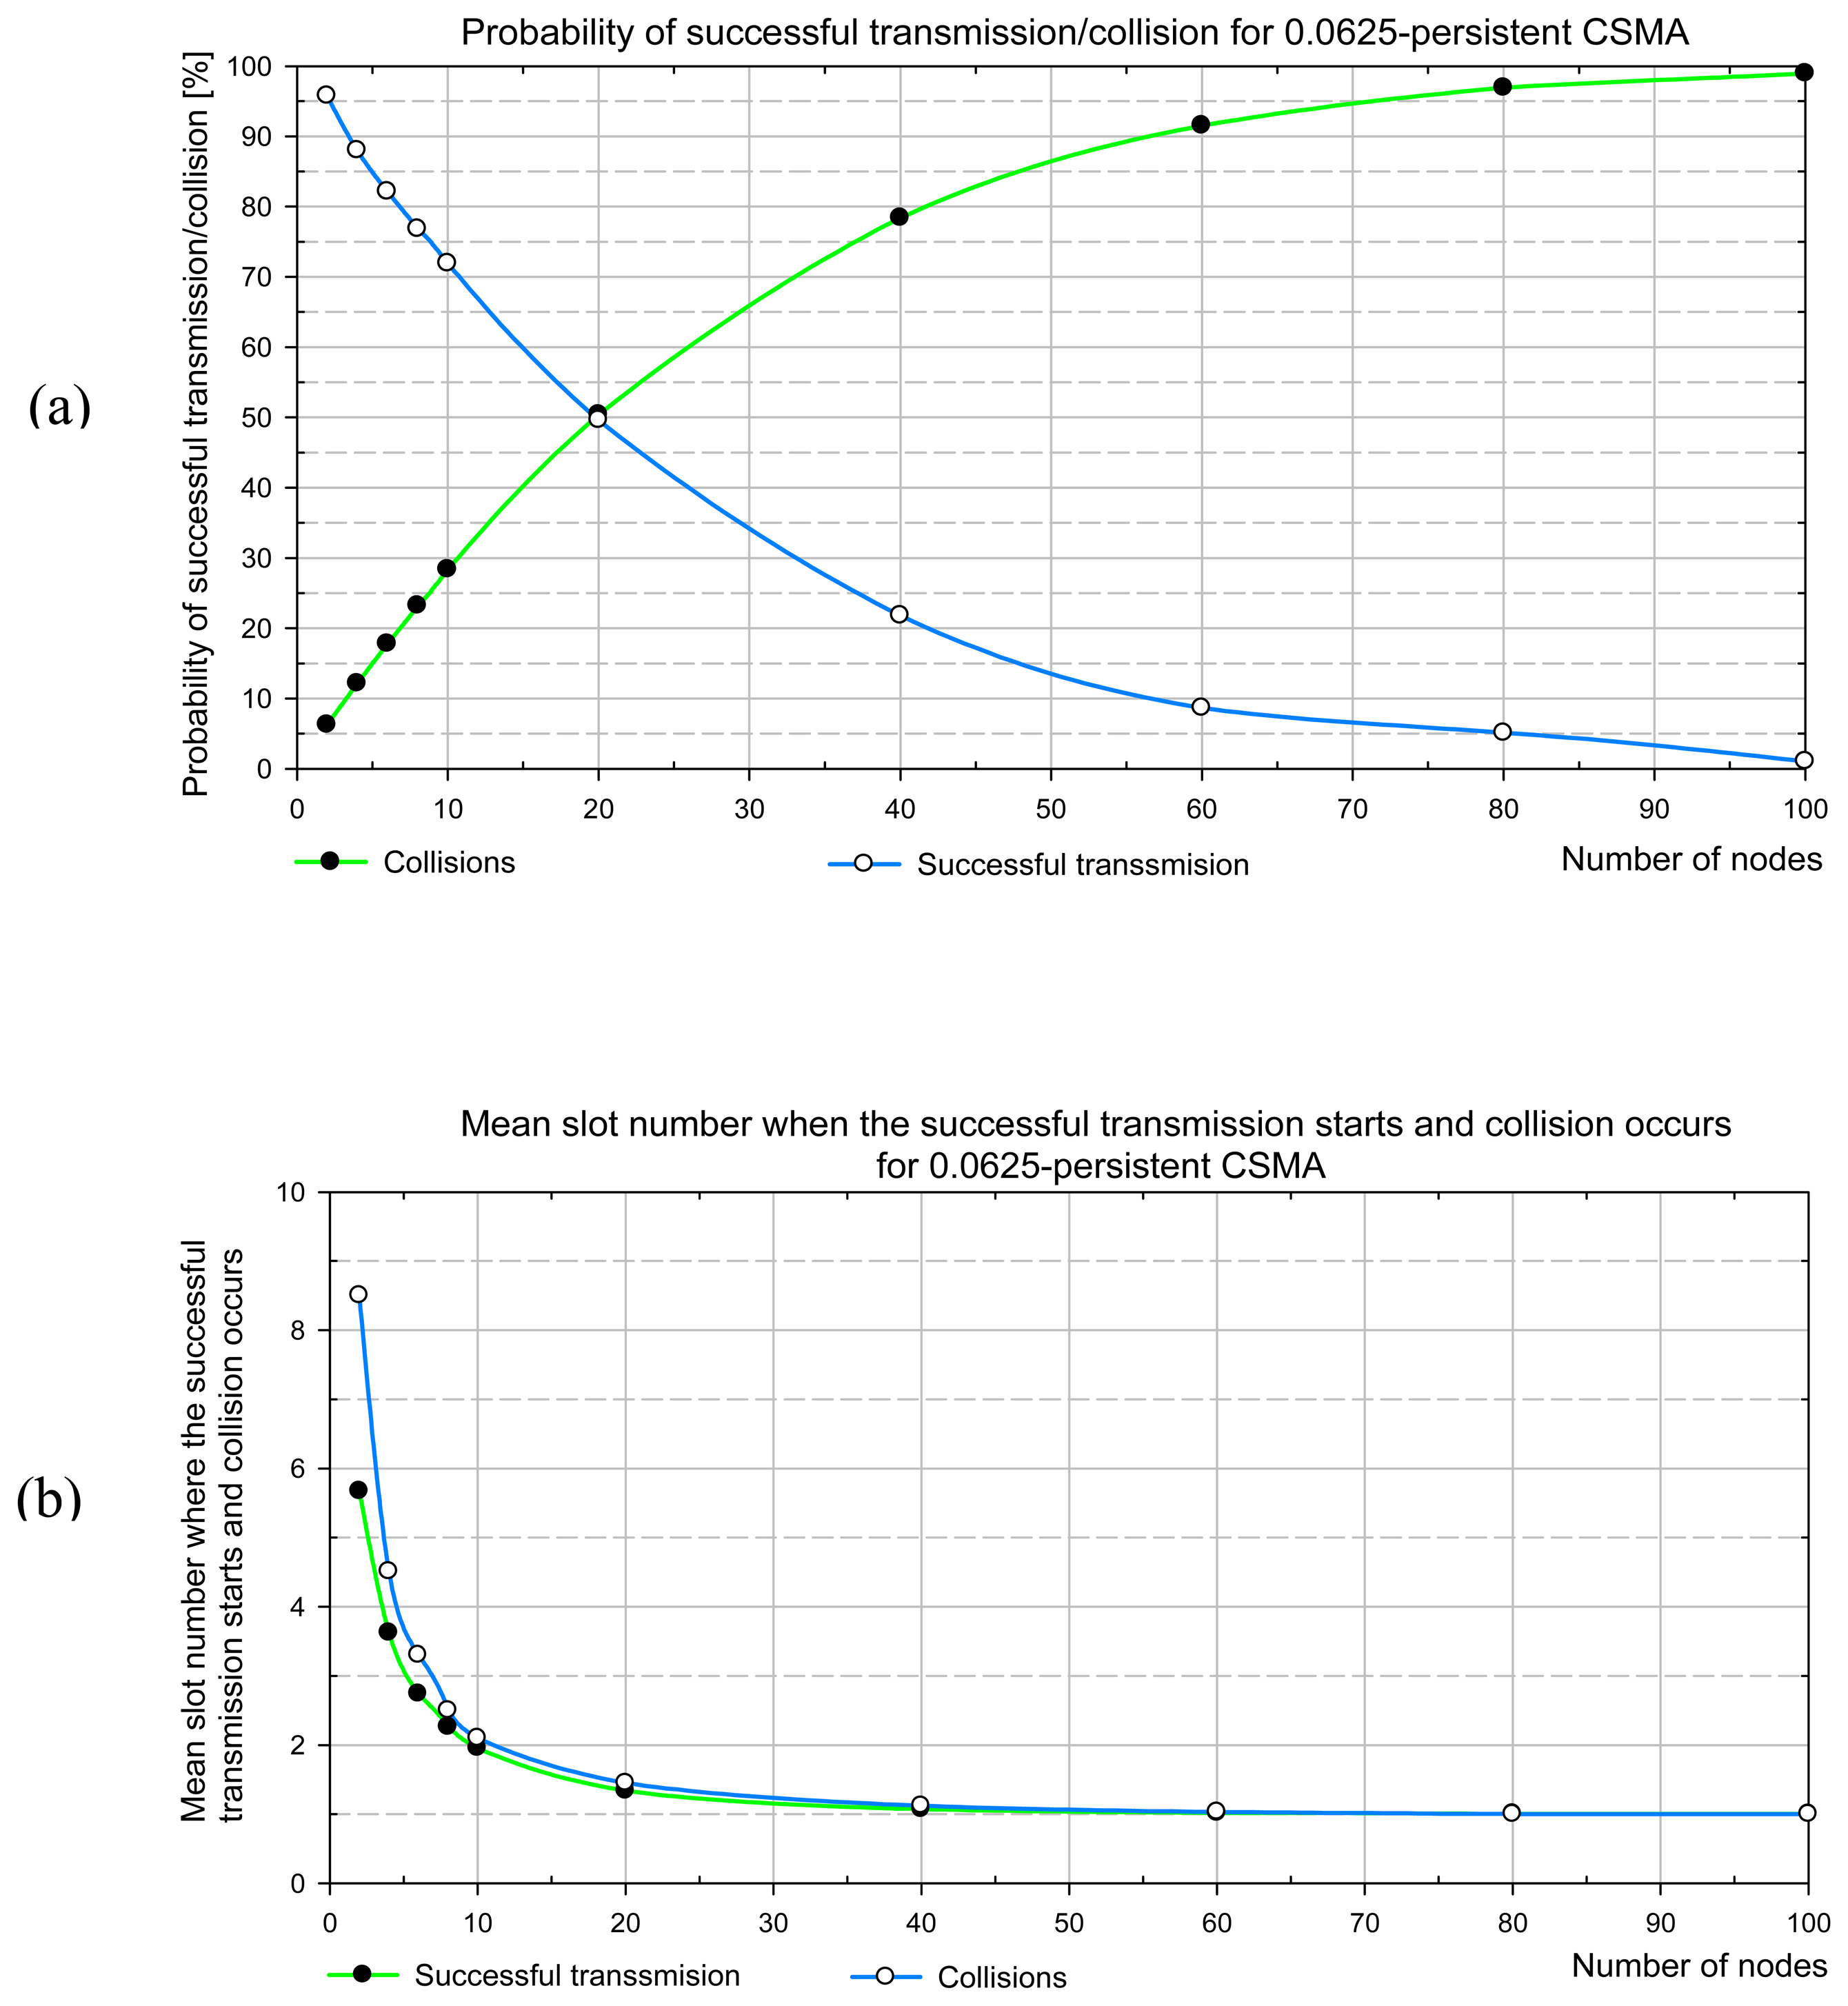
The method that we apply consists in an analytical evaluation of the expected number of trails in accessing the channel before a successful transmission, and the mean length of a packet cycle. The analytical method utilizing discrete-time Markov chains is applied. The results are reported first for the 0.0625-persistent CSMA which approximates the predictive p-persistent CSMA performance for light channel load. Next, the mean access delay for the predictive CSMA is presented.
The evaluation of the random MAC performance is a complex task since an analytical model has to follow random protocol behavior. Therefore, the stochastic analysis presented in this study is carefully explained and includes all the necessary analytical derivations of analytical steps. This feature facilitates the adaptation of the analytical procedure developed in the paper to the other adaptive random access MAC protocols.
Several papers deal with performance analysis of the predictive p-persistent CSMA protocol. Main benefits of the predictive p-CSMA scheme have been displayed in LonWorks Engineering Bulletin [3]. The simulation analyses are carried out in [7, 19]. The analytical approaches are reported in [4,10].
The latter follows the classical approach developed for p-CSMA by Kleinrock and Tobagi in the seventies [12]. The former is based on the queuing theory where the offered load is modelled by a number of stochastically distributed independent stimuli characterized by the corresponding packet arrival rates. The analysis developed in [4] includes the evaluation of the mean access delay and belongs to the node-centric approaches. In the present study, we have developed a channel-centric analysis with a model of an offered load different than that used in [4]. Namely, we define the offered load by a number of active nodes contending for the medium access. Such a model is widely used in CSMA performance analyses, e.g. in [5,6]. The motivation to use such a workload model is clear, since the purpose of the prediction built into the variable-window CSMA with collision avoidance is to reduce the contention among the nodes and to adapt the size of the contention window to the channel load, the number of nodes contending for the medium access is a more useful definition of the offered load for analyzing the protocol behavior. Roughly speaking, in order to recognize ability of the protocol to cope with congestion, we assume that a channel is heavily loaded since under light traffic workload the prediction mechanism is inactive. Furthermore, the backlog counting algorithm that we use in the protocol specification is slightly different than that analyzed in [4].
The paper is structured as follows. In Section 2, we present the predictive p-CSMA specification and the backlog counting algorithm. Section 3 describes the network model. The definition and the analytical derivation of the mean access delay characteristics is presented in Section 4. In Section 5, the analysis of a fixed window p-CSMA using the stochastic analysis, is carried out. The Markov-based extension of the analytical approach for the predictive p-CSMA is introduced in Section 6. The numerical results are reported in Section 7. The validation of the developed analytical approach by simulation with the comparison of sample results are reported in Section 8. Finally, the conclusions are drawn.

2. Protocol Specification
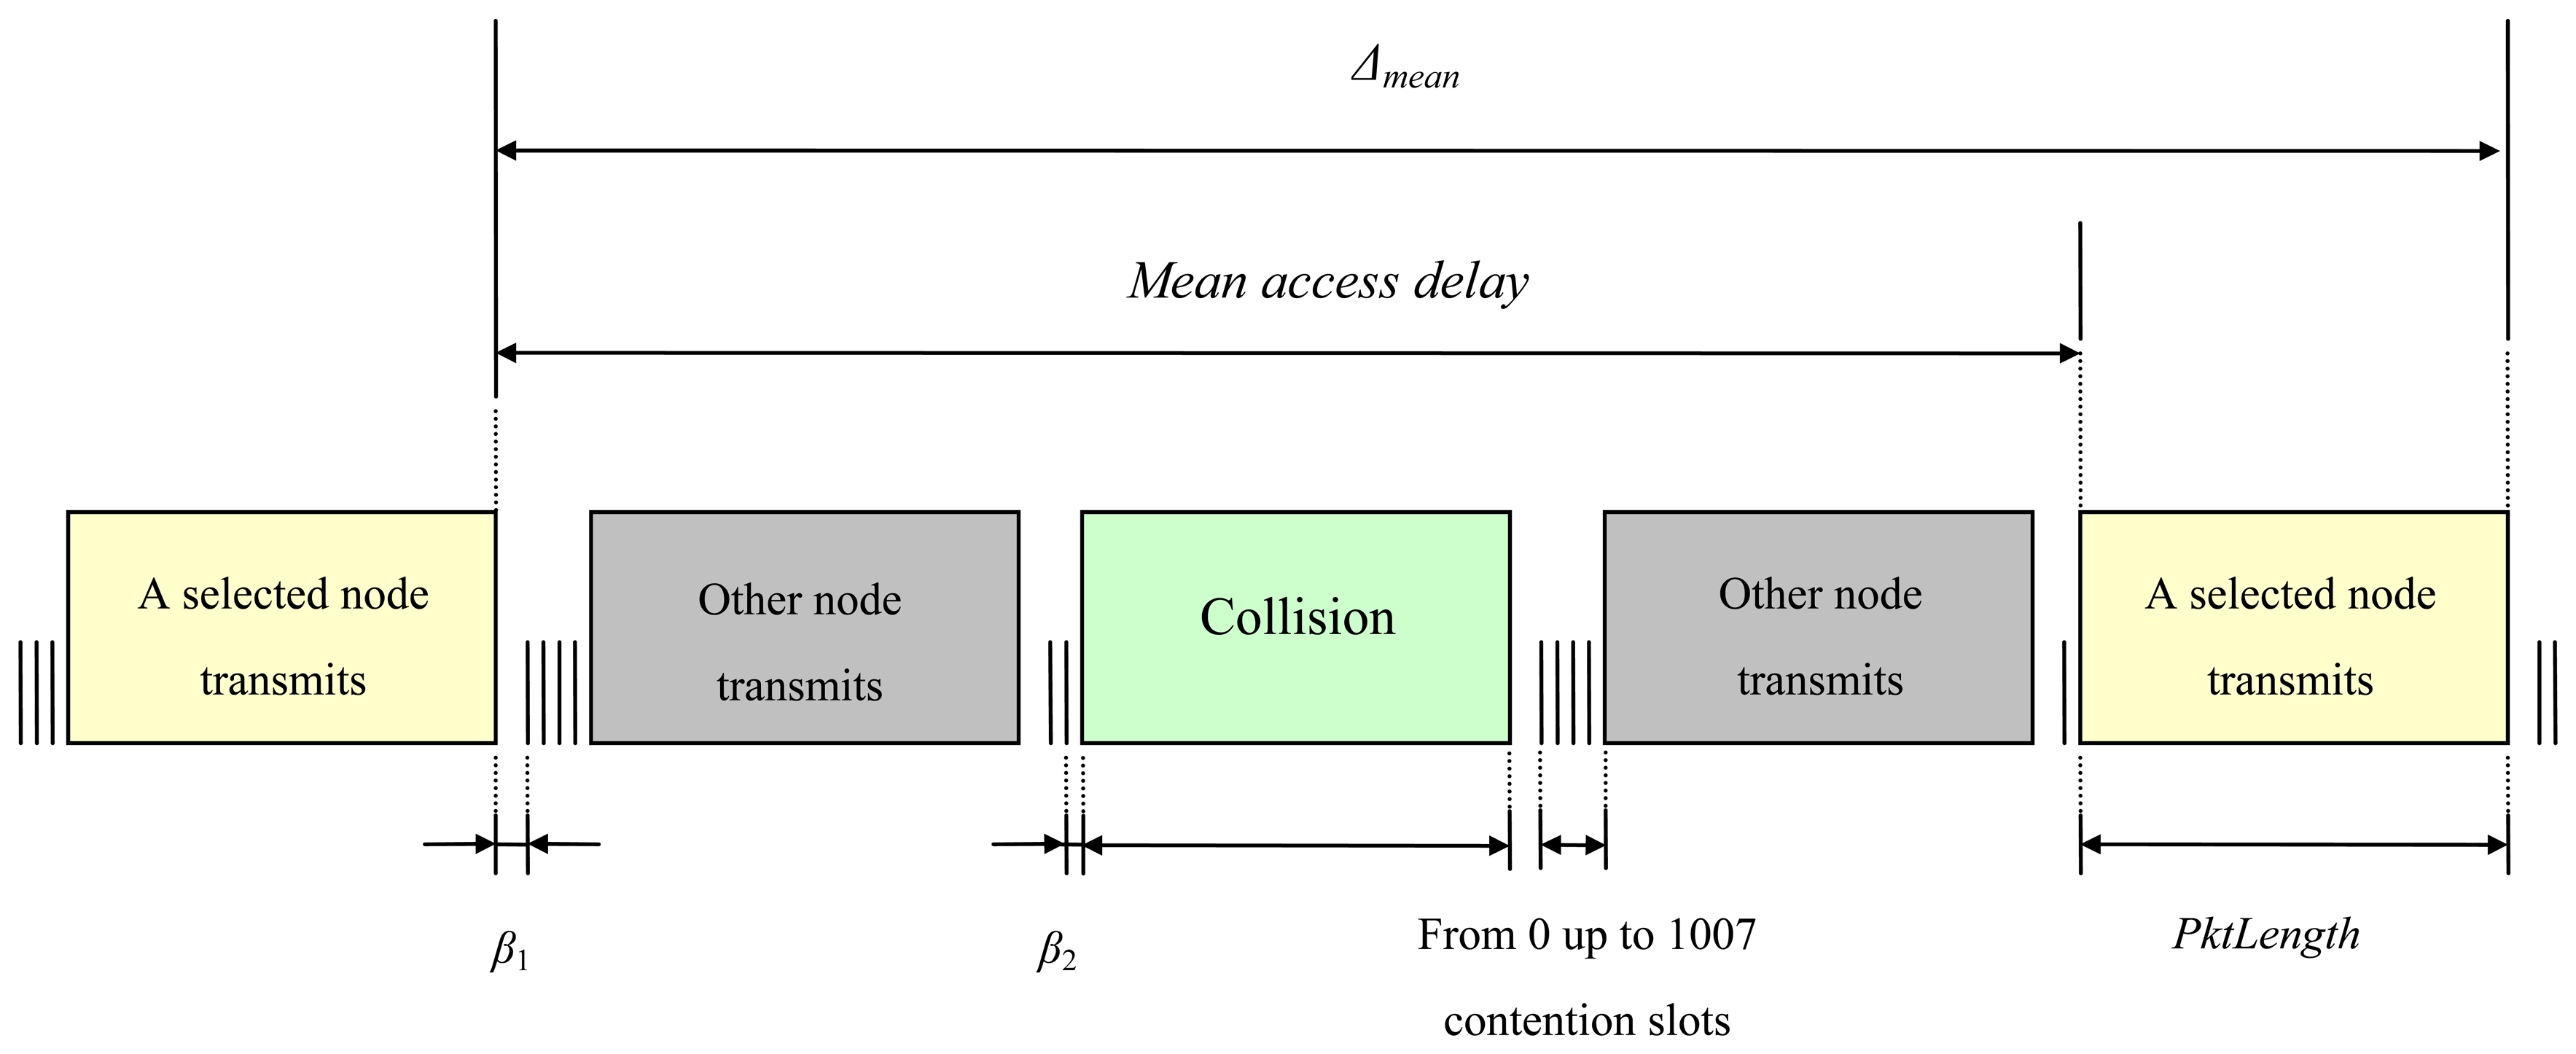
2.1. Packet Cycle

The predictive p-persistent CSMA belongs to slotted-CSMA protocols. The algorithm operates in the following way. A node (an intelligent sensor or actuator) attempting to transmit monitors the state of the channel. If the channel is busy, the node continues sensing. When the node detects no transmission during the minimum interpacket space of β1 period, it delays a random number of contention slots of β2 duration.
If the channel is still idle when the random delay expires, the node transmits. Otherwise, the node receives incoming packet and competes for the channel access again. If more than one node choose the same slot number, and when that slot has the lowest number selected by any node with a packet to send, then a collision happens. All the packets involved in a collision are corrupted.
The backoff time is expressed as a pseudorandom number of contention slots drawn from the uniform distribution between 0 and W, where W is the size of the contention window. The predictive p-CSMA is an adaptive version of p-CSMA, where a window size is dynamically adjusted to the current channel load. If the channel is idle, the contention window consists of 16 time slots. When the channel load increases, the number of slots grows by factor BL, called the 
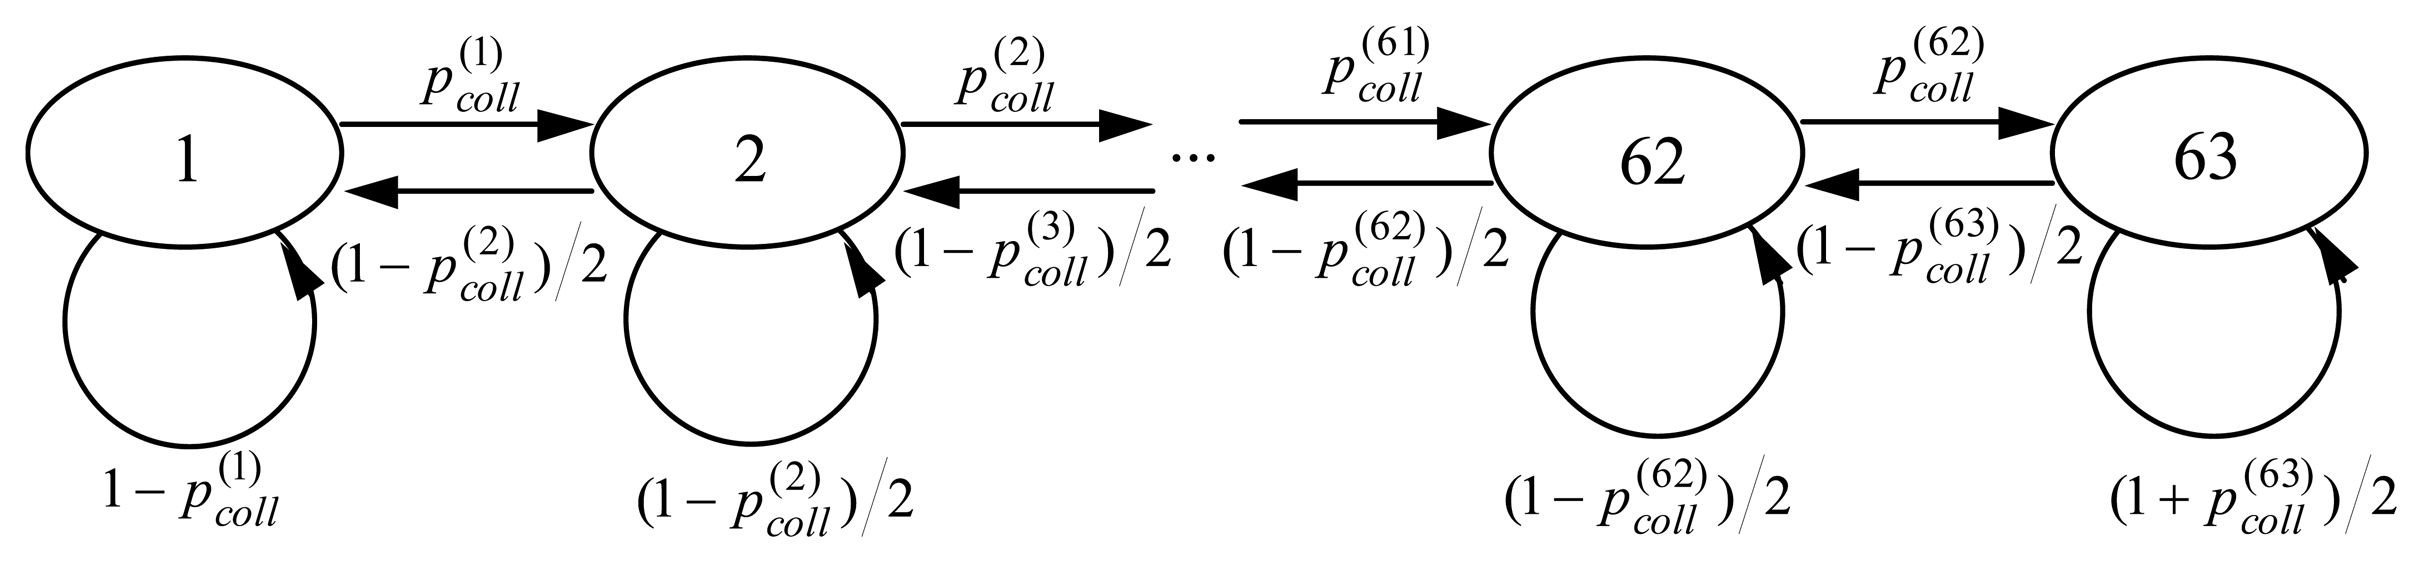
estimated backlog. The backlog BL can range from 1 to 63 and the size of the window varies from 16 to 1008 slots, since
W = B L W base ,
where Wbase is the size of the basic contention window (16 slots). Thus, the level of the persistence of p-CSMA equals 1/(16BL), is variable, and has either the lower (1/16=0.0625), or the upper bound (1/1008=0.0009).
In the predictive p-CSMA, the optional collision detection can be introduced. The aim of the collision detection in the control networked systems is that the sender does not have to wait for time-out before attempting to resend the messages. By comparison, a goal of the collision detection in data networks is to improve the total channel utilization by interrupting the transmission of packets involved in a collision. It is because the packet lengths in networked control systems are short and usually range from ten to twenty bytes.

2.2. Backlog Counting Algorithm

The backlog estimation is based on the calculation of the number of packets expected in a competition for the channel during the next packet cycle. The current value of the backlog counter BL varies from one to the next packet cycle and relies on the accumulation of consecutive backlog increments and decrements [1,2]. Backlog counting built in the node firmware, relies on the following principles [2]:
-
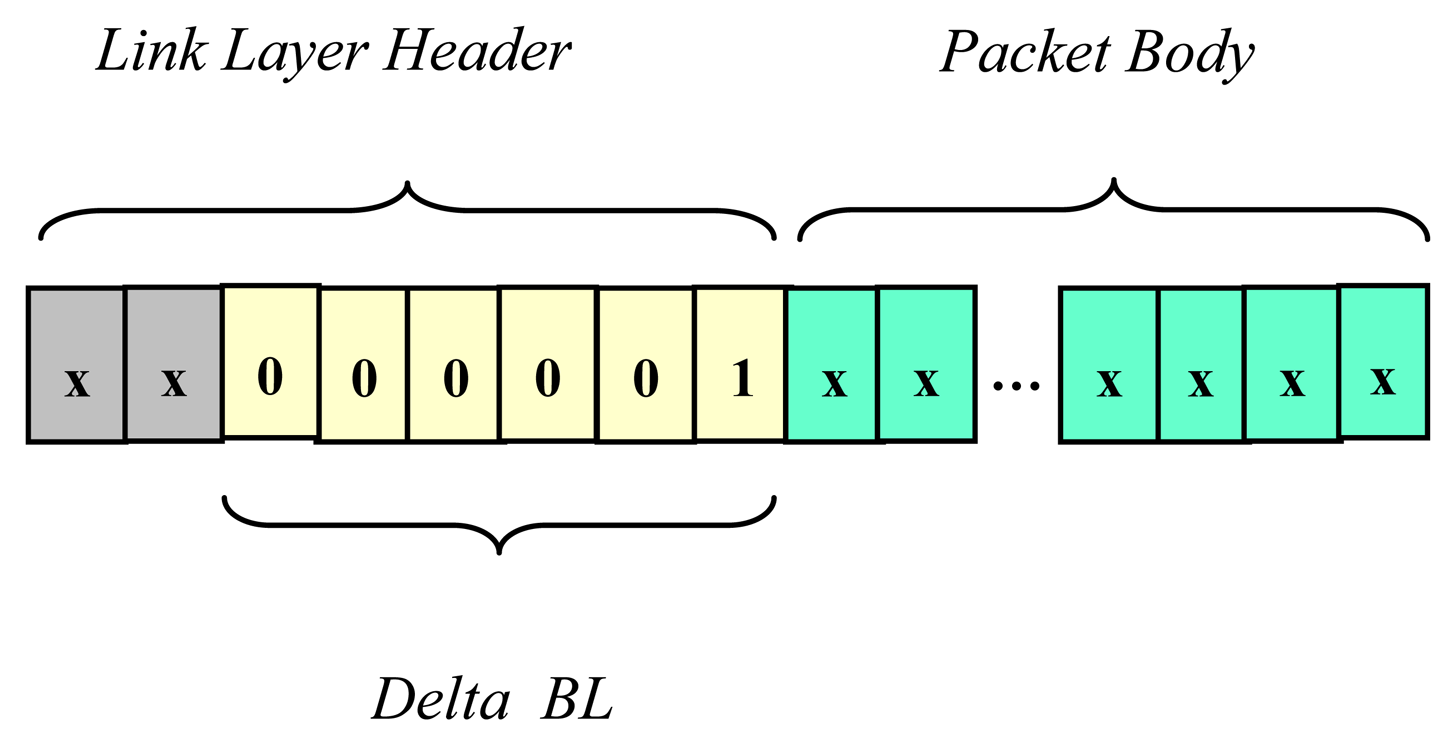
successive backlog increments are based on the information included in the header of each packet that is sent or successfully received by a particular node; this information is encoded in the 6-bit long field Delta_BL;
-
successive backlog decrements by one occurring at the end of successful or idle packet cycles.
Both backlog modifications are independent of each other and occur in every cycle. Optionally, the backlog counter might be incremented by one in case of collision if the nodes are equipped with the collision detection [1,2]. Dedicated hardware in the transceiver is needed to detect collisions.
A number encoded in the Delta_BL data field represents the number of acknowledgements that will be generated by receiver(s) as a result of packet reception. This number equals one for unicast messages. Similarly, for multicast messages the number encoded in the Delta_BL is greater than one, but does not exceed 63, so the maximum size of a group of receiving nodes addressed by a single message equals 63. In the predictive p-CSMA, acknowledgement packets are not privileged in the channel access, and compete for the channel jointly with messages.
On the basis of the backlog counting algorithm we can conclude that after a successful transmission of a message the backlog BL is incremented by a number of (Delta_BL - 1). It is a resultant of the increment by a number of Delta_BL, and the decrement by one at the end of a packet cycle. Comparing to the other congestion avoidance network protocols, the predictive p-CSMA uses a kind of additive increase/additive decrease window scheme (AIAD) [18], whereas IEEE 802.11 takes advantage of the truncated exponential backoff [17].

2.3. Backlog Consistency

Each node calculates the channel backlog autonomously based on the backlog counter implemented in LonWorks node firmware. To keep the consistency of backlog states, all the nodes in the network should modify their backlog counters in the same way.
The consistency is kept if each node is able to detect unsuccessful transmissions in the channel because all the recipients can increment their backlog counters by Delta_BL only if a received packet has correct CRC. Note that recipients mean all the nodes in a network segment where a packet is broadcasted, not only message destination nodes addressed by a sender.
If transceivers, for example, enable only senders to detect possible packet collisions and increment their backlog counters, the backlog can lose its global character and becomes a local node-specific parameter. Any inconsistency in backlog counting among nodes causes unfairness in channel access.

3. Network Model

To recognize the predictive CSMA performance, we introduce some simplifications to the real network model. Below, we list the assumed simplifications in LonTalk/EIA-709.1 specification, and discuss how these simplifications may influence the obtained results.

3.1. Saturation Network Status

In our approach, we suppose that the network is at the saturation status where each node has a packet to send. To be precise, we assume that the network consists of n, a fixed number of nodes, and each node after the completion of a successful transmission immediately has a new packet available for sending. Thus, idle packet cycles do not occur in a saturated network. If an acknowledged message has been received by its recipient, this node generates an acknowledgement packet and places it in the output queue before messages waiting for a transmission. Throughout this paper the particular load scenario is considered, where the nodes are able to detect collisions, the acknowledged message service is used and all the transactions are unicast.
The validity of saturation performance analysis can be extended and treated more generally. Namely, the results derived for saturation workload are valid also for the network that is at non-saturated status but the number of transmitting nodes is constant.

3.2. Network Model

Unlike the classical p-CSMA, the predictive p-CSMA behavior is forced not only by the traffic rate but also by the structure of the traffic transmitted in the channel. In order to make the analysis tractable, we assume that each node is a source of messages unless it receives an acknowledged message. Then, it generates an acknowledgement packet and switches its status to the source of acknowledgements (i.e. schedules acknowledgement packet as the next packet for a transmission). According to the assumed load scenario all the messages are acknowledged and addressed to a single recipient (unicast). A key assumption we make is that the destination address(es) of transmitted messages are uniformly distributed in such a way that each message is sent to the node that currently possesses a status of a source of messages. The protocol performance analysis deals with the steady state of the network when the mean size of the contention window reaches asymptotically a constant value. The proportion between the number of sources of messages and the number of sources of acknowledgements in the steady state of the network determines the transition probabilities between backlog stages which are evaluated in Sect. 6.3. This proportion, however, does not influence the performance of the pure p-persistent CSMA because its behavior does not depend on the network traffic structure.

3.3. Network Segment

We assume that a network consists of a single segment that does not contain store-and-forward routers. The transceivers available on the market limit the segment size usually to 64 devices, although the LonTalk/EIA-709.1 can operate with segments containing hundreds of nodes [1].

3.4. Backlog as the Global Measure of Channel

We assume that either Physical Layer, or Link Layer of the protocol do not introduce the backlog inconsistency, i.e. either the transmitting node, or the receiver(s) modify their backlog counter(s) in the same way. It is achieved if the channel can be assumed to be noise-free and all the transceivers are able to detect collisions even if they are not senders of colliding packets. Then, backlog might be considered as a global channel measure. The similar assumption is adopted in [4].

3.5. The Number of Outgoing Transactions

We assume that the number of concurrent outgoing transactions being in progress is unlimited (i.e. each node tries to send a new packet even if acknowledgement(s) of previously sent packets have not been successfully received yet). As a result of this assumption, the number of contenders in each packet cycle equals the number of nodes in the network.
In the LonTalk/EIA-709.1 protocol, the number of active outgoing non-priority transactions is limited by the Transport Layer implemented on the top of the predictive CSMA and equals one. As a result, a node awaiting the acknowledgement packet after the successful message transmission does not try to send the next message until this acknowledgement is received. Consequently, in the saturated status of the real LON network the mean number of contenders is lower than the number of nodes in the network since some nodes do not compete for the channel due to awaiting the acknowledgement.

3.6. CPU Processing Power vs. Channel Bit Rate

We suppose that the processing speed of the node is infinite. In other words, we assume that the communication channel is not too fast for the node CPU. The limitation of transmitted packets due to finite CPU speed does not appear for relatively low channel bit rates or long packets [15].

3.7. Collision Detection

In LonTalk/EIA-709.1, the collision might be detected at the end of the packet preamble, or at the end of the packet transmission [1]. We assume that the collision is detected at the end of the packet transmission and the preamble preceding the packet transmission is assumed to be of zero length. Note that as a result of this assumption, the whole packets are in fact transmitted either in successful, or in unsuccessful packet cycles.

4. Mean Access Delay Evaluation

4.1. Mean Access Delay Definition

The mean access delay is defined as an average time from the instant the node starts trying to send a packet until the beginning of its successful transmission [14].
The channel access delay consists of the following components (see Fig. 2):
-
deferring transmission when the channel is busy as detected by carrier sense hardware,
-
delaying transmission by the fixed interval called the minimum interpacket gap (β1) following any transmission in the channel to ensure that all the nodes can sense an idle channel,
-
deferring transmission for the random delay (from 0 to 1007 β2 contention slots) to reduce the probability of packet collision during the contention,
-
deferring transmission before any of the transmission attempts if a packet is involved in collision(s).

4.2 Method of Evaluating Mean Access Delay

We evaluate the mean access delay for the slotted CSMA basing on the estimation of an average time interval Δmean between consecutive successful channel access attempts undertaken by a given node that always has packets to send. The time interval Δmean can be found as:
Δ mean = E ( X ) τ
where E(X) denotes the expected number of attempts in accessing the channel made by a selected node in order to transmit a packet successfully, and τ represents the mean length of a packet cycle in the channel access.
By the simplicity, we assume that the length of packets (i.e. messages and acknowledgements) sent via the channel is constant. This assumption is reliable if the application data field in the message is short comparing to the protocol overhead. This is the case when the brief explicit messages or network variable updates are exchanged between the nodes (see the application messages specification in [16] for details). Denote by PktLength the packet length in bits.
As follows from the definition presented in Sect. 3.1, the mean access delay tmean might be simply calculated as:
t mean = Δ mean PktLength
since tmean defines the access latency until the beginning of the successful transmission so it does not cover the time devoted to the transmission of a packet after winning the contention (Fig. 2).
The time interval Δmean and the mean access delay tmean are expressed in the formula (3) in bits which corresponds to the appropriate measures defined in time units multiplied by the channel bit rate.
As follows from (3) and (2), in order to evaluate the mean access delay tmean, both the expected number of transmission attempts E(X) and the mean length of a packet cycle τ have to be found.

4.3. Mean Number of Transmission Attempts

Let us suppose there are a number of n contenders. First, we will calculate the mean number of transmission attempts before winning the contention E(X) made by a selected node.
Following the notation, X represents a number of trials before a packet successful transmission is obtained. Denote by Psucc(1) the probability that a certain node succeeds at any trial. The probability of the successful transmission of any packet in the channel with a number of n contenders, Psucc, is given by:
p succ = n p succ ( 1 )
because each node may win the contention.
Since the probability of failing during the first (i-1) tries is (1−Psucc(1))i−1, the probability of succeeding at the ith attempt equals:
p ( X = i ) = ( 1 p succ ( 1 ) ) i 1 p succ ( 1 ) .
The formula (5) defines the probability mass function of X. The mean number of transmission attempts E(X) is defined by the appropriate expectation:
E ( X ) = i = 1 i ( 1 p succ ( 1 ) ) i 1 p succ ( 1 )
Multiplying both sides of the equation (6) by (1−Psucc(1)), we have:
( 1 p succ ( 1 ) ) E ( X ) = i = 1 i ( 1 p succ ( 1 ) ) i p succ ( 1 )
Subtracting (7) from (6) gives:
p succ ( 1 ) E ( X ) = p succ ( 1 ) [ 1 + ( 1 p succ ( 1 ) ) + ( 1 p succ ( 1 ) ) 2 + ]
Note that the right side of the (7) includes the infinity sum of a geometric series that equals one so:
E ( X ) = 1 / p succ ( 1 )
For example, if the probability Psucc(1) that a given node transmits successfully equals 0.1, then a number of 10 successful packet cycles is needed on the average in order to transmit a packet with success. This result is not surprising since the transmission attempts are independent and may be modelled by the geometric distribution where the expected number of trials until the first success is the inverse of the probability of a success at any trial.
The formula (9) defines the mean access delay as the average number of trials needed to win the channel contention. To express the mean access delay in bits or seconds, the mean length of a packet cycle τ has to be estimated.

4.4. Mean Length of Packet Cycle

The access to the shared channel is organized in packet cycles. Each packet cycle is an attempt of a packet transmission undertaken by node(s) that has data ready for sending. A packet cycle begins with an interpacket gap and a random number of contention slots followed by a packet transmission. The result of each transmission attempt is a successful transmission of a packet or a collision.
The mean length of a packet cycle, τ, is defined as a weigthed sum of the lengths of successful and unsuccessful packet cycles:
τ = p coll τ coll + p succ τ succ
where τsucc, τcoll denote the mean lengths of successful and unsuccessful packet cycles, respectively, Psucc represents the probability of a successful transmission in the channel, and Pcoll denotes the probability that packets are involved in collisions. All the measures Psucc, Pcoll, τsucc, τcoll are function of the number of contending nodes, n.
The mean lengths of the appropriate packet cycles, τsucc(n), τcoll(n) are given by the formulas:
τ succ ( n ) = β 1 + [ d succ ( n ) 1 ] β 2 + PktLength
τ coll ( n ) = β 1 + [ d coll ( n ) 1 ] β 2 + PktLength
where dsucc(n) denotes the mean slot number, at which a node winning the competition starts the transmission, dcoll(n) is the mean slot number at which a collision occurs, β1 is the duration of the minimum interpacket gap, and β2 is the contention slot width. All the parameters τsucc, τcoll, β1, β2, PktLength in the formulas (11) and (12) are specified in [bits].
Substituting (9), (10), (11), (12) and (2) in (3):
t mean = p coll p succ ( 1 ) τ coll + p succ p succ ( 1 ) τ succ PktLength
Taking into account that Psucc=1−Pcoll and setting (4) into (13):
t mean = ( 1 p succ 1 ) n τ coll + n τ succ PktLength
The formula (14) is valid for any slotted-CSMA protocol where the size of the contention window maintained by each node is the same and the number of contenders is constant. This formula is essential for the content of the present study. The evaluation of the mean access delay given by (14) is consistent (excepting some differences in network models) with the corresponding formula included in [4] although both analytical derivations are obtained in different ways.
Under some constraints, the formula (14) can be further simplified. As will be shown in Sect. 5.2 and 7.2, both dsucc(n) and dcoll(n) approach asymptotically one if the number of contending nodes is large since:
lim n d succ ( n ) = lim n d coll ( n ) = 1
The asymptotic limit defined by the formula (15) is exemplified in subsequent Fig. 3b for the 0.0625-persistent CSMA and in Fig. 7 for the predictive p-CSMA. As a result:
τ coll τ succ β 1 + PktLength PktLength
since the interpacket space is negligible comparing with the packet length. Consequently, the mean access delay for large number of contenders can be approximated by the closed-form formula:
t mean PktLength p succ n

4.5. Input Parameters Required for Network Performance Evaluation

Summing up, in order to estimate the mean access delay tmean, the following measures have to be calculated (see formulas (14), (11), (12)):
-
the probability of a successful transmission Pcoll(n), or the probability of collision Pcoll(n),
-
the mean slot number when the successful transmission starts dsucc(n), and the mean slot number when the collision occurs dcoll(n).
All these measures might be evaluated using the standard probability calculus if the size of the contention window is constant, e.g. 16 slots for BL=1. If the randomizing window changes during the network operation, the analytical approach have to involve Markov chains to estimate the distribution of the window size in the network steady state. In Section 5, the stochastic analysis for the fixed-window p-persistent CSMA is presented. Next, the Markov-based model for the variable-window predictive p-persistent CSMA will be shown in Section 6.

5. Stochastic Analysis of [1/(16k)]-Persistent CSMA

As stated, the backlog counter BL is responsible for dynamic adjustment of the contention window size to the current channel load. If the backlog equals k at some packet cycle, then the instantaneous persistence level of the predictive p-CSMA amounts to 1/(16k). Moreover, for some load scenarios the channel backlog BL permanently equals one or is closed to one. It is the case if the collision detection is absent, and no multicast messages are sent via the channel, or if the traffic rate is light regardless of the load scenario.

5.1. Probability of Successful/Unsuccessful Transmission for [1/(16k)]-Persistent CSMA

Now we will calculate the probability of successful transmission Psucc(n) and the probability of collision Pcoll(n) for [1/(16k)]-persistent CSMA protocol.
Let p succ ( 1 ) ( k ) ( n ) denote the probability that a certain node wins a competition for the channel if a window contains 16k slots, and the number of n nodes have data ready for a transmission. In each packet cycle, contending nodes select the corresponding slot numbers from a set of integers 1,…,16k. A node that chooses the earlier slot wins the channel contention.
The probability p succ ( 1 ) ( k ) ( n ) is expressed as the sum of the following probabilities calculated for each one from 1,…,16k slots:
-
probability that a winner selects a certain slot s, s = 1,…,16k, which equals to 1/(16k), and
-
probability that all the other (n-1) nodes draw one from (16k-s) later slots, which equals to.((16ks)/16k)n−1.
Finally, p succ ( 1 ) ( k ) ( n ) is given by the following formula:
p succ ( 1 ) ( k ) ( n ) = s = 1 16 k 1 16 k ( 16 k s 16 k ) n 1
According to the formula (4), the probability p succ ( k ) ( n ) that a transmission is successful with a number of n contenders is as follows:
p succ ( k ) ( n ) = n p succ ( 1 ) ( k ) ( n ) = n s = 1 16 k 1 16 k ( 16 k s 16 k ) n 1
Consequently, the probability p coll ( k ) ( n ) that a transmission in the channel experiences a collision:
p coll ( k ) ( n ) = 1 p succ ( k ) ( n ) = 1 n s = 1 16 k 1 16 k ( 16 k s 16 k ) n 1

5.2. Mean Slot Numbers When Successful/Unsuccessful Transmissions Start for [1/(16k)]-CSMA

Define p succ , i ( k ) as the conditional probability that a certain node wins a channel contention drawing a slot i, i = 1,…,16k provided that this packet cycle is successful. Because the probability that a given node successfully transmits is p succ ( 1 ) ( k ) ( n ), therefore (see (18)):
p succ , i ( k ) = 1 16 k ( 16 k i 16 k ) n 1 p succ ( 1 ) ( k ) = ( 16 k i ) n 1 s = 1 16 k ( 16 k s ) n 1
The expected number of a slot, d succ ( k ) ( n ), which is chosen by winning nodes in the successful packet cycles is by the definition:
d succ ( k ) ( n ) = i = 1 16 k i p succ , i ( k )
Taking into account the formula (21):
d succ ( k ) ( n ) = s = 1 16 k ( 16 k s ) n 1 s s = 1 16 k ( 16 k s ) n 1
Similarly, the expected slot number, where a collision occurs is given by the formula:
d coll ( k ) ( n ) = 1 ( 16 k ) n 1 s = 1 16 k s n 1

5.3. Numerical Results for 0.0625-Persistent CSMA

Setting k=1 to the appropriate formulas (19), (20), (23) and (24), we can calculate all the required measures for 0.0625-persistent CSMA. Namely, Fig. 3 shows p succ ( 1 ) ( n ), p coll ( 1 ), d succ ( 1 ) ( n ), d coll ( 1 ) ( n ), respectively. Futhermore, in Fig. 4 the mean access delay versus the number of nodes, n, for 0.0625-persistent CSMA is presented.
As follows from Fig. 3 and Fig. 4, the 0.0625-persistent CSMA protocol presents a satisfactory performance if a network does not exceed a few nodes. For 20 active nodes, the probability of a successful transmission nearly equals the probability of a collision so only about half of the bandwidth is used for successful transmissions (Fig. 3a). For large networks p succ ( 1 ) ( n ) is degraded due to excessive collisions. The strong decrease of the probability of successful transmission Psucc (Fig. 3a) causes the exponential lengthening of the mean access delay tmean versus the network size according to the equation (17) as is seen in Fig. 4.

6. Stochastic Analysis of Predictive CSMA

Now the analytical approach for the fixed-window p-CSMA will be extended for the variable contention window in the predictive p-persistent CSMA. The analytical approach based on Markov chains is applied.

6.1. Probability of Successful/Unsuccessful Transmission for Predictive p-CSMA

As follows from the predictive p-persistent CSMA specification, the contention window size varies from one to the next packet cycle following the random protocol behavior. Let us assume that the backlog BL equals k with the probability πk in the network steady state.
The mean channel backlog B L ¯, defined as an expected backlog in the long-term prospect, is calculated as follows:
B L ¯ = E [ B L ( l ) ] = k = 1 B L max k π k
where E[·] is the expectation operator.
The mean size of a randomizing window in the saturation steady state:
W ¯ = 16 B L ¯
The corresponding performance metrics for the variable-window CSMA can be found as appropriate expectations:
p succ ( n ) = k = 1 B L max π k p succ ( k )
d succ ( n ) = k = 1 B L max π k d succ ( k )
d coll ( n ) = k = 1 B L max π k d coll ( k )
where π = [πk], k = 1,…,63 is the stationary distribution of the backlog.
Substituting the formula (19) into (27) we obtain the probability of a successful transmission:
p succ = n k = 1 B L max π k [ s = 1 16 k 1 16 k ( 16 k s 16 k ) n 1 ]
and the probability of a collision:
p coll = 1 n k = 1 B L max π k [ s = 1 16 k 1 16 k ( 16 k s 16 k ) n 1 ]
Next, the mean slot numbers when the successful/unsuccessful transmission starts for the predictive p-persistent CSMA are found by setting the expression (23) to (28) and (24) into (29), respectively:
d succ ( n ) = k = 1 B L max π k [ s = 1 16 k ( 16 k s ) n 1 s s = 1 16 k ( 16 k s ) n 1 ]
d coll ( n ) = k = 1 B L max π k ( 1 ( 16 k ) n 1 s = 1 16 k s n 1 )

6.2. Analytical Model of Channel Backlog

In order to evaluate the performance measures given by the formulas (27), (32), (33), the stationary distribution of backlog π = [πk], k = 1,…,63 has to be calculated.
Denote BL(l) as a stochastic process representing the backlog stage at the lth packet cycle in the network consisting of n nodes, where BL(l) =1,…,63. We assume that the process BL(l) is a global measure of the channel (see Section 2.6). BL(l) is a discrete Markov chain with transition probabilities pi,j; i, j = 1,…,63.
The current backlog counter is tuned by the traffic transmitted in the channel and collisions. In the assumed load scenario where all the messages are acknowledged and unicast and the collision detection is enabled (ACK/unicast/CD) we distinguish three types of packet cycles (see Sect. 2.3):
(1)
an unsuccessful transmission due to a collision, which causes the channel backlog BL to increment by one in the next packet cycle: BL(l+1) = BL(l)+1,
(2)
a successful transmission of the message, when the channel backlog BL does not change in the next packet cycle: BL(l+1) = BL(l),
(3)
a successful transmission of the acknowledgement packet, which decreases the channel backlog BL by one in the next packet cycle: BL(l+1) = BL(l)-1.
Modelling the impact of backlog limitations, two additional conditions for the backlog minimum BL(l) = 1 and the backlog maximum BL(l) =63 have to be included:
(4)
if the backlog has reached the last stage BL(l) = BLmax = 63, remains at it even after an unsuccessful transmission,
(5)
if the backlog has entered the first stage BL(l) = BLmin = 1, remains at it even after successful transmission of an acknowledgement.

6.3. Transition Probabilities

The key approximation in our model is that the probability of a successful transmission of an acknowledgement is the same as the probability of the successful transmission of a message. The validity of this approximation will be checked in Sect. 8.2. According to this approximation, if the probability of a collision at a certain backlog stage BL(l) = k with n competing nodes amounts to p coll ( k ) ( n ), then both the probability of a successful transmission of a message and of an acknowledgement are equal to ( 1 p coll ( k ) ) / 2.
Suppose that the backlog enters the stage k at the lth packet cycle, that is, BL(l) = k. Let Pr {BL(l+1) = k + sBL(l) = k} be the transition probability that the backlog enters the stage BL(l+1) = k + s in the (l+1)th packet cycle from the stage BL(l) = k in the lth cycle. Let us denote the transition probabilities in short:
Pr { B L ( l + 1 ) = k + s | B L ( l ) = k } = p k , k + s
Taking a specification of packet cycle types (1)-(5) into account, we can compute the probabilities of switching between the backlog stages:
p k , k + 1 = p coll ( k ) , k = 1 , , 62 p k , k = { 1 p coll ( k ) ( 1 p coll ( k ) ) / 2 , ( 1 + p coll ( k ) ) / 2 k = B L min = 1 k = 2 , 62 k = B L max = 63 p k , k 1 = ( 1 p coll ( k ) ) / 2 , k = 2 , , 63 p k , k + s = 0 , | s | > 1 , k = 1 , , 63
Note that BL(l) is a random walk for ACK/unicast/CD load scenario since pk,k+s = 0 for |s| >1, i.e. only transitions between consecutive backlog stages are possible. The state transition diagram of Markov chain for a given scenario is depicted in Fig. 5.

6.4. Mean Backlog and Stationary Distribution

As is well-known, the stationary distribution of a Markov chain is an eigenvector of the transition matrix P, associated with the eigenvalue 1. The vector π = [πk] includes the long-term probabilities πk that the channel backlog will be at the stage k in the steady state, that is:
π k = lim l Pr { B L ( l ) = k }
The probability πk is the relative frequency that a channel enters the backlog stage k in the steady state. See [13] for the numerical methods of the stationary distribution computation. Here we calculate the stationary distribution directly as the appropriate eigenvector of the transition matrix. Namely, to compute the steady-state vector π of a Markov chain, the following linear system has to be solved:
[ G | e ] T π = b
where
  • P =[pi,j] is a transition matrix 63 × 63; the elements pi,j of the matrix P are given by (35),
  • G = PI, where I is an identity matrix 63 × 63,
  • e = [ei] is a vector, where ei = 1;i = 1,…,63,
  • [G | e] is a matrix 63 × 64, where the last column of this matrix is the vector e,
  • b =[bi] is a vector, where bi = 0,bi+1 = 1; i = 1,…,63.
According to (35), the transition matrix P for ACK/unicast/CD scenario is composed as follows:
p = [ 1 p coll ( 1 ) p coll ( 1 ) 0 0 1 p coll ( 2 ) 2 1 p coll ( 2 ) 2 p coll ( 2 ) 0 0 0 0 1 p coll ( 62 ) 2 1 p coll ( 62 ) 2 p coll ( 62 ) 0 0 1 p coll ( 63 ) 2 1 + p coll ( 63 ) 2 ]
Note that the elements of a matrix P are functions of the number of nodes n. The only input parameters necessary to compose the transition matrix are the probabilities p coll ( k ), k = 1,…63 that might be computed using formula (20).

7. Numerical Results for Predictive CSMA

Using the analytical approach presented in Section 6 we have obtained the following numerical results.

7.1. Mean Backlog and Probability of Successful/Unsuccessful Transmission

The plots presenting the mean channel backlog B L ¯ and the probability of collision versus the number of nodes n for a specified load scenario (ACK/unicast/CD) are shown in Fig. 6. Each point on the saturation backlog graph is found as a solution of the linear equation (37) for a particular number of nodes and the saturation backlog basing on the equation (26). The saturation probability of collision Pcall is computed according to the equation (31).
Since we want to recognize the complete protocol behavior, the saturation backlog versus the wide range of a network size (from 2 to 2500 nodes) is presented. A typical network segment contains a few dozens of nodes although LonTalk protocol can operate with segments that consist of hundreds of devices [1].
The analysis of the results shows that the mean channel backlog is, as expected, a non-decreasing function of the network size. At the lower range the mean backlog increases linearly as the number of nodes grows and the slope of the curve is about 0.06 per node. It means in particular that adding a new node to the existing network causes the increase of the mean size of a competition window of about 0.06*16 ≊ 1 time slot of β2 duration in saturation conditions. The linear relationship between the saturation backlog and the network size is valid up to about 700 nodes. For larger networks the influence of the upper bound of the channel backlog prevents a further extension of the competition window. If a network contains more than 1000 nodes, then the saturation backlog is close to its maximum value 63, and the predictive CSMA is reduced to the 0.0009-persistent CSMA. Summing up, the prediction is effective for the network sizes up to 700 nodes.
Three regions might be distinguished on the plot of the collision probability Pcoll (Fig. 6). The probability Pcoll grows in proportion to the number of nodes for a network containing dozens of devices. If the network segment contains less than 127 nodes (i.e. makes up a single LonWorks subnet) the probability of a successful transmission ranges from a 90% to about 70%. For the network sizes larger than 100 nodes, Pcoll is established at 0.333. Consequently, Psucc is kept at 0.667. Note that the sustained probabilities Psucc = 0.67 and Pcoll = 0.33 are established at the equilibrium point, when the probabilities of the backlog increase (Psucc/2) and decrease (Pcoll) are equal. Finally, for networks greater than 700 nodes, the influence of maximum size of a competition window appears, and the shape of both measures is close to that of the 0.0009-persistent CSMA.

7.2. Mean Slot Numbers Where the Successful/Unsuccessful Transmission Starts

The relationships between the mean slot numbers dsucc(n), dcoll(n) and the number of nodes n according to (32), (33) for ACK/unicast/CD load scenario are shown in Fig. 7. The analysis of dsucc(n) versus the number of nodes allows to reply to the question how much the network bandwidth is wasted during the channel contention, that is, how many time slots β2 are wasted in the average successful packet cycle in order to avoid the collision. As follows from Fig. 7, in the network containing 10 nodes about the third slot is drawn by the winning nodes in average, and for 100 nodes, about the second one. The next conclusion taken from Fig. 7 is that dsucc(n)<dcoll(n). It is intuitively clear since collision is more probable in later slots, when none of competing nodes draws some early slot.
As follows from Fig. 7, dsucc(n) ≊ dcoll(n) ≊ 2 for n > 50 nodes. Moreover, assuming typical settings (i.e. β1 = 4[bits] bits and β2 = 2[bits]), according to the formula (16) we might approximate τsuccτcollPktLength for n > 50 nodes with a few percent accuracy for typical packet lengths (e.g. 12 bytes).
Thus, we can conclude that the fraction of bandwidth wasted due to a randomization of the channel access is insignificant if the contention is high. This is the important advantage of the predictive p-persistent CSMA.

7.3. Mean Access Delay

Fig. 8 shows the mean access delay versus the network size for the predictive p-CSMA found according to the equation (14) taking into account formulas (30), (32) and (33). The latency in accessing the channel increases nearly linearly with a growing number of contending devices up to about 700 nodes. This is the important qualitative difference compared with the mean access delay for the fixed window p-CSMA (see Fig. 4) where the network latency grows exponentially. However, the explanation of this difference is clear: since Psucc is kept at sustained value 0.667, then according to the simplified formula (17) the mean access delay has to increase linearly.
In particular, adding a new active node to the existing network causes the increase of the mean access delay of about PktLength/0.667 ≊ 1.5 PktLength[bits] in ACK/unicast/CD scenario.
For networks greater than 700 nodes, the shape of mean access delay plot starts to be nearly exponential since it is close to that of 0.0009-persistent CSMA.
On the basis of the analytical formulas, the following conclusions can be drawn up:
-
if the channel is lightly loaded, the primary component of the latency is deferring transmission due to randomization of the channel access; the delay is then not greater than a few contention slots in average as is seen in Fig. 3b and Fig. 4 for the 0.0625-persistent CSMA,
-
if the channel is heavily loaded, the dominant component of the access delay is the probability of a successful transmission of a single node; this probability decreases due to two factors: first, because of decreasing the total channel bandwidth utilization as a result of collisions; second, since the channel bandwidth per a single node decreases because it is divided out among the growing number of contenders.
Furthermore, since the asymptotic probability of a collision is bounded in the predictive p-persistent CSMA, the mean access delay grows almost linearly with the number of contending nodes.
It is worthy to emphasize that linear characteristic of the average access delay is the optimal delay relationship that can be achieved for heavy workload in MAC protocols based on the best-effort strategy and appears only for the range of workload where the channel throughput does not decrease with growing number of contenders. The linear access delay increase with the network load is the effect of dividing the bandwidth out among the increasing number of active nodes.

8. Simulative Validation of Analytical Approach

In order to verify the analytical approach we have run the simulations for the network containing selected number of nodes. The simulation model implemented in LabView corresponds to the analytical model specified in Section 3.
The simulation starts when the channel is idle. Next, the transient zone appears, when the nodes permanently try to access the channel and the mean channel backlog grows, but does not reach the steady-state value. Since the simulation model belongs to non-terminating systems and the steady state theoretically is never reached, we detect it with a finite accuracy. The detection relies on the search of the constant value of the mean backlog, rather than of the constant value of the current backlog. Therefore, we used the moving averages defined over a window of observations (i.e. a certain number of packet cycles, increasing with the number of nodes). Moving averages filter the higher frequency components in the mean backlog, arisen from the random behavior of the CSMA algorithm on the one hand, and remove also the influence of the transient zone on the estimation of saturation backlog on the other. The saturation backlog is found under quasi steady-state conditions when the moving average of the channel backlog is kept inside of 5% wide confidence interval.
Simulation outputs are the saturation channel backlog, the relative frequencies of successful/unsuccessful transmissions (as the experimental equivalents of the appropriate probabilities), and the mean access delay.

8.1. Validation of Transition Probabilities

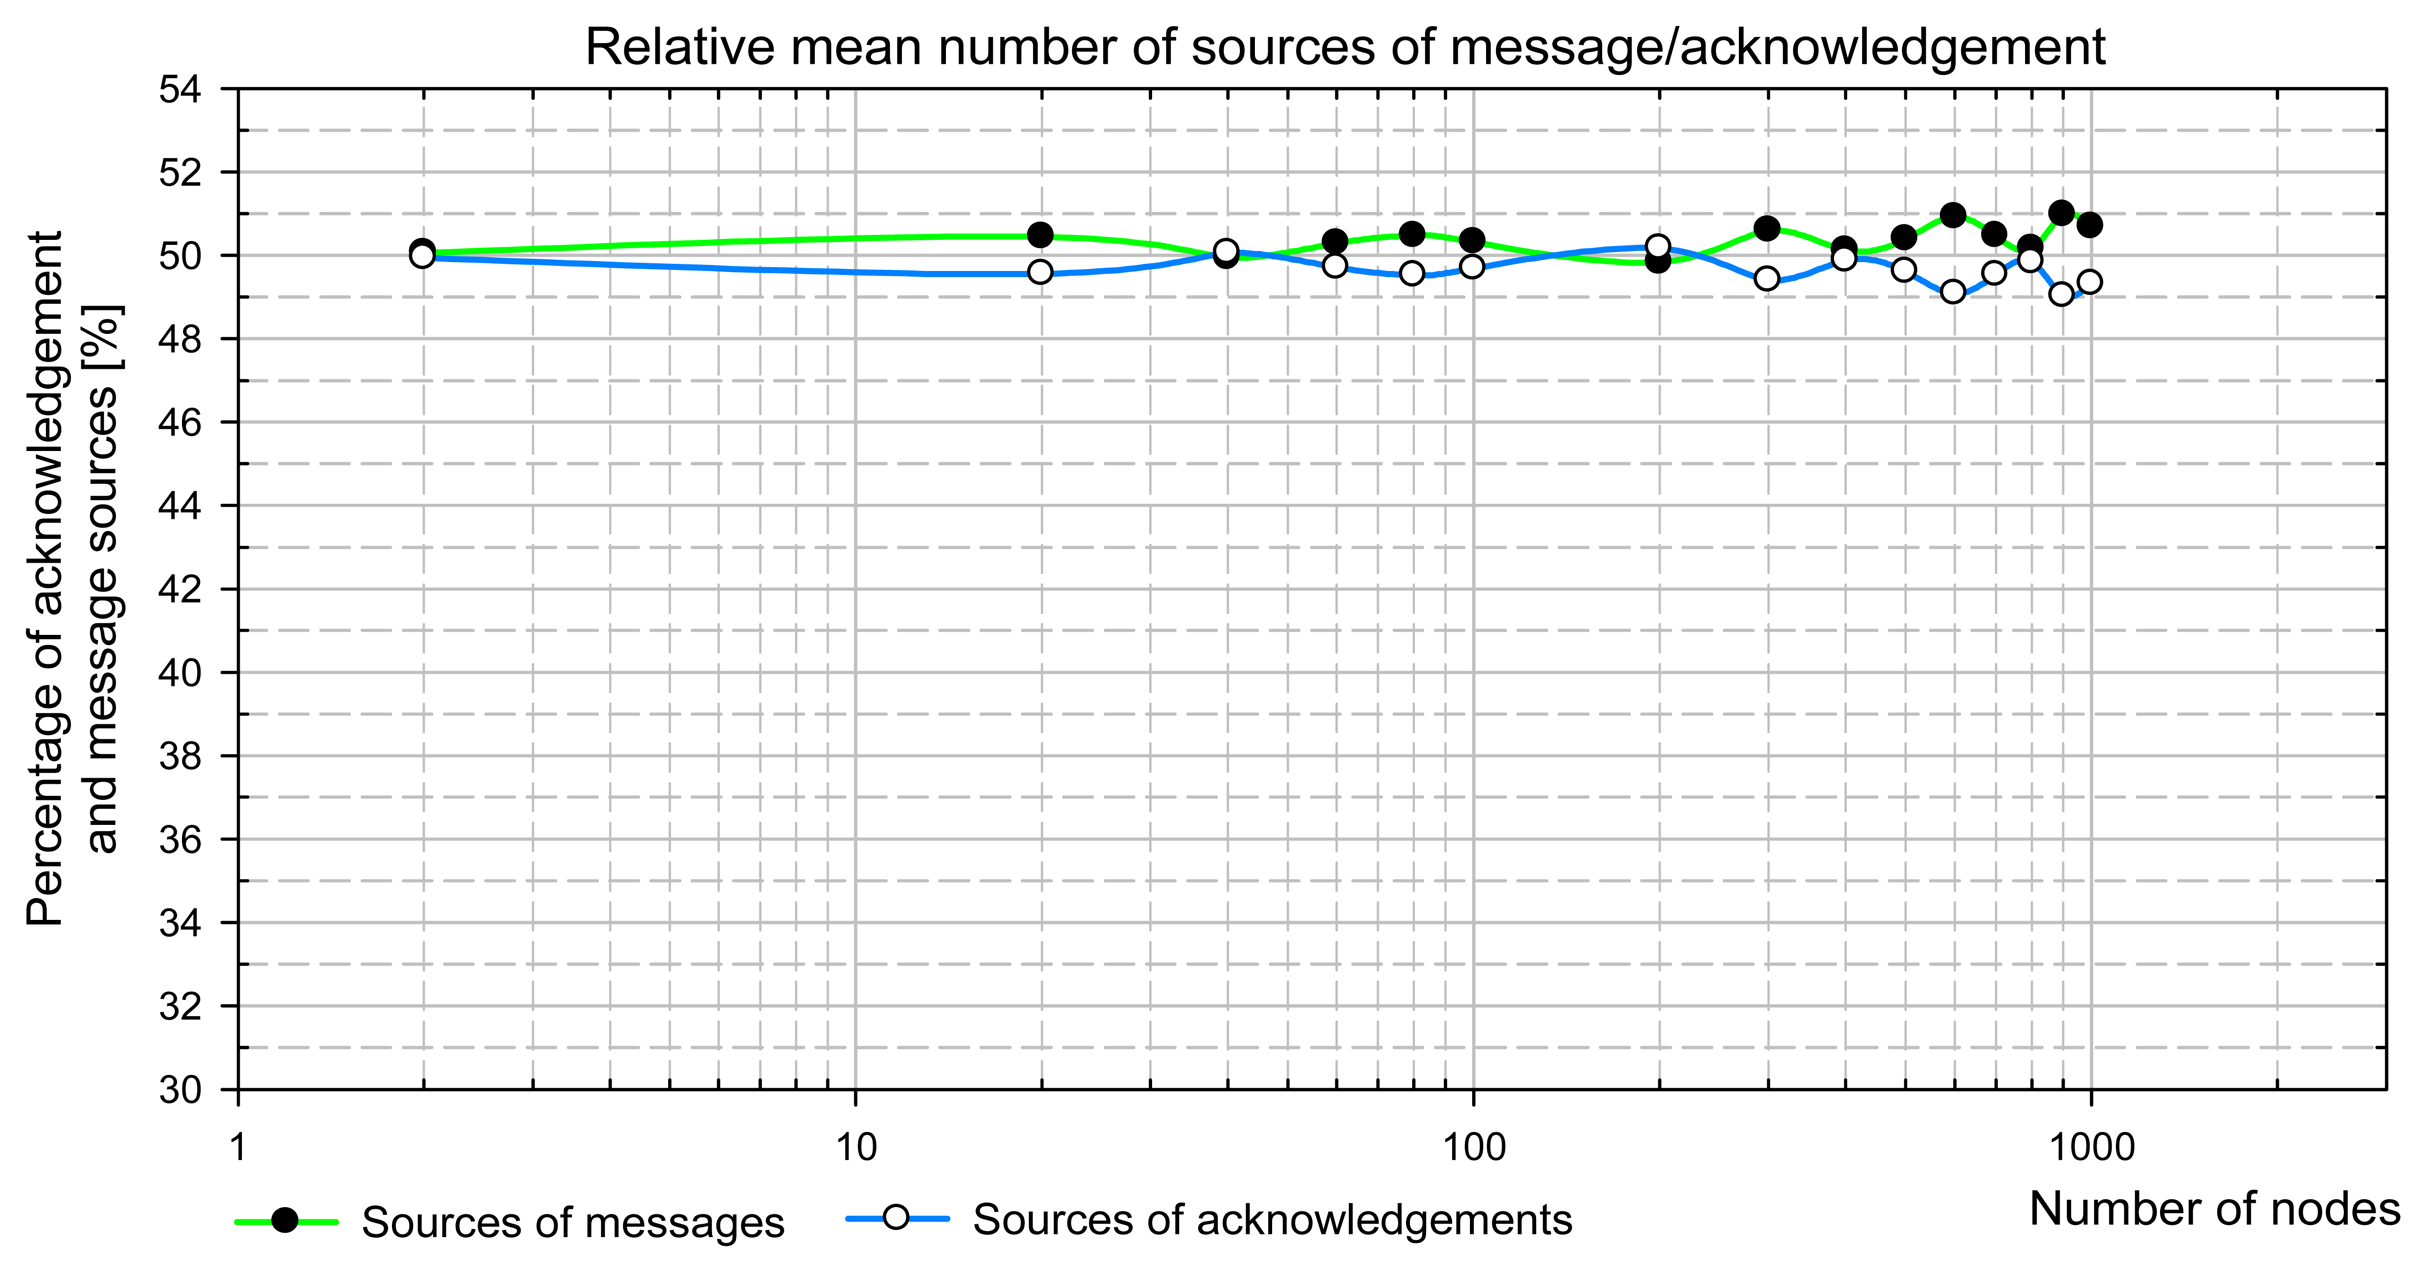
The transition probabilities in Markov model have been derived basing on the equality of the probabilities of the successful transmission of a message and an acknowledgement (see Sections 6.3). This assumption is true if the mean number of nodes having a message waiting for a transmission (i.e. message sources) equals the mean number of nodes that possesses an acknowledgement ready for sending (i.e. acknowledgement sources).
A uniform distribution of destination addresses has been implemented in the simulation model as stated in Sect. 3.2. The assignment of recipient addresses is controlled by the simulator. First, the simulator tries to assign a recipient that is a source of messages to every message sender. In case of the lack of sufficient number of message sources, the sender sends a message to itself (by the way such transmissions occur sometimes in real LON systems during turnaround network variable updates, see [15]).
Fig. 9 presents simulation results showing the mean number of message and acknowledgement sources in the network steady state. It is clear that both numbers are equal to 50% with finite simulation accuracy. It was checked that these results are independent of initial conditions, i.e. the proportion between the number of message and acknowledgement sources at the simulation beginning.

8.2 Simulation versus Numerical Results

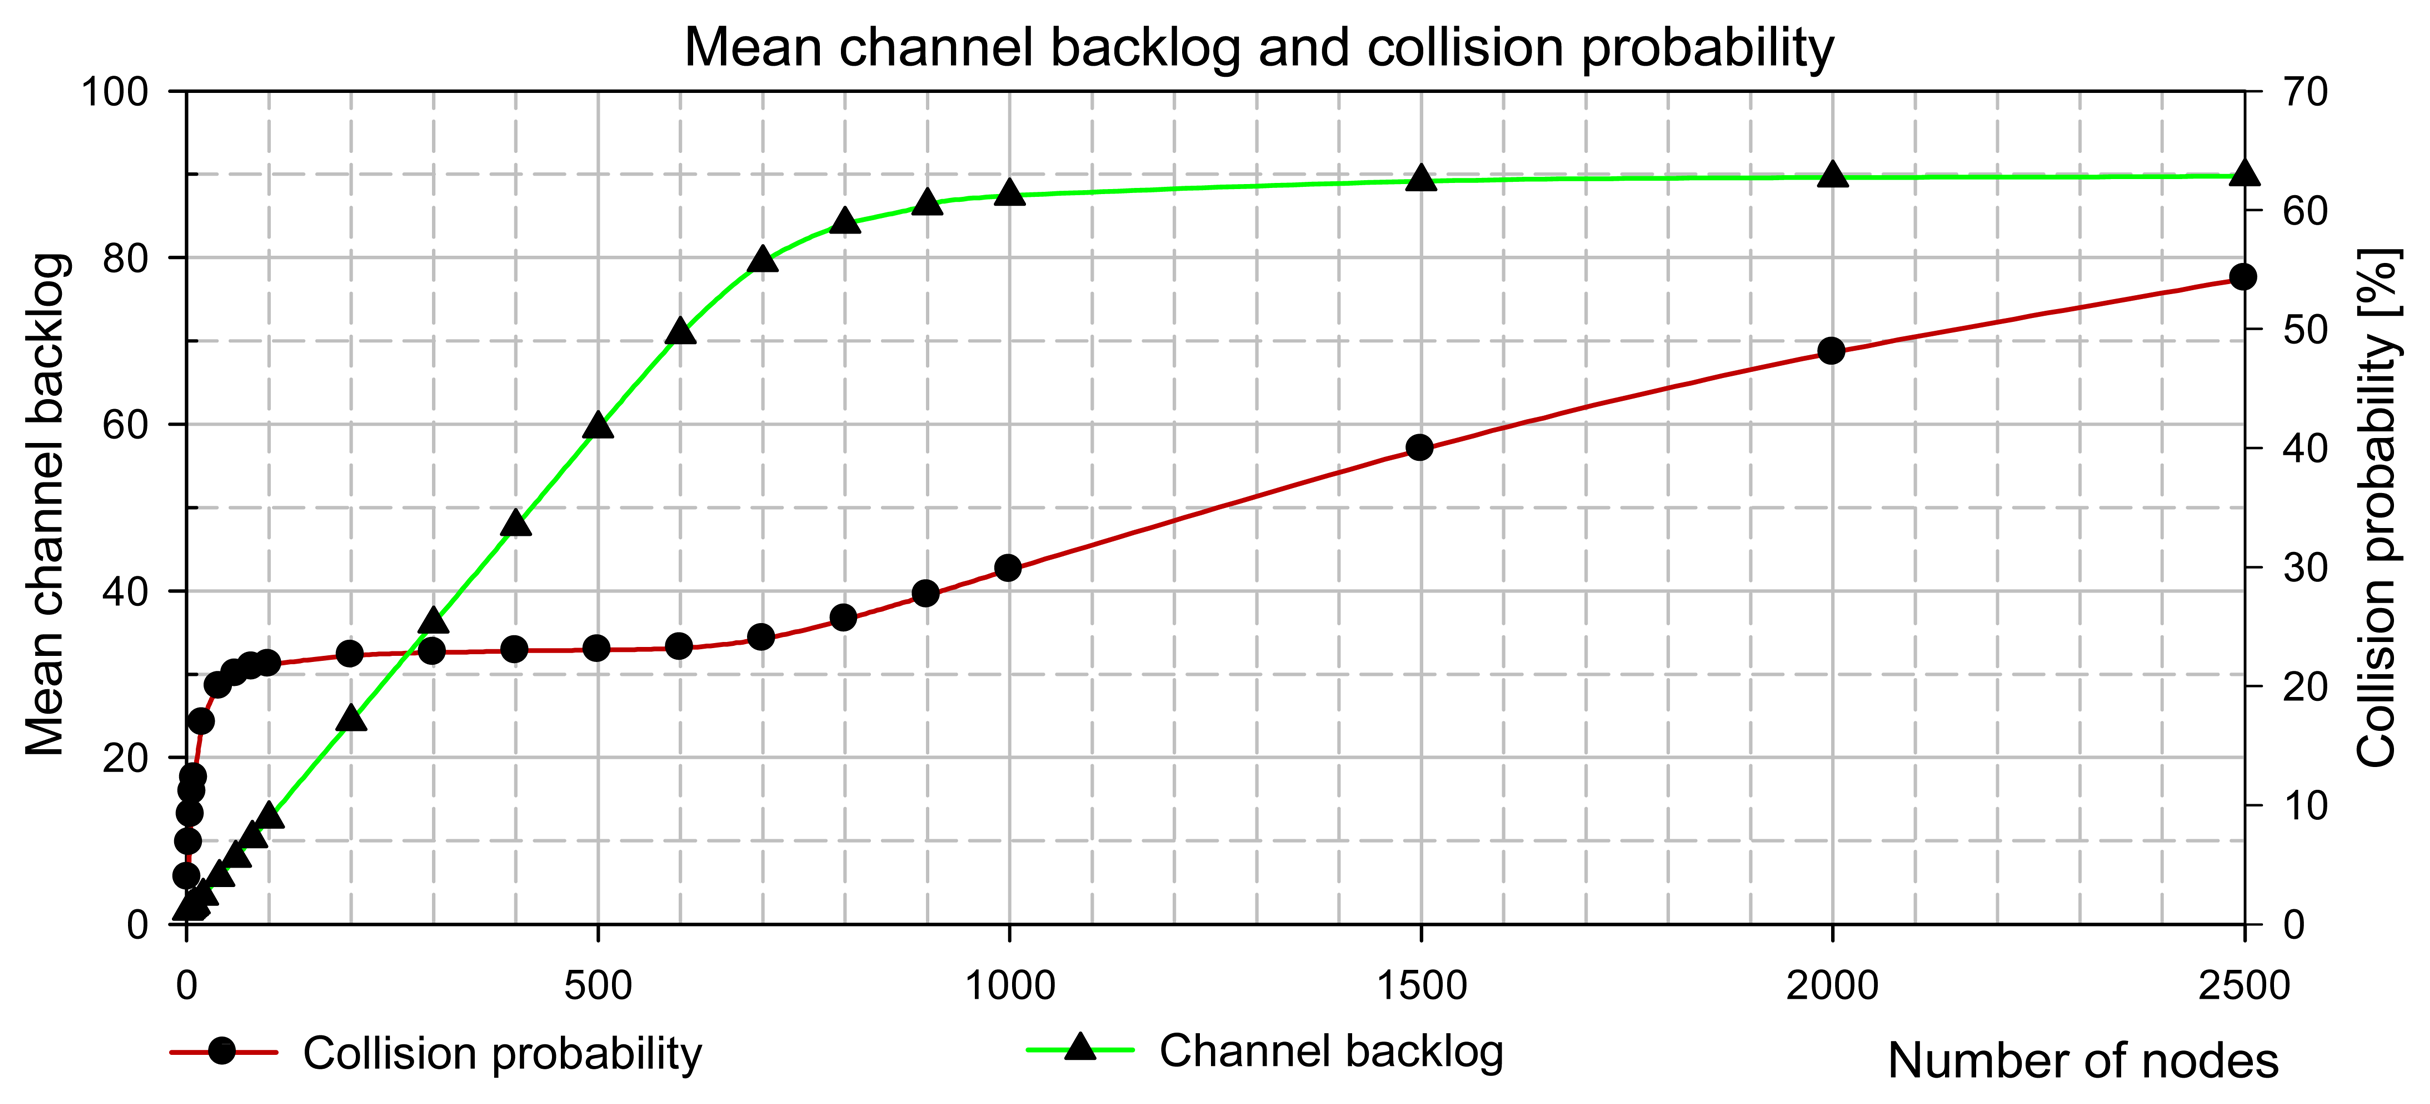
The comparison of simulation and numerical results for the saturation backlog, the probability of collision Pcoll and its experimental measure (i.e. collision percentage P'coll), and the mean access delay, are presented in Table 1. Since both results are very close to each other and the corresponding graphs overlap, they are not shown on the plots together. The comparison shows a good conformity of simulation and Markov chain-based analytical approach. The difference between the results obtained in both approaches stems from:
-
the finite accuracy of backlog estimation and the steady state detection in the simulation,
-
the inaccuracy (non-uniformity) of the pseudorandom generator in the simulation,
-
the finite precision of complex analytical computations.

Conclusions

The paper addresses the issue of the mean access delay characteristics in term of the channel load for the predictive p-persistent CSMA media access protocol which belongs to the variable-window CSMA algorithms with collision avoidance. Our interest in the characteristics of the predictive p-CSMA stems from the practical aspect of it as it is used in real control network protocol successfully implemented Operating Networks (LonWork/EIA-709) platform.
The network model assumes the consistency of load prediction between the nodes, and that Transaction Control Sublayer does not introduce limitations on the data transmission. The latter means that the number of concurrent outgoing transactions being in progress is unlimited. Furthermore, it is assumed that the destination addresses of transmitted messages are distributed rather than concentrated on particular nodes. We present the analytical study of the predictive p-CSMA protocol performance for such a channel workload when the number of transmitting nodes is constant.
It is also proved that the mean access delay increases exponentially for the pure p-persistent CSMA and almost linearly for the predictive p-CSMA with the growing number of transmitting nodes. The simulative validation of analytical results for transition probabilities of Markov model, and network measures, are provided.

References and Notes

  1. LonTalk protocol specification; Version 3.0; Echelon Corporation, 1995.
  2. Network communication protocol including a reliable multicasting technique United States Patent 5297143, 1994.
  3. Enhanced media access control with LonTalk protocol; LonWorks Engineering Bulletin, 1995.
  4. Buchholz, P.; Plonnigs, J. Analytical analysis of access-schemes of the CSMA type, Proc. of IEEE International Workshop on Factory Communication Systems WFCS'2004, Wien; 2004; pp. 127–136.
  5. Bianchi, G. IEEE 802.11-saturation throughput analysis. Communications Letters 1998, 2(12), 318–320. [Google Scholar]
  6. Cali, F.; Conti, M.; Gregori, E. Dynamic tuning of the IEEE 802.11 protocol to achieve a theoretical throughput limit. IEEE/ACM Transactions on Networking 2000, 8(6), 785–799. [Google Scholar]
  7. Miśkowicz, M.; Sapor, M.; Latawiec, W.; Zych, M. Performance analysis of predictive p-persistent CSMA protocol for control networks., Proc. of IEEE International Workshop on Factory Communication Systems WFCS'2002, Vasteras, Sweden; 2002; pp. 249–56.
  8. Miśkowicz, M.; Golański, R. LON technology in wireless sensor networking applications. Sensors 2006, 6(1), 30–48. [Google Scholar]
  9. Dietrich, D.; Loy, D.; Schweinzer, H.-J. Open Control Networks: LonWorks/EIA 709 Technology; Kluwer Academic Publishers, 2001. [Google Scholar]
  10. Chen, X.; Hong, G.-S. Real-time performance analysis of a fieldbus-based network, Proc. of Information, Decision and Control Conference, Adelaide; 2002; pp. 113–1.
  11. Kopetz, H. Real-Time Systems. Design Principles for Distributed Embedded Applications; Kluwer Academic Publications, 1997. [Google Scholar]
  12. Kleinrock, L.; Tobagi, F.A. Carrier sense multiple-access modes and their throughput-delay characteristics. IEEE Trans. on Comm. 1975, 23(12), 1400–1416. [Google Scholar]
  13. Stewart, W.J. Introduction to the numerical solution of Markov chains; Princeton Univ. Press: Princeton, 1999. [Google Scholar]
  14. Yeh, J. Simulation of local computer networks – a case study. Computer Networks 1979, 3, 401–417. [Google Scholar]
  15. LonWorks Technology Device Data; Rev. 4; Motorola, 1997.
  16. Neuron C Programmer's Guide; Rev. 4; Echelon Corporation, 1995.
  17. Wireless LAN Medium Access Control (MAC) and Physical Layer (PHY) specifications; IEEE standard 802.11, IEEE Computer Society, 1997.
  18. Chiu, D.; Jain, R. Analysis of the increase/decrease algorithms for congestion avoidance in computer networks. Journal of Computer Networks and ISDN 1989, 17(1), 1–14. [Google Scholar]
  19. Chen, X.; Hong, G.-S. A simulation study of the predictive p-persistent CSMA protocol., Proceedings of 35th Annual Simulation Symposium; 2002; pp. 345–51.
Figure 1. Delta_BL is the 6-bit long data field in the 8-bit Link Layer header.Note that Delta_BL =1 is set in the figure, which corresponds to the unicast acknowledged message.
Sensors 07 03535f1
Figure 2. A packet access delay definition.
Sensors 07 03535f2
Figure 3. Probabilities of successful transmission p succ ( 1 ) ( n ) and a collision p coll ( 1 ) ( n ) (a); the mean slot numbers where the successful transmission starts d succ ( 1 ) ( n ), and the collision occurs d coll ( 1 ) ( n ) (b) versus the number of nodes.
Sensors 07 03535f3
Figure 4. The mean access delay versus the number of nodes for 0.0625-persistent CSMA.
Sensors 07 03535f4
Figure 5. The state transition diagram of the Markov chain for ACK/unicast scenario.
Sensors 07 03535f5
Figure 6. Mean channel backlog and the probability of a collision for ACK/unicast/CD load scenario.
Sensors 07 03535f6
Figure 7. Mean slot number, at which the transmisson dsucc(n) and the collision dcoll(n) occurs for the predictive p-CSMA
Sensors 07 03535f7
Figure 8. Mean access delay versus the number of nodes for the predictive p-persistent CSMA.
Sensors 07 03535f8
Figure 9. Simulation results of the mean number of message/acknowledgement sources in the saturation network steady state
Sensors 07 03535f9
Table 1. The comparison of analytical and simulation results for ACK/unicast/CD load scenario.
n B L ¯ (Markov model)BL (simulation)Pcoll [%] (Markov model)P'coll [%] (simulation)Mean access delay tmean [bits] (Markov model)Mean access delay t' mean [bits] (simulation)
21,1281,1245,565,77137143
61,3901,38713,1213,675542561
101,6631,66117,4917,9811351156
403,94764,02828,4828,9655625695
1008,85678,88931,1531,971515115143
50041,63442,16032,8933,37575874987
100061,19461,42842,5342,72174285175679

