High-rise Buildings versus Outdoor Thermal Environment in Chongqing

1
Key Laboratory of the Three Gorges Reservoir Region’s Eco-Environment, Chongqing University, Chongqing , 400045, China
2
Faculty of Urban Construction and Environmental Engineering, Chongqing University, Chongqing, 40045, China
3
Chongqing Steel Institute of Design, Chongqing, 40045, China
4
Faculty of Urban Construction and Environmental Engineering, Chongqing University, Chongqing, 40045, China
*
Author to whom correspondence should be addressed.
Sensors 2007, 7(10), 2183-2200; https://doi.org/10.3390/s7102183
Submission received: 30 July 2007
/
Accepted: 27 September 2007
/
Published: 11 October 2007
(This article belongs to the Special Issue Sensors for Urban Environmental Monitoring)
Abstract
:This paper gives a brief description of the over quick urbanization since Chongqing, one of the biggest cities in China, has been a municipality directly under the Central Government in 1997, excessive development and exceeding increase of high-rise buildings because of its special geographical position which finally leads to the worsening of the urban outdoor thermal environment. Then, this paper makes a bright balance to the field measurement and simulated results of the wind speed field, temperature field of one multifunctional high-rise building in Chongqing university located in the city center, and the contrasted results validate the correctness of CFD in the outdoor thermal environmental simulation, expose the disadvantages of high-rise buildings on the aspects of blocking the wind field, decreasing wind speed which results in accumulation of the air-conditioning heat revolving around and periscian region where sunshine can not rip into. Finally, in order to improve the urban outdoor thermal environment near the high-rise buildings especially for the angle of natural ventilation, this paper simulates the wind environment in different architectural compositions and architectural layouts by CFD, and the simulated results show that freestyle and tower buildings which can guarantee the wind speed and take the air-conditioning heat away are much suitable and reasonable for the special Chongqing geography. These conclusions can also be used as a reference in other mountain cities, especially for the one with a great number of populations.
1. Introduction
Chongqing is a typical mountain city which located in the west of China. Since it has been a municipality directly under the Central Government in 1997, the economy and traffic in the separated urban zone, western zone and three gorges ecological zone has gotten a fast development. 44% of the nonagricultural population is assembled to the urban zone which occupies only 6.6% of the total city's land area, and the per capita GDP reaches to 14,158$. The rate of urbanization is up to 57.7% which is 27.5 percentage points higher than the total city mean level. The general situation for the level of urbanization with big diversity in these three zones is shown in table 1. Meanwhile, with the fast development of urbanization, the heat island is 1.92°C in 2002 in the urban zone, and 1.05°C in the Three Gorges Ecological Zone. However, it leaps to 2.19°C and 1.98°C in 2004 respectively. Its range of heat island intensity is 0.93°C which is a striking number. The gross area bearing heat island is 168.6 km2 and it occupies 32.3% of the total main area as 511.4 km2 in 2007. Besides, the area bearing heat island increases by 37.8 Km2 from the year of 2001 to 2007 [20].
Data sources: statistical annals of Chongqing in 2003
The speedy urbanism of Chongqing since 1997 leads to a large leap of population in urban areas and amounts of increasing anthropogenic heat. Thanks to its specialty of geography in mountain cities, there are too less plain and too many hills, and the space extension and exploitation and the space construction has its own particularity and complexity. The rapid increase of urban population causes the improvement of space utilization ratio. On the other hand, the special geography aggravates the centralization of the population density and land use which should endure much higher pressure than that is in plain cities. In these years, the real state developers lick their chops in this potential great Chinese western market, which induces the skyscrapers going near to be found everywhere. Take the buildings in Yuzhong peninsula, one of the urban district in Chongqing, as an example, the number of high-rise residential dwellings is more than 400 in 2004. Although they are convenient and traffic handy, it is on the cost of nice ventilation, healthy atmosphere and benign daylight.
The process of urbanization can increase local temperatures in comparison to less built-up suburban rural areas, creating an urban heat island [1]. Urban heat island increases the risk of climatic and biophysical hazards in urban environments. The urban heat island refers to an increase in urban air temperature as compared to surrounding suburban and rural temperatures [2]. The maximum difference in temperature between a large city and the surrounding rural area can be as much as 12°C on calm, clear nights when the urban heat island effect is most pronounced [3]. The higher temperature was founded at the places near the air conditioners and the heat was accumulated under the urban canopy [4]. Urbanization has primarily affected thermal characteristics of ground surface such as solar reflectivity (albedo), thermal evaporation and surface roughness. The concrete and asphalt absorb and store more incoming solar radiation than natural surfaces does. Moreover, the increasing anthropogenic heat emission from air conditionings not only from public buildings but residential buildings in urban areas caused cities to maintain higher temperatures than their surrounding countryside, the phenomenon of which is also called “urban heat island effect”. That is to say, the outdoor thermal environment is becoming a serious problem with the rapid development of urbanization and economy in Chongqing. Many studies on outdoor thermal environment have been carried out in these years. Significant outdoor air temperature increases accompanying urbanization have become a very serious problem in the south of China [5]. The area of Shanghai has extended 7-8times and the intensity of heat island observed has reached 6°C [6]. Considerable studies have been carried out on indoor thermal comfort [7,8], but thermal comfort in outdoor setting is still a topic that has received little research attention up to date [9]. The intensity of the UHI (ΔT) is reflected by the temperature differences between urban and rural sites and depends on the size, population and industrial development of a city, topography, physical layout, regional climate and meteorological conditions [10]. Mega-cities around the world have observed a rise in temperature [11] due to a number of factors, namely, modification of urban surfaces, release of anthropogenic heat to the environment, formation of urban canyons, and loss of vegetation. Large differences between urban and rural temperatures are reported [12] in many cities with core city areas termed as “heat island”. In the last 100 years, the temperature of Tokyo is reported to have gone up by 2°C [13] on average. In 2005, the heat island was measured up to 2.5°C on average [14] in Chongqing. In a word, the urban outdoor thermal environment is challenging. Bornehag et al. [15] indicated that the primary reason for worsening of the indoor air quality in dwellings in developed countries is the bad ventilation because of the high price of energy. Ventilation has also been proved as one of the important aspect to keep a comfort IAQ when discussing the allergic symptoms [16].
2. CFD Introduction
Computational Fluid Dynamics, CFD for short is the subject growing up with the fast development of computer technique and numerical calculation in 1960s and it is one of the mathematical softwares to emulate and simulate the actual fluid-flow process with the virtual experiments in computer. The common software of CFD includes PHOENICS, FLUENT, STAR-CD and CFX, in which PHOENICS is the commercial software aiming at combining computational fluid dynamics with heat transfer and is pervasive in the simulation of fluid-flow. The simulation technique of CFD can be divided into there categories: Direct Numerical Simulation, large Eddy Simulation Reynolds Averaged Navier-Stokes [21]. The primary principles for CFD is to find out solutions of the liquid flow differential equations and get the discrete distribution in continuum of the flow field, and then, to simulate approximately the fluid-flow state. That is, CFD means the combination of fluid mechanics, calorifics (thermodynamics and heat transmission), and numerical analysis and computer science (mainly for the computer language such as FORTRAN and some of the graph techniques in the postprocessor). Because of its powerful functions in the simulation of complex flow phenomenon, human-to-computer interface and vivid and clear display of flow field, CFD becomes popular in use.
2.1 PHOENICS Introduction [19]
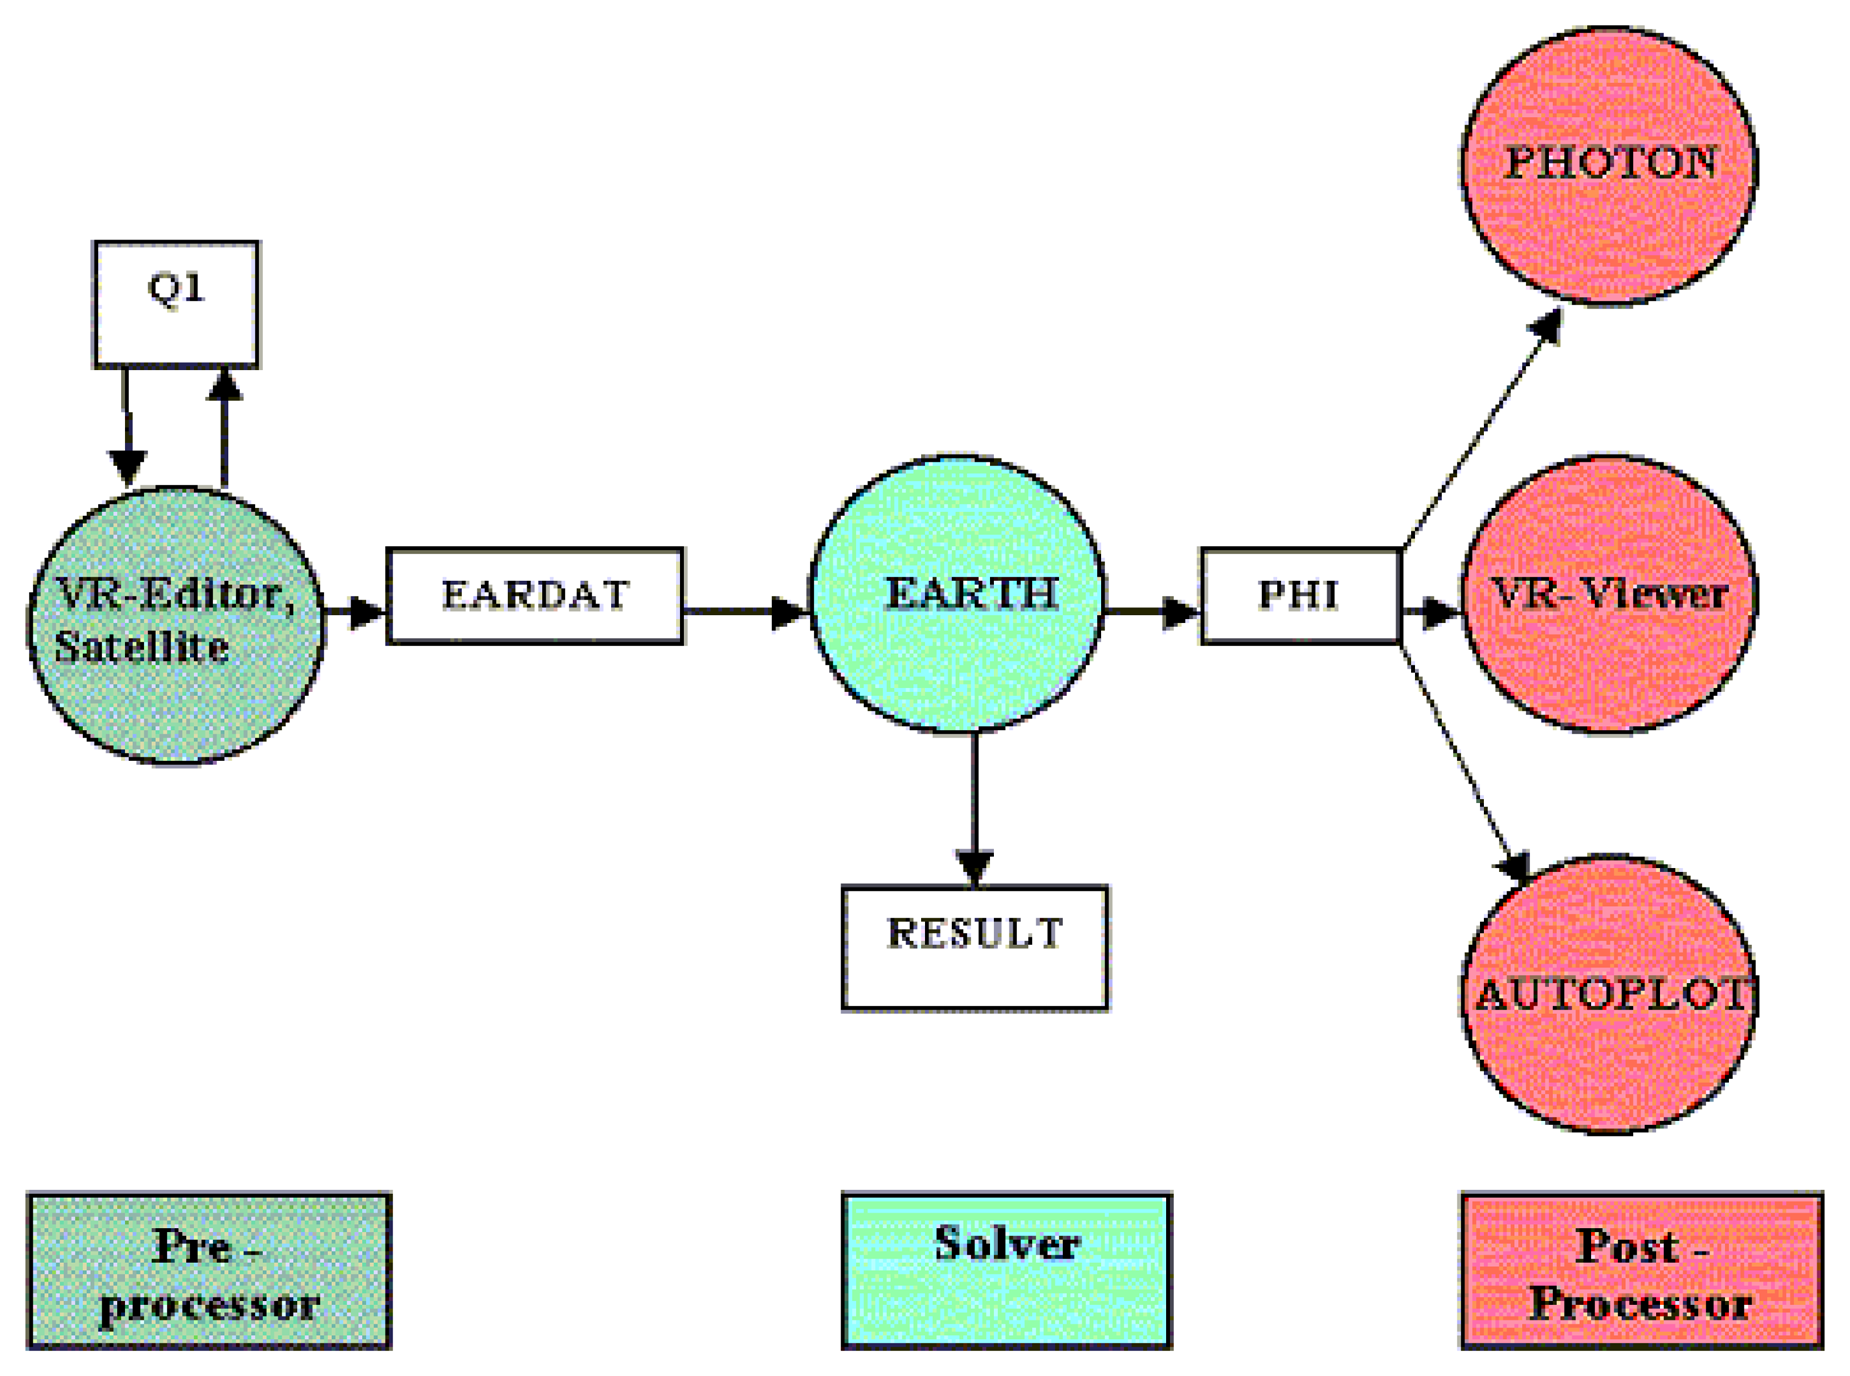
In this paper, the software named as Parabolic, Hyperbolic or Elliptic Numerical Integration Code Series, PHOENICS for short, which is developed by CHAM Graduate School in Imperial College of Science, Technology and Medicine, University of London is adopted. It is a useful and efficient tool in the simulation of fluid-flow, heat transfer, chemical reaction and other relative phenomenon and it has a prevalent application in the areas of aerospace, automotives, HVAC, energy engineering and chemical industry and so on. The main structure of PHOENICS is composed of preprocessor, solver and postprocessor, which gives a detailed composition in Figure 1. The VR-Editor is the preprocessor the paper selected to simulate which can generate the documents with suffix of Q1 and EARDAT, identify and lead-in Q1as well. The complex models can be made up by CAD and then saved as STL document and lead-into the PHOENICS; finally it can be formed as the DAT documents which can be identified by PHOENICS. EARTH functions as the solver, which lead-in the EARDAT document generated by VR-Editor and creates the documents with suffix of RES and PHI. VR-Viewer are selected as the postprocessor which lead-in PHI documents and shows the viewresluts and cartoon display for the computed parameters such as temperature field, velocity field and concentration field.
2.2 PHOENICS Mathematical Model Basement
2.2.1 Fluid-flow Control Equation [18]
The general form of the fluid-flow control equation is:
Where, ρ -fluid density; Γ -coefficient of diffusion; S-Source item; U-velocity complexor.
Γ and S have their special forms with different Φ. The general form of the differential equation can also be described in the form of tensor form in Cartesian coordinate, which is:
Equation 2.3 contains items of variance ratio, convection, diffuse and sources. When Φ represents different physical quantity and Γ and S make some diversification, we can get continuity equation, momentum equation, consistency transferring equation and temperature transferring equation.
2.2.2 κ – ε Turbulent Model
There are 21 kinds of different turbulent models installed in PHOENICS which in order to adjust to different types' Reynolds analogy parameter. Turbulent models include Reynolds stress model, multi-flow turbulent model, flux model and variation of κ – ε model. Besides, the LVEL model and MF model are unique in PHOENICS compared to other fluid simulation softwares. Models which always used in the simulation of outdoor thermal environment are introduced under following:
- 1)
- RNG κ – ε turbulent modelThe way of RNG are suitable to large scale, and influences of the small scale are described through improving the transferring coefficient. The RNG κ – ε model made a great progress with the disadvantage of overhigh value of vortex viscosity in the primary κ – ε. Furthermore, this RNG model can give an accurate simulation to dissociation and associative fluid-flow. However, it can not give a correct result with jet stream fluid and feather fluid. The RNG κ – ε model amends some of the constant values, and one item is added to the ε model as equation 2-3.Where, Sε -source item; νi -turbulent viscosity coefficient; ε - viscous dissipation rate; κ -mass turbulent kinetic energy; η - Dimensionless number, ; , β=0.012, η0=4.38;
- 2)
- Chen-Kim κ – ε turbulent modelIt is the model amended by Chen and Kim in 1987 aiming at avoiding the disadvantages of sing-time-scale in primary κ – ε model. The dynamic effect of ε equation is improved through increasing an external time-scale item under following:Where, Sε -time scale item; C3e -empirical constant, C3e=0.25Chen-Kim κ – ε model not only keeps the merits of RNG κ – ε model but also have nice results happening to jet stream fluid and feather fluid.
- 3)
- LVEL turbulent modelLVEL is the unique model in PHOENICS and it belongs to zero equation models. It adopts Spalding wall law to compute νi and is the same with a number of solid blocks arranged in room, three-dimensional questions as well. This LVEL model is suitable to the low Reynolds.
3. Methodologies
This paper takes a weekly field measurement in a multifunctional high-rise building as well as wind speed and temperature field simulation for the same building. The high-rise building is with the building area of 70,032m2 and height of 99.1m. And the method of comparative analysis is used to make a substantially correct outdoor thermal environmental result. After comparison of the simulated and measured results, the influence of the high-rise building to the outdoor thermal environment can be substantially obtained. Then, natural ventilation as one of the best way to improve the outdoor wind environment is adopted. Different architectural compositions and different building styles are proposed and their wind fields are simulated as well. Finally, suitable architectural models are got which are especially sustainable to the mountain city's development.
3.1. Field Measurement
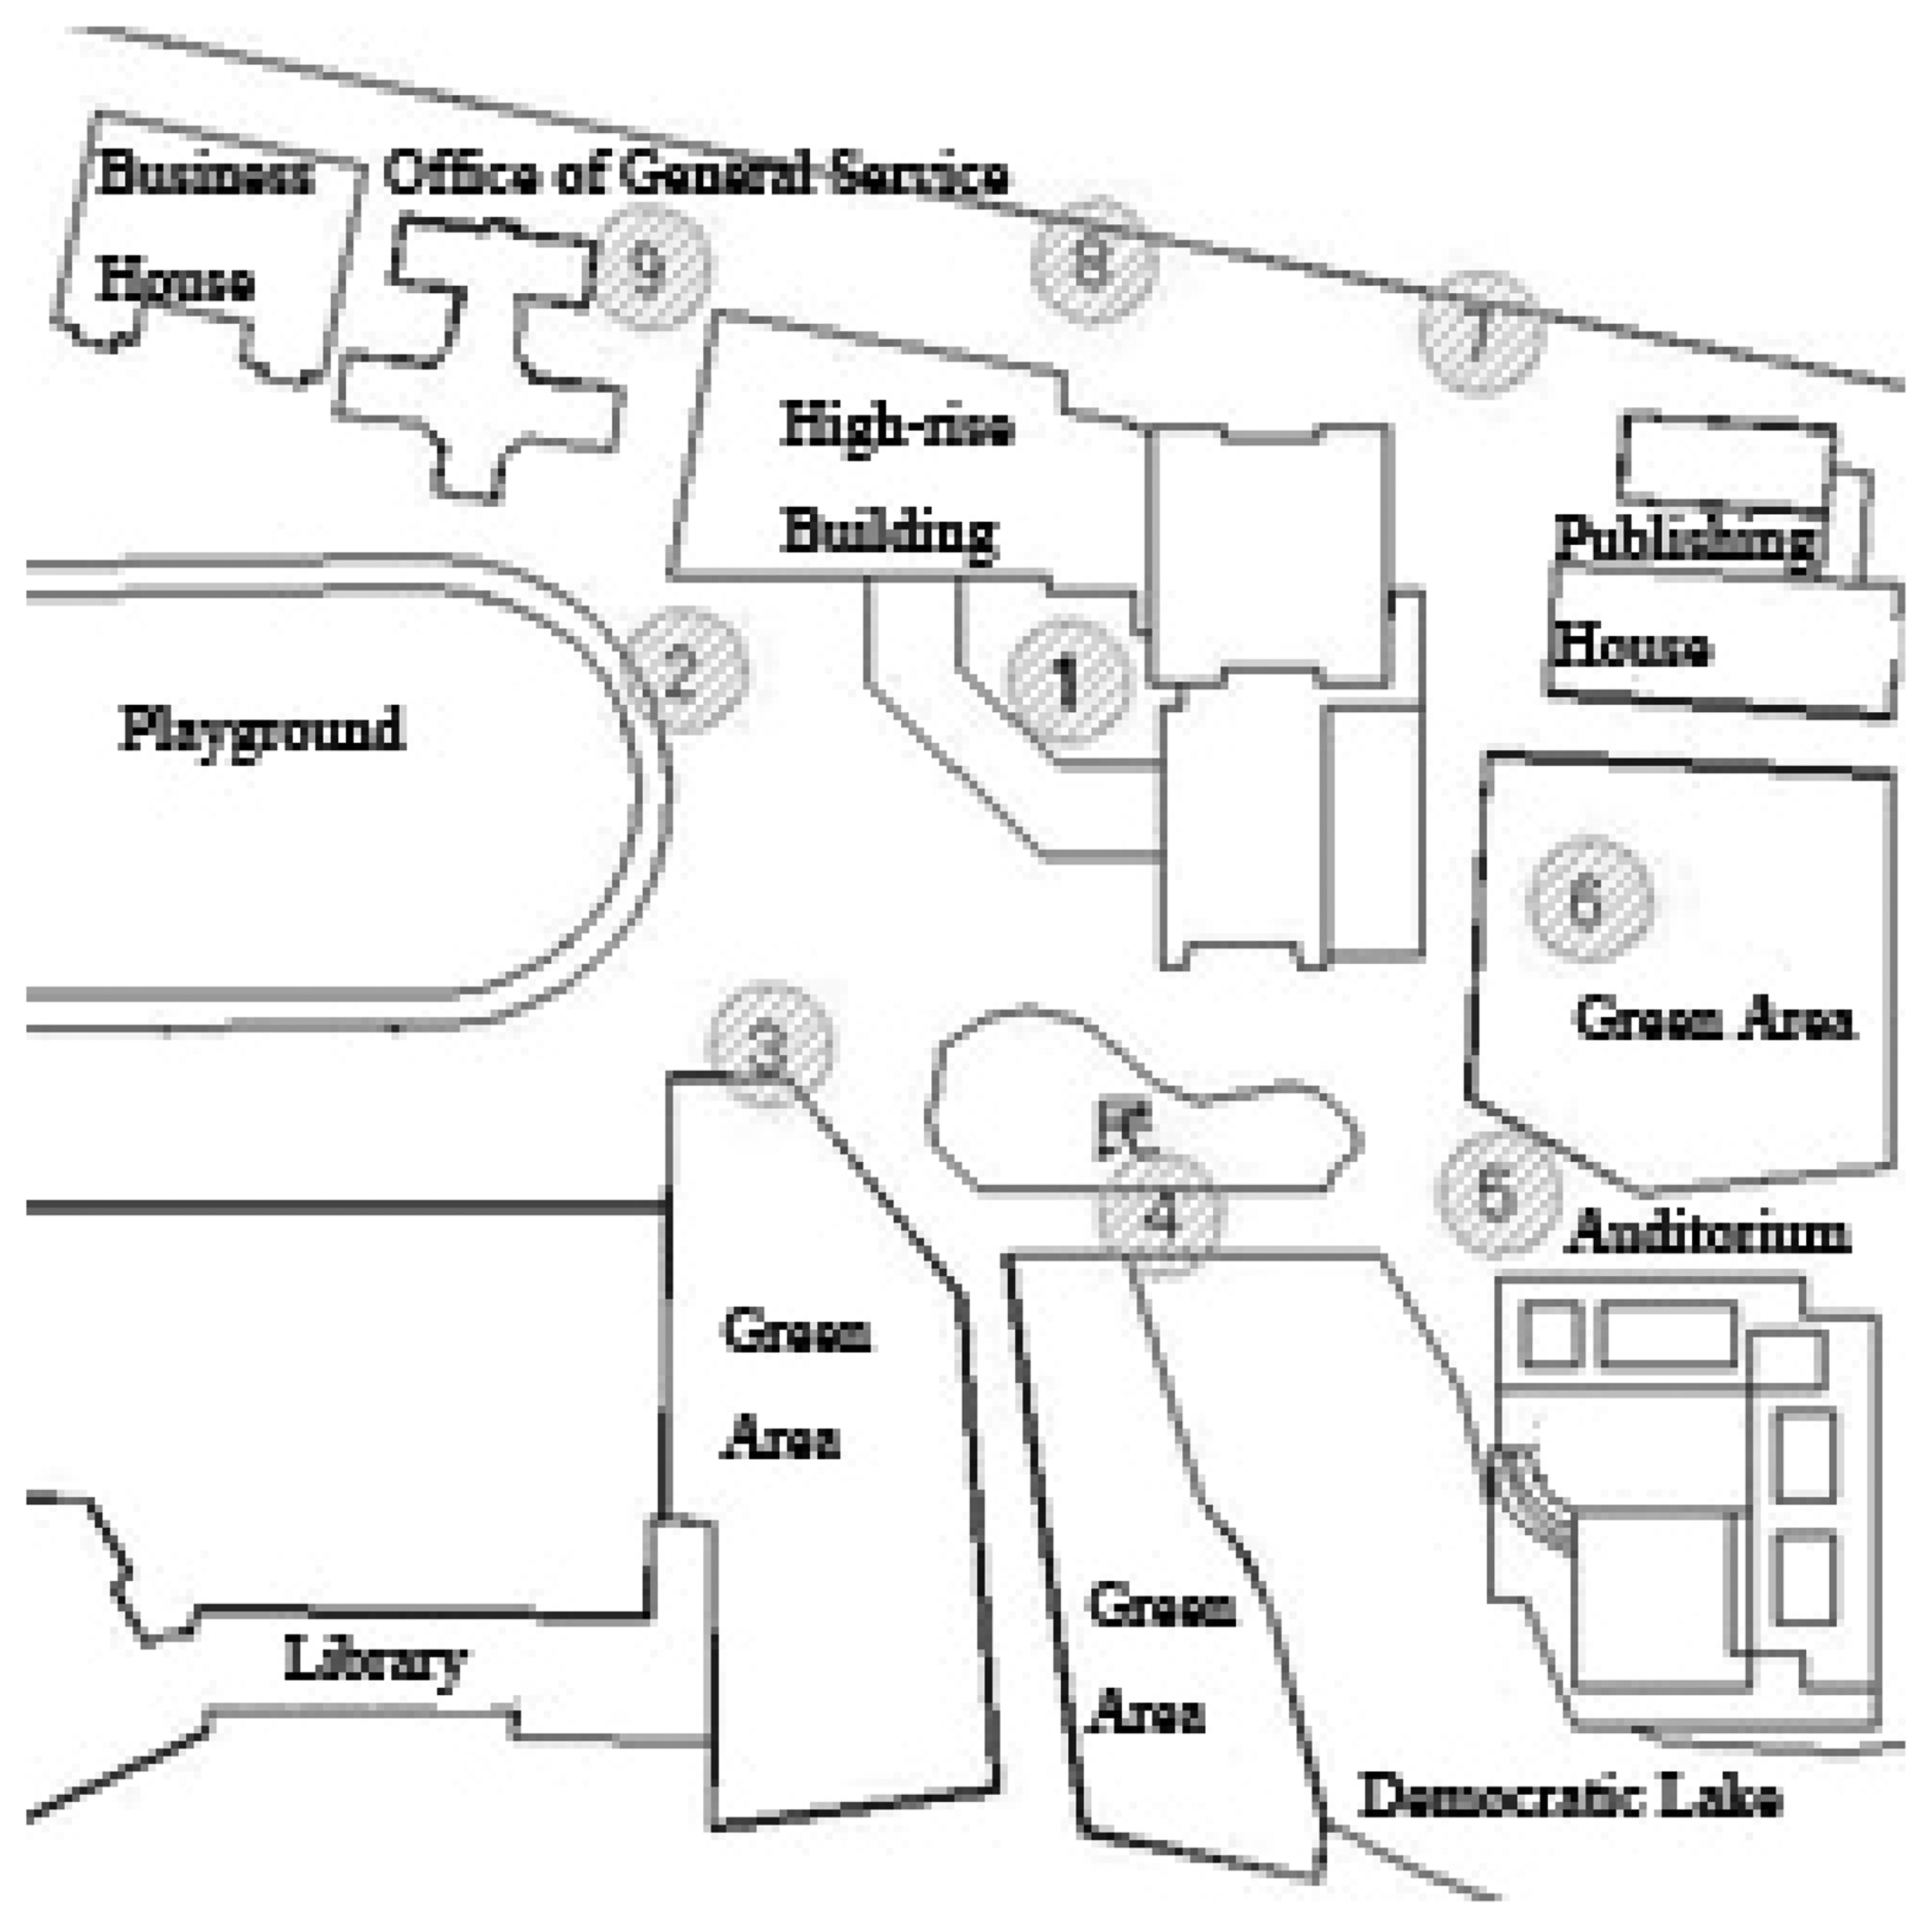
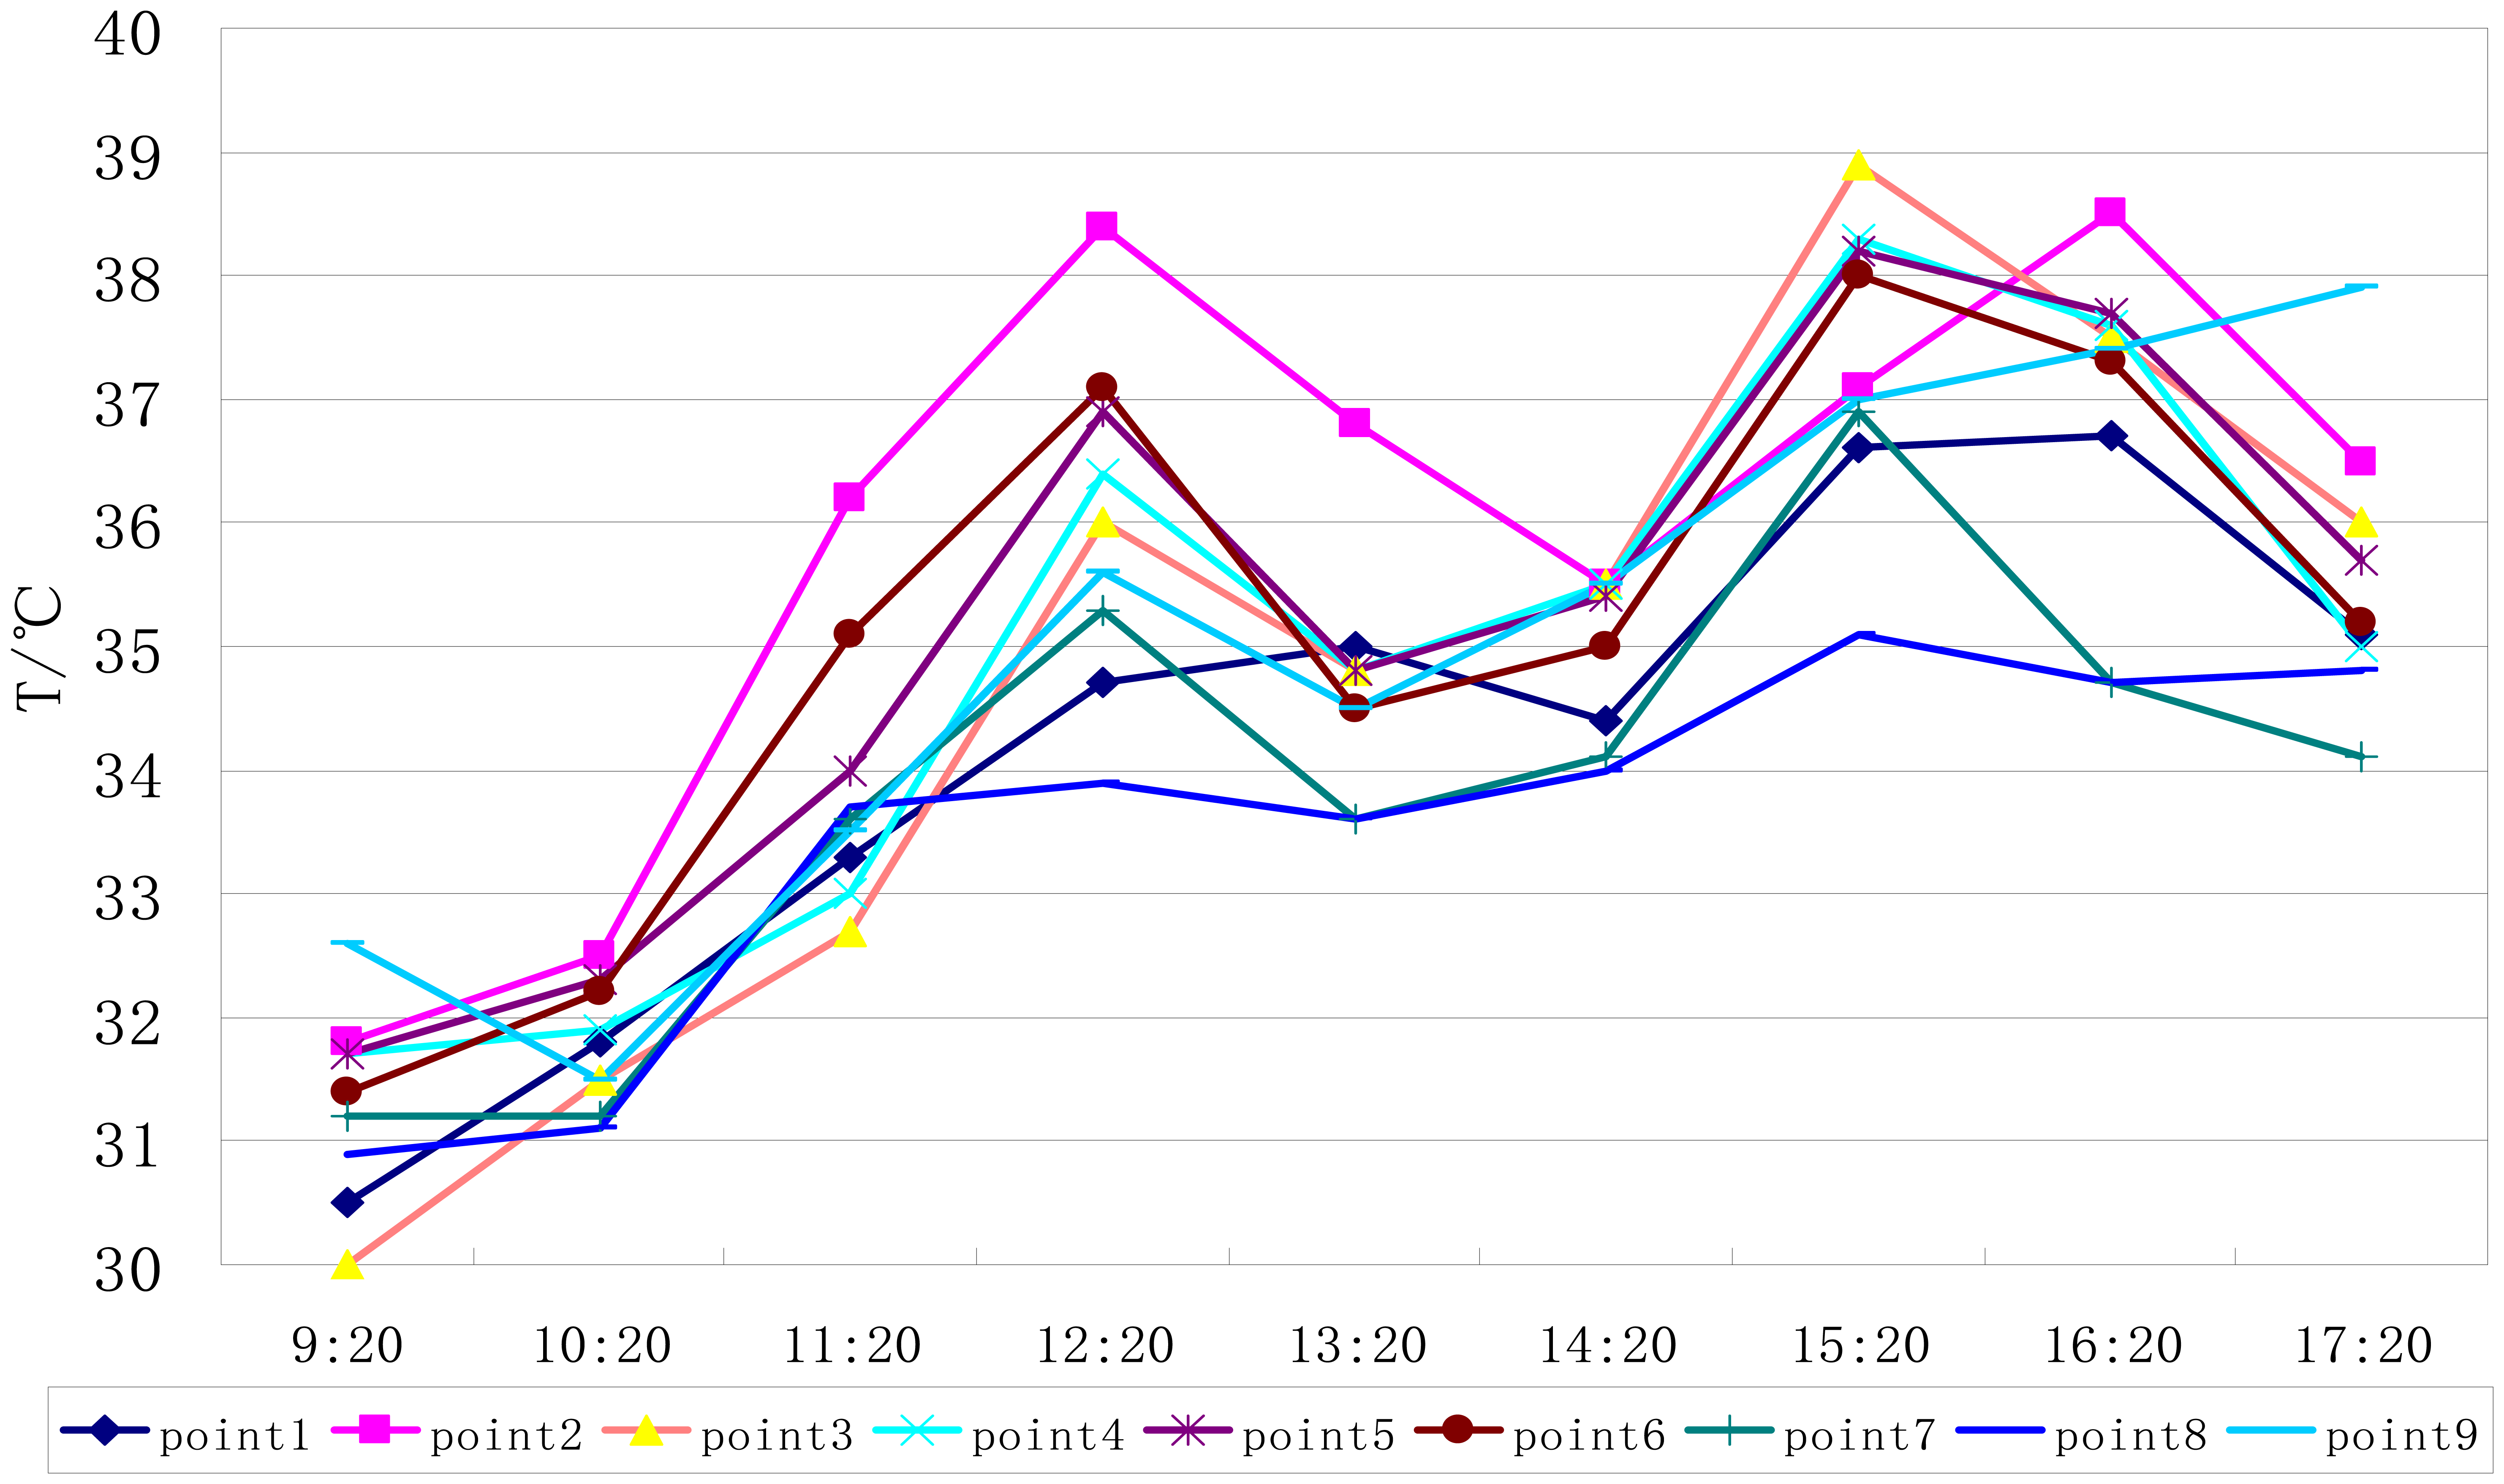
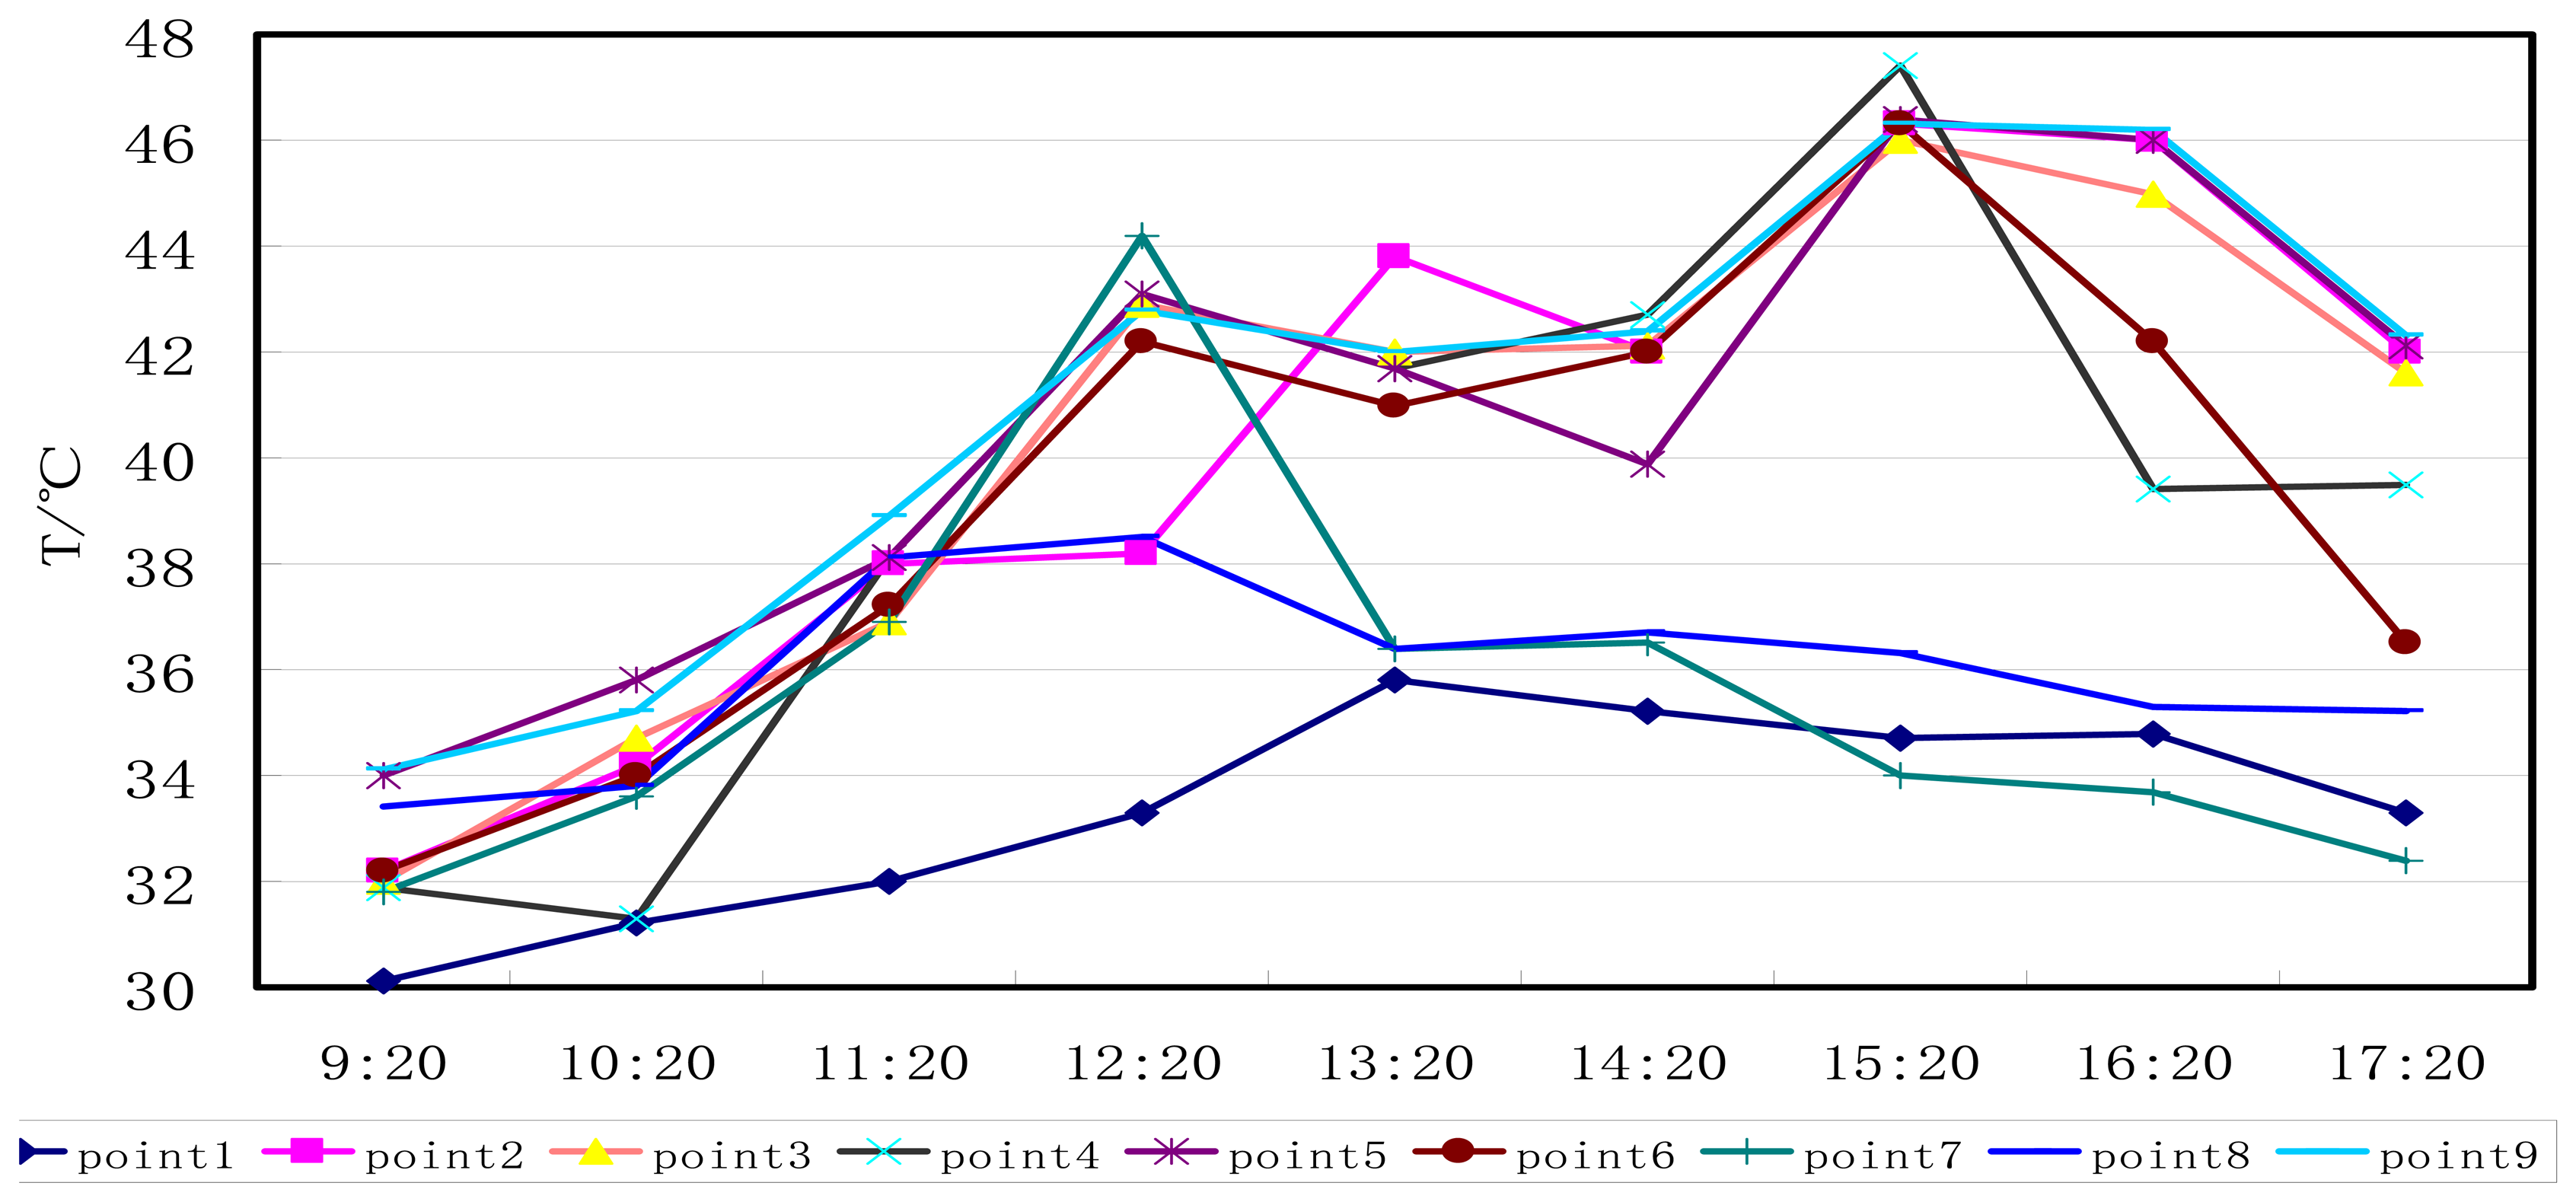
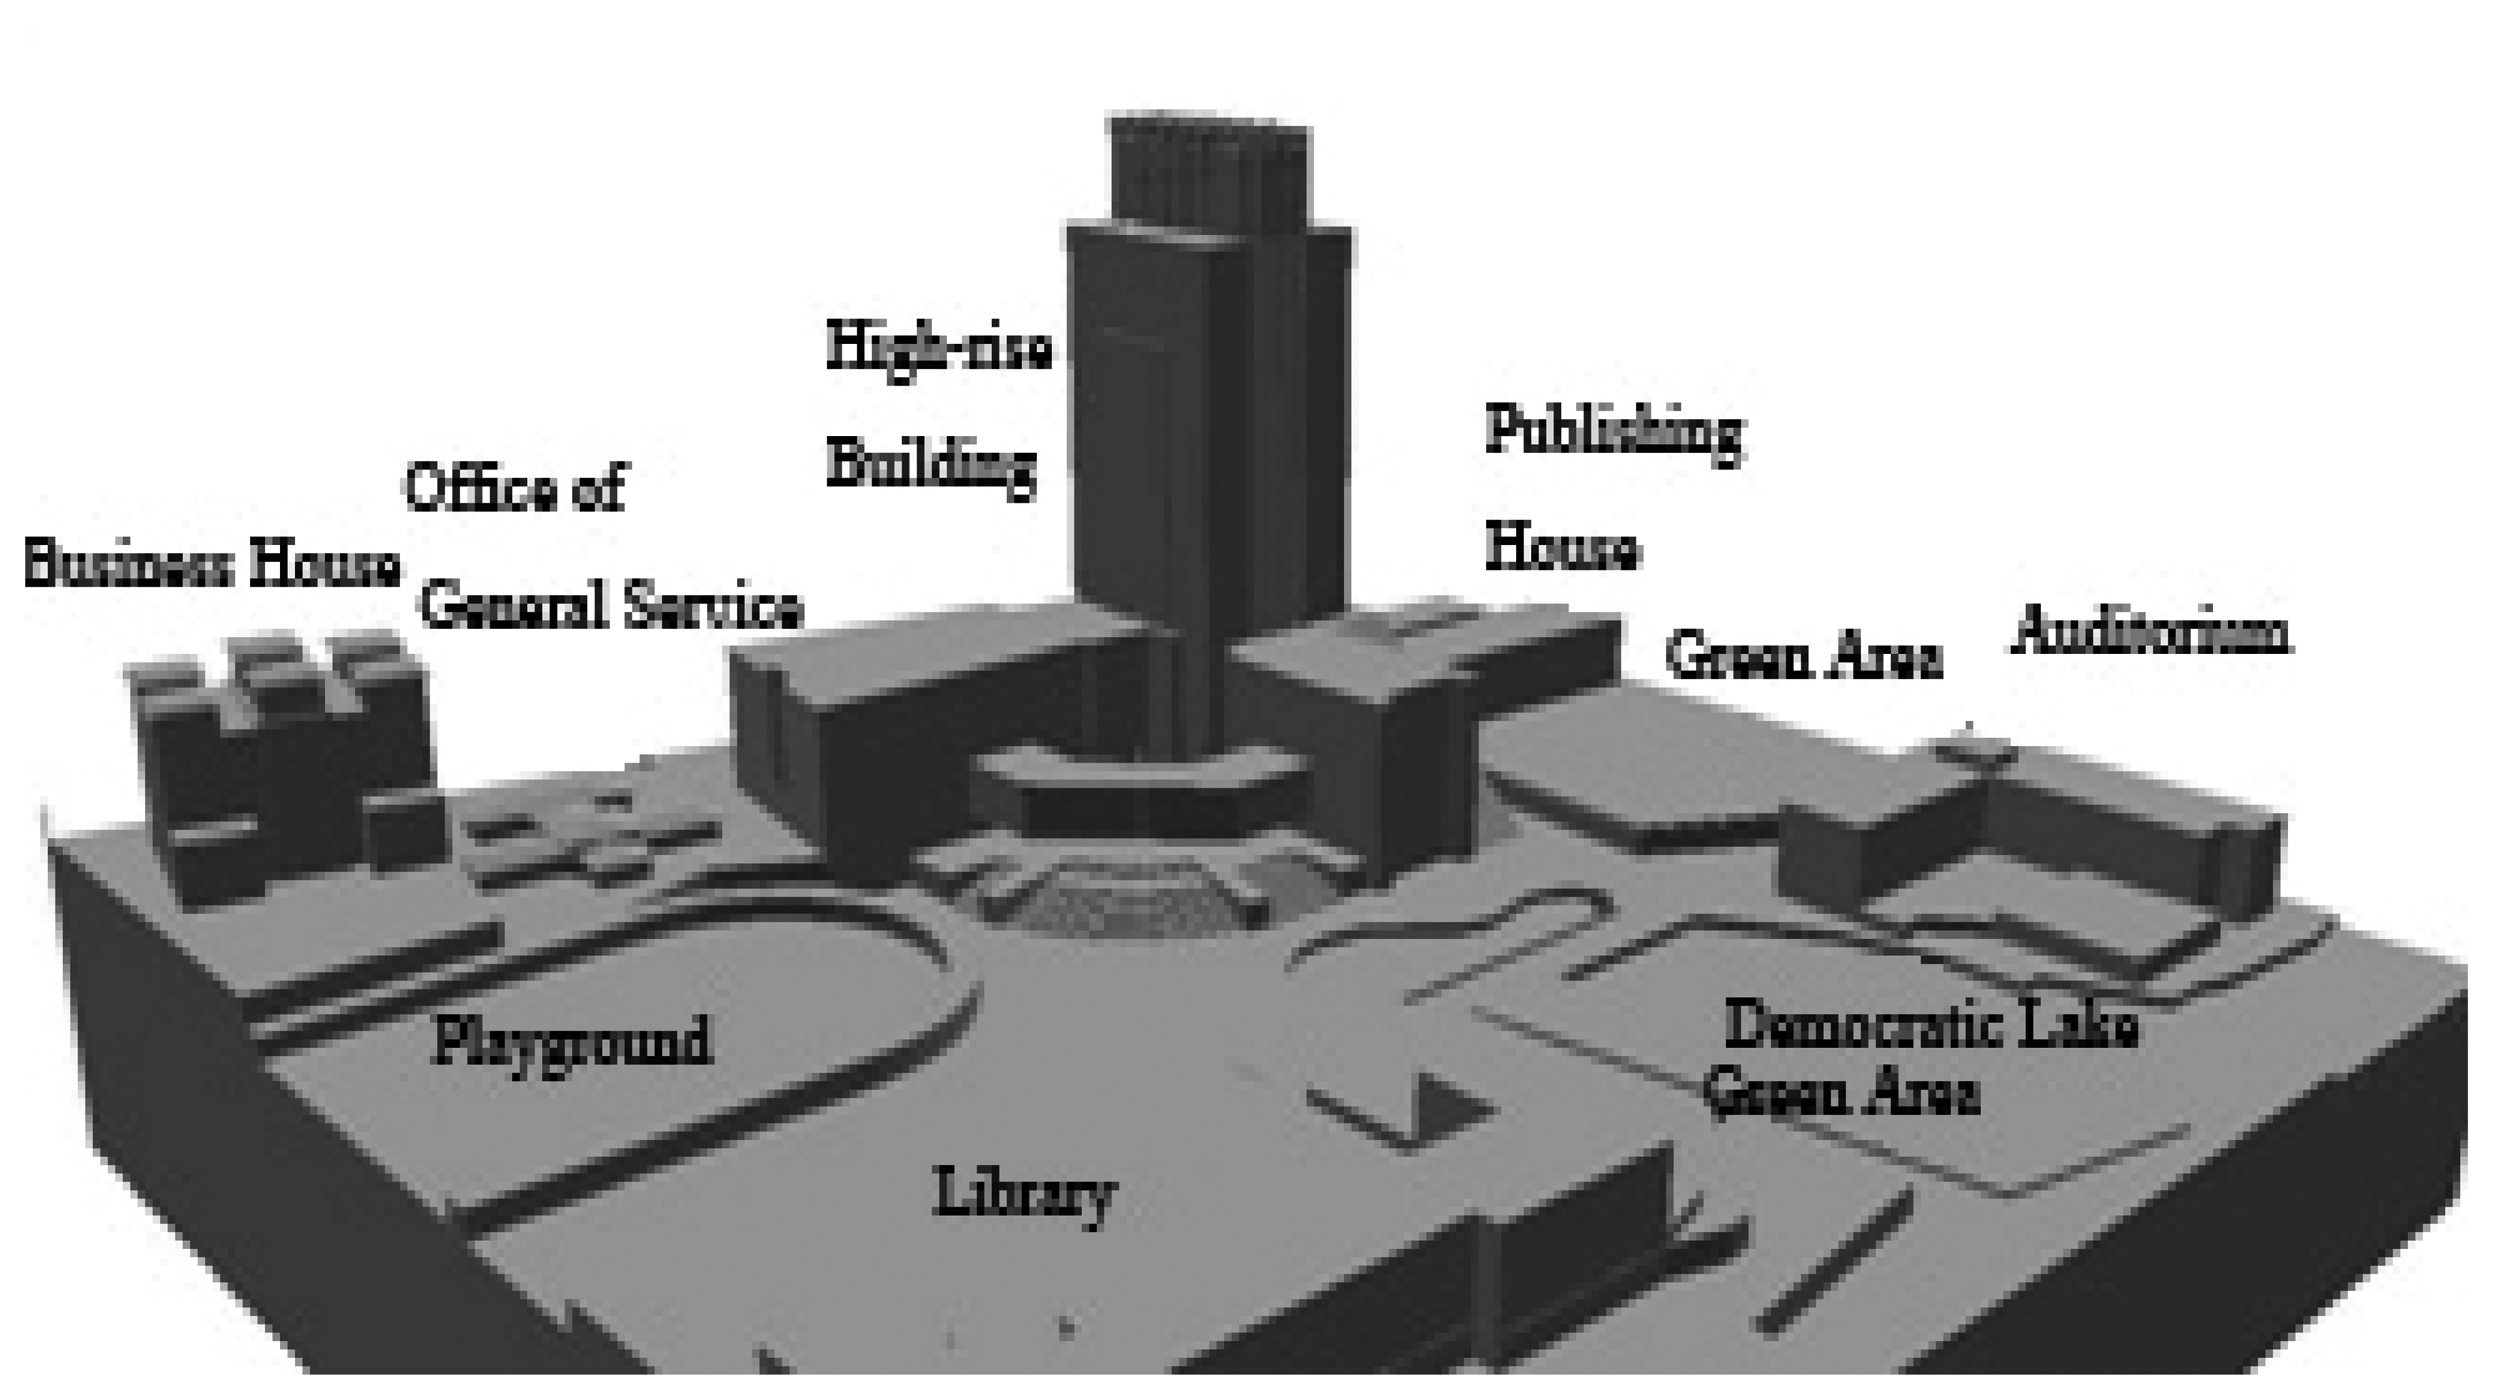
Current observation from 16th, June 2006 to 22nd, June 2006 is adopted to measure the latitude and longitude, altitude, atmospheric and surface temperature, wind speed and direction of each measuring point which is in and around the multifunctional high-rise building in Chongqing University. The measuring tools include electric humidity measuring instruments, infrared radiation thermometer, electrical anemometer, dogvane, GPS instruments, hot type wind speed appearance and so on. 9 measuring points with the vertical height of 1.5m over the ground are posted in and around the building which is shown in Figure 2 and each measuring data are recorded at half an hour intervals. This paper selects the measuring data in 18th June, 2006 which is a little cloudy as the objects of study, because cloudy day are one of the typical weather in Chongqing. The atmospheric and surface temperature of each point is shown in Figure 3 and Figure 4.
From the average hourly temperature curve of each point, we can find out that the average daily atmospheric temperature is 34.6°C and its temperature difference of each point is not obvious, the maximum is 2.4°C. In contrast, the average daily ground surface temperature is 38.4°C, and the maximum temperature difference is up to 7.8°C. Besides, the wind speed of the 1st point which is inside the building hall and the 6th point which is in the east of the building is lower than 0.4m/s, and speed of the other points is low as well. The average wind speed for 9 points is about 1m/s, and the predominant wind direction is northwest and east. Furthermore, there is a natural air channel between the high-rise building and its surrounding publishing house where the speed can increase to more than 2 m/s.
3.2. Simulations and Analysis
This paper takes a detailed wind and temperature filed simulation for the high-rise building and its surroundings in summer as well. The model in Figure 5 is drawn according to the actual topography in the field measurement. The ratio of the simulation model shown to actual physical landform is 1:1 and the altitude at 200m is assumed as the base plane. The size of the simulation model is 300×300×200 m3 and the highest ground level is 265m, the lowest 240m. In order to quicken the computing velocity, the model has been predigested, that is, the material of ground uses concrete, and the green area uses earth and trees, the playground uses plastic and the lake uses water. Because the simulated region is a part of the whole city area, there must be other buildings and constructions, that is to say, the wind entering into the simulated region is not even. According to some references and data results, the leading wind direction is influenced by the friction of different kinds of underlaying surface. And when it enters into the simulated region, it should distribute under the rule of boundary layer, which is gradient wind. Thus, the wind speed input is gradient. The surface temperature adopts the average one in the field measurement. The detailed wind speed is computed on formula 3-1.
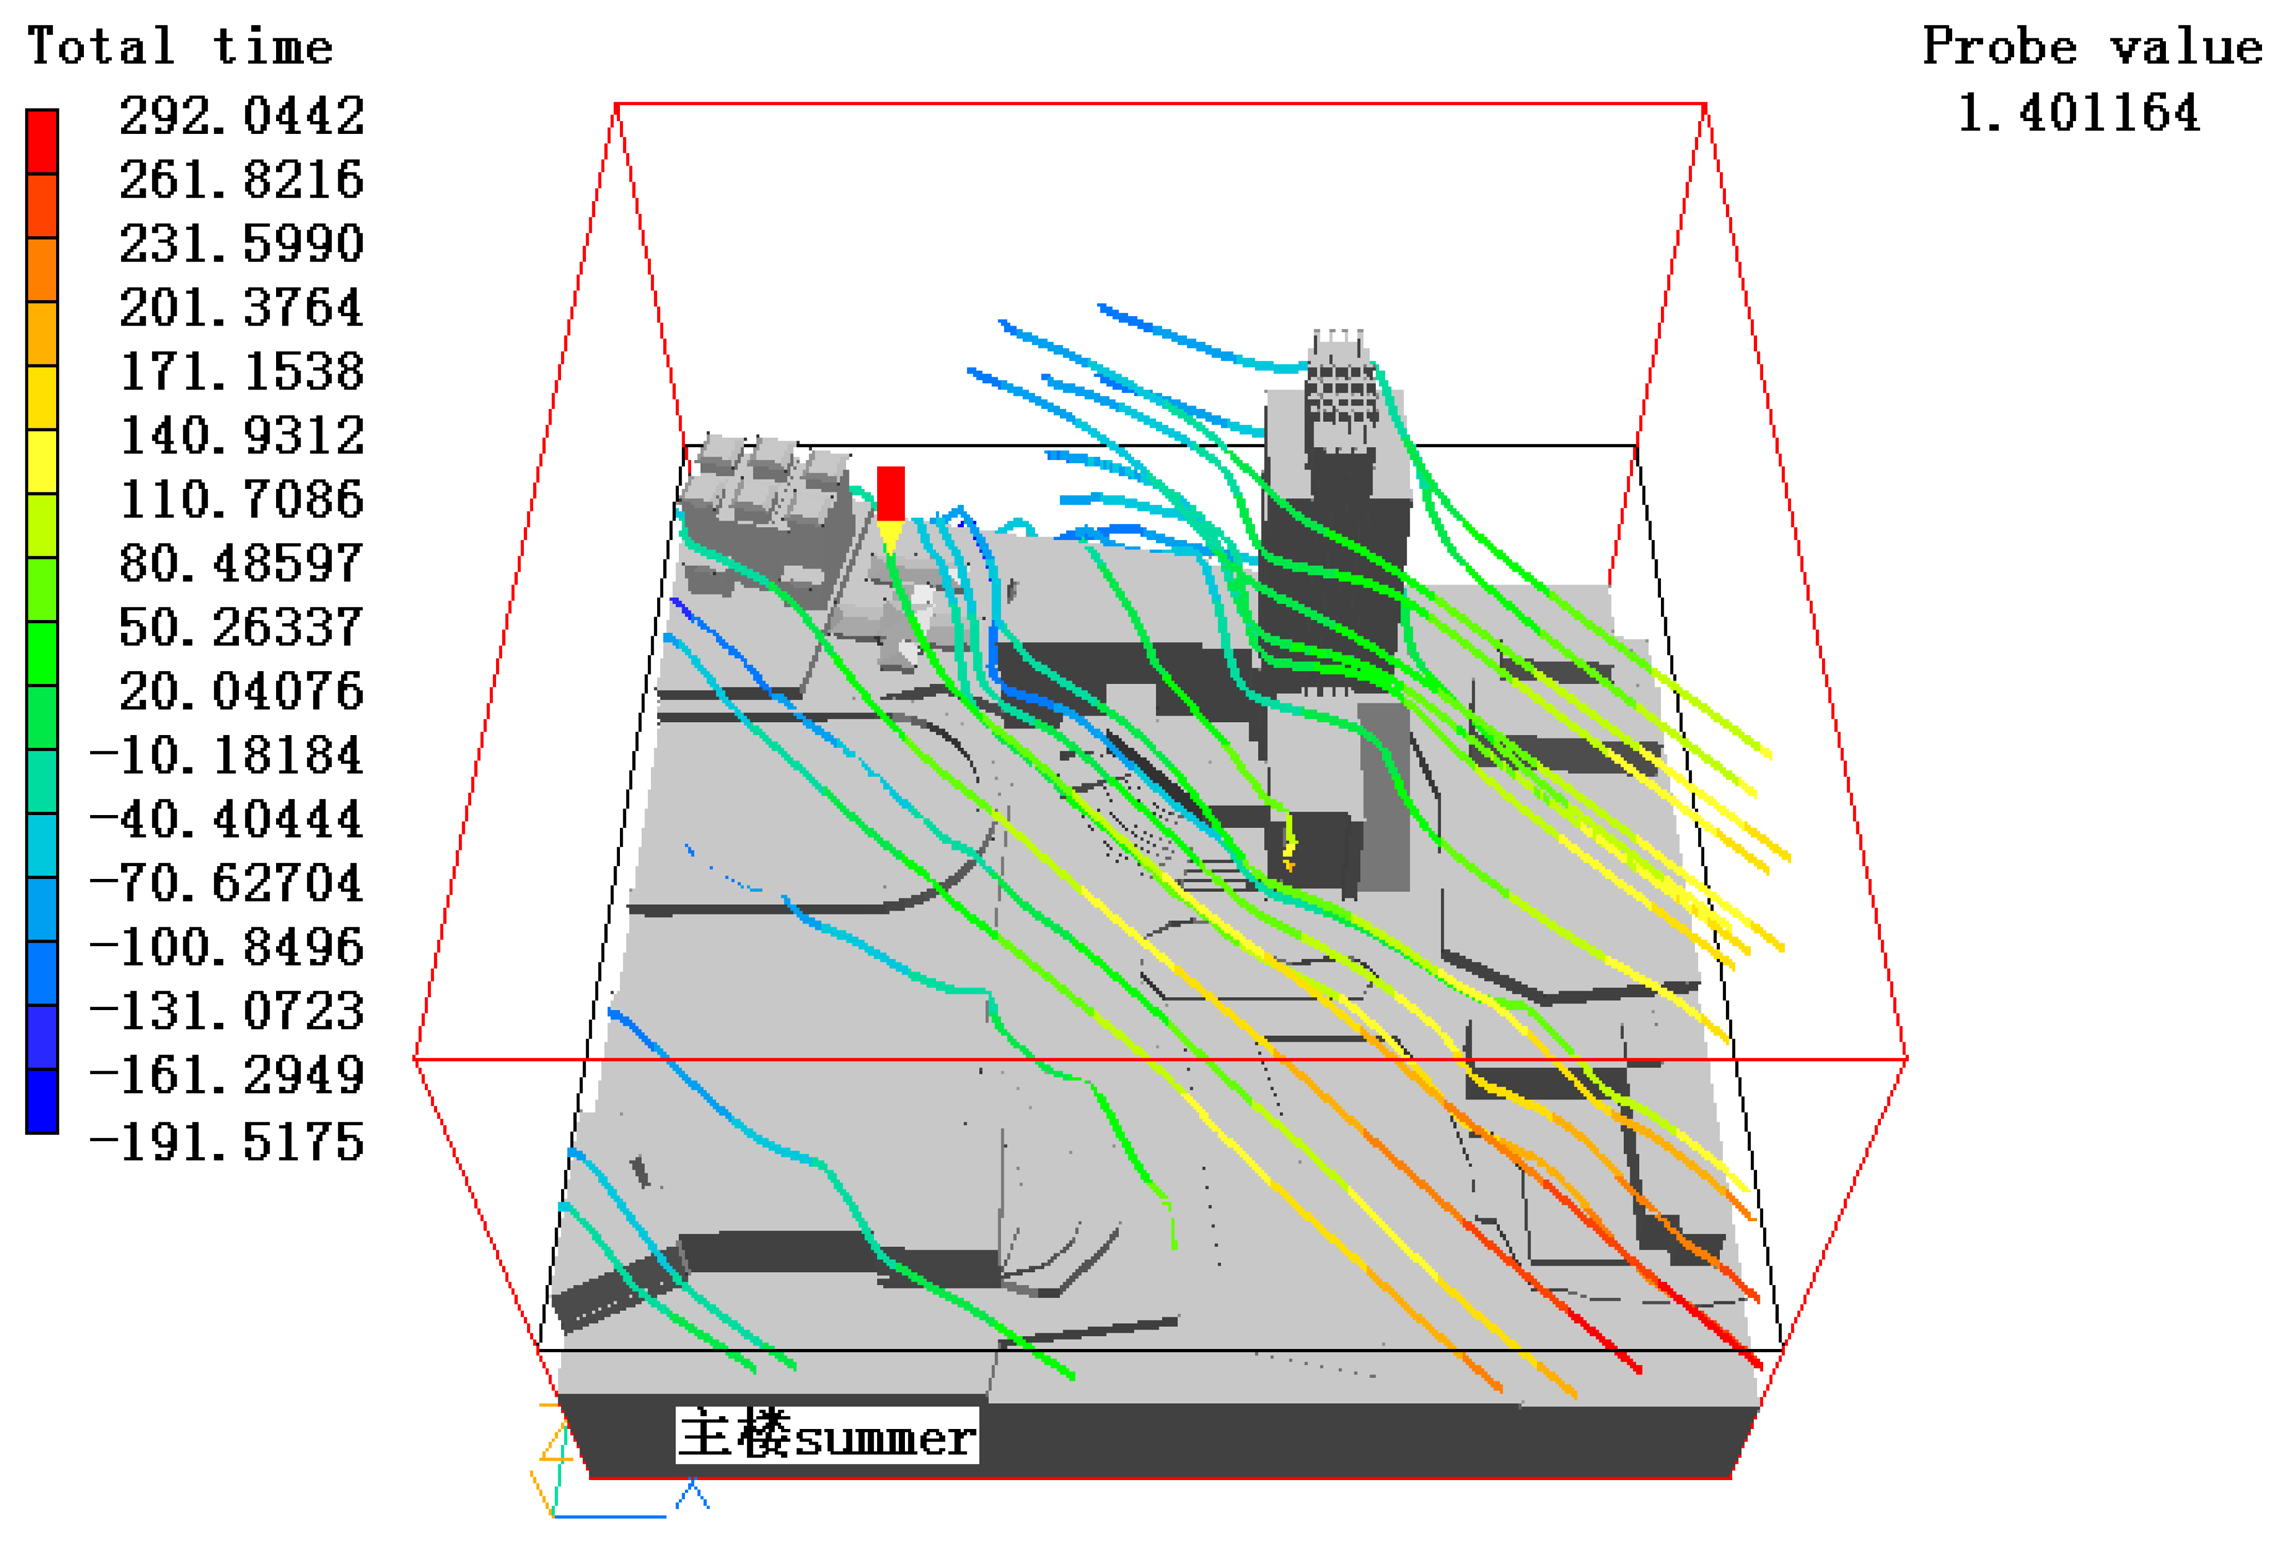
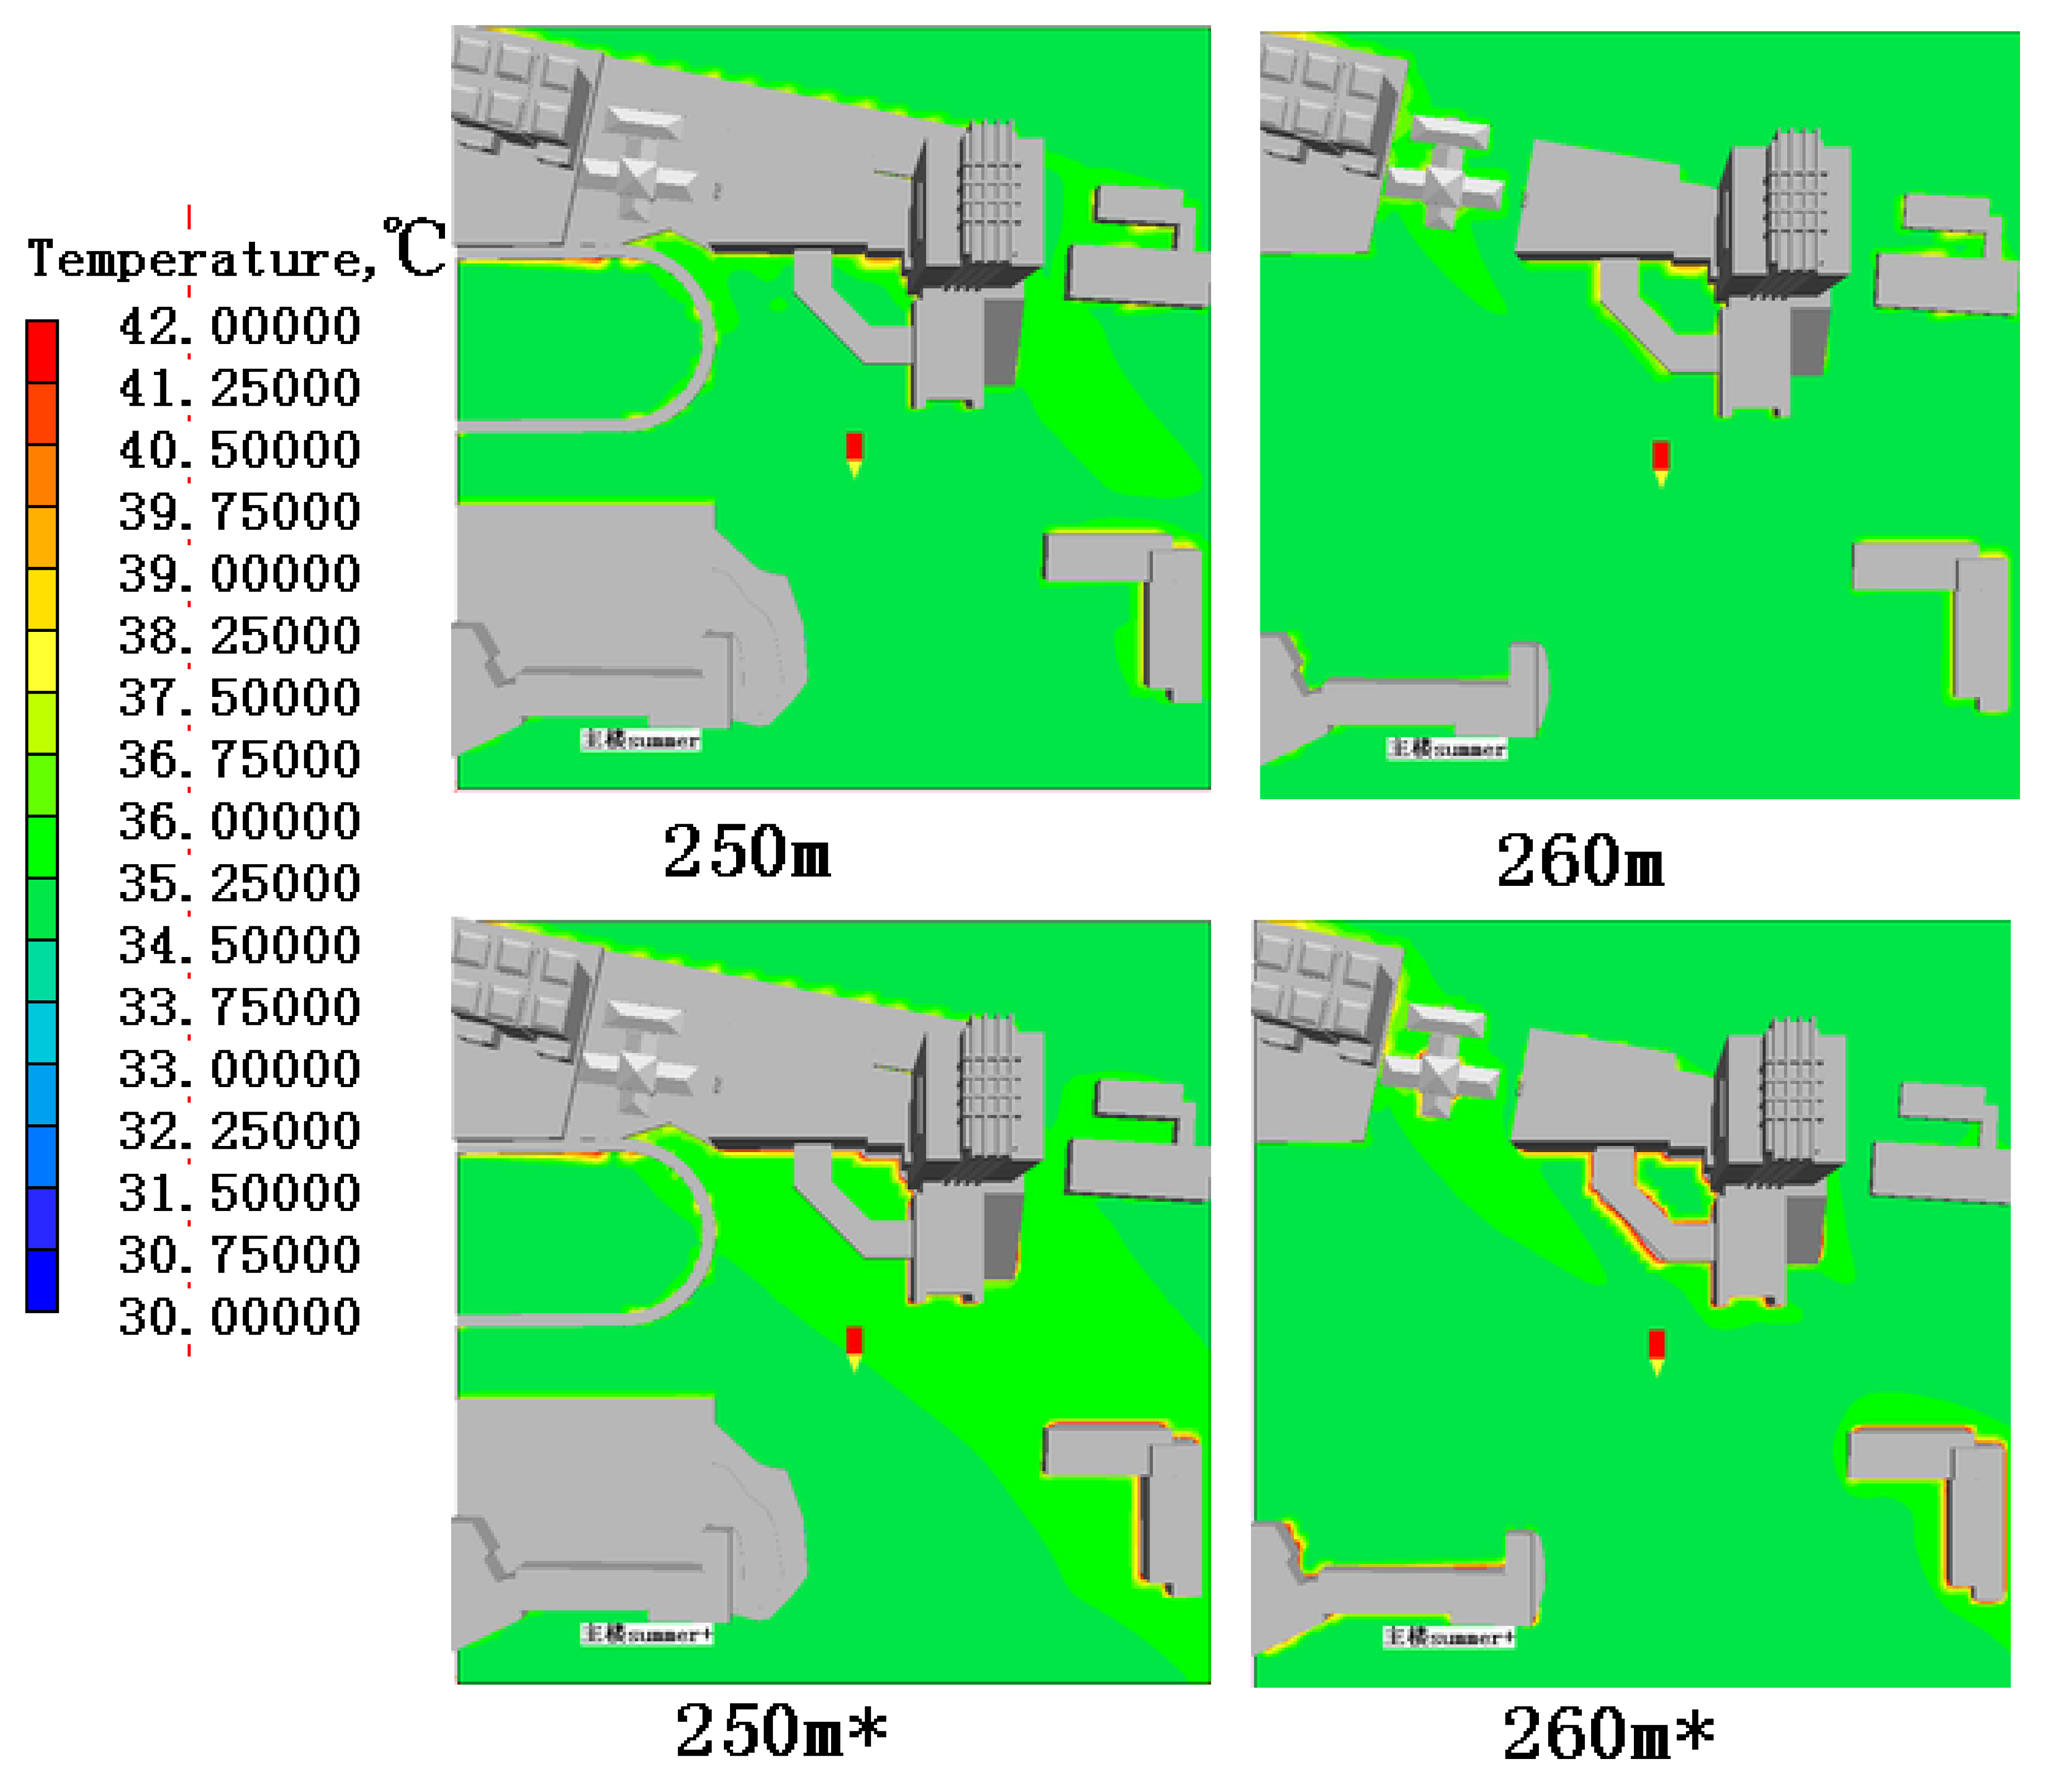
The leading wind direction is northwest and the wind speed at the reference level uses the measuring results, which is Ug=1.2m/s, Zg=1.5m. The temperature input of the entrance wind employs the measuring daily average one which is 34.6°C. The ground surface temperature is inputted according to different average surface temperature from different material of the underlying surface. In order to make sure of the influence of air-conditioning heat to the outdoor thermal environment, the simulation in summer are operated two times, one is without air-conditioning heat, and the other takes heat as one of the independent input parameters. After considering the air-conditioning burden, air-conditioning share and coincidence occupation coefficient systematically, the heat productivity is computed 20w/m3. The simulated results shown in Figure 6, 7 and Figure 8 are values at the height of 250m to 260m, and the results with “*” is the ones with air-conditioning heat.
From Figure 6, we can find out that the outdoor wind field is in substantial agreement. The wind speed in most part of the region is about 1.2m/s, and it is low inside the building and leeward side, however, it turns large near the edges and corners. With the countercheck of the high-rise building, the wind speed is much lower in the building's leeward side compared to that is of low-rise buildings. From Figure 7 and 8, we can see that air-conditioning heat has a great influence to the temperature field. When there is no air-conditioning heat, the temperature difference of each position is small and the average atmospheric temperature of the entire region is about 34.5°C. In contrast, simulated results with the air-conditioning heat shows that the atmospheric temperature of the surroundings has a certain raise, especially at the places along with the predominant wind direction, that is to say, temperature in regions in the southeast of the building increases about 1°C compared to the other areas.
3.3. Validations of the consistency between field measurement and simulation
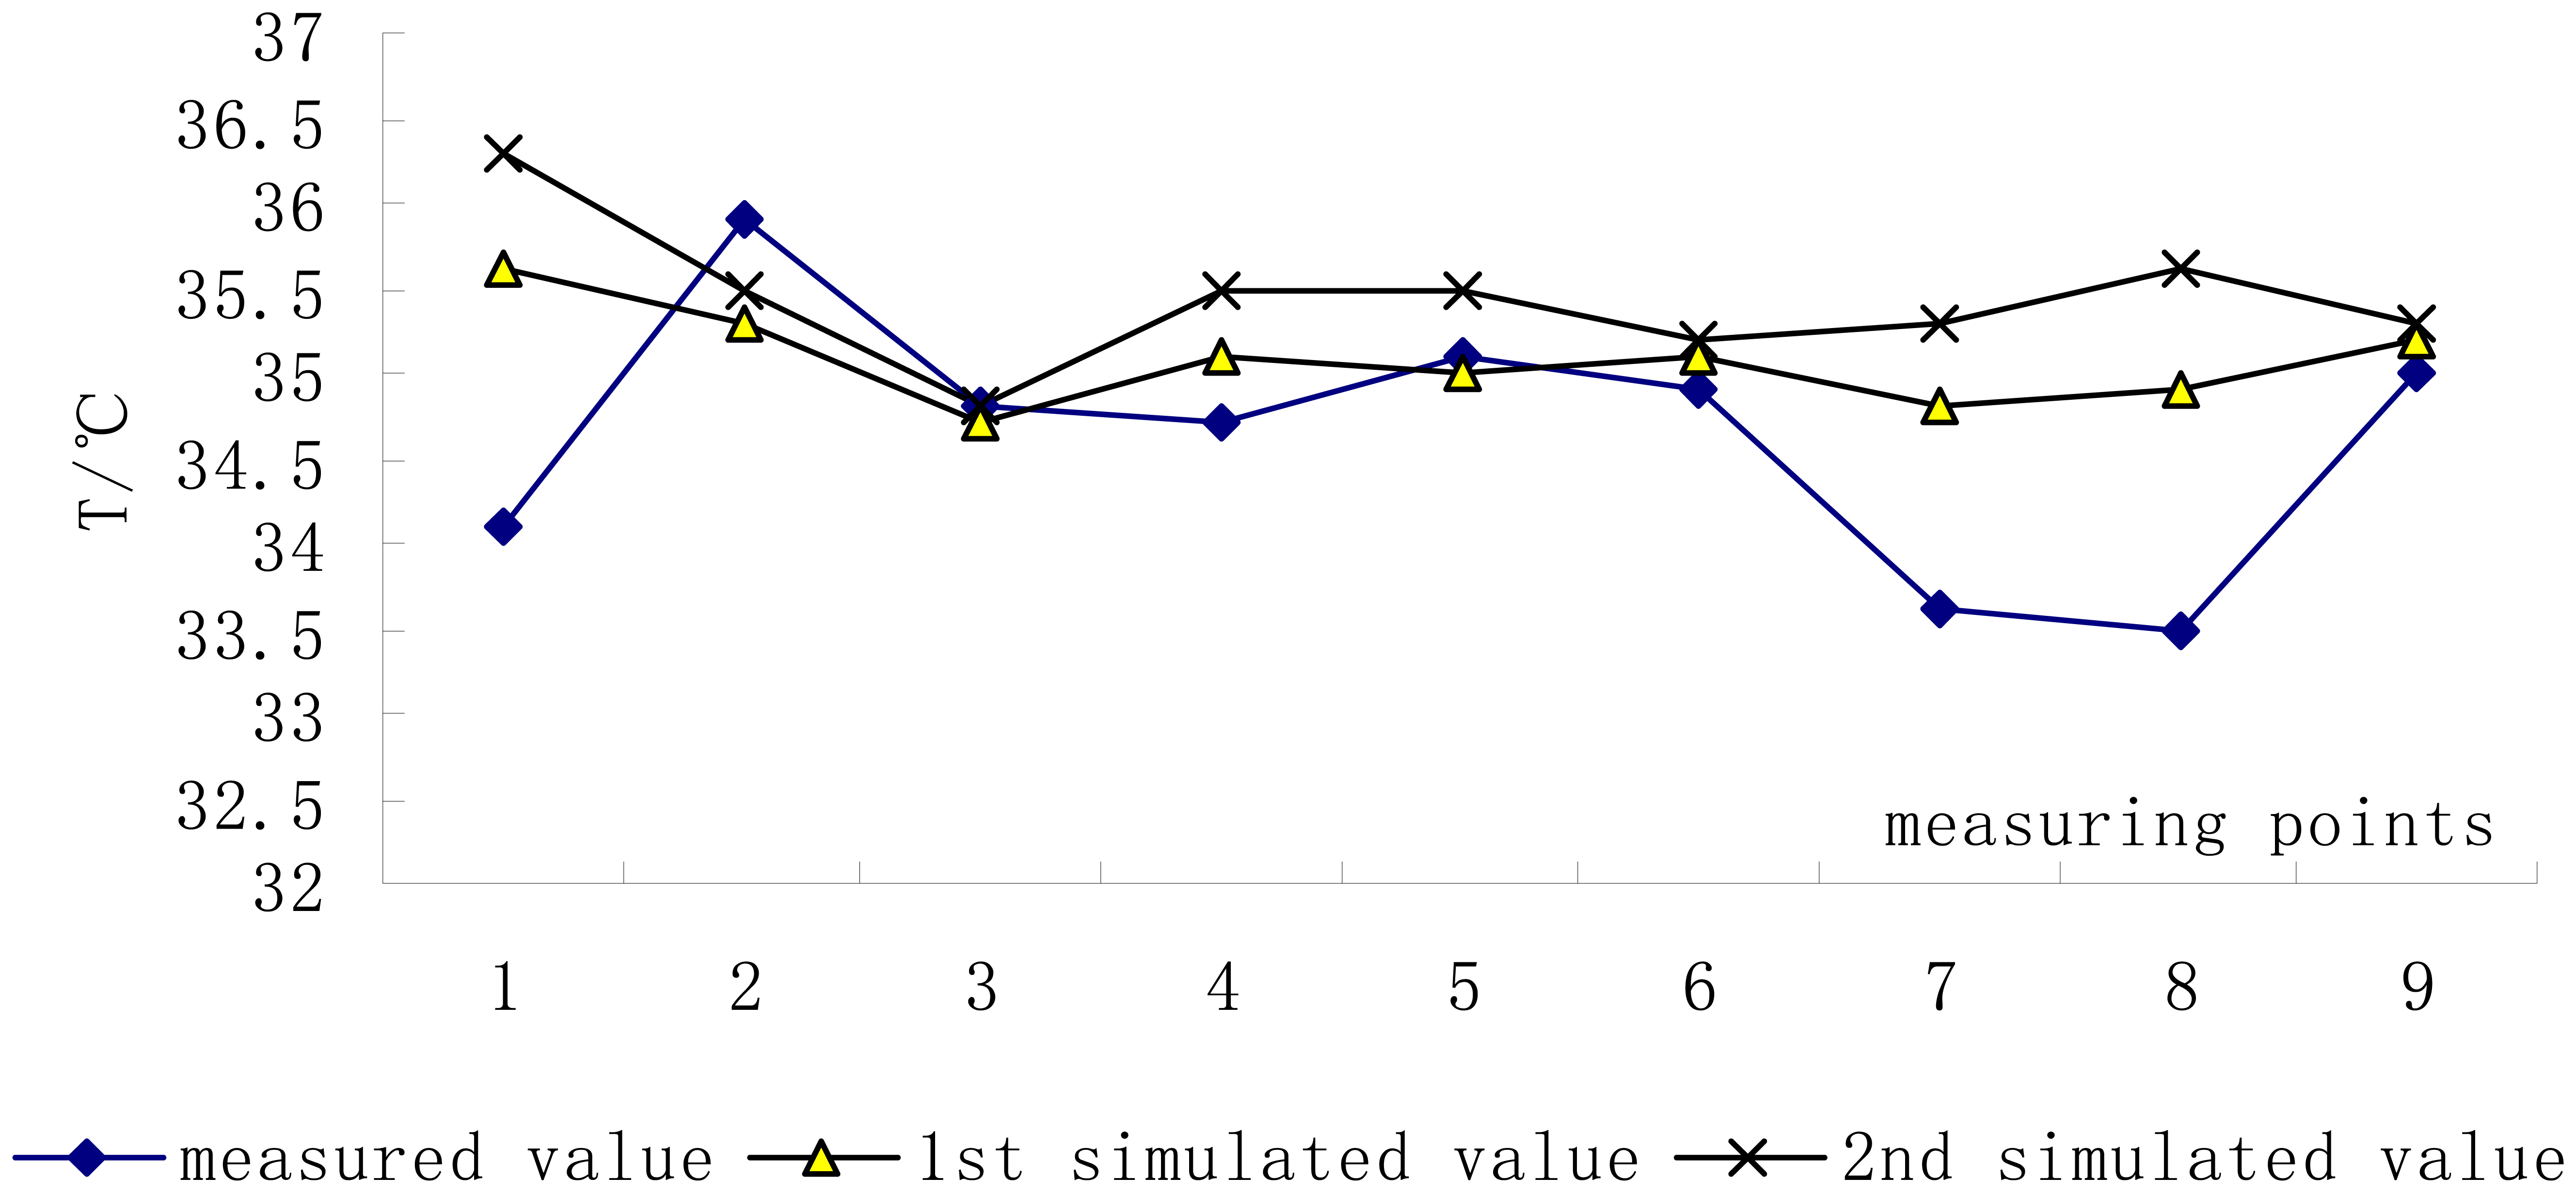
The comparison results between simulated value and measuring value of the temperature and wind speed are shown in Figure 9 and Figure 10. And the 1st simulated value is the one without air-conditioning heat, and the 2nd one is with air-conditioning heat. The average atmospheric temperature is 35.5°C compared to that is 34.8°C without air-conditioning heat. And the measuring average temperature is 34.6°C. The discrepancy for the simulated results and measuring results seems that the temperature of 1st point, 7th and 8th point is a little lower in the field measurement for they are always in the shadow. However, this phenomenon has been simplified in the simulation model which perhaps leads to the higher temperature for each measuring point and lower temperature difference in the simulated results.
From Figure 9 and Figure 10, we can find out several apparent points: 1) measuring value is agreeable with the simulated value after the validation of the sign test method even though there seems some divarication; 2) the simulated values of wind speed and atmospheric temperature are stable, with little change and a little higher than the measuring values; 3) the wind direction of simulated and measuring values are in sustainable agreement although there is discrepancy at some points, which can be explained as the simplification of the simulation model; 4) the measuring points in the field measurement have to be affected by the weather, shadow and underlying surface. For example, the 7th, 8th and 9th points are always in the shadow which can result in their lower temperature than simulated values.
3.4. Brief Summary
After the comparison between measuring and simulated values, the influence of one high-rise building to its surroundings is studied. Then, the outdoor thermal environment condition around this building are got, which can be mainly presented as following:
- 1)
- The influence of high-rise building to the wind field: it is not obvious in the field measurement because of too many factors including predominant wind direction, brush-fire wind and underlying roughness. Furthermore, the measuring points are always at the height of 1.5m above ground. However, we can see clearly from the simplified simulation model that the predominant wind is blocked directly by the high-rise building, which finally induces a large low speed area in the southeast. Besides, there is “stagnant water region” near auditorium between two annexes where the wind speed is less than 0.5m/s.Two ways can be selected to strength the ventilation effect around the high-rise building: one is widening the air channels in the North-South trend of the building. Because the main roads near the high-rise building are always in the East-West trend, and both simulated values and measuring results show that the speed is much higher in the North-South trend; the other is to channel wind holes through the annex which could make the northwest and southeast wind go through the building so as to decrease the area of the stagnant water region.
- 2)
- The influence of air-conditioning heat: high-rise buildings are big heat sources, the simulated results which are with air-conditioning heat show that the temperature of the surroundings especially along the predominant wind direction can be 1°C higher than other regions and this influence continues to beyond. The higher the outdoor atmospheric temperature, the higher air-conditioning burden is. That is to say, it is easy to form a vicious circle. Therefore, it is necessary to build a large green area region as well as water area in the downwind areas which can not only absorb the air-conditioning heat but decrease the stay of personnel.
4. Discussions and Improvement
The high-rise buildings spring up like mushrooms with the over quick urbanization as well as the special geography in Chongqing. In other words, more and more high-rise buildings in this special mountain city are one of the inevitable phenomenons. What the problem is that we have found out that the high-rise buildings have to block the wind entrance and decrease the wind speed to a great extent through field measurement and simulation. If there is more than one high-rise building in the above region, the results could be much more terrible. Meanwhile, the habitat of high-rise buildings is always the place where air-conditionings are concentrated, and then the air-conditioning heat along with the predominant wind could increase its surrounding atmospheric temperature largely which can make further effects to the increasing cold burden.
There are some well-known measures to ease the worsen of the outdoor thermal environment, such as the increase of the green area and water area, roof greening and greening inside the high-rise buildings, sun-shading in summer as well. Besides, natural ventilation is an effective way to improve the outdoor thermal environment. Natural ventilation can reduce the stagnant water area; carry away the atmosphere whose temperature is increased by the air-conditioning heat in summer. Furthermore, the natural ventilation reinforces the air flow and carries away the air with high temperature and high humidity in winter to guarantee the indoor comfort. This paper emphasizes on the high-rise building group and simulates the wind environment in different architectural compositions and architectural layouts by CFD software so as to conclude the right architectural layouts which are suitable to the development of mountain cities.
4.1. Influences of different architectural compositions to wind environment
The wind temperature of tower type, courtyard type and plate type these 3 typical types shown in Figure 11 are simulated in order to figure out the relationship of architectural compositions and natural environment. The simulated buildings are in south by east 30°and 60°angle separating predominant wind direction so as to guarantee duration of sunshine. According to the requirement of distance between two building in ‘Chongqing City Planning Management Technique Regulation’ which is put in force in 1st August, 2002 [17], and also for the reason of most housings are high-rise, we initialize the architectural scale of plate type and point type as 40m×15m×54m, 20m×20m×54m respectively, parallel distance as 28m, vertical distance as 15m. Simulated results are shown in Figure 3
We can see from Figure 12 that there is least wind shadow zone for tower type, its wind speed of the back buildings can reach up to 1.5m/s, however, wind speed in the buildings' dooryard for courtyard type goes near to 0 m/s. For the plate type, buildings in the back whose wind speed is less than 1.0m/s are almost in the wind shadow zone because of barrier of buildings in the front. That is to say, the tower type is one of the best types favor natural ventilation. On the condition of the diversity of building forms, the disadvantages existed in courtyard and plate types can be eliminated after renovation. Such as opening some wind holes at the windward sides for the courtyard type buildings, overhead bottom floors and so on.
4.2. Different architectural layouts
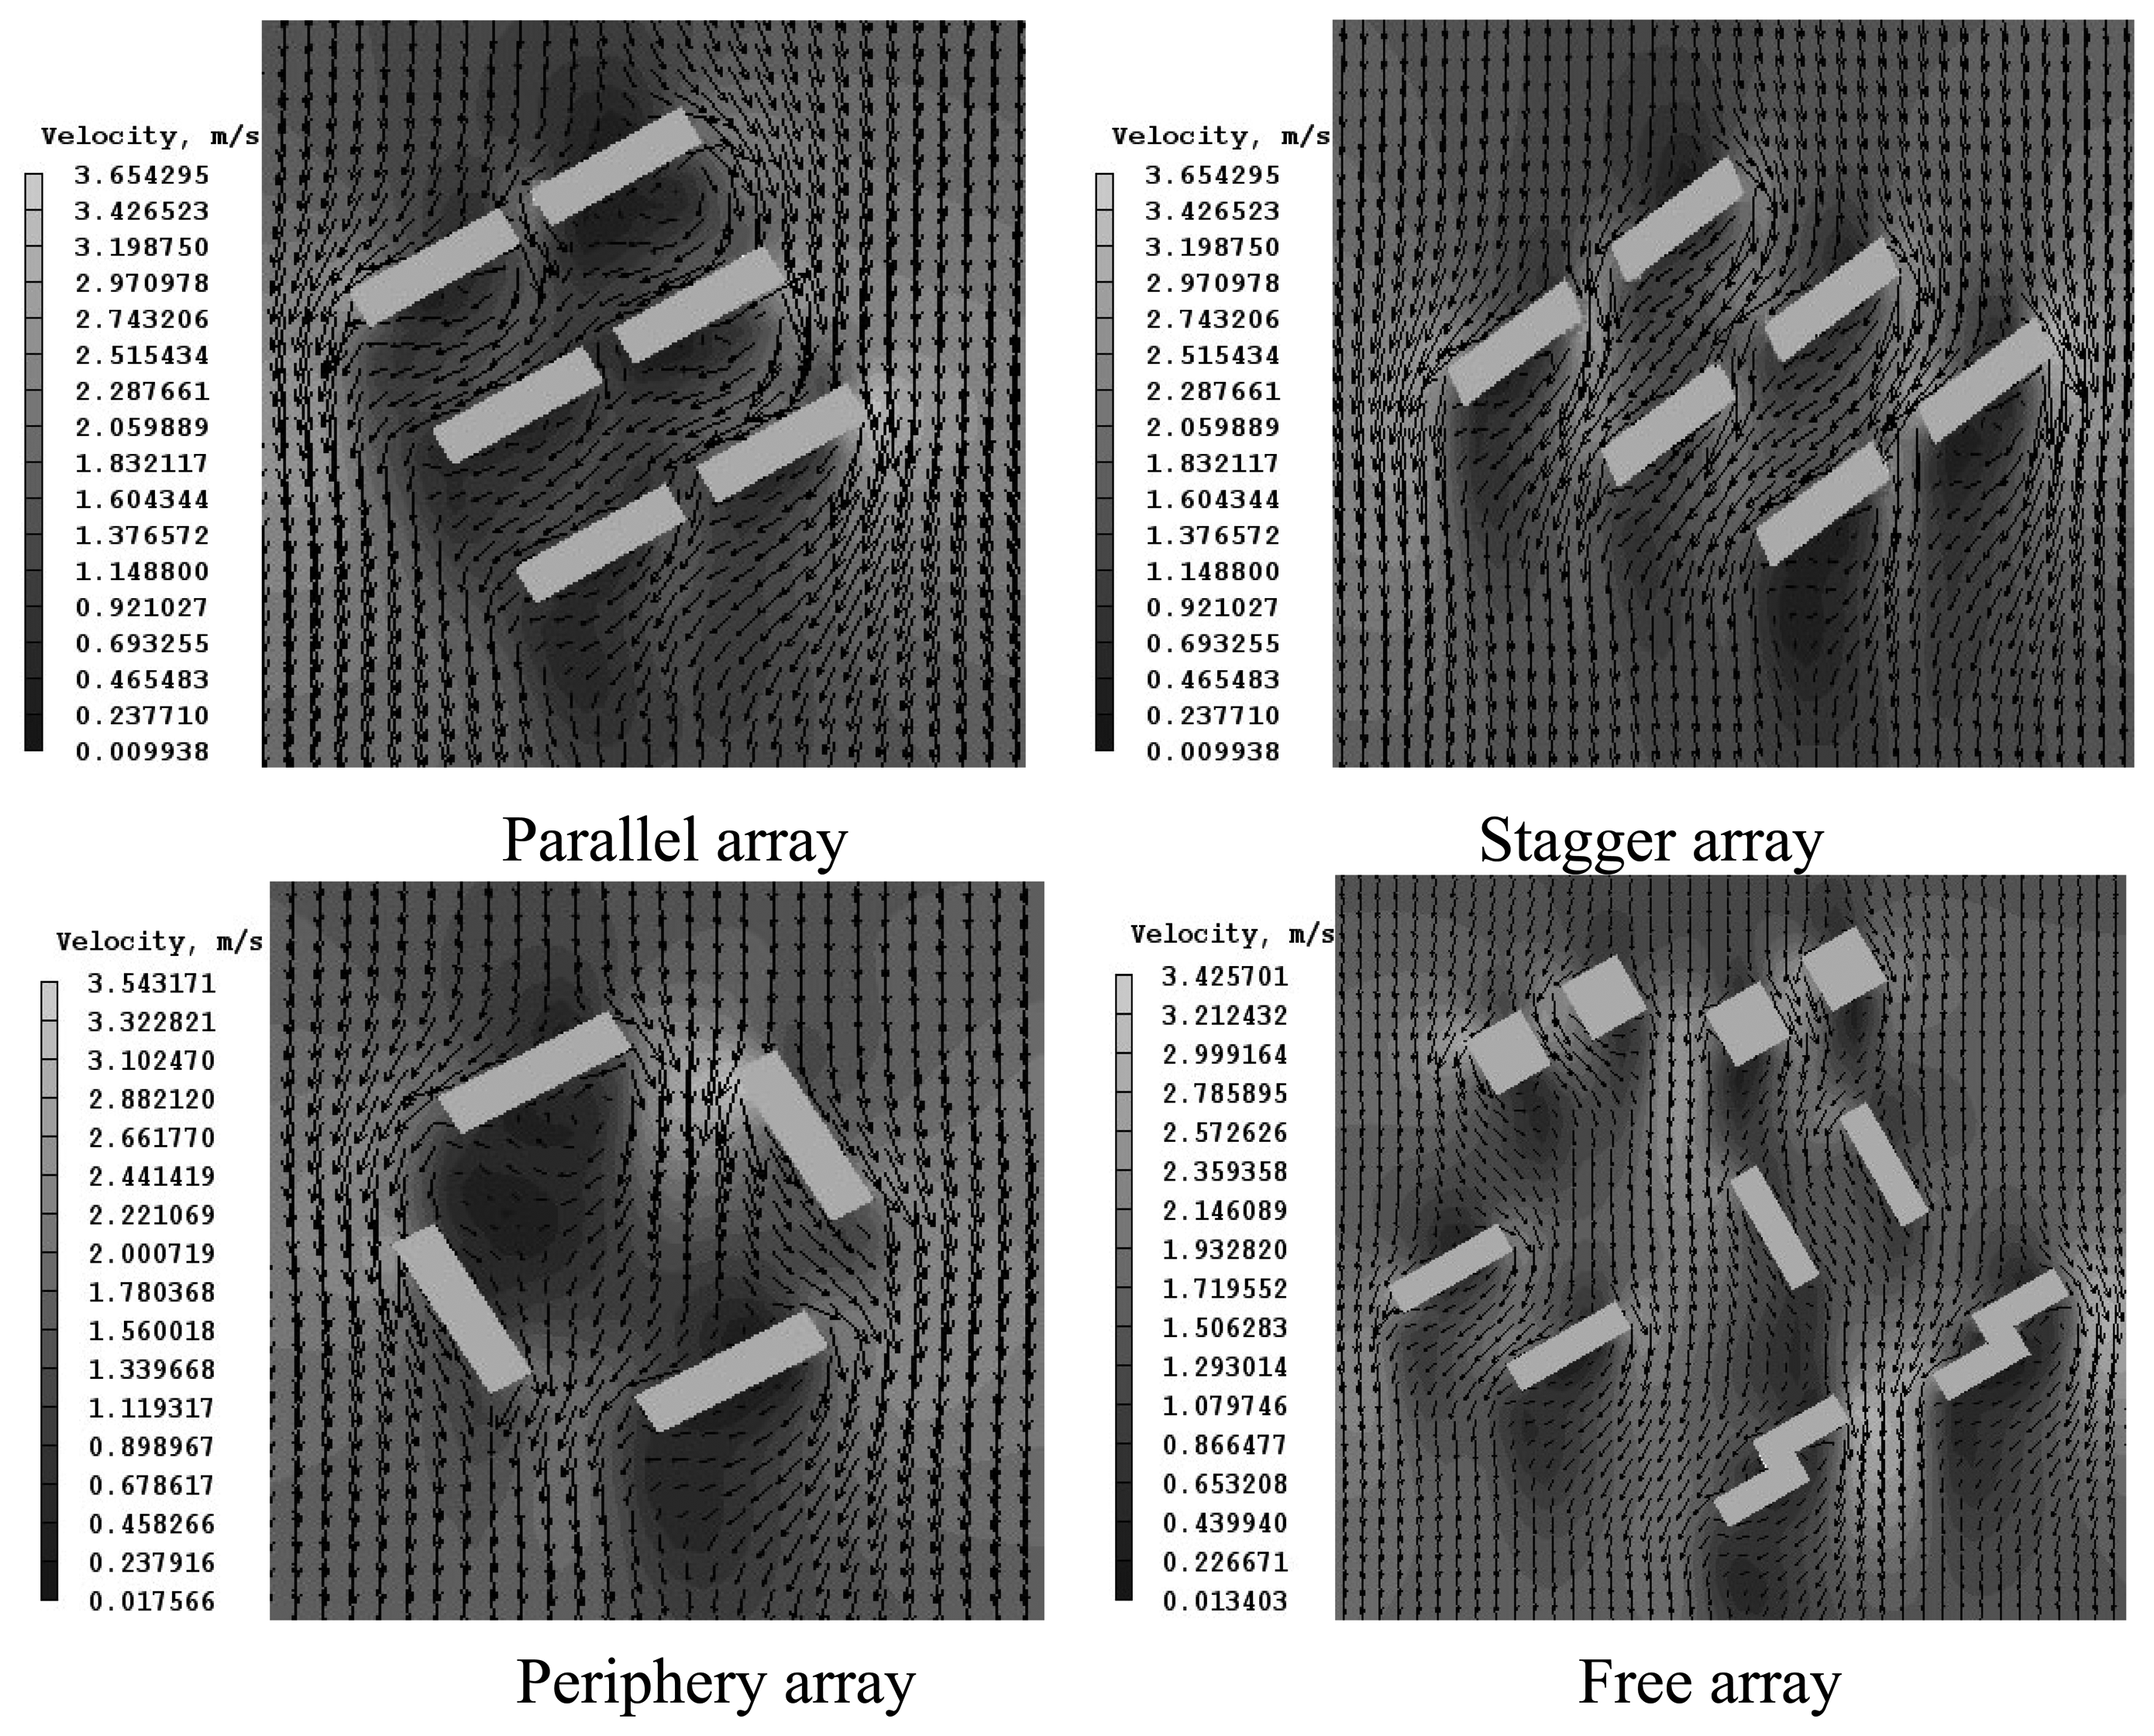
There is direct relationship between architectural layouts and ventilation. Generally, plane array can be divided into four forms, that is, parallel array, stagger array, periphery array and free array which are shown in Figure 13. We also simulated these four arrays with the same boundary conditions as 4.1, and the results are in Figure 14.
Figure 14 shows stagger and free array is better than parallel and periphery ones whose wind shadow zone are larger compared to frontal ones. On the one hand, the wind direction inside the building groups for parallel array diverts to parallel to buildings which goes against ventilation, on the other hand, air flow inside the building groups for periphery array shapes eddy which leads to air flow resort, besides, some of the buildings are west-orientated contributing to large energy consumption. Just the reverse, buildings for stagger and free array do not hold up winds for each building. Especially for the stagger one there is enough front face area available to natural ventilation. The free array is with little wind shadow zone, although its integrated effect is not as perfect as stagger one, it is flexible and can solve the terrain limitation problem in mountain cities.
5. Conclusions
Urbanization is overwhelming and guides the development of every walk of life not only in Chongqing but the whole world. It is inevitable for the mountain cities with numbers of high-rise buildings because of their special geography character and high population. The CFD software- PHOENICS is introduced into the flow-fluid simulation for its powerful functions. After simulation and field measurement of one high-rise building and its surroundings located in the city center, the disadvantages of the wind speed obstacles, lower speed around the surroundings and higher atmospheric temperature along with the predominant wind which are caused by the high-rise building are validated perspicuously, and it is also validated that PHOENICS can agree well with the field measurement. Aiming at improving the outdoor thermal environment near the high-rise buildings, natural ventilation is strongly adopted with different architectural compositions and architectural layouts in this paper. After simulation and analysis by CFD software, tower type favors the natural ventilation in summer and buildings in free array can layout flexible according to the topography and building orientation. Furthermore, the stagger array can also be an effective architectural layout after some renovation. They are results which can specially contribute to the outdoor thermal environmental simulation and study in mountain cities and the results can be reference for the improvement of urban outdoor thermal environment as well as the application of ventilation in mountain cities.
Acknowledgments
This study was conducted with support of the foundation item 2006BAJ02A02-05, “Research on the key techniques and improvement of inhabited environment of cities and towns in China” project, which is part of the 11th five-year plan.
References and Notes
- Rosenzweig, C.; Solecki, W.D.; Parshall, L. Characterizing the urban heat island in current and future climates in New Jersey. Environmental Hazards 2005, 6, 51–62. [Google Scholar]
- Oke, T.R. The energetic basis of urban heat island. Journal of the Royal Meteorological Society 1982, 108(455), 1–24. [Google Scholar]
- Oke, T.R. Review of urban climatology, 1973–1976; World Meteorological Organization Technical Note No. 169; Secretariat of the World Meteorological Organization: Geneva, 1979. [Google Scholar]
- Building design data collection-1.; Beijing; China construction engineering publication, 1993.
- Zhu, Y.; Liu, J.; Hagishima, A. Evaluation of coupled outdoor and indoor thermal comfort environment and anthropogenic heat. Building and Environment 2007, 42, 1018–1025. [Google Scholar]
- Ding, J.; Zhou, H.; Ye, Q. Importance of city green by investigation on evolution of heat island in Shanghai city. Meteorology 2000, 28(2), 22–41, in Chinese with English abstract. [Google Scholar]
- Fanger, P.O. Thermal comfort; Danish Technical Press: Copenhagen, 1970. [Google Scholar]
- ASHRAE. Physiological principles and thermal comfort. In Handbook of fundamentals; American Society of Heating, Refrigerating and Air-Conditioning Engineers, Inc.: Atlanta, 2001; pp. 29–81. [Google Scholar]
- Givonia, B.; Noguchib, M.; Saaronic, H.; Pochter, O.; Yaacov, Y.; Fellerc, N. Outdoor comfort research issues. Energy and Buildings 2003, 35, 77–86. [Google Scholar]
- Oker, T.R.; Oke, B. Boundary Layer Climates; Methuen: London/New York, 1987. [Google Scholar]
- Cooling Our Communities: A Guidebook on Tree Planting and Light-Colored Surfaces; United States Environmental Protection Agency, Policy Planning and Evaluation (PM-221), 1992.
- Taha, H. Urban climate and heat islands: albedo, evapotranspiration and anthropogenic heat. Energy and Buildings 1997, 25, 99–103. [Google Scholar]
- Ojima, T. Changing Tokyo metropolitan area and its heat island model. Energy and Buildings 1990-1991, 15-16, 191–203. [Google Scholar]
- Weici, S. Health problem of the ecosystem faced by the sustainable development of metropolitan region and safeguard mechanism in Chongqing. Research of Soil and Water Conservation 2006, 13(1), 45–47. [Google Scholar]
- Bornehag, C.G.; Sundell, J.; Hagerhed Engman, L. The association between asthma and allergic symptoms in children and phthalates in house dust: a nested case control study. Environmental Health Perspectives 2004, 112, 1393–1397. [Google Scholar]
- Fanger, P.O. Improving indoor air quality for promoting human health, learning and productivity while saving.; Presented at Sustainable Development of Building and Environment, 2005. [Google Scholar]
- Chongqing City Planning Management Technique Regulation; Chongqing City Planning Bureau, 2002; pp. 7–9.
- Murakami, S.; Mochida, A. On turbulent vortex shedding flow past 2D square cylinder predicted by CFD [J]. Wind Eng. Ind. Aerodyn. 1995, 5, 191–211. [Google Scholar]
- Sakamoto, S.; Mochida, A.; Murakami, S.; Rodi, W. Comparison of LES with DSM, k-ε and experiments for turbulence vortex shedding flow past 2D square cylinder, [J]. Struct. Constr. Eng, AIJ 459, 49–56.
- http://cq.people.com.cn/zhuanti/yxjd/20070824001358.shtml
- Mula, A.; Xyo, S. Environmental Design of Building urban by CFD [M]; Press of Tokyo University: Tokyo; pp. 253–274.
Figure 1.
The main structure of PHOENICS Circle means program module; Rectangles with white background means documents' style of the generated programs.
Figure 1.
The main structure of PHOENICS Circle means program module; Rectangles with white background means documents' style of the generated programs.

Figure 2.
The observations in and around the high-rise building.

Figure 3.
Air temperature of each point around the high-rise building in 18th June, 2006.

Figure 4.
Ground surface temperature of each point around the high-rise building in18th June, 2006.

Figure 5.
Model domain of the high-rise building and its surroundings.

Figure 6.
Wind speed field at height of 250m and 260m around the high-rise building in summer. * Simulated results taking air-conditioning heat into account.
Figure 6.
Wind speed field at height of 250m and 260m around the high-rise building in summer. * Simulated results taking air-conditioning heat into account.
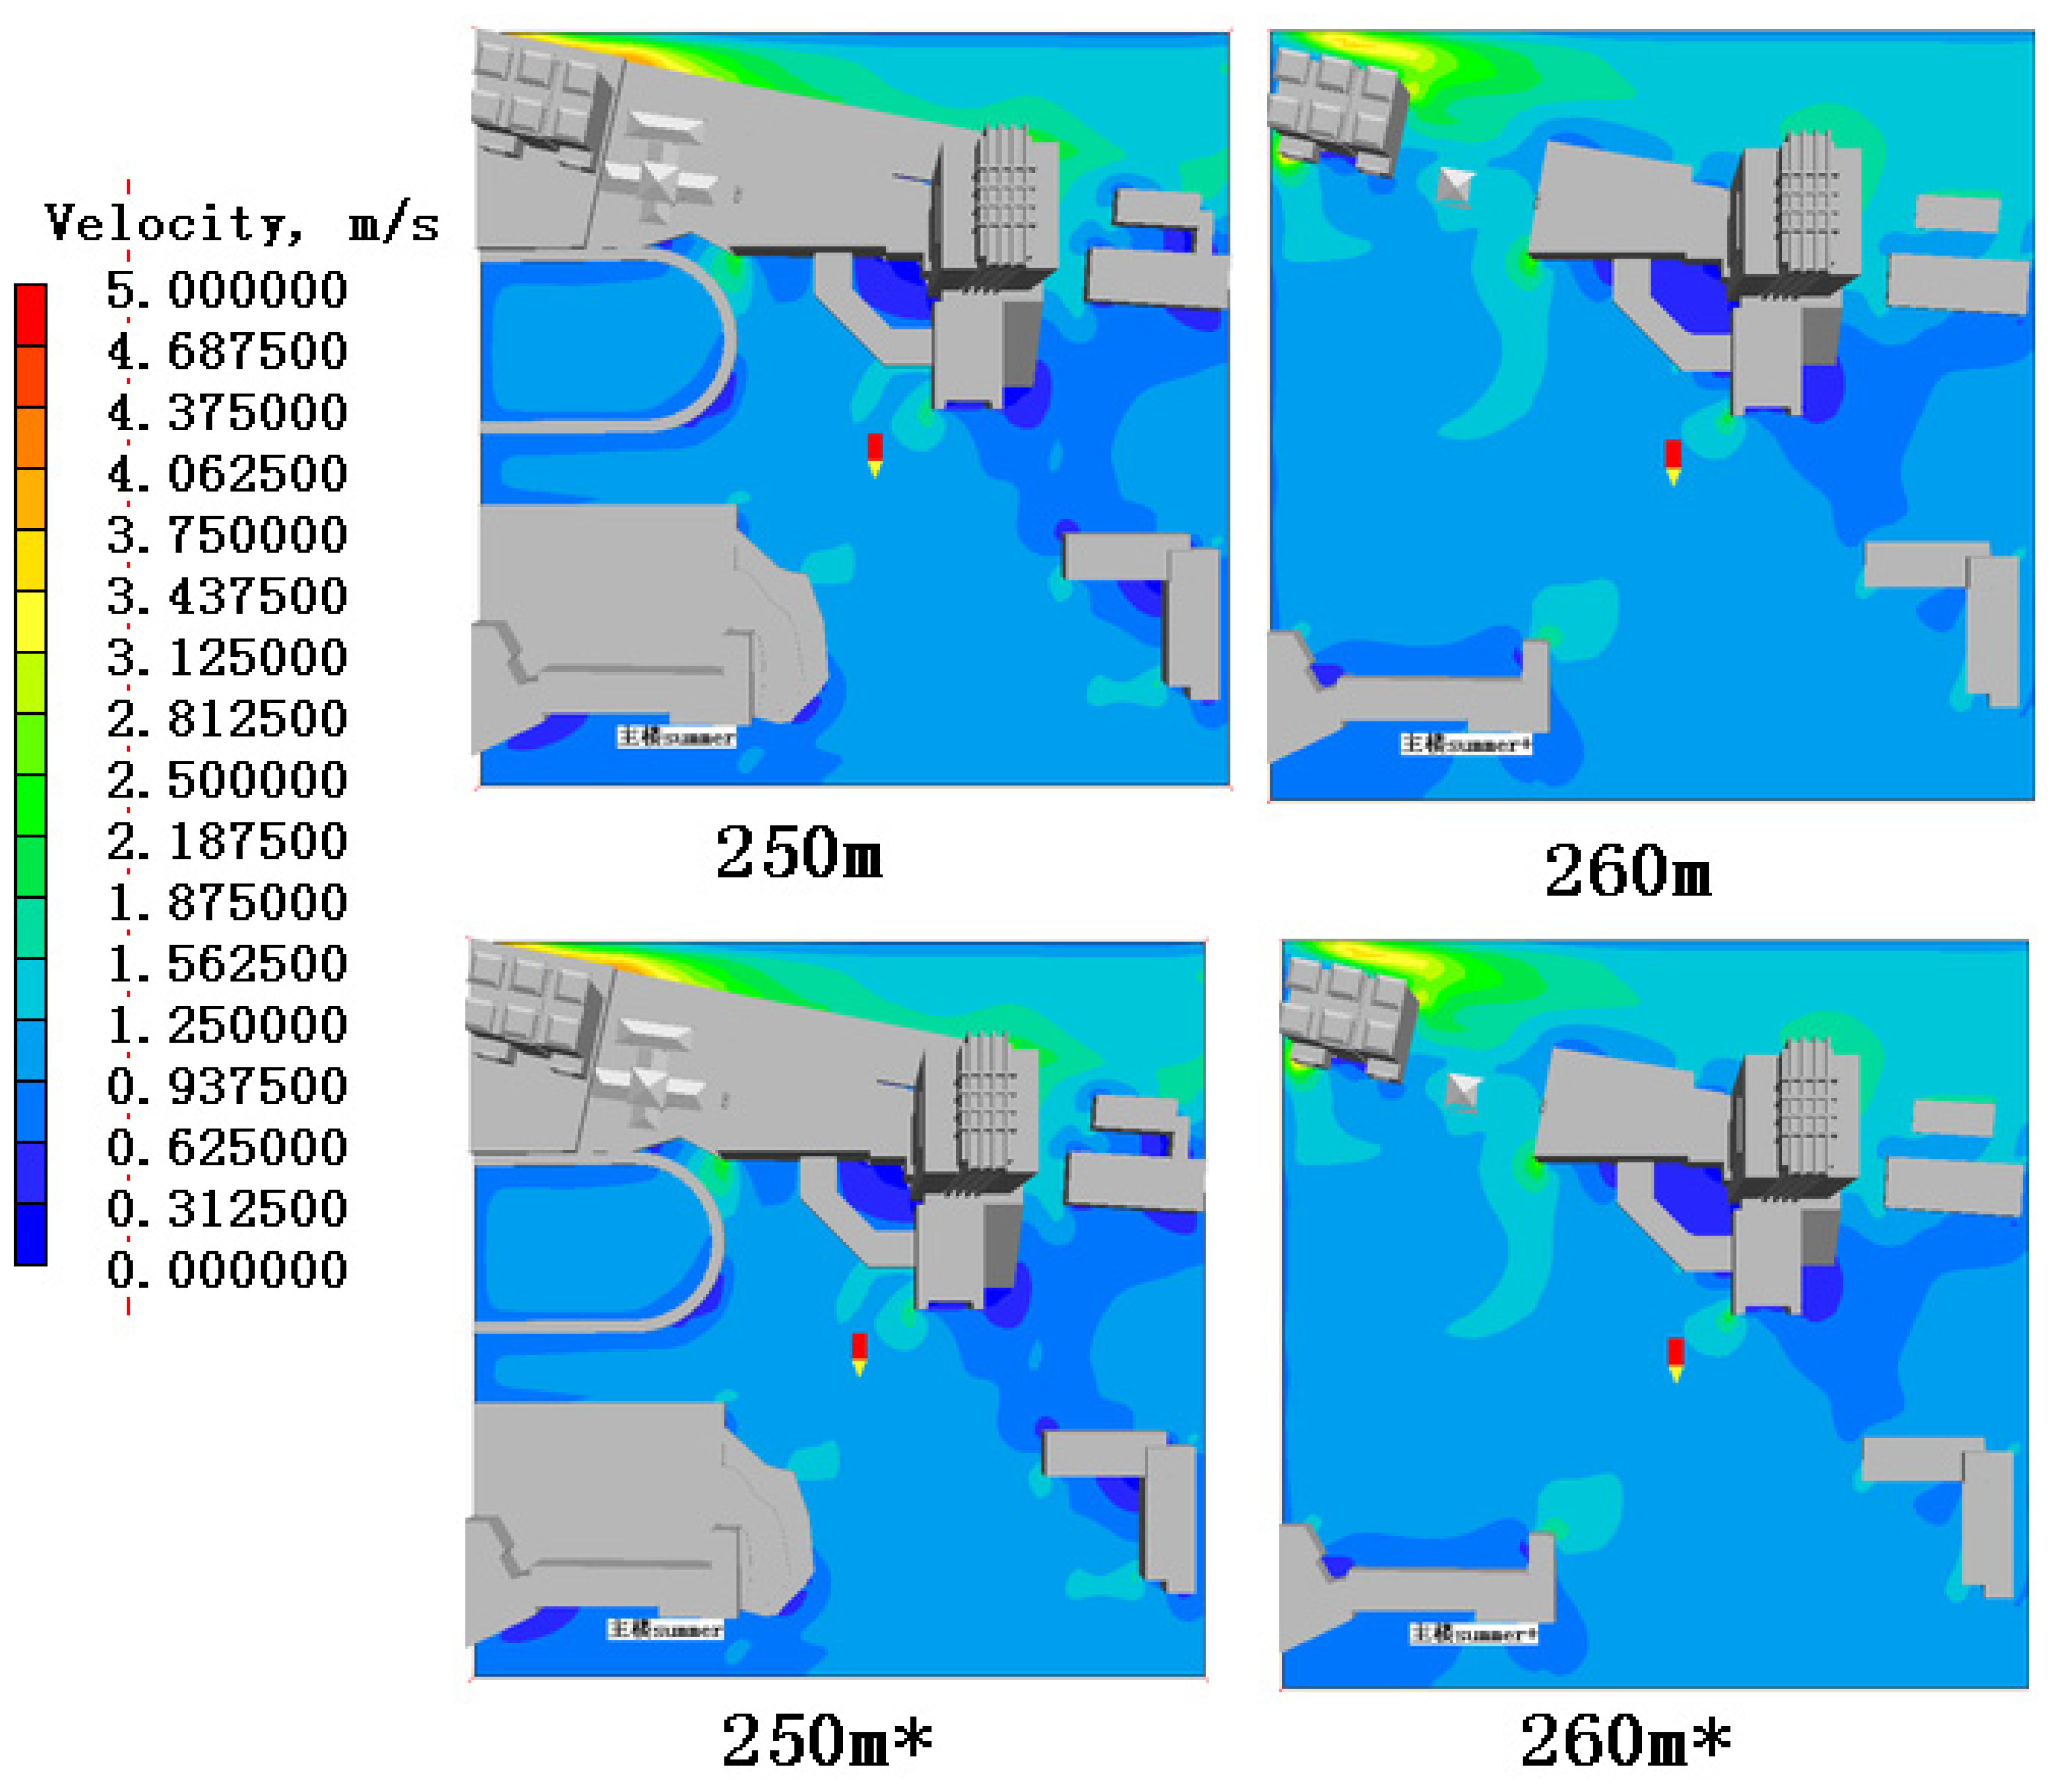
Figure 7.
Stream line at height of 250m around the high-rise building in summer.

Figure 8.
Temperature field at height of 250m and 260m around the high-rise building in summer. * Simulated results taking air-conditioning heat into account.
Figure 8.
Temperature field at height of 250m and 260m around the high-rise building in summer. * Simulated results taking air-conditioning heat into account.

Figure 9.
Temperature discrepancy between simulated and measuring results.

Figure 10.
Wind speed discrepancy between simulated and measuring results.

Figure 11.
Different architectural compositions.

Figure 12.
Simulated results of wind environment for different architectural compositions.
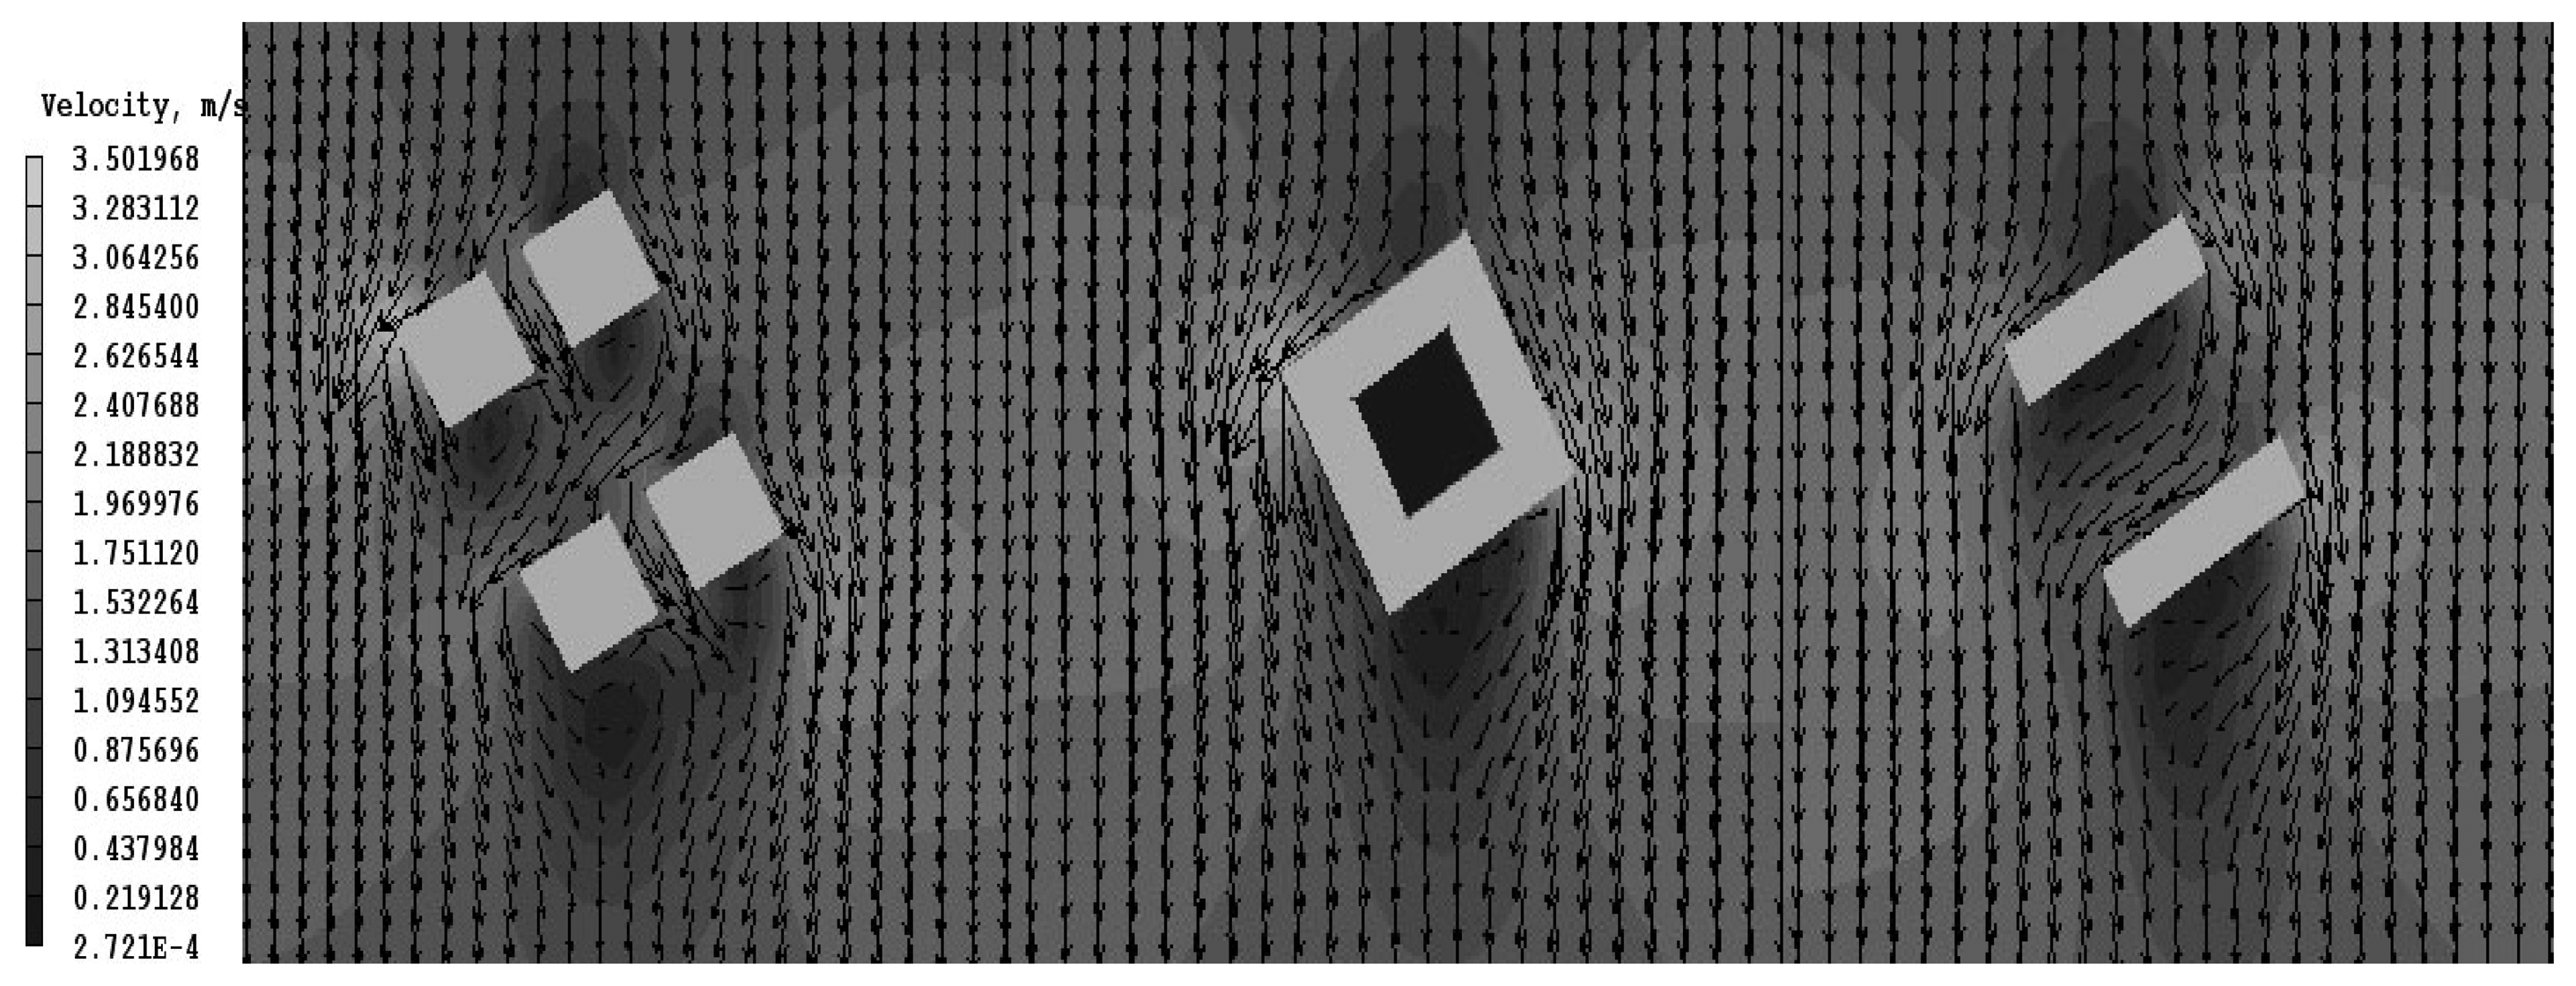
Figure 13.
Different architectural layouts.
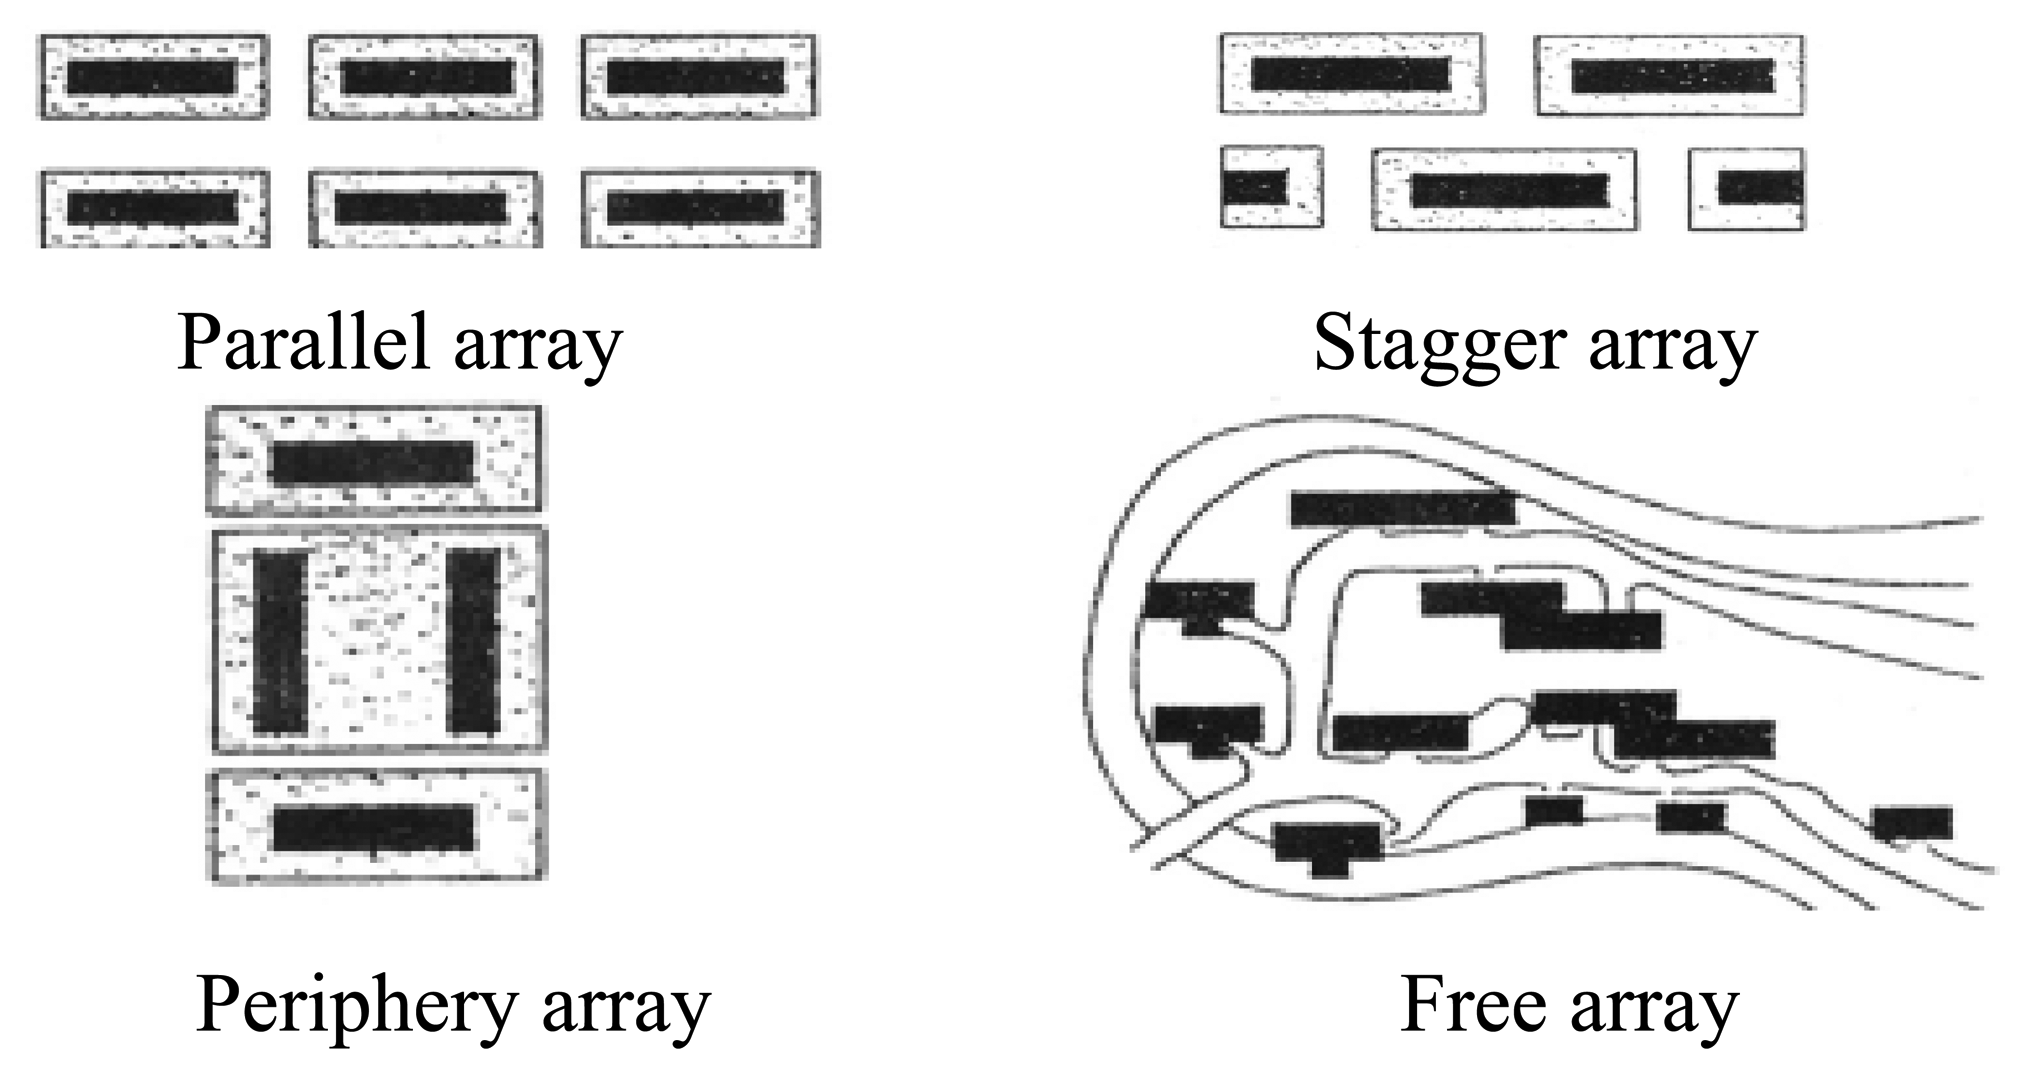
Figure 14.
Simulated results of wind environment for different architectural layouts.

| region | GDP per capital /$ | Land area /km2 | Total population /thousand | nonagricultural population /thousand | Population density/person/km2 | Level of urbanization/% |
|---|---|---|---|---|---|---|
| Urban zone | 14,158 | 549.84 | 3172.3 | 54778.2 | 38234 | 57.7 |
| Western zone | 8,800 | 999.67 | 1912.4 | 188276.4 | 7397 | 19.1 |
| Three gorges ecological zone | 7,503 | 1564.31 | 2129.8 | 581024.9 | 5853 | 13.6 |
© 2007 by MDPI ( http://www.mdpi.org). Reproduction is permitted for noncommercial purposes.
Share and Cite
MDPI and ACS Style
Lu, J.; Chen, J.-h.; Tang, Y.; Wang, J.-s. High-rise Buildings versus Outdoor Thermal Environment in Chongqing. Sensors 2007, 7, 2183-2200. https://doi.org/10.3390/s7102183
AMA Style
Lu J, Chen J-h, Tang Y, Wang J-s. High-rise Buildings versus Outdoor Thermal Environment in Chongqing. Sensors. 2007; 7(10):2183-2200. https://doi.org/10.3390/s7102183
Chicago/Turabian StyleLu, Jun, Jin-hua Chen, Ying Tang, and Jin-sha Wang. 2007. "High-rise Buildings versus Outdoor Thermal Environment in Chongqing" Sensors 7, no. 10: 2183-2200. https://doi.org/10.3390/s7102183