3.1. Polarization measurements and the determination of the average current efficiencies of the hydrogen evolution reaction
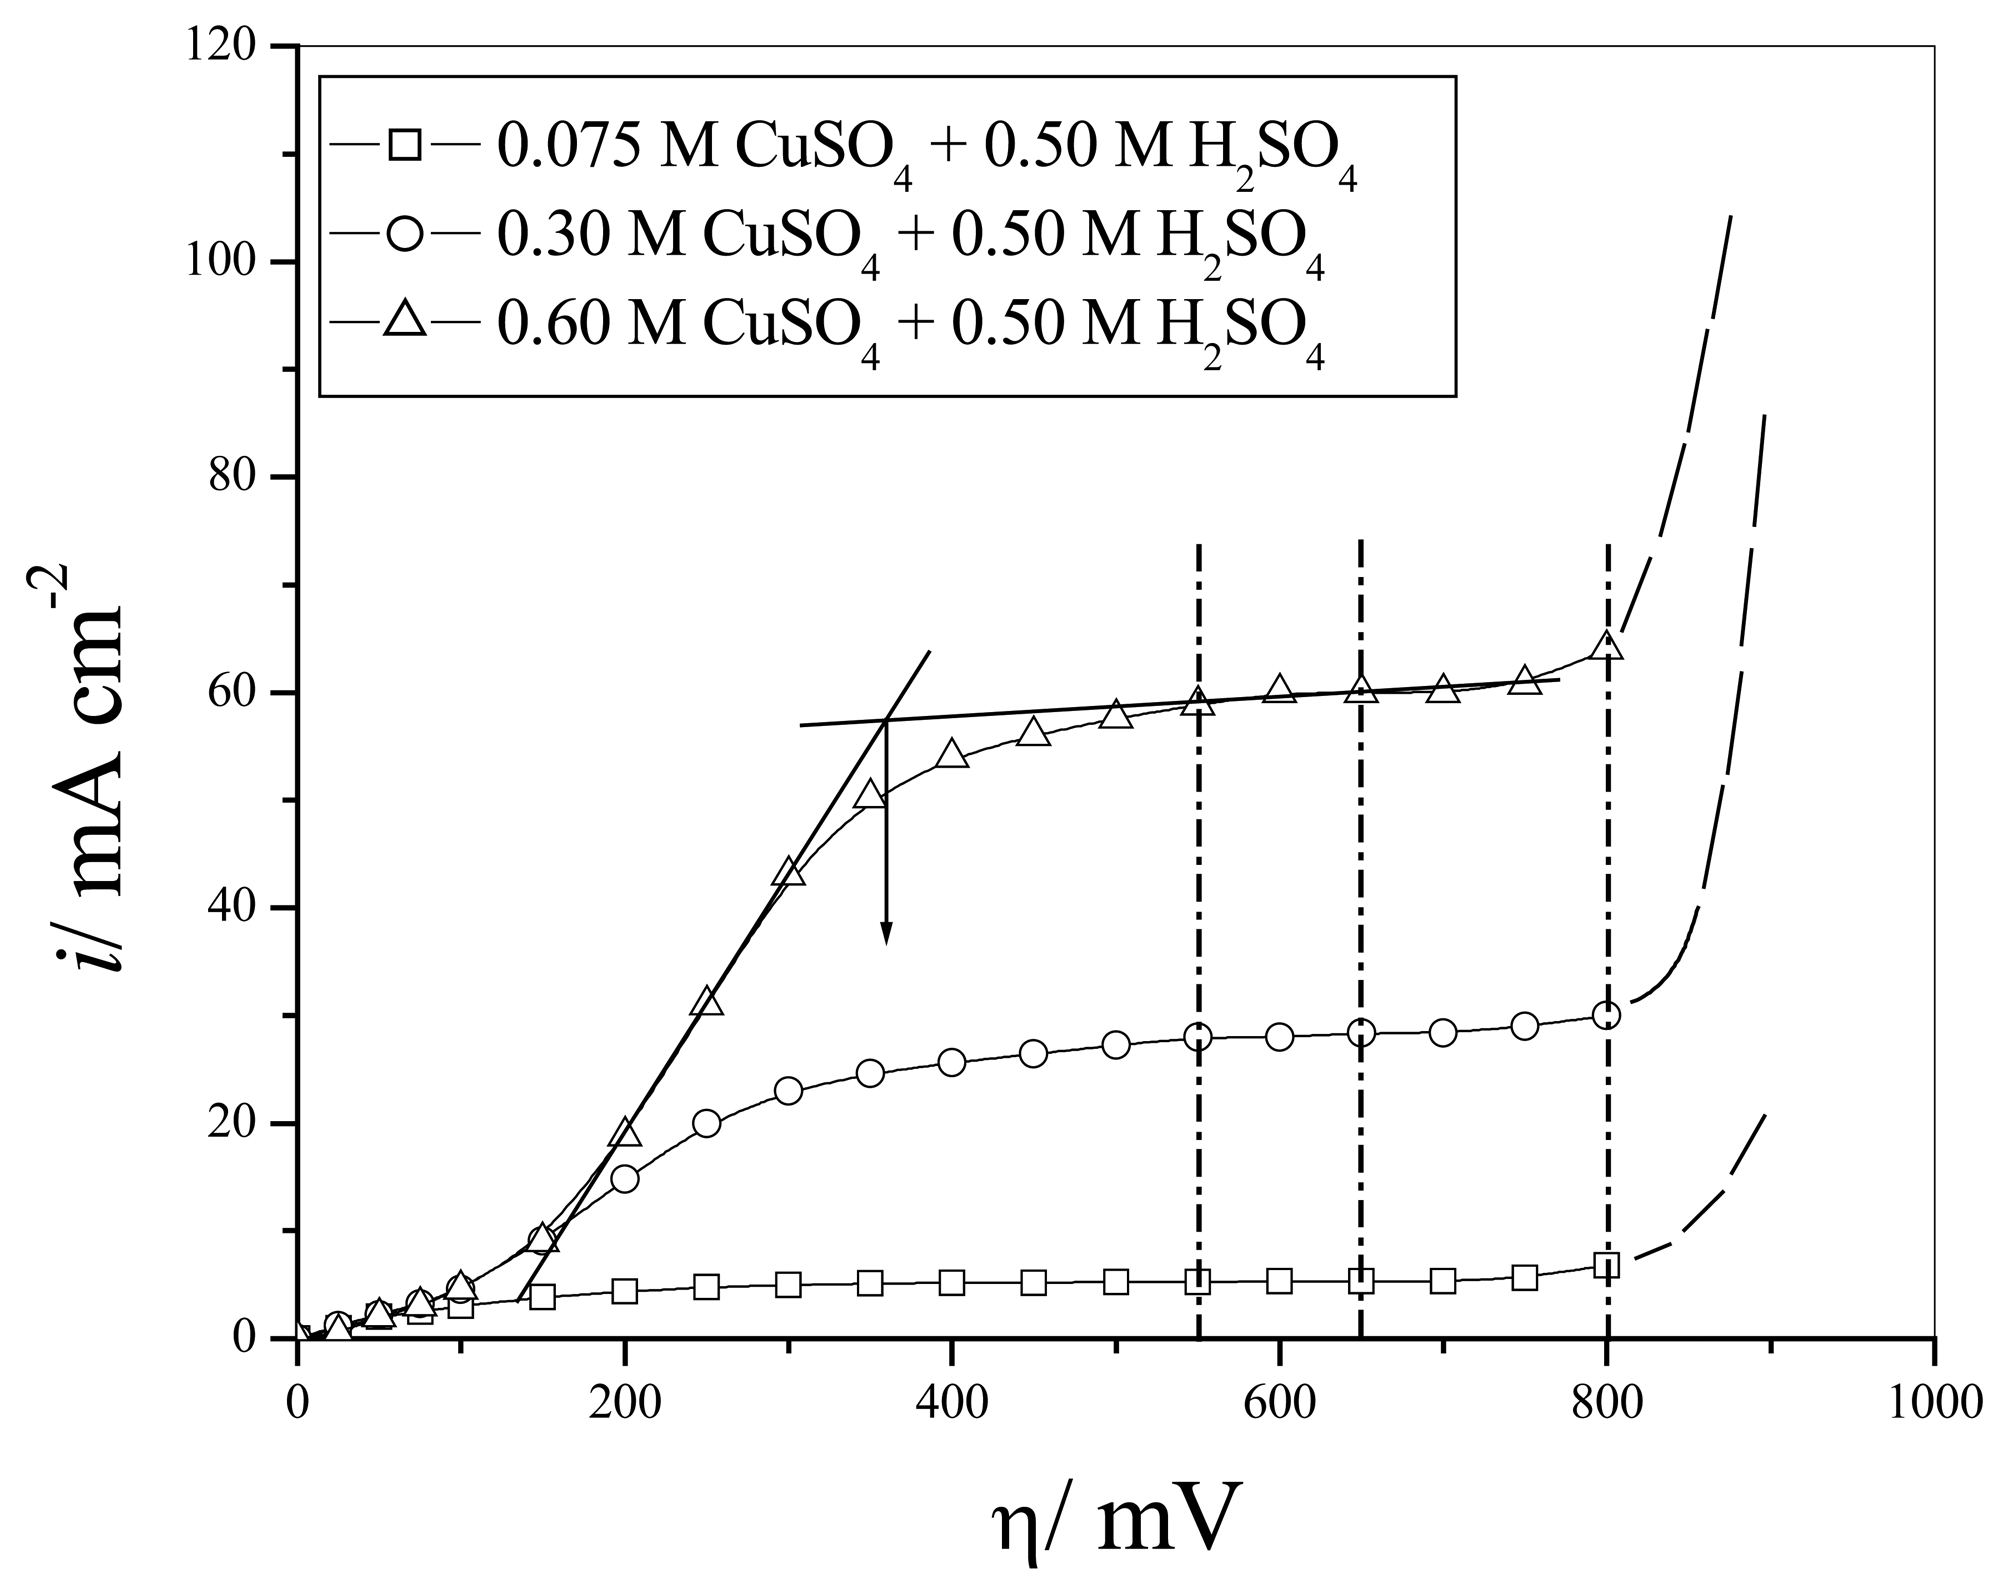
Figure 1 shows the polarization curves for the copper electrodeposition from 0.075 M CuSO
4 in 0.50 M H
2SO
4 (
solution (I)), 0.30 M CuSO
4 in 0.50 M H
2SO
4 (
solution (II)) and 0.60 M CuSO
4 in 0.50 M H
2SO
4 (
solution (III)). The beginning of the plateau of the limiting diffusion current density is determined as the intersect of straight lines joining currents in mixed activation – diffusion and diffusion control of electrodeposition, as shown in the figure. The end of this plateau is determined as the overpotential at which current starts to grow with the increasing overpotential. The range of overpotentials on the plateau of the limiting diffusion current density determined in this way is given in
Table 1. The open circuit potentials of copper electrodes in
solutions (I),
(II) and
(III) are also given in
Table 1. From this data it can be seen that an increase of the concentration of Cu(II) ions in plating solutions leads to a corresponding decrease of the length of the plateau of the limiting diffusion current density.
The effect of hydrogen evolution on copper electrodeposition was examined at overpotentials of 550, 650 and 800 mV. For all examined solutions, overpotentials of 550 and 650 mV corresponded to the plateau of the limiting diffusion current density, while an overpotential of 800 mV was about 50 mV outside the plateau of the limiting diffusion current density (
Figure 1 and
Table 1).
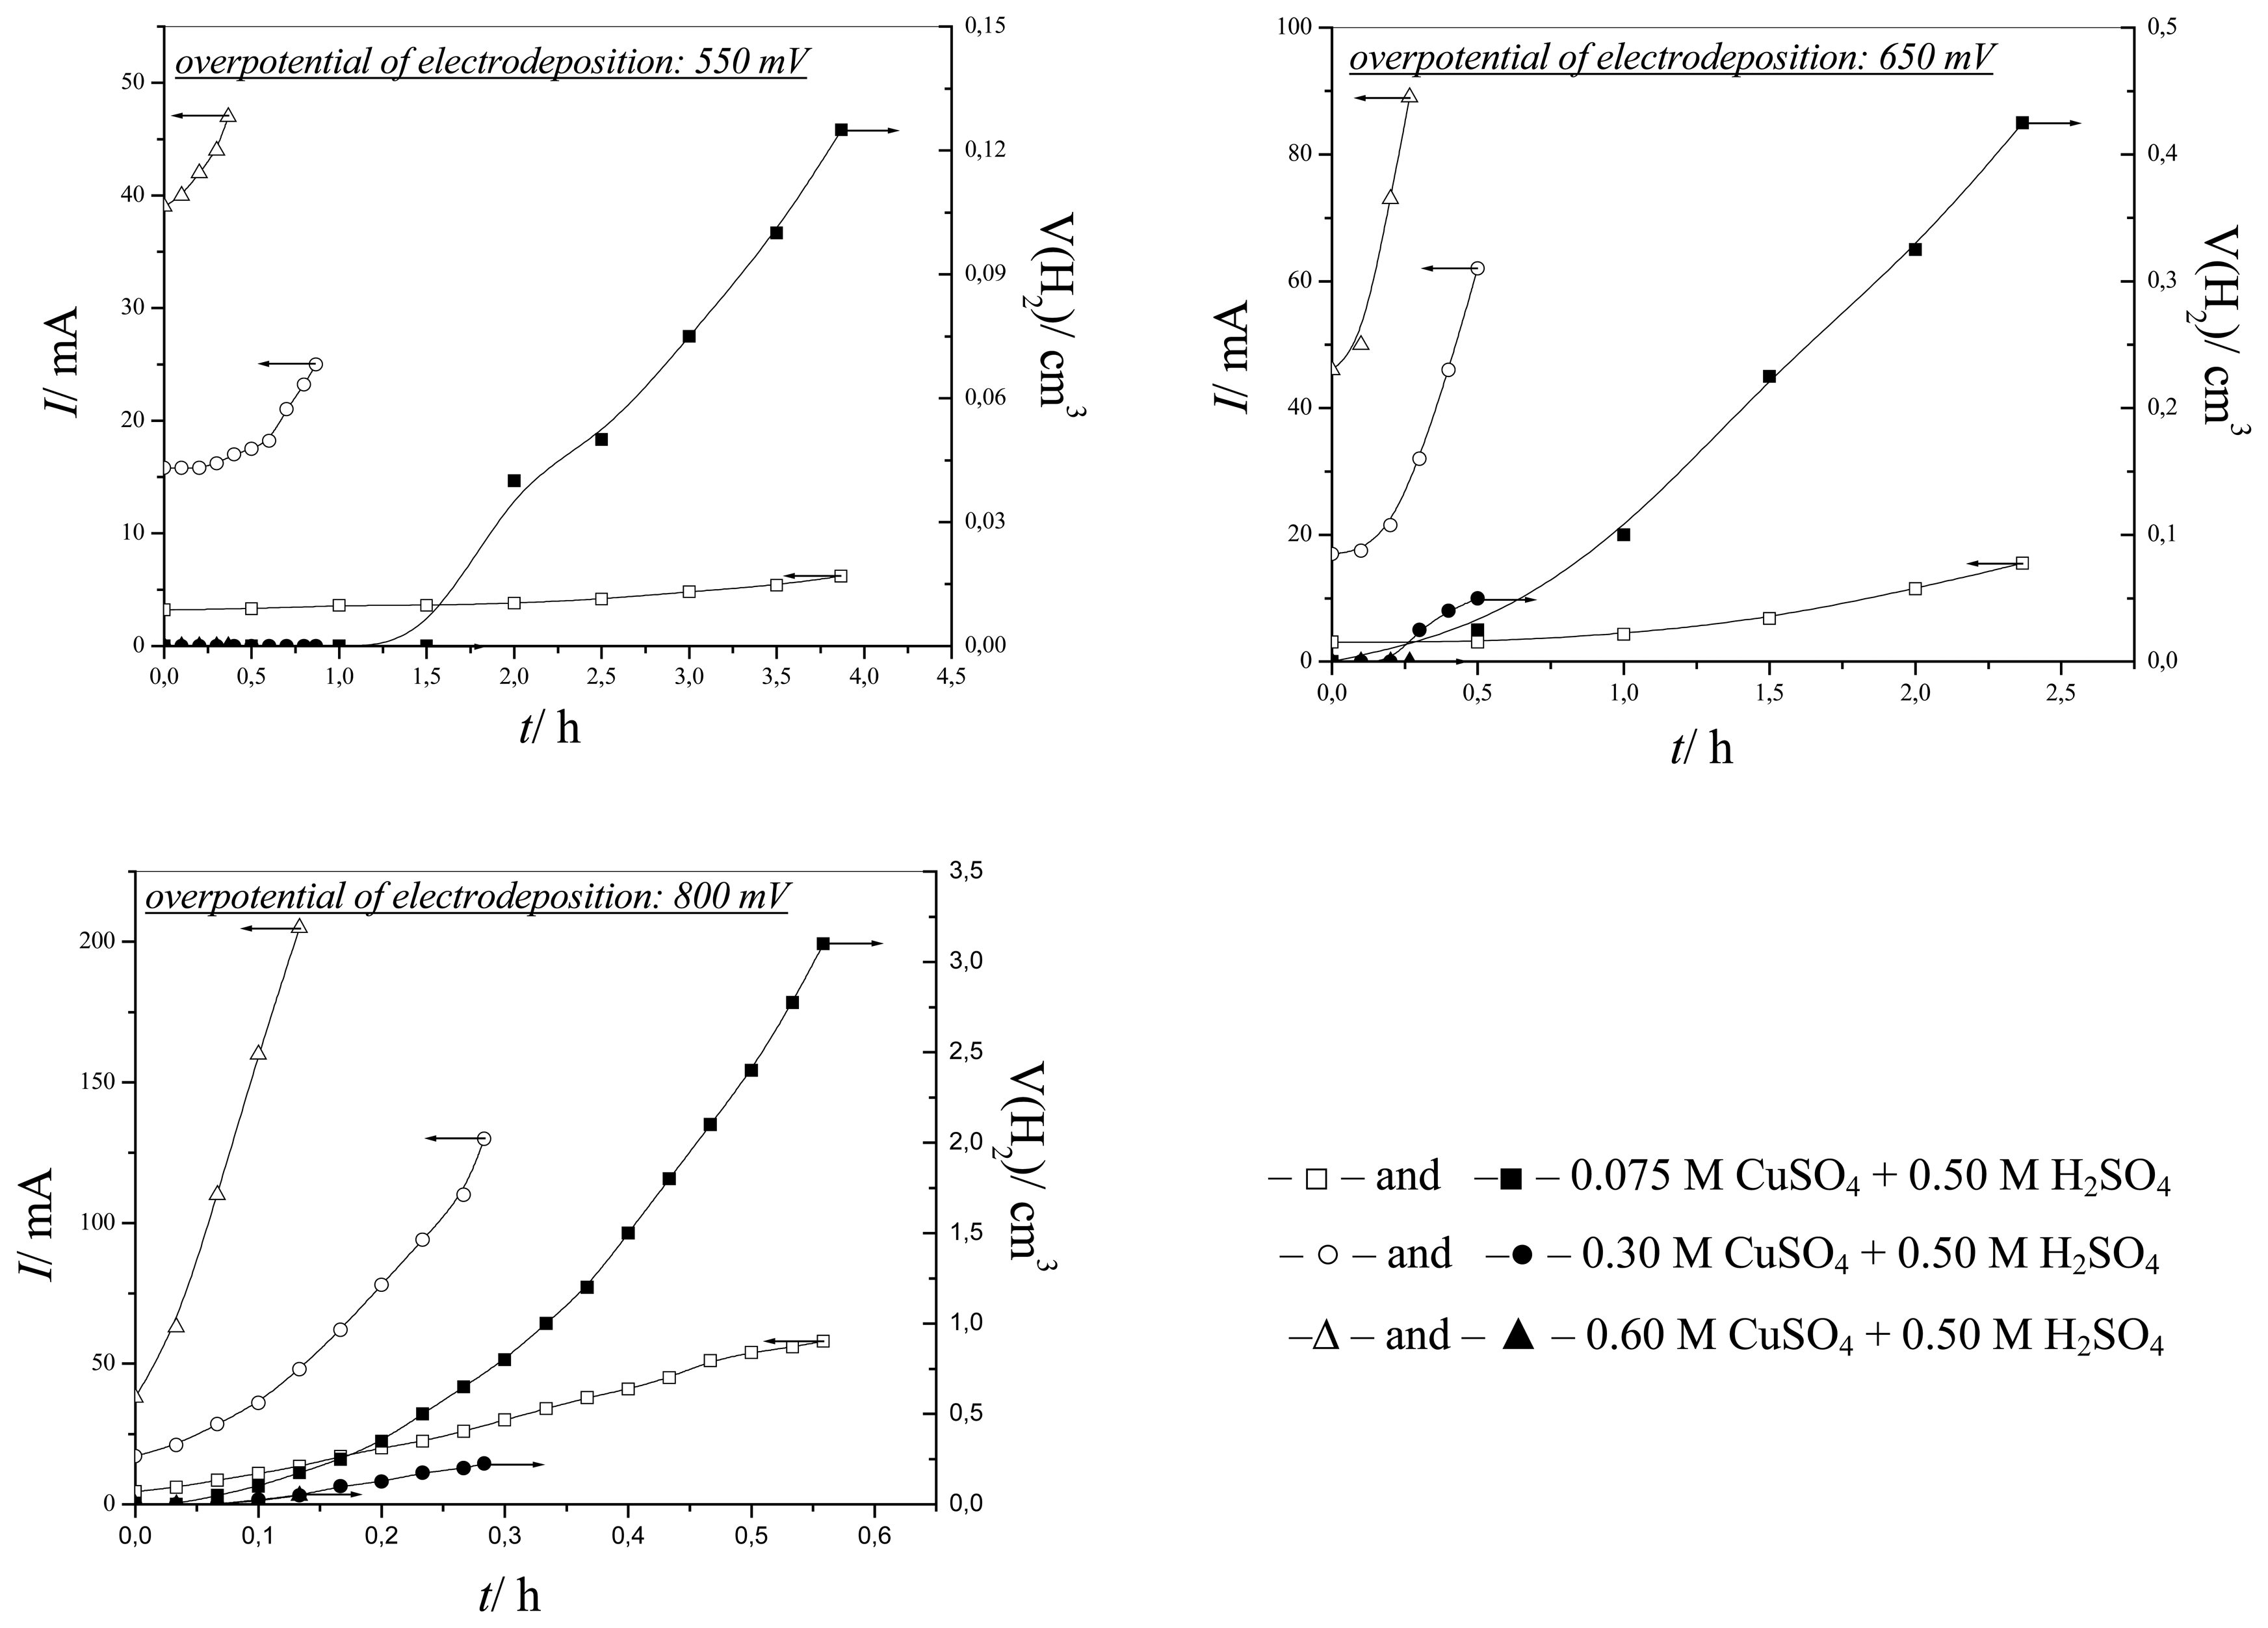
Figure 2 shows the dependencies between electrodeposition currents and volumes of evolved hydrogen on electrodeposition time obtained at overpotentials of 550, 650 and 800 mV from
solutions (I),
(II) and
(III).
From
Figure 2 can be seen that the electrodeposition currents grew with the increasing concentration of Cu(II) ions during electrodeposition processes at all overpotentials. At an overpotential of 550 mV there was hydrogen evolution only from
solution (I). Electrodeposition of copper at an overpotential of 650 mV led to hydrogen evolution not only from
solution (I), but also from
solution (II). The amount of evolved hydrogen was larger from
solution (I) than from
solution (II). Finally, copper electrodeposition processes at an overpotential of 800 mV were accompanied by hydrogen evolution from all three solutions. A decrease of the quantity of evolved hydrogen with the increasing concentration of Cu(II) ions was observed during electrodeposition of copper at this overpotential.
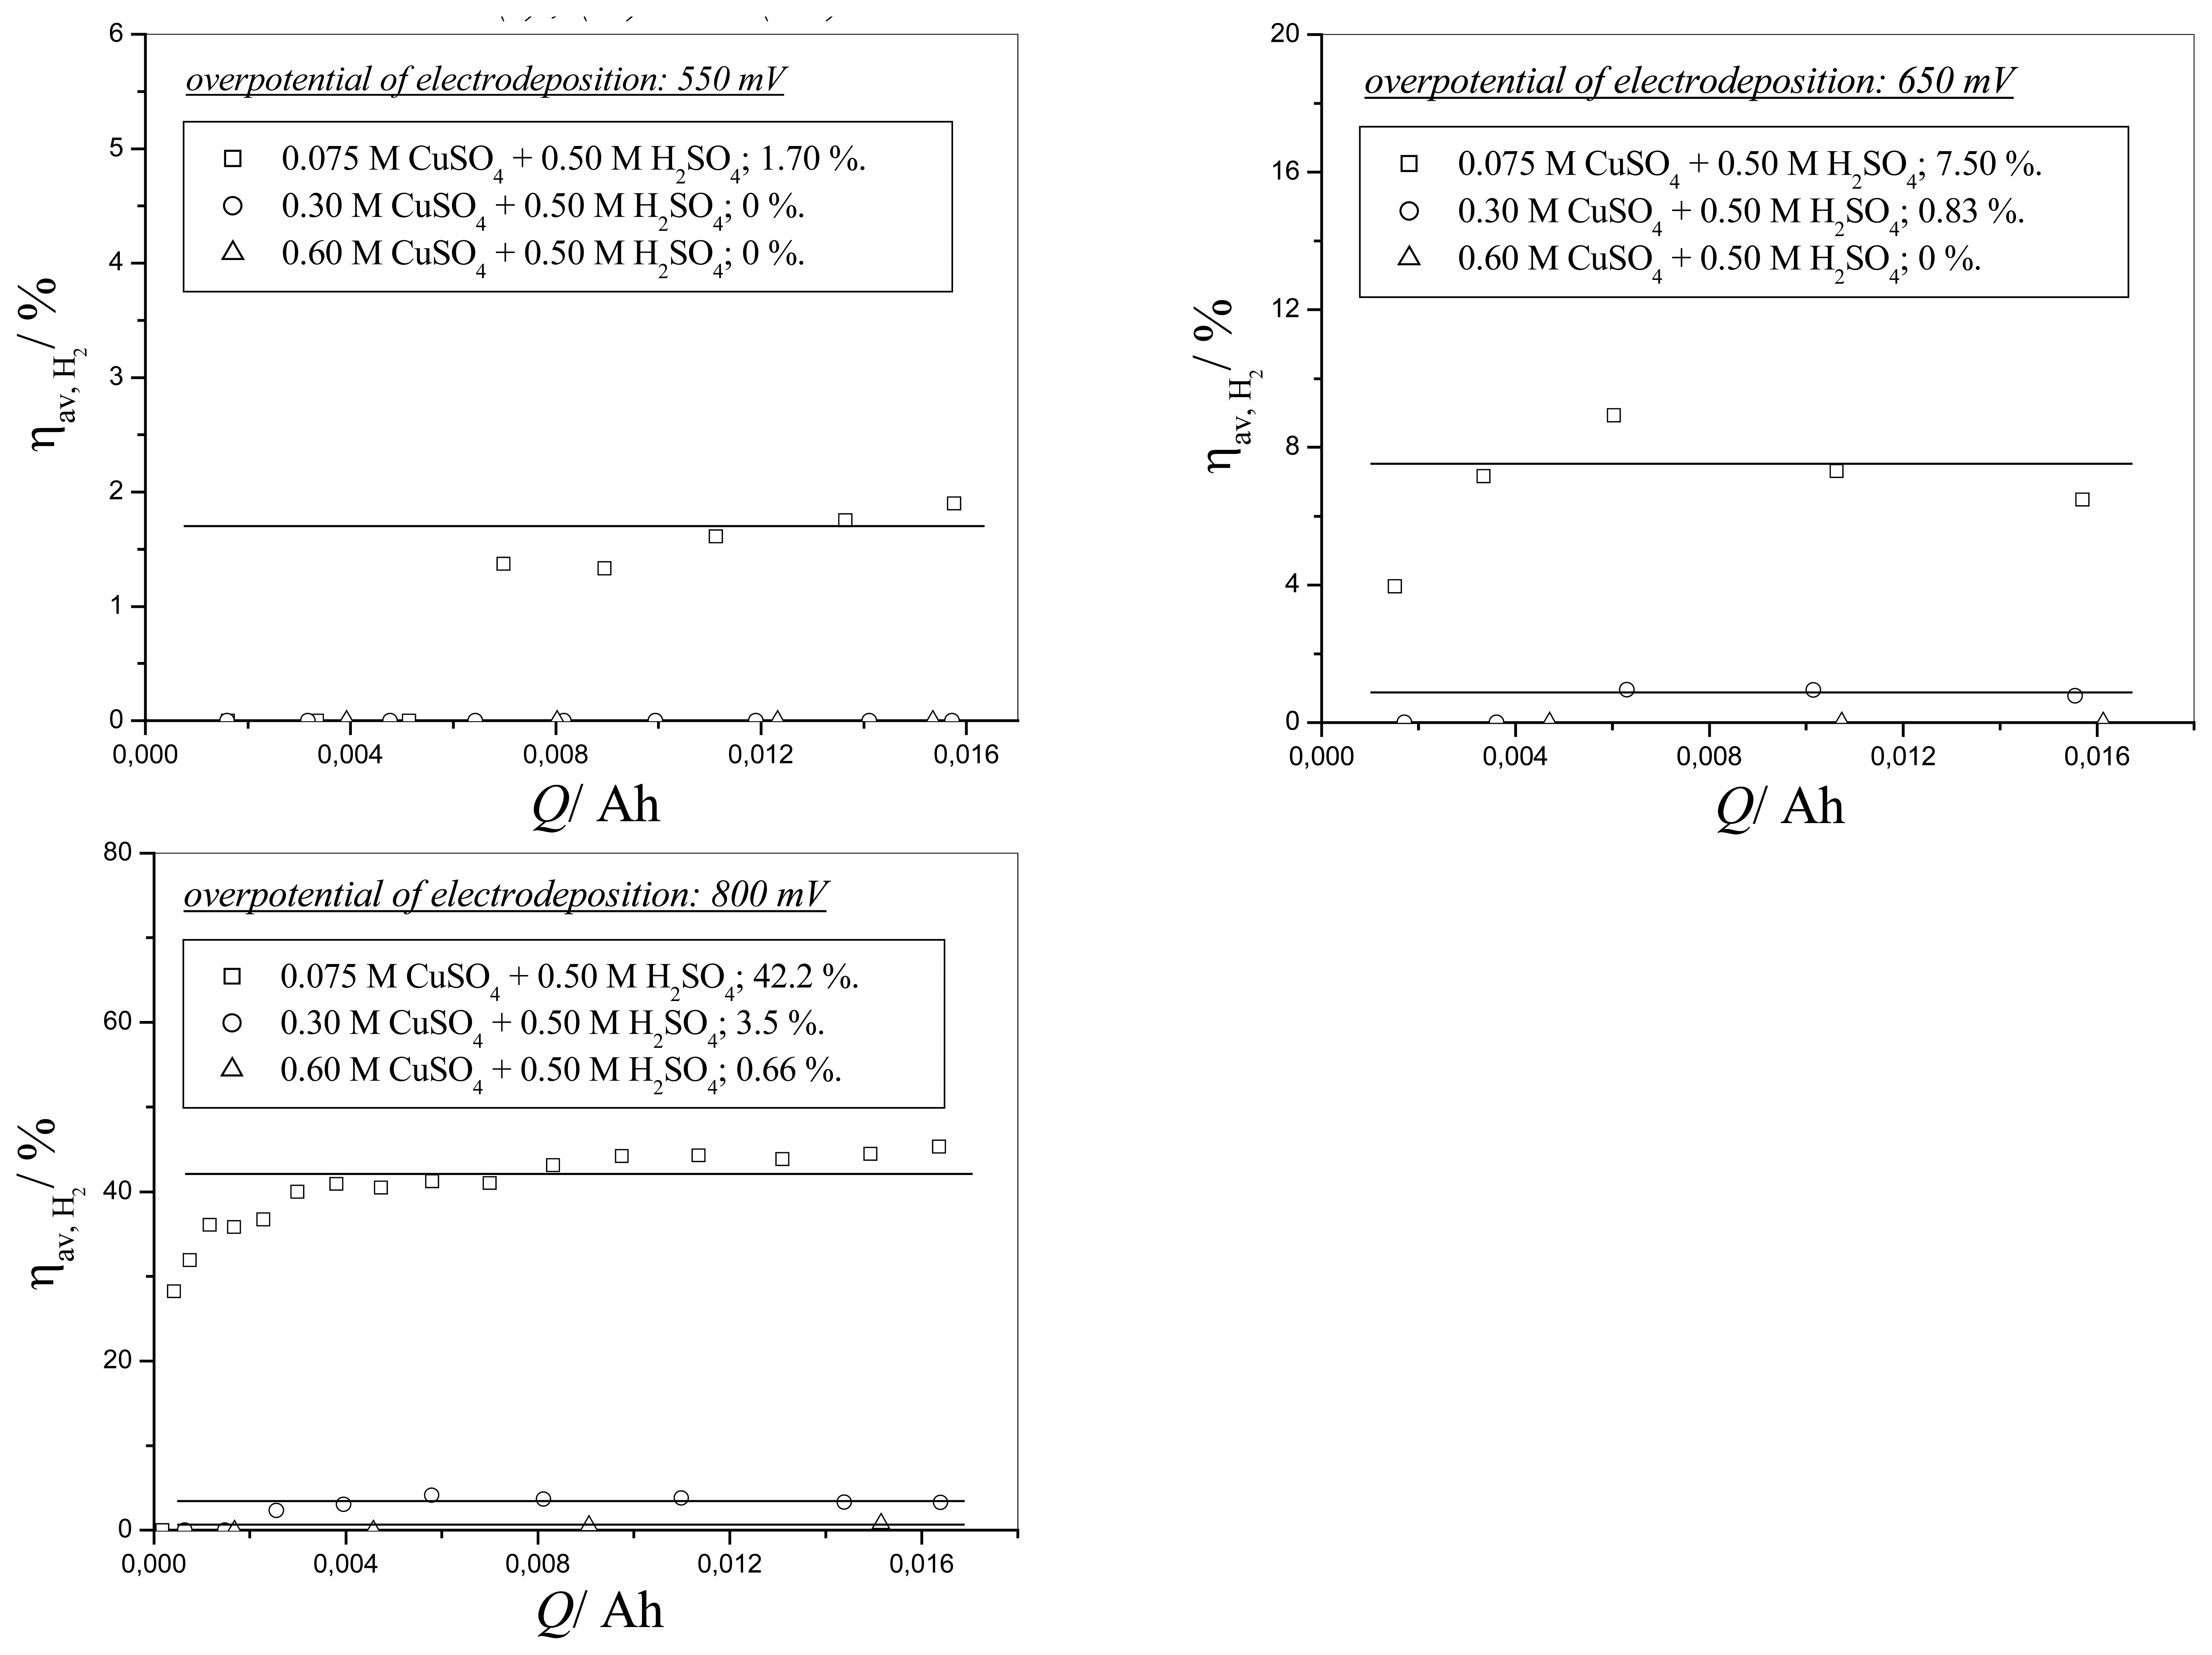
The dependencies of the average current efficiencies for hydrogen evolution reactions on the quantity of passed electricity were derived from diagrams given in
Figure 2 and shown in
Figure 3. The summary of the obtained values of the average current efficiencies of hydrogen evolution in the dependence of concentration of Cu (II) ions and overpotential of electrodeposition are given in
Table 2.
In total, the decrease of the average current efficiencies of hydrogen evolution with the increasing concentration of Cu(II) ions, as well as an increase of the average current efficiencies of hydrogen evolution with the increasing overpotential of electrodeposition were observed during these electrodeposition processes (
Figure 3 and
Table 2). This result can be explained by the fact that hydrogen evolution rate during copper electrodeposition from solutions containing Cu(II) ions in H
2SO
4 at some specified potential decreases with the increasing concentration of Cu(II) ions, while copper deposition rate, and consequently, the overall current strongly increase with the increasing concentration of Cu(II) ions. In this way, the current efficiency for hydrogen evolution reaction at specified potential decreases with the increasing concentration of Cu(II) ions.
3.2. Morphologies of copper deposits obtained at overpotentials of 550, 650 and 800 mV
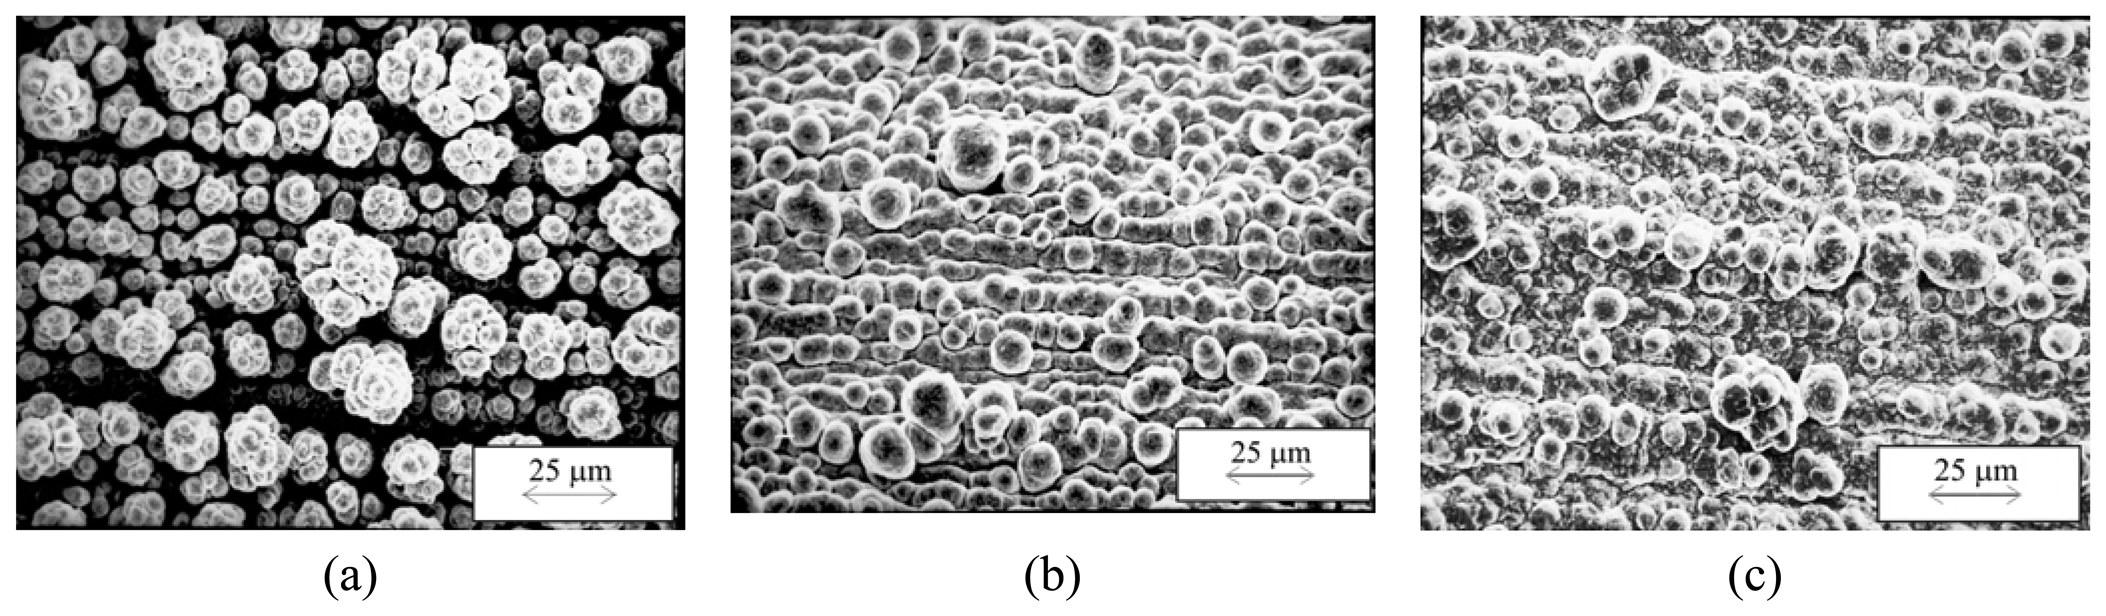
Figure 4 shows the morphologies of copper deposits electrodeposited at an overpotential of 550 mV from
solutions (I),
(II) and
(III) with a quantity of electricity of 10.0 mAhcm
−2. From
Figure 4a can be seen that the copper deposit obtained from
solution (I) had a cauliflower–like structure. Copper deposits obtained from
solution (II) (
Figure 4b) and
solution (III) (
Figure 4c) were globular structures.
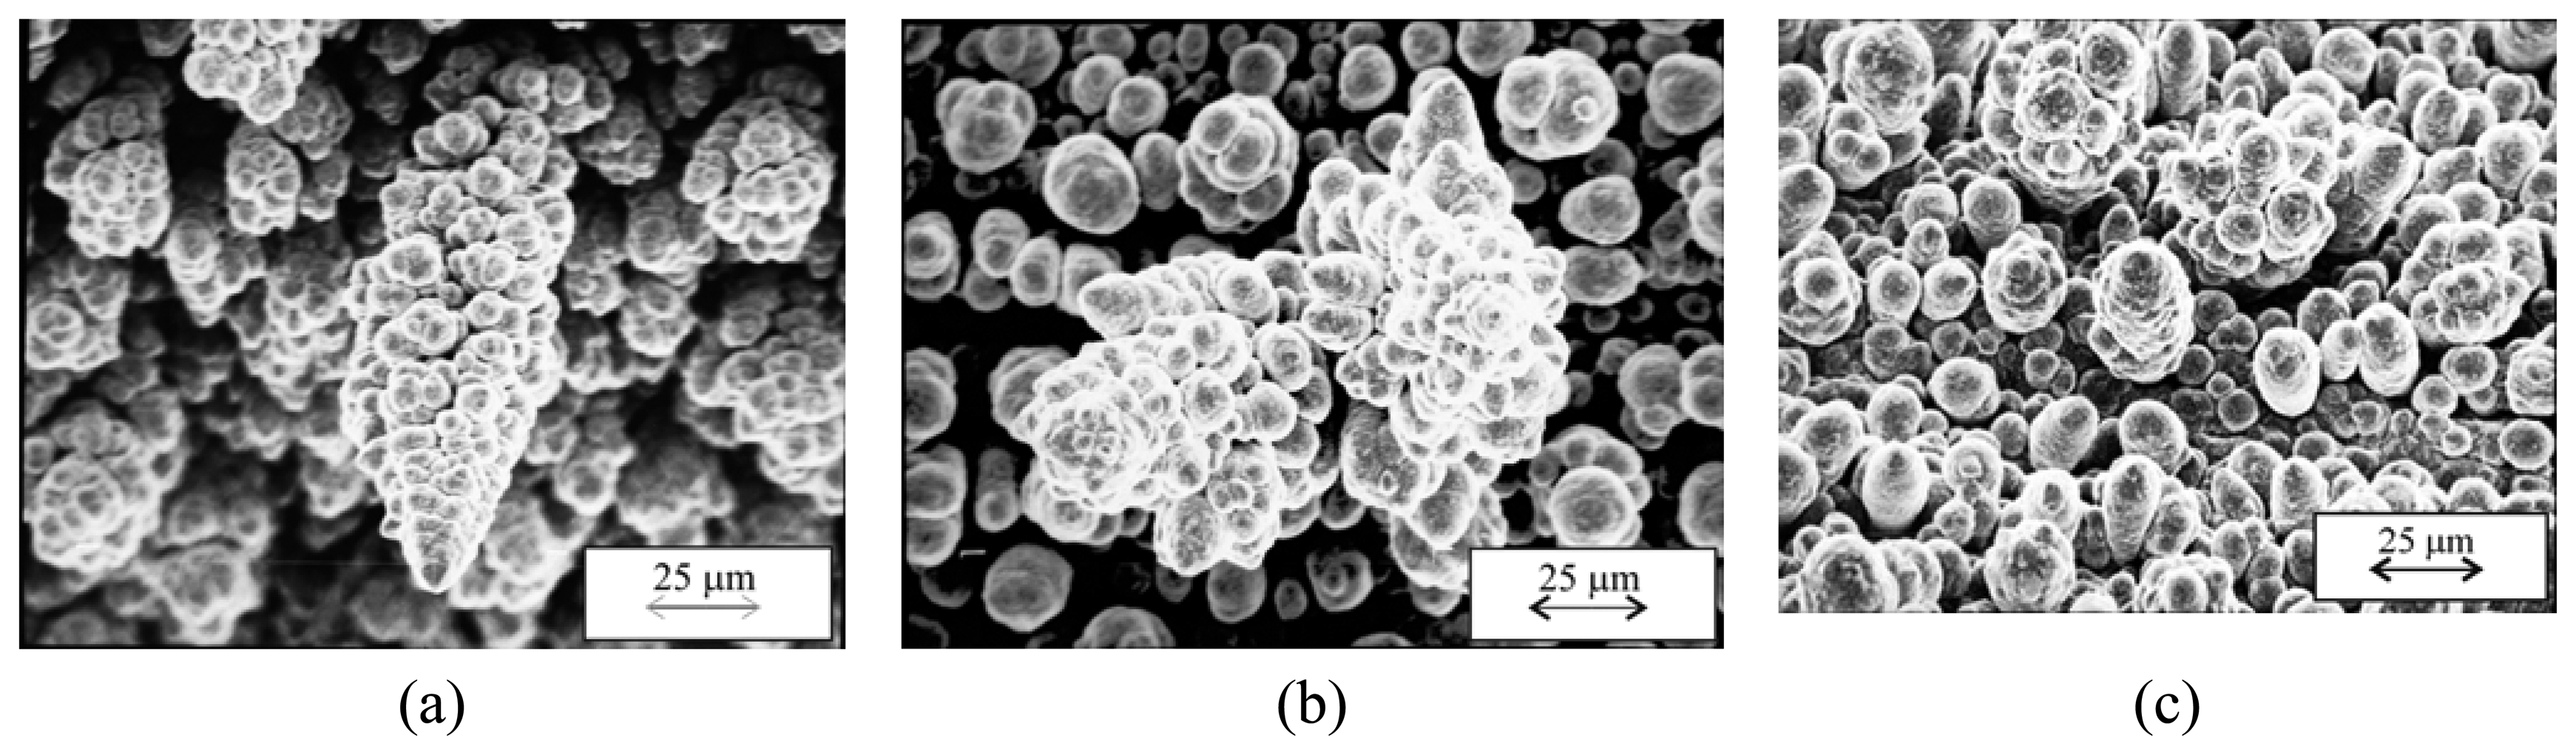
Electrodeposition of copper with twice the quantity of electricity led to a change in the morphology of copper deposits with respect to those shown in
Figure 4.
Figure 5 shows the morphologies of copper deposits obtained at overpotential of 550 mV with an amount of electricity of 20.0 mAhcm
−2. Copper dendrites instead of cauliflower–like forms were obtained during electrodeposition of copper from
solution (I) (
Figure 5a). A mixture of cauliflower–like and globular forms were obtained by electrodeposition from
solution (II) (
Figure 5b) and
solution (III) (
Figure 5c).
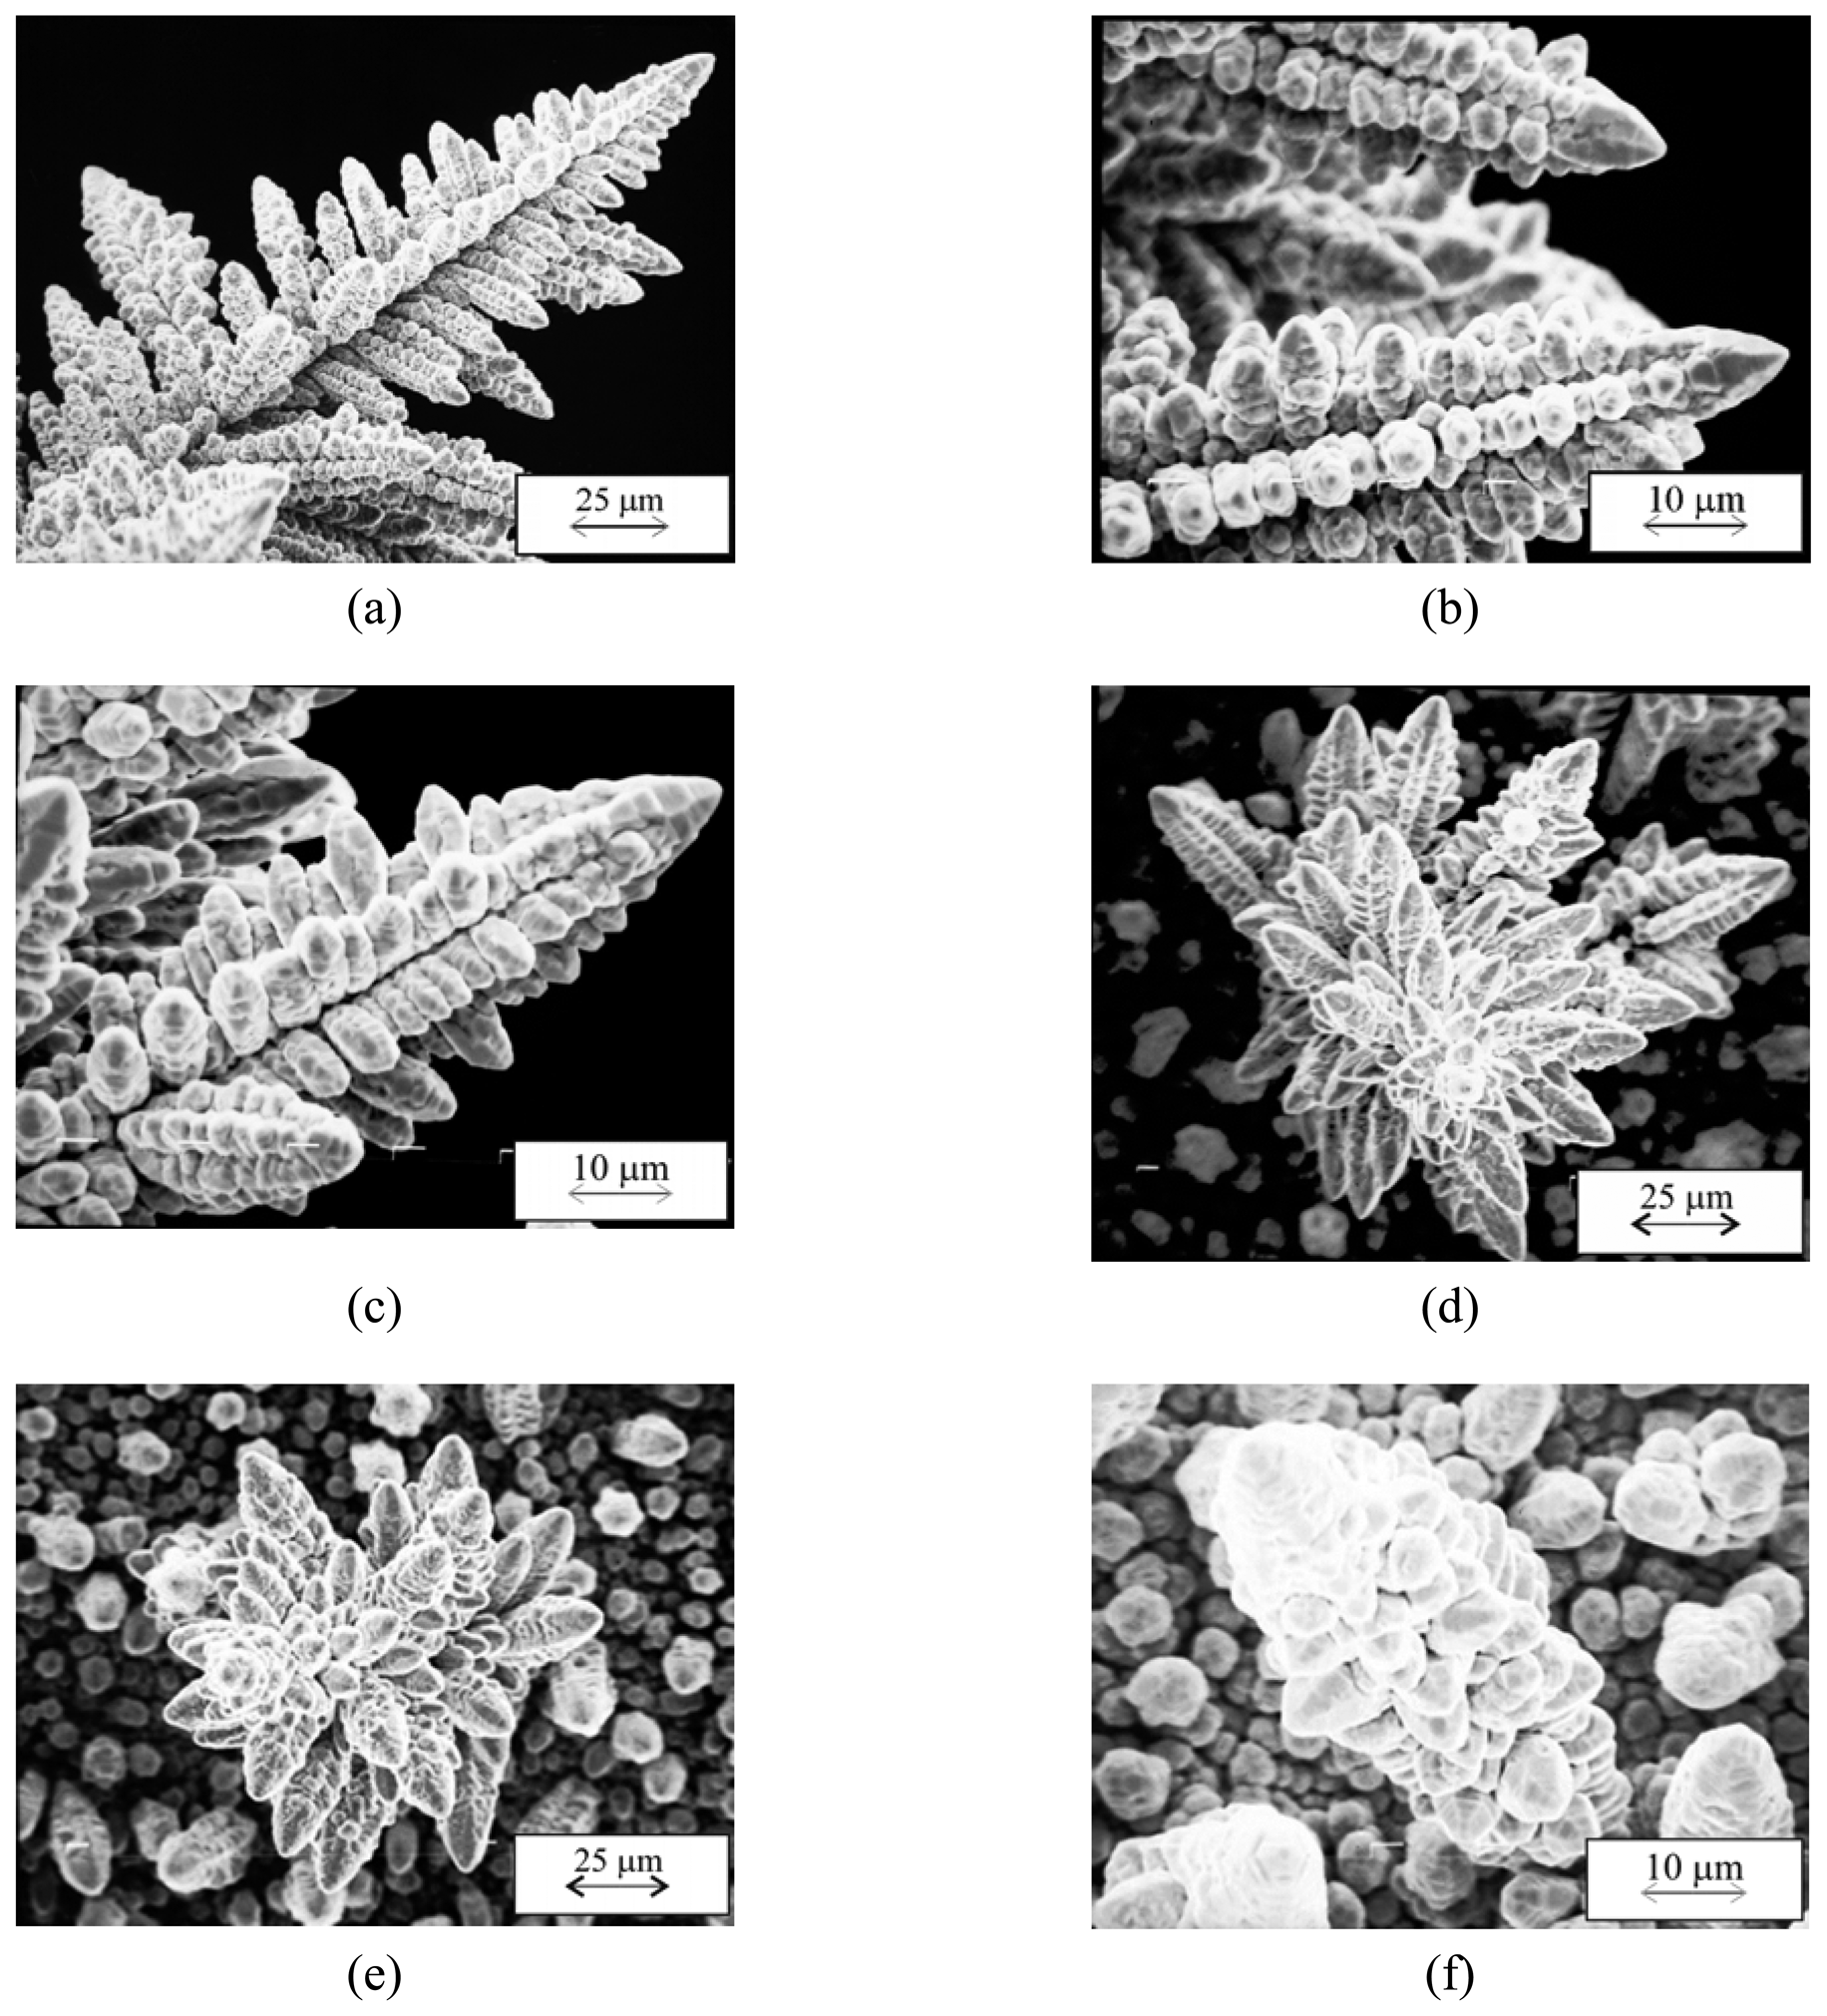
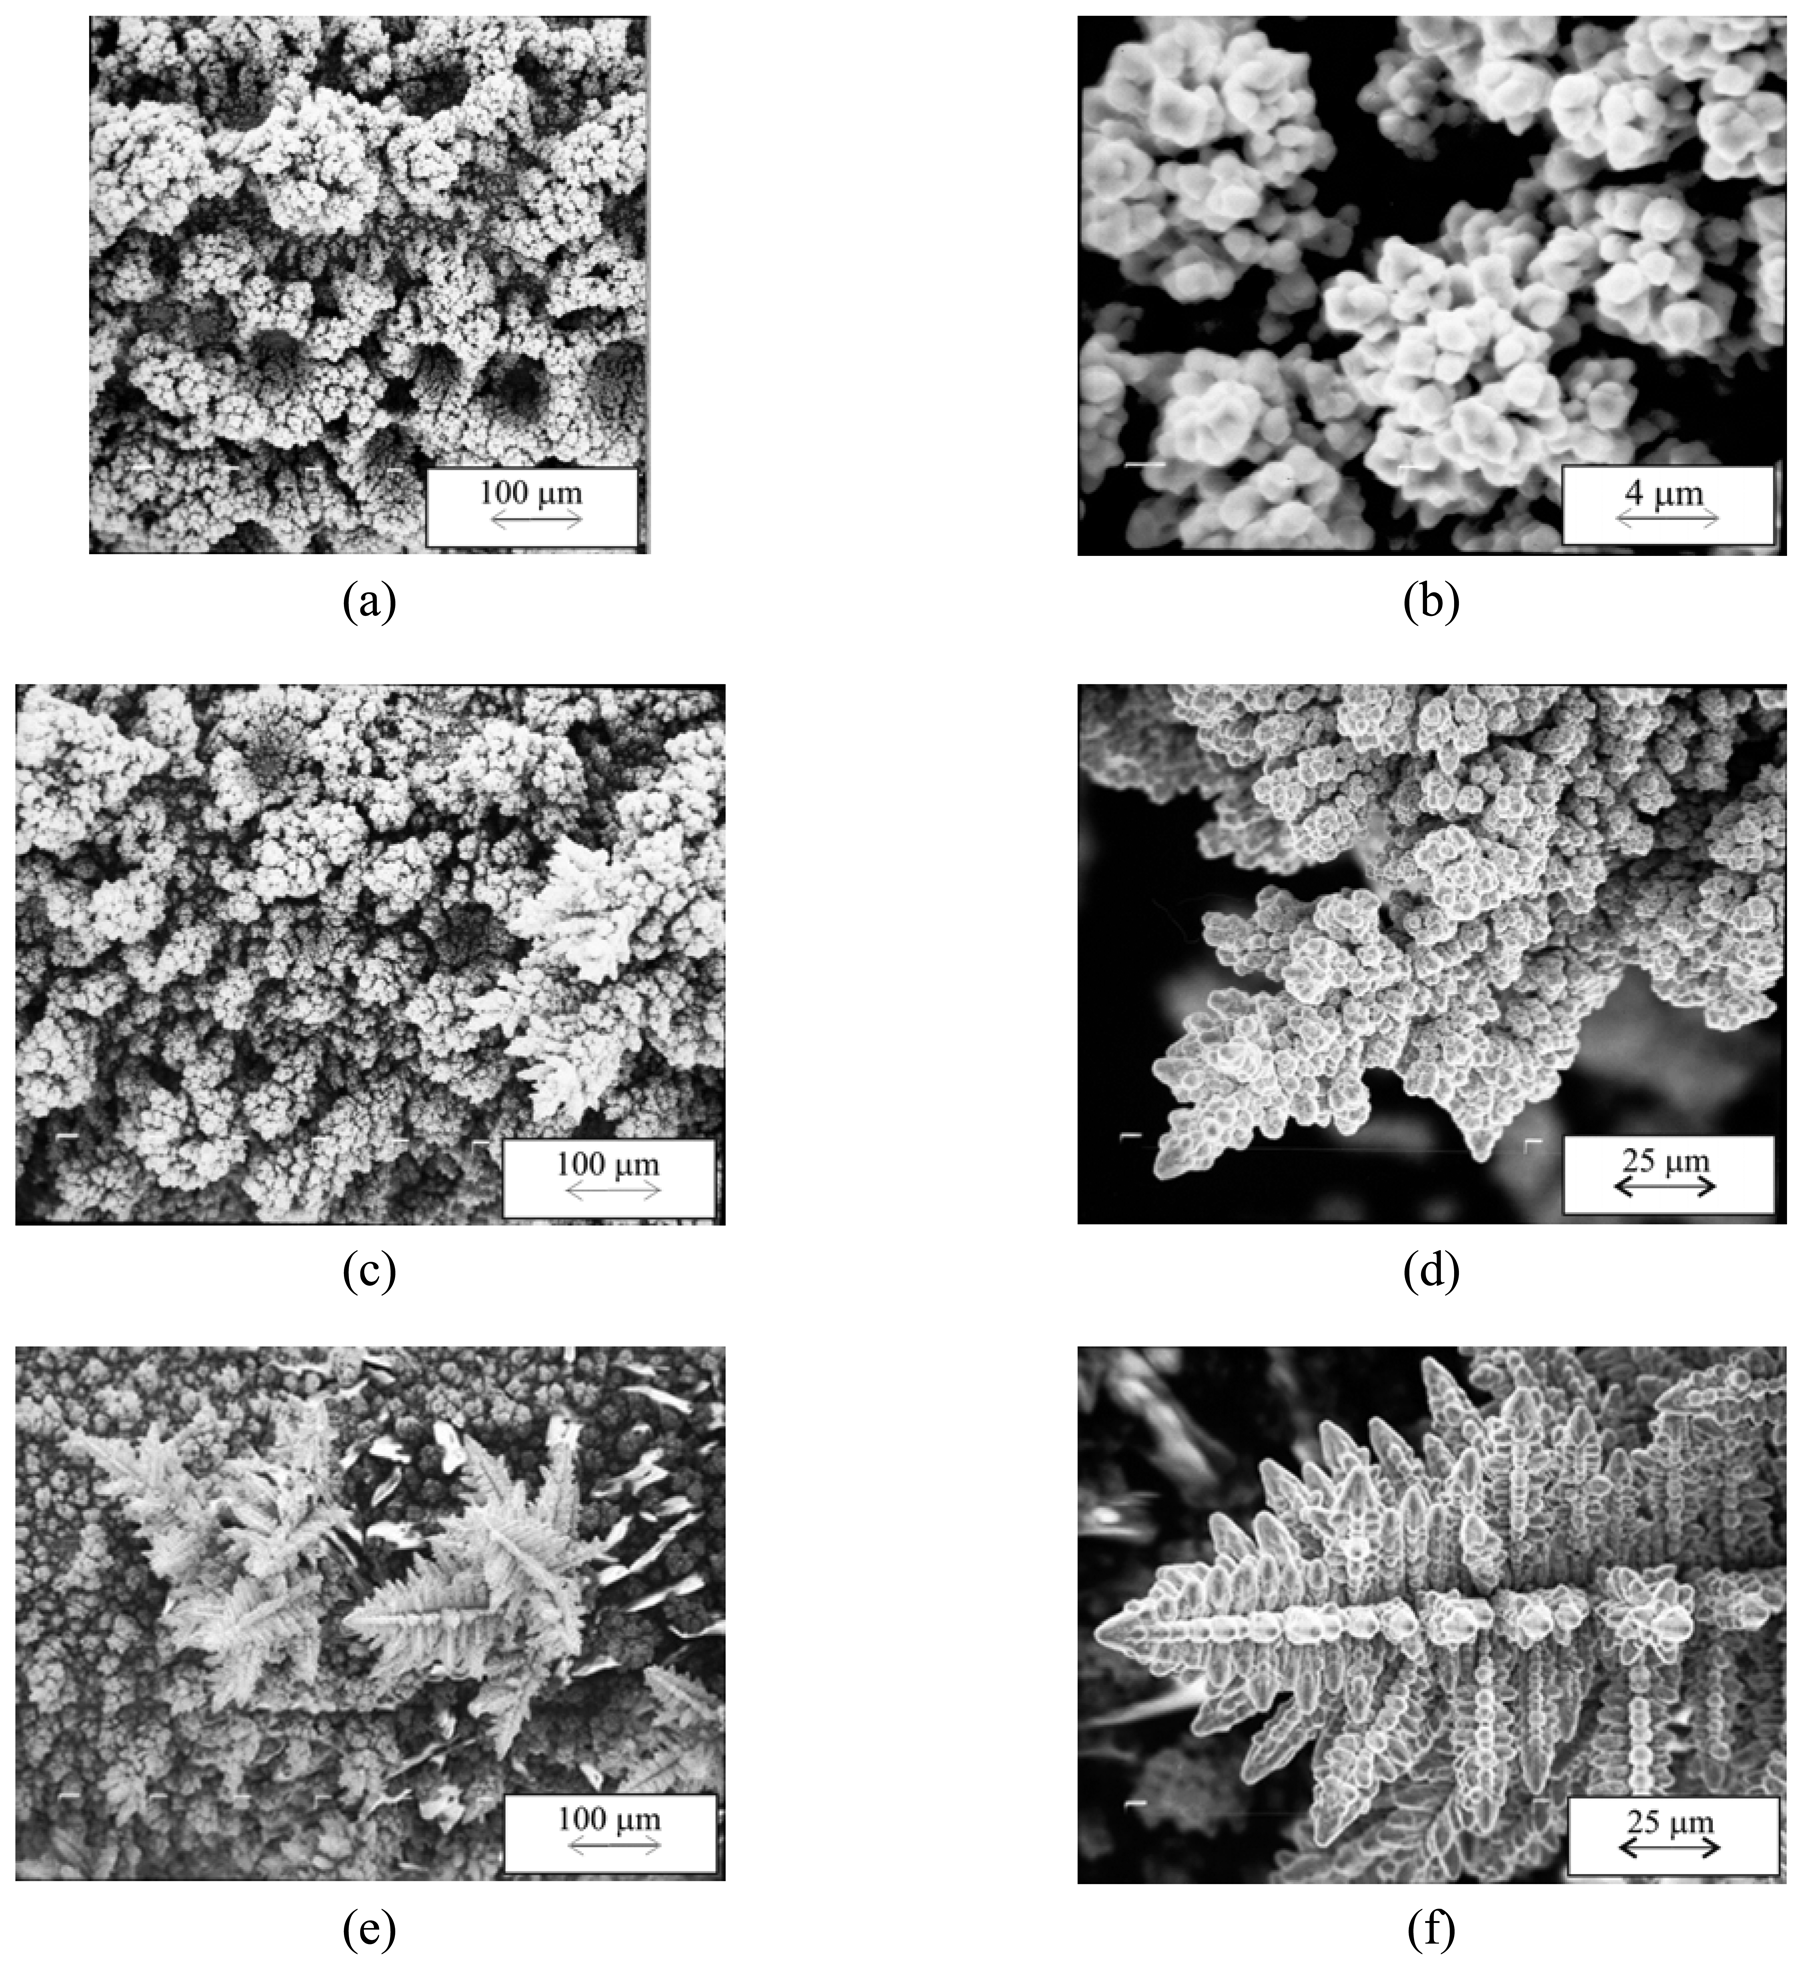
Copper dendrites are formed from all three solutions during electrodeposition processes at an overpotential of 650 mV with a quantity of electricity of 10.0 mAhcm
−2. However, from
Figure 6 it can be seen that the shape of copper dendrites depends strongly on the concentration of Cu(II) ions. Very branchy copper dendrites consisting of corncob–like elements were formed from
solution (I) (
Figures 6a and b). Copper dendrites formed from
solution (II) presented a mixture of very branchy dendritic forms (
Figure 6c) and those shaped like flowers (
Figure 6d). Finally, the copper deposits obtained from
solution (III) presented a mixture of flower–like (
Figure 6e) and corncob–like forms (
Figure 6f).
Figure 7 shows the morphologies of copper deposits obtained at an overpotential of 800 mV with a quantity of electricity of 10.0 mAhcm
−2, which reveals the strong effect of concentration of Cu(II) ions on copper electrodeposition at this overpotential.
The copper deposits obtained from
solution (I) had a very open and porous structure, and consisted of a large number of holes or craters formed due to the attachment of hydrogen bubbles (
Figure 7a) with agglomerates of relatively small copper grains between them (
Figure 7b).
The morphology of copper deposits obtained from
solution (II) mainly consisted of dendritic forms but the presence of holes formed due to the attachment of hydrogen bubbles can also be seen (
Figure 7c). The typical copper dendrites formed by the electrodeposition from this solution is shown in
Figure 7d.
Finally, only dendritic copper forms are obtained from
solution (III) (
Figures 7e and f). These dendritic forms were more branchy structures than those formed from the same solution by the electrodeposition at the overpotential of 650 mV and with the same quantity of the electricity (cf.
Figures 6e and f).
The careful analysis of the morphologies of copper deposits shown in
Figures 4,
5,
6 and
7 indicated that an increase in the concentration of Cu(II) ions led to a shift of the formation of characteristic morphological shapes of copper deposits towards higher electrodeposition overpotentials by about 100–150 mV. For example, copper dendrites formed at 800 mV from
solution (III) (
Figures 7e and f) were very similar to those obtained at 650 mV from
solutions (I) and
(II) (
Figures 6a – c). The globular forms obtained from
solutions (II) and
(III) (
Figures 4b and c) were very similar to ones obtained from 0.15 M CuSO
4 in 0.50 M H
2SO
4 at an overpotential of 450 mV [
7]. It is well known that cauliflower forms are characteristic of electrodeposition at overpotentials lower than the critical overpotential of dendritic growth initiation [
1]. The different shapes of copper dendrites formed at the overpotential of 650 mV from solutions with different concentrations of Cu(II) ions (
Figure 6) also pointed out the strong effect of concentration of Cu(II) ions on electrodeposition of copper at the overpotential of 650 mV.
3.3. General discussion of the results obtained
The strong effect of the concentration of Cu(II) ions on the electrodeposition of copper at high overpotentials can be explained in terms of the minimum overpotential for the initiation of dendritic growth, in the following way:
The minimum overpotential at which dendritic growth is possible, η
I, is given by
Equation (3) [
1]:
where η is the overpotential, b
c the cathodic Tafel slope,
iL is the limiting diffusion current density and
io is the exchange current density for the deposition process.
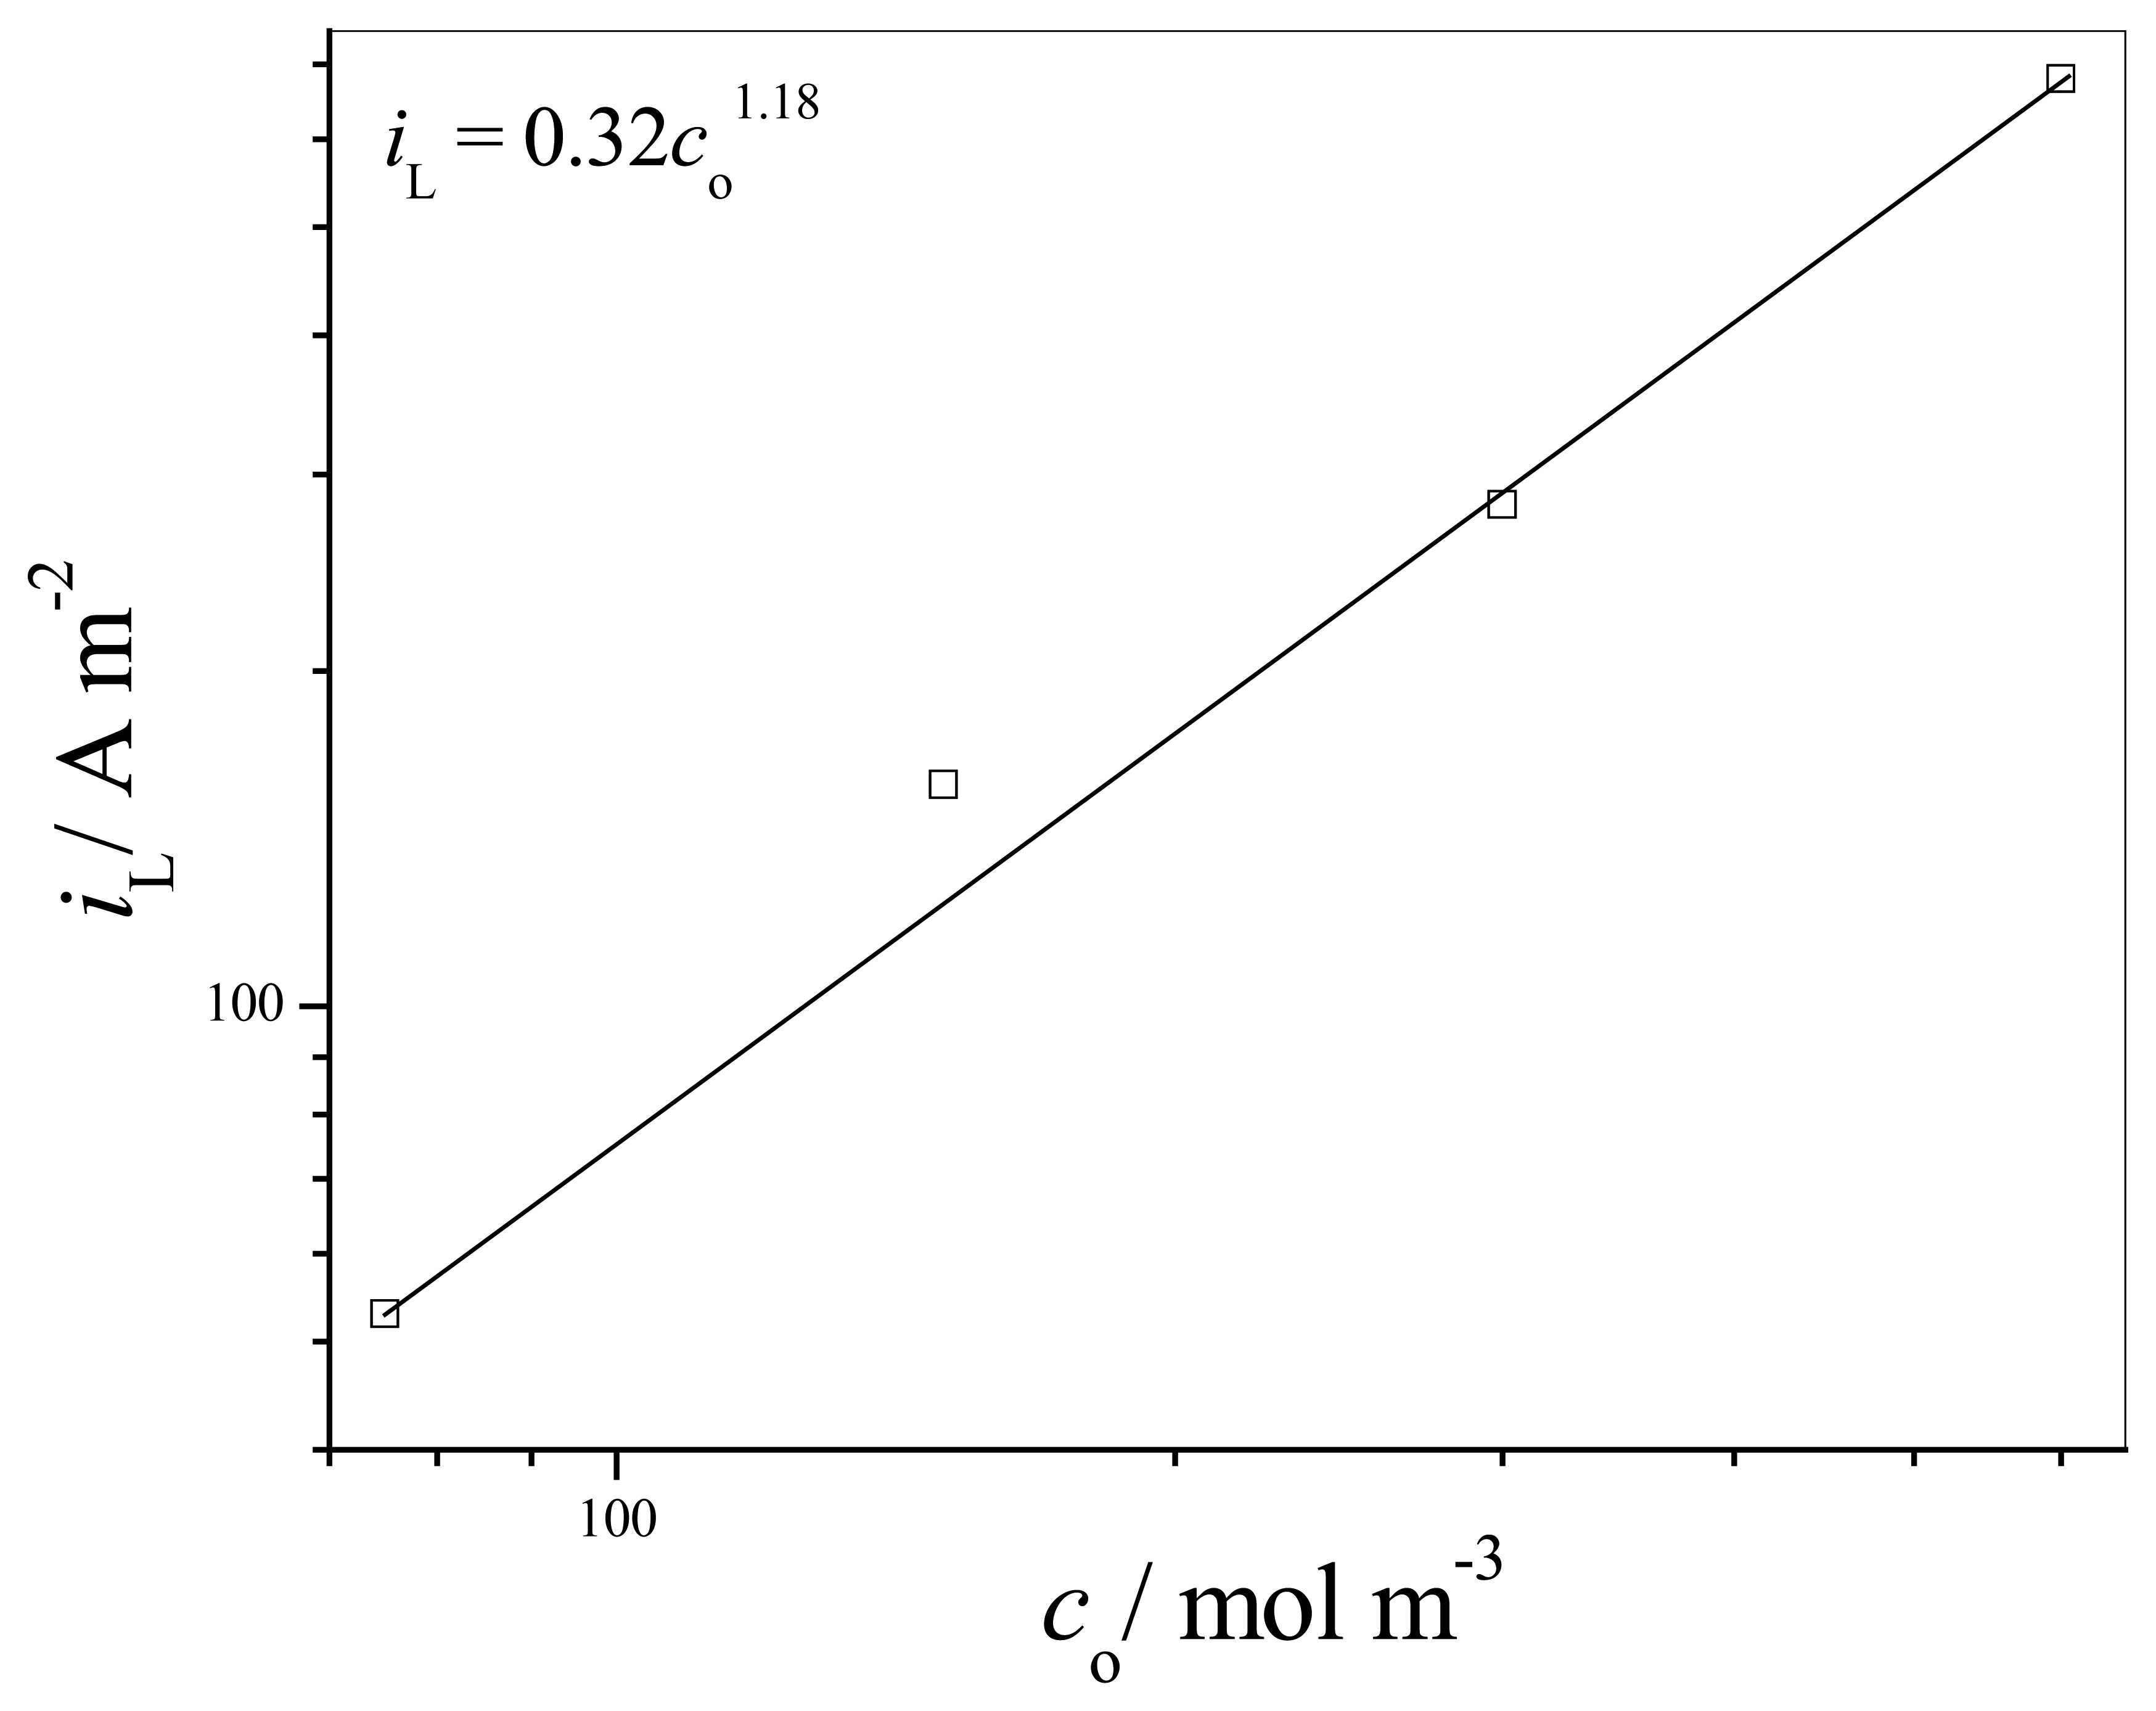
Figure 8 shows the dependence of logarithm of the limiting diffusion current density,
iL on the logarithm of the concentration of Cu(II) ions. From the obtained values of the slope and the intercept at the ordinate, it follows that the dependence of the limiting diffusion current density on the concentration of Cu(II) ions is given by
iL = 0.32
co1.18. On the basis of the slope value (1.18) it can be concluded that it is possible to apply Levich`s dependence of the limiting diffusion current density on the concentration of metal ions [
12].
According to Levich, in metal electrodeposition under natural convection,
iL varies with concentration as
where
co is concentration of Cu (II) ions.
This relation is valid under proper isothermal conditions [
13], when the temperatures of the thermostated solutions (with a free surface) and of the surrounding air are equal.
On the other hand, for copper electrodeposition from acid sulphate solutions the following expression is valid [
14]:
and b
c = 120 mV/dec.
Substitution of
i0 and
iL from
Eqs. (4) and
(5) in
Eq. (3) and further rearrangement gives that minimum overpotential for the initiation of dendritic growth depends on concentration of Cu(II) ions according to:
From this relation it can be easily seen how the increase of concentration of Cu(II) ions affects the formation of the copper deposit morphologies considered in this paper. According to this relation, the increase of concentration of Cu(II) ions increases the minimum overpotential for the initiation of dendritic growth. In our case, we can see that copper dendrites are formed by the electrodeposition at the overpotential of 550 mV with a quantity of the electricity of 20.0 mAhcm−2 only from solution (I). Electrodepositions from solutions (II) and (III) with the same quantity of the electricity did not lead to the formation of dendritic forms at this overpotential. On the other hand, the difference in the shape of copper dendrites formed at 650 mV pointed out that the minimum overpotential for the initiation of dendritic growth was lower from solution (I) than from solutions (II) and (III).
On the basis of the values of the average current efficiencies of hydrogen evolution reactions and the morphologies of copper deposits shown in
Figures 4,
5,
6 and
7, the correlation between the quantity of evolved hydrogen and the formation of different morphological forms of copper deposits can be made.
Copper dendrites were the main morphological form during electrodeposition processes which were accompanied by average current efficiencies of hydrogen evolution up to 7.5 %. The quantities of evolved hydrogen which corresponded to the average current efficiencies up to 7.5 % were insufficient to change the hydrodynamic conditions in the near–electrode layer, and to disarrange the diffusion layer thickness of the macroelectrode. The dominant processes are diffusion of ions from bulk solution to the electrode surface [
1].
On the other hand, craters or holes formed due to the attachment of hydrogen bubbles with copper grain agglomerates between them are obtained when the copper electrodeposition process was accompanied by an average current efficiency of hydrogen evolution of 42.2 % (
Figures 7a and b). The hydrogen evolution was vigorous enough to cause a stirring of the solution, thus decreasing the cathode diffusion layer thickness and increasing the limiting diffusion current density, and consequently, leading to a change of hydrodynamic conditions in the near–electrode layer. This copper structure presented the typical honeycomb–like structure. The formation of this structure was recently explained by the concept of “effective overpotential” [
7]. According to this concept, when hydrogen evolution is vigorous enough to change the hydrodynamic conditions in the near–electrode layer, the electrodeposition process takes place at an overpotential which is effectively lower than the specified one. For that reason, this overpotential is denoted as the “effective overpotential” of the electrodeposition process. Because of a change of hydrodynamic conditions caused by a vigorous hydrogen evolution the morphologies of deposits become, at a macro level, similar to ones obtained at some lower overpotentials where the hydrogen evolution does not exist. In our case, the morphology of the copper deposit shown in
Figure 7b (cauliflower forms) is similar to that obtained at some lower overpotentials before dendritic growth initiation (
Figure 4a). The honeycomb–like structures were obtained and electrodeposition processes observed from 0.15 M CuSO
4 in 0.50 M H
2SO
4 at overpotentials of 800 and 1000 mV, with average current efficiencies of hydrogen evolution of 10.8 and 30.0 %, respectively [
7]. In this case the critical value of the average current efficiency of hydrogen evolution which leads to the change of hydrodynamic conditions in near–electrode layer and the formation of honeycomb–like structure was estimated to be about 10.0 %.
However, it is obvious that due to their very open and porous structure, the honeycomb–like copper deposits fulfilled the conditions to be considered as possible electrodes in electrochemical devices such as solid oxide fuel cells and solid–state gas sensors. Hence, the critical conditions which must be fulfilled in order to obtain copper deposits suitable for these purposes by potentiostatic electrodeposition are: electrodeposition from acid copper sulphate solutions with lower concentrations of Cu(II) ions (0.15 M CuSO
4 and less for a concentration of supporting electrolyte of 0.50 M H
2SO
4), at overpotentials outside the plateau of the limiting diffusion current density at which the quantity of evolved hydrogen is enough to change hydrodynamic conditions in near–electrode layer. This quantity of evolved hydrogen corresponded to the average current efficiencies of hydrogen evolution above 10.0 %. Also, we note that the number of craters or holes increased with the quantity of evolved hydrogen, as can be seen from
Figure 9 which shows the dependence of the number of holes or craters formed due to the attachment hydrogen bubbles on the average current efficiencies for hydrogen evolution.
Figure 9 includes the value of the average current efficiency of hydrogen evolution of 68.7 % obtained from
solution (I) at overpotential of 1000 mV [
15]. This dependence of the number of holes per mm
2 surface area of copper electrode on the average current efficiency of hydrogen evolution clearly points out the fact that the more intense the hydrogen evolution, the more porous a copper structure is formed. Also, from
Figure 9 it can be seen that more porous structures (i.e. structures with larger numbers of holes formed by evolved hydrogen) are obtained by electrodeposition of copper from solutions with the lower concentrations of Cu(II) ions (0.075 M CuSO
4 in 0.50 M H
2SO
4 with respect to copper electrodeposited from 0.15 M CuSO
4 in 0.50 M H
2SO
4).


