1. Introduction
The Martian surface is mainly composed of a dusty regolith and a rocky surface. It contains a mixture of highly oxidized secondary minerals and relatively pristine basalts [
1]. Although recent works display evidence for igneous diversity and magmatic evolution on Mars [
2], most Martian lava is basalt. Basalts are composed of plagioclase, feldspar, clinopyroxene, olivine, plus/minus sheet silicates and occur primarily in the equatorial to mid-latitude southern highlands regions [
3]. Results from Mössbauer spectroscopy and X-ray fluorescence of dust particles captured from the Martian atmosphere by the magnets of the NASA's Mars Exploration Rovers show the presence of magnetite and olivine; this indicates a basaltic origin of the dust [
4].
The ultraviolet (UV) flux on the surface of Mars is mainly in the near UV (200-390 nm) because of absorption and scattering in the Martian atmosphere. The integral UV flux on the Martian surface in the range 190-390 nm is estimated to be ∼ 2 10
15 photons cm
−2s
− 1 [
5].
A measurement of the UV transmittance using a ∼100 μm layer of JSC-1 Mars simulant (palagonite) placed onto a quartz cover slip observed a decrease of the UV flux of at least an order of magnitude [
6]. The astrobiological implications of minerals on Mars surface were discussed in [
7]. The UV absorbance of snow and ice, present in the polar ice caps, is lower than for dust and rocks. The penetration of UV-C radiation (
λ = 190-280 nm) using a 254 nm source in Antarctic ice and snow was measured, showing 40% reduction of the UV-C flux at a depth of 1 cm and about 90% reduction at a depth of 5 cm ([
8] and ref. therein).
Basalt dust is one of the main components of the dusty regolith on Mars. The mean particle size of dust on the Martian surface is estimated to be a few μm [
8]. In this work, the transmittance on the near-UV of basalt dust is investigated. The measurement of the transmittance of basalt dust, as a function of depth, serves to estimate the protection from UV irradiation due to the Mars regolith, which can prevent microorganisms from the damaging effects of the UV flux.
Dust will inevitably deposit on the instrumentation sent to the surface of Mars. Therefore, the data presented here could serve for the calibration of UV sensors in future Mars missions.
2. Results and Discussion
Let us first recall the basic concepts used for the interpretation of the results. The intensity of a beam of electromagnetic radiation with frequencies between
ν and
ν +
dν is given by
I(ν) dν where
I(ν) is the spectral intensity. The total intensity is then given by
If the beam crosses a slide in the
z direction,
I(ν) decreases as
where
α(ν), the absorption coefficient, is characteristic of the material. Integration leads to Lambert-Beer's law:
where
I0(ν) is the incident spectral intensity and
l is the length of the slide. Taking the neperian and 10-logarithms we obtain
where
A(ν) is the absorbance of the slide. The transmittance
T(ν) is defined as
The absorbance is therefore related to the transmittance by
For the case of an electromagnetic beam crossing an area that is only partially covered by absorbing material of constant thickness
l,
Eq. 5 becomes
where
S is the total area crossed by the beam and
Sd is the area covered by the absorbing material. This formula is an approach to the case of the CaF
2 window partially covered by basalt dust, where
S corresponds to the total area of the CaF
2 window,
Sd is the area of the CaF
2 window covered by basalt dust, and it is assumed that the thickness
l of the dust layer over the area
Sd is constant, and zero where no dust is observed visually. The measurement of
Sd for each dust deposition was performed by taking a picture of the CaF
2 window partially covered with dust, and integrating the area with the use of commercial software (analySIS 3.0 from Soft Imaging System). The thickness is obtained using the expression
where
ρ = 0.82 g cm
-3 is the density that we obtained by weighting a cubic centimeter of the basalt dust.
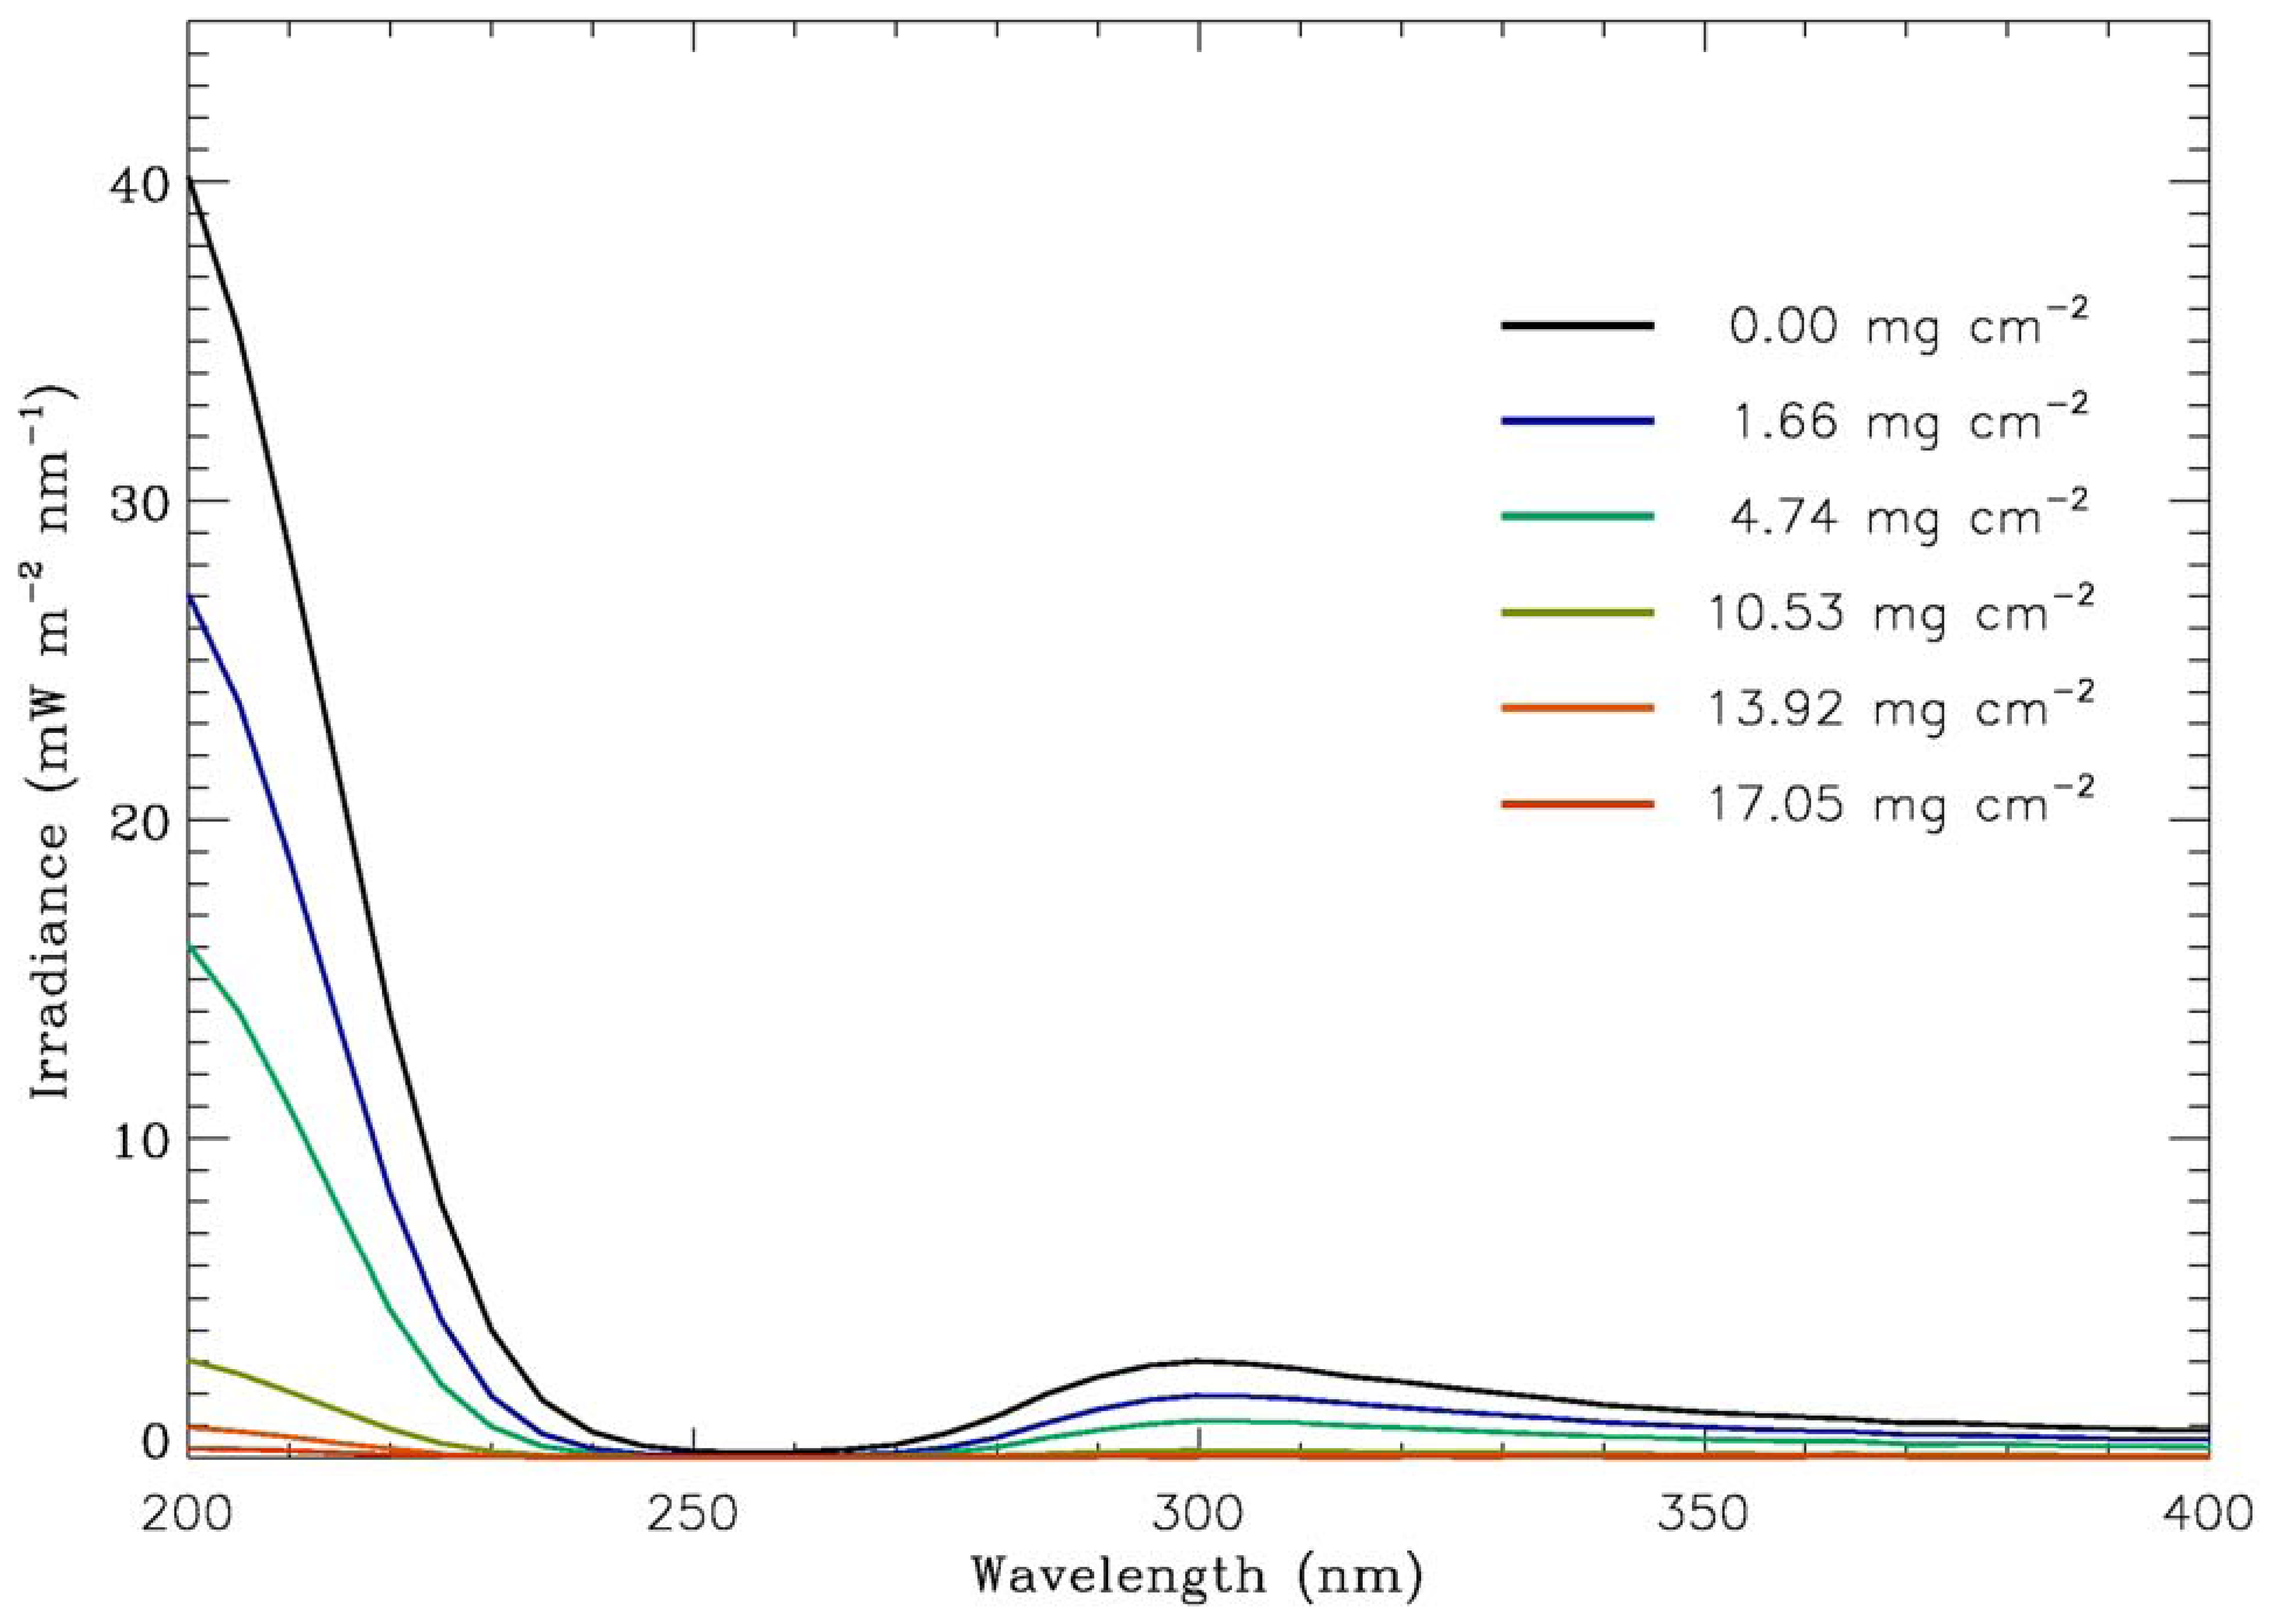
Fig.1 shows the UV transmittance spectra corresponding to different mass depositions of basalt dust.
The total intensities, given by
Eq. 1, in the range 200-400 nm (henceforth
I), correspond to the areas under the irradiance spectra in
Fig.1. The transmittance values, henceforth
Tmeasured, were obtained using
Eq. 3, where
I0(ν) was substituted by the
I value for 0.0 mg cm
-2 and
I(ν) by the value of
I for the different dust depositions. Inserting the values of
Tmeasured and
l, the latter was obtained from
Eq. 8, together with the
Sd/
S ratio, we can calculate the value of
α(ν) in the 200-400 nm range. Finally, substituting the value of
α(ν), henceforth
αdust, in
Eq. 4 provides the values for the absorbance of the dust,
Adust, which in term can be expressed as the transmittance values,
Tdust, using
Eq. 6. It is important to note that
Adust and
Tdust correspond to the simple case where the CaF
2 window is completely covered by basalt dust with a layer of constant thickness
l, i.e.
Sd =
S and
The values of the experimental parameters for the range 200-400 nm, described above, are given in
Table 1.
The absorption coefficient,
α(ν), should be constant for a given material at a given wavelength. The value
αdust = 0.027 μm
-1 is the most reliable, as it corresponds to depositions where the CaF
2 window is almost fully covered by basalt dust (
Sd/
S = 0.95-0.99). The smaller
Sd/
S, the larger the errors introduced in the calculation of
αdust, which might explain the large deviation of the
αdust value for the lowest dust density, 1.66 mg cm
-2 and
Sd/
S = 0.41. The lower value of
αdust for mass density 17.05 mg cm
-2 is due to the fact that the dust thickness corresponding to
Tdust = 0.0 was already reached for 13.92 mg cm
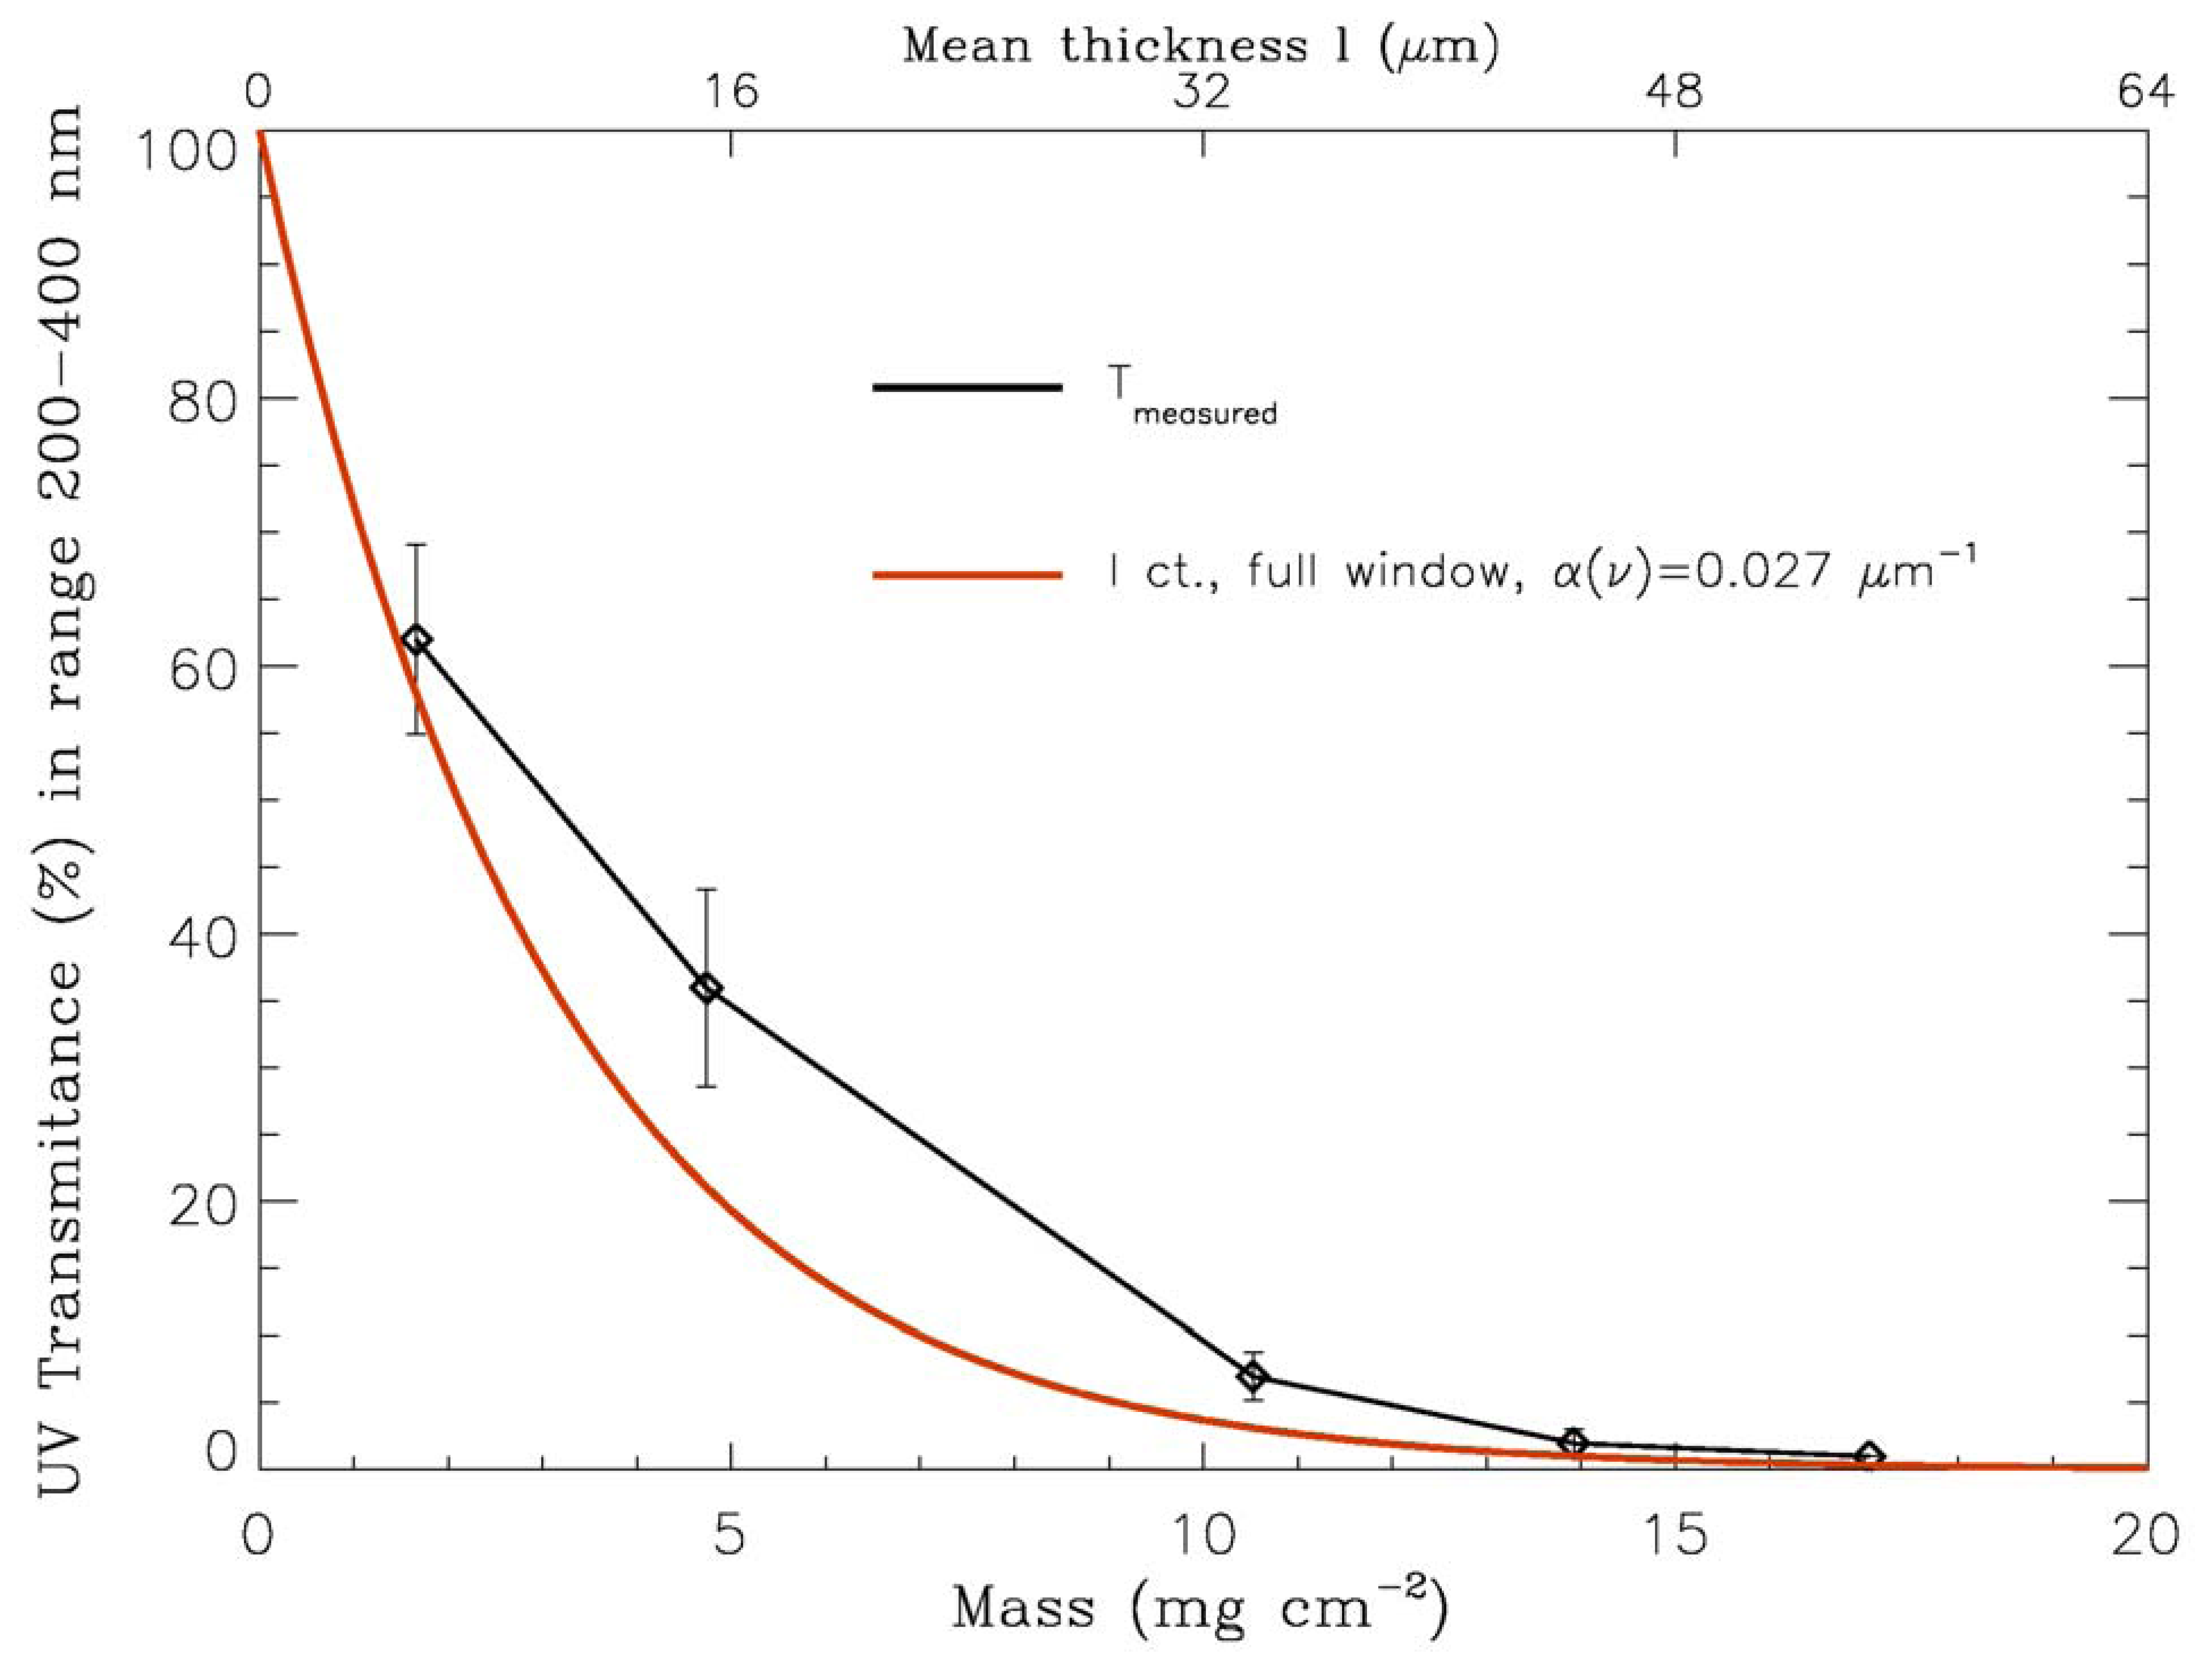
-2 or 171 μm. The values of
Tmeasured correspond to the data points in
Fig. 2. The error bars result from the expression
, where
σ is the standard deviation and
n=3 the number of data points measured for each mass density.
The transmittance curve as a function of dust mass density (in mg cm
-2, red trace in
Fig.2) was obtained for the case of a window fully covered by basalt dust of 5 μm particle size, with uniform dust thickness
l (equivalent to uniform dust mass density), using
Eq. 9 for
αdust = 0.027 μm
-1. This value of
αdust corresponds to the near-UV range,
λ = 200-400 nm. However,
Fig.1 shows that there is little dependence of the basalt dust transmittance with wavelength in the observed
λ = 200-400 nm range, and therefore the value of
αdust is similar for a specific wavelength within that range.
In conclusion, as an application to UV sensor calibration, the effect of dust absorption deposited on UV sensors, aiming to measure the UV flux on the surface of Mars, can be accounted for using
Eq.9 with
αdust = 0.027 μm
-1 (red curve in Fig.2), for the case of a basalt dust layer with known uniform thickness or deposited mass density. For instance, it is found that a basalt dust layer of ∼1.1 μm thickness reduces the transmittance from 100 to 97%, that is, introduces an error of 3% on the determination of the UV flux on the surface of Mars. Transmittance drops to 1% at ∼170 μm depth, and to 0.1% at ∼256 μm depth. The flux at the surface of Mars at 250 nm is thought to be ∼3000 times greater than that on Earth [
8]. Such a reduction of the flux corresponds to a basalt dust thickness of ∼300 μm. Microorganisms living at such depths would be preserved from the damaging effects of UV irradiation on Mars surface. Future experiments will aim at providing the value of
αdust for other components of the Martian regolith.
For future missions aiming to measure the UV flux on the surface of Mars it is also relevant to have an estimation of the UV absorption on top of the UV detector due to dust deposition as a function of time. If the UV detector is positioned more than 20 cm above the surface, the sand and dust lifted from the surface by wind can be avoided [
9]. According to this author, accumulation by settling of the dust suspended in the atmosphere occurs at a rate of
Sd/
S = 0.0036 per day, i.e. 0.36% of the surface is covered in one day, for a cross-section weighted average particle radius of
rc=2.75 μm (he also indicates that in the best case, corresponding to the lowest dust deposition, the surface covered by dust is 0.03% per day, and in the worst case 2.9% per day). These values can be inserted in
Eq. 7 to obtain the decrease in the transmittance as a function of time. For instance, assuming the worst case (after substitution of the values
Sd/
S = 0.029 per day,
αdust = 0.027 μm
-1, and
l=2
rc=5.5μm in
Eq. 7) the estimated transmittance value is 99.6% after one day; a dust layer fully covering the sensor with a 5.5μm average thickness would accumulate in 34.5 days, which corresponds to a transmittance value of 86%, and evidences the need of a device to remove the dust periodically. Such a device is also required for the normal case where 86% transmittance (one dust layer) is attained after 278 days, but not for the best case since an 86% transmittance corresponds to 9 years. A dust deposition of 300 μm thickness (55 dust layers) equivalent to near-zero- transmittance, would require about 5 years in the worst case scenario. However, the real case differs from a constant deposition rate: as observed by NASA's Mars Exploration Rovers wind events take place in the scale of months and were found to remove a large fraction of the deposited dust, while dust storms will deposit dust at higher rates than usual.
4. Experimental Section
The experiments were performed in a planetary simulation chamber [
10,
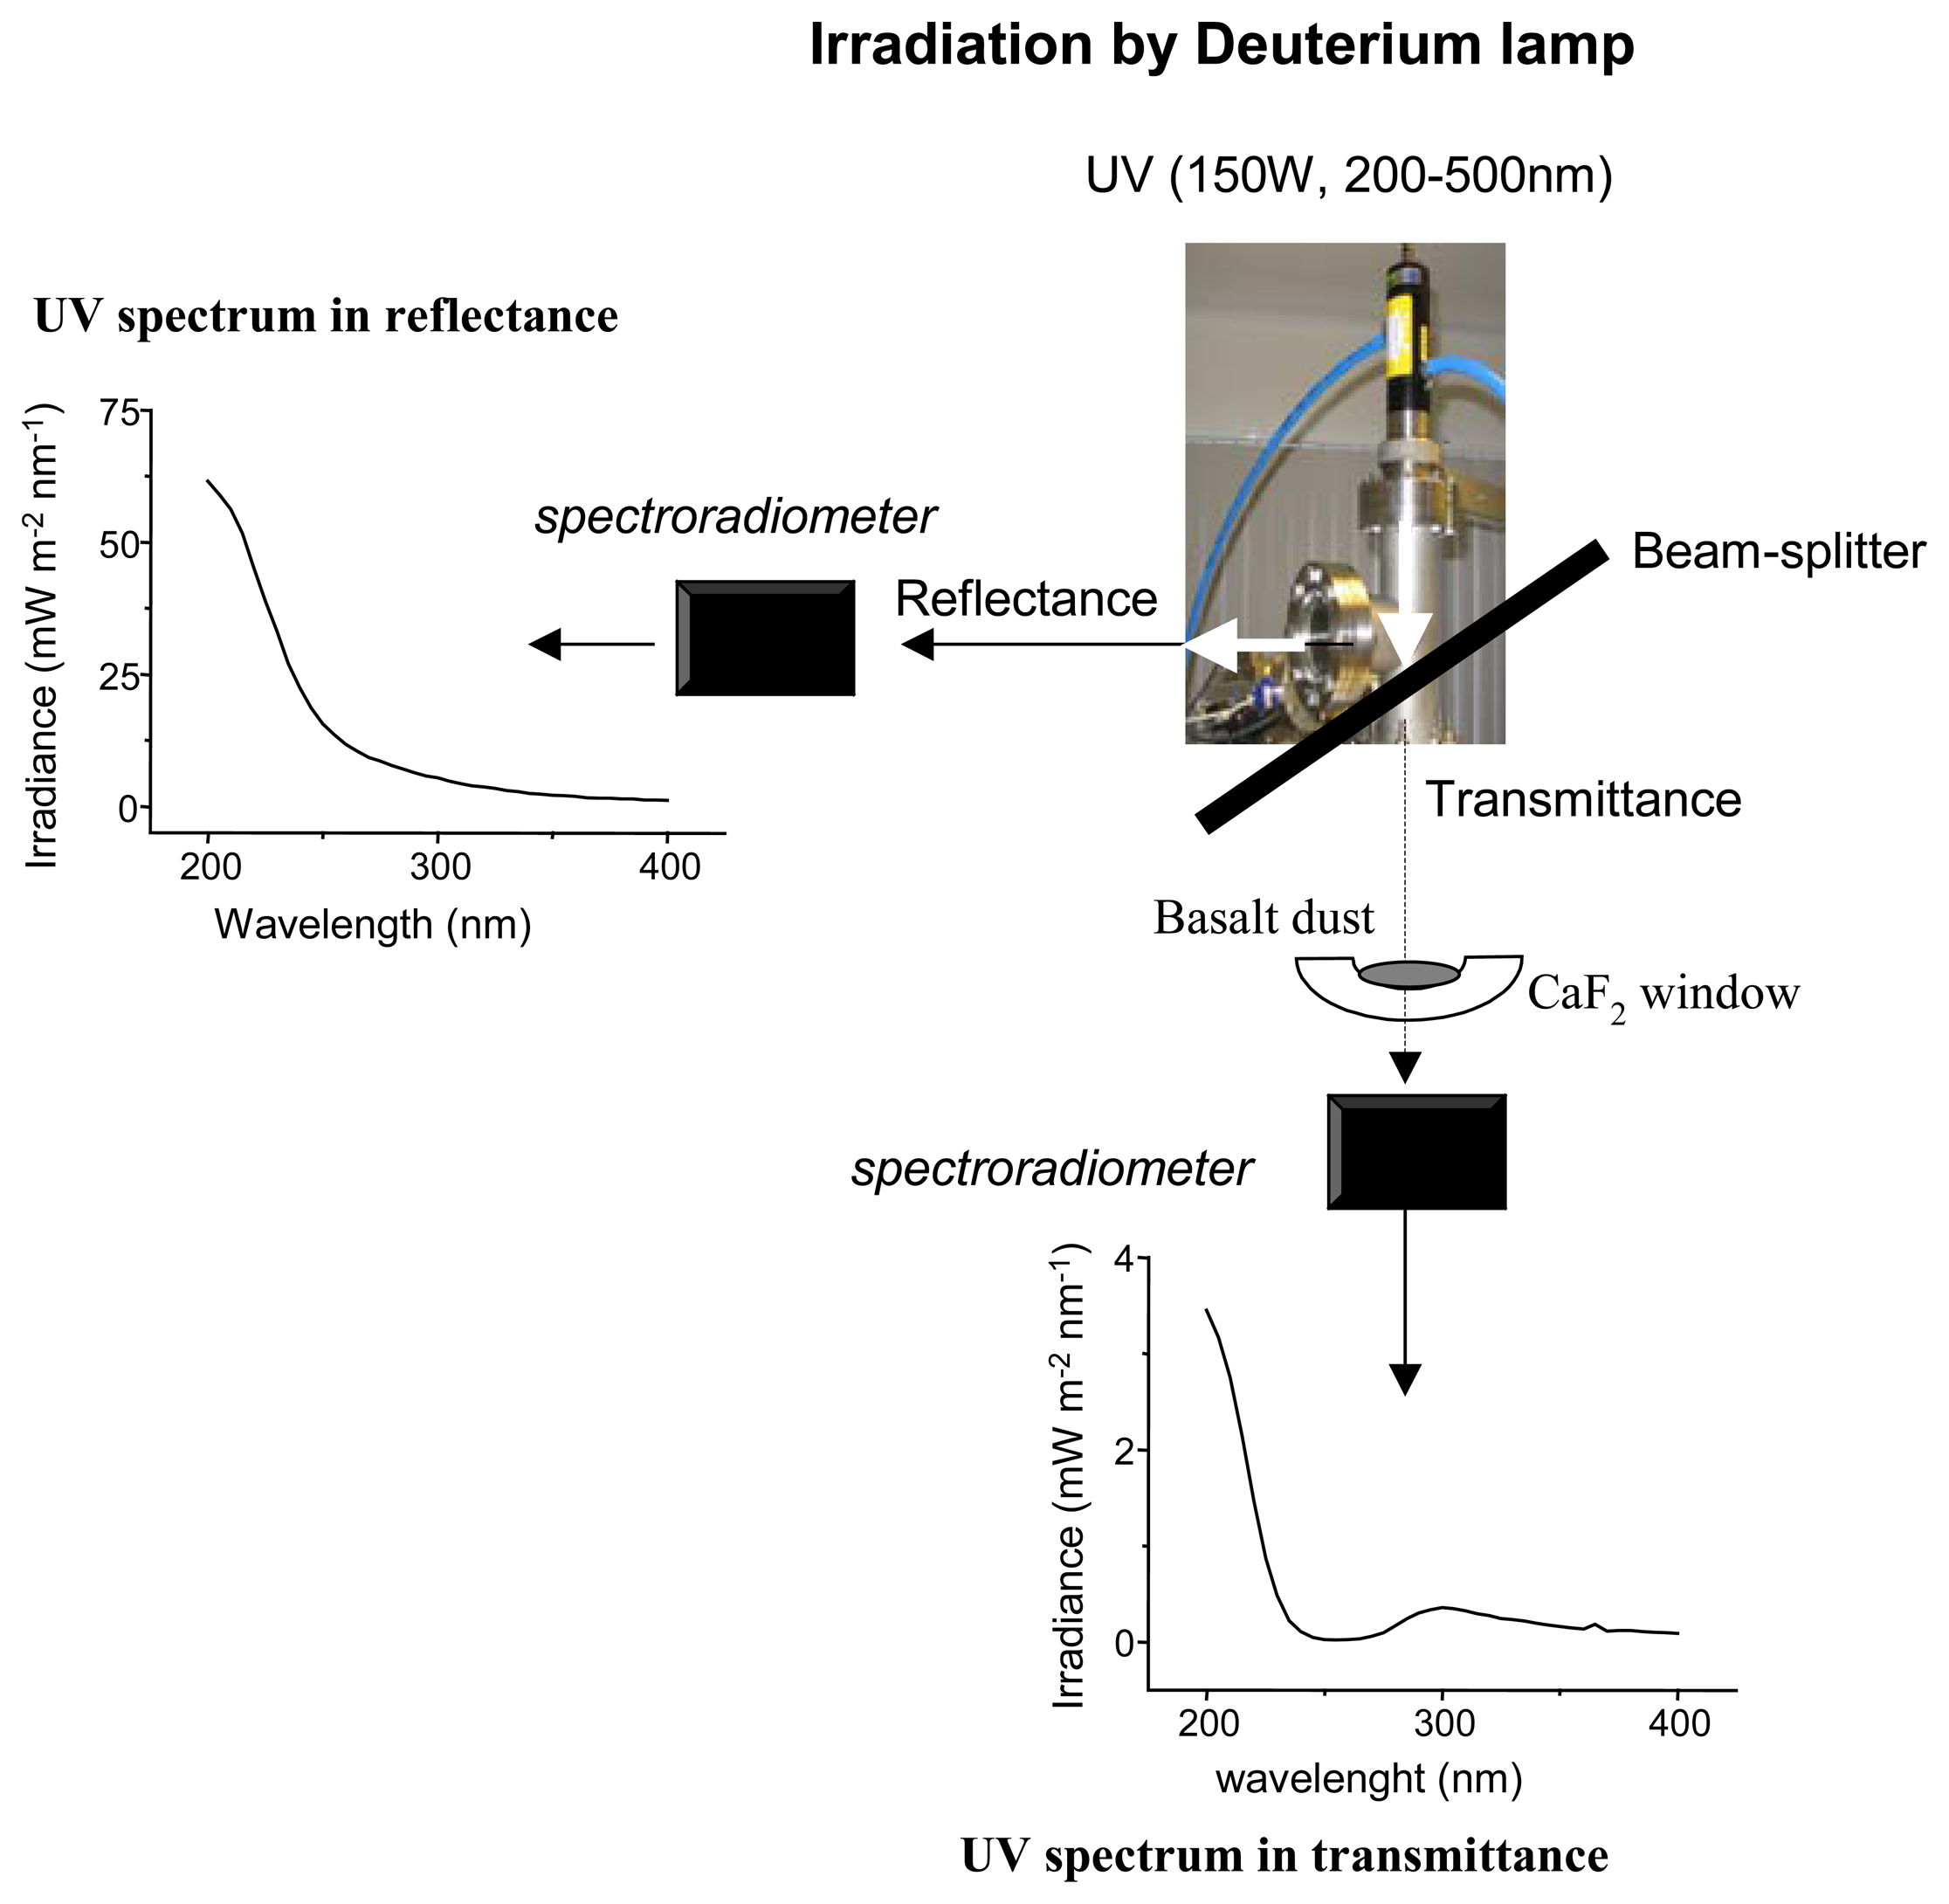
11], able to reproduce the atmospheric and surface temperature conditions of planetary objects. This experimental set-up, see
Fig. 3 for a schematic view, makes feasible the in-situ irradiation and FTIR characterization of the sample under study. Our experiments have been carried out at room temperature under atmospheric pressure, due to the constraint to work with small dust size particles under low pressure conditions. This led to a decrease of the incident UV flux caused by ozone (O
3) absorption. Indeed, O
3 is formed by UV irradiation of O
2 for λ < 240 nm. During photo-dissociation O
3 absorbs UV light between 200 and 320 nm with maximum at 254 nm ([
11], and ref. therein). UV absorption due to atmospheric O
3 is also expected to occur on Mars.
Basalt dust, with a mean particle size of ∼5 μm, was deposited on a near-UV transparent CaF
2 window of 21 mm diameter, with the use of a sieve. From the geochemical point of view, ICP-MS analysis of the sample indicates that we used typical standard basalt. Irradiation was performed by means of a 150 W water-cooled deuterium UV lamp (Hamamatsu C3150), placed perpendicular and above the CaF
2 window, with stable emission in the range 200-400 nm (6.2-3.1 eV). The irradiance spectrum of the deuterium lamp is a continuum that decreases for increasing photon wavelength (
Fig.3, UV spectrum in reflectance); it was monitored during irradiation using a spectroradiometer (Bentham DMc150FC), placed underneath the CaF
2 window. The UV flux measured at sample position, obtained by integration of the irradiance over the 200-400 nm wavelength range is F = 2270 mW m
-2, which corresponds to F = 2.3 10
14 (6 eV photons) cm
-2 s
-1, about 10 times lower than the UV flux on the Martian surface (Sect.1).


