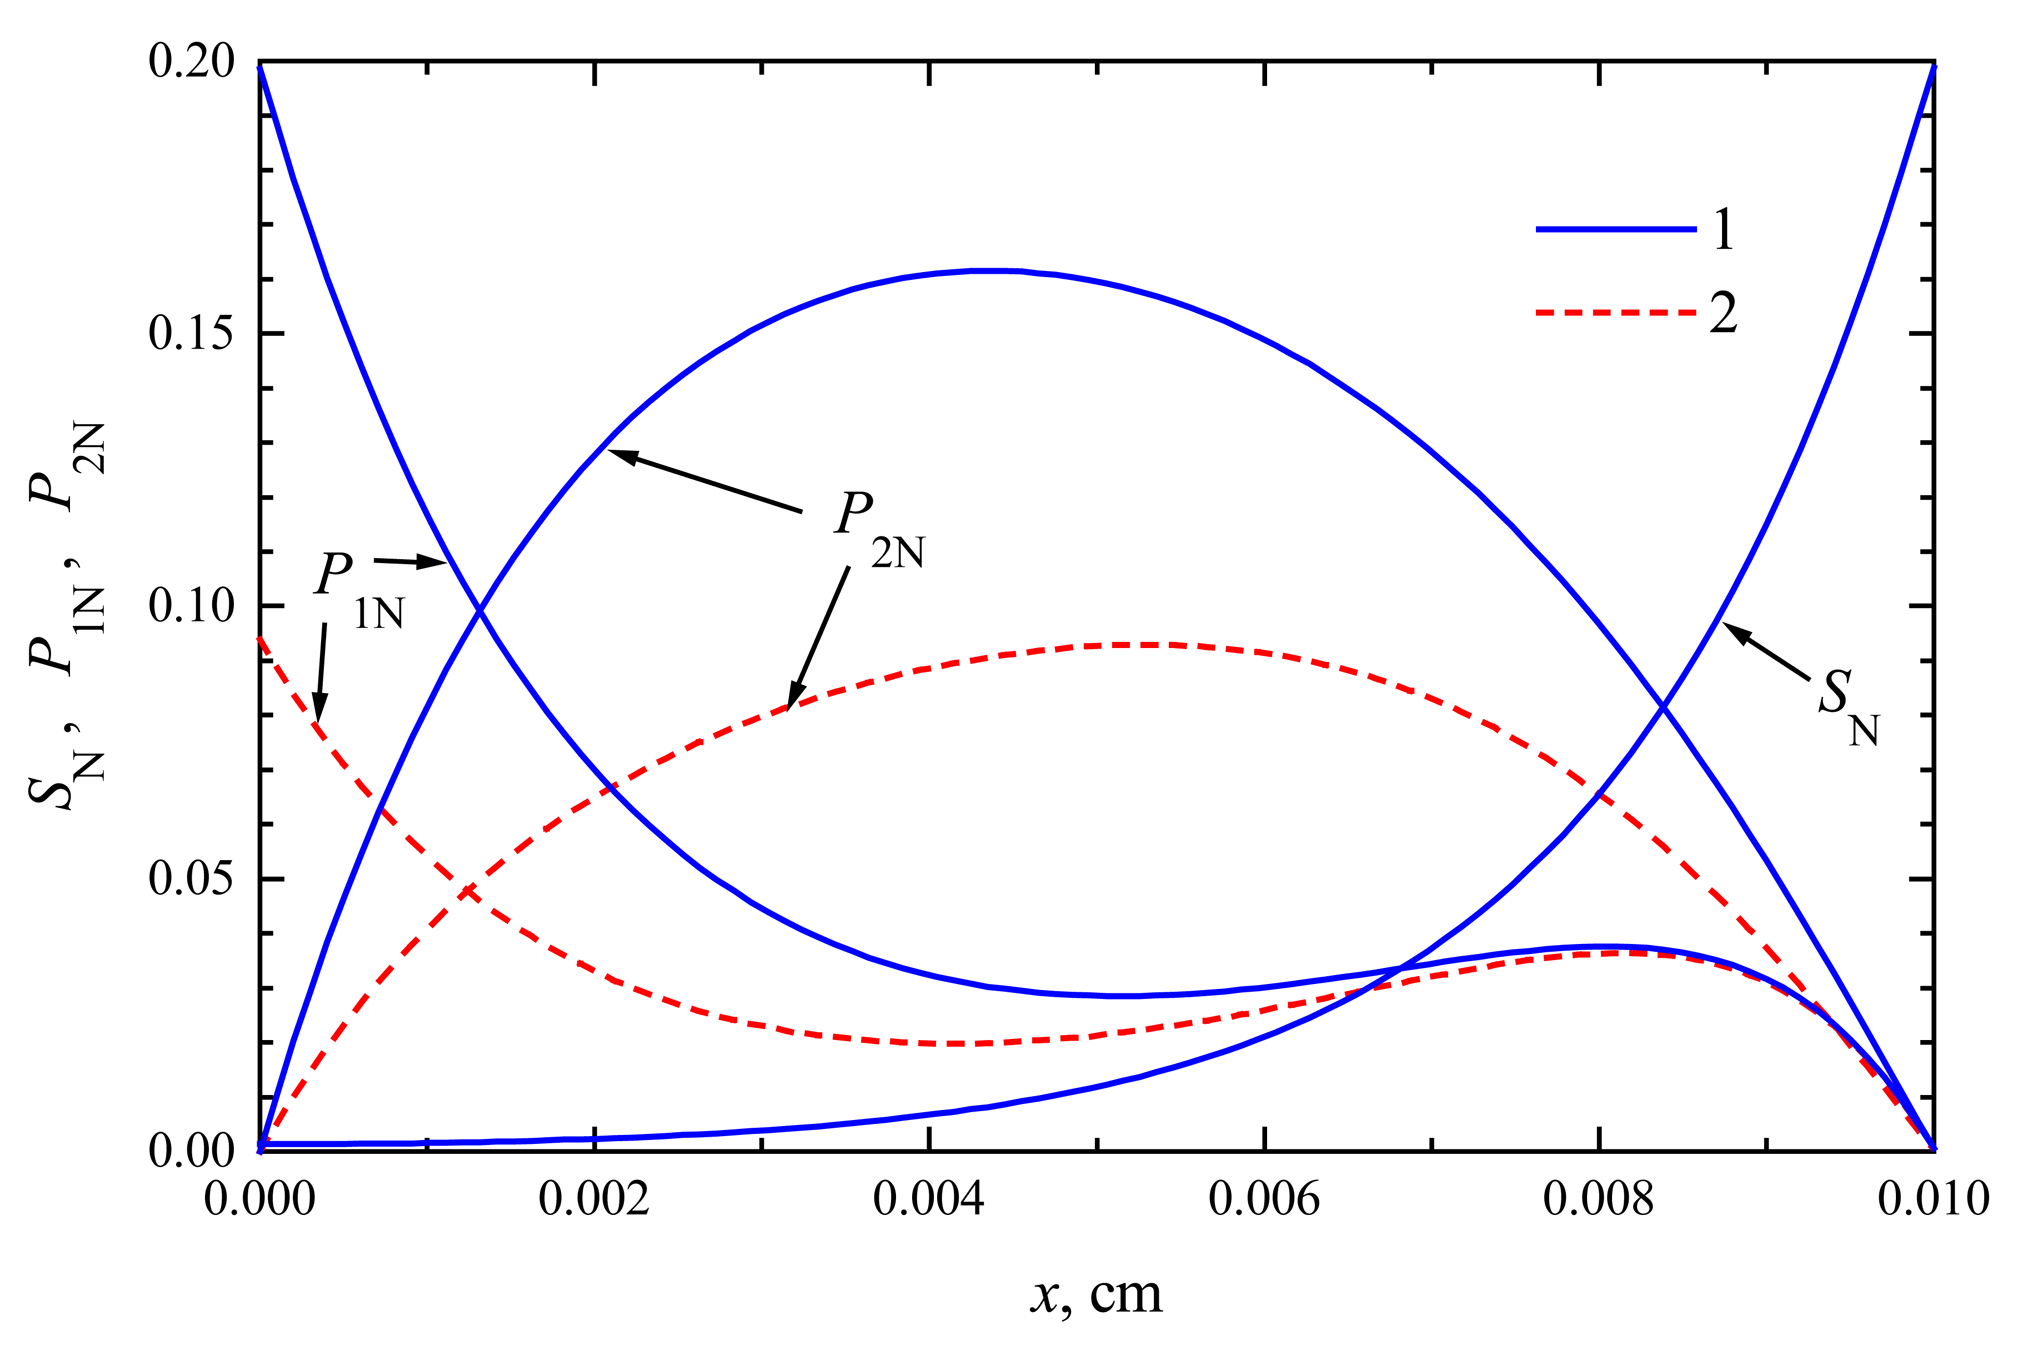
The compounds concentration in the enzyme membrane
In
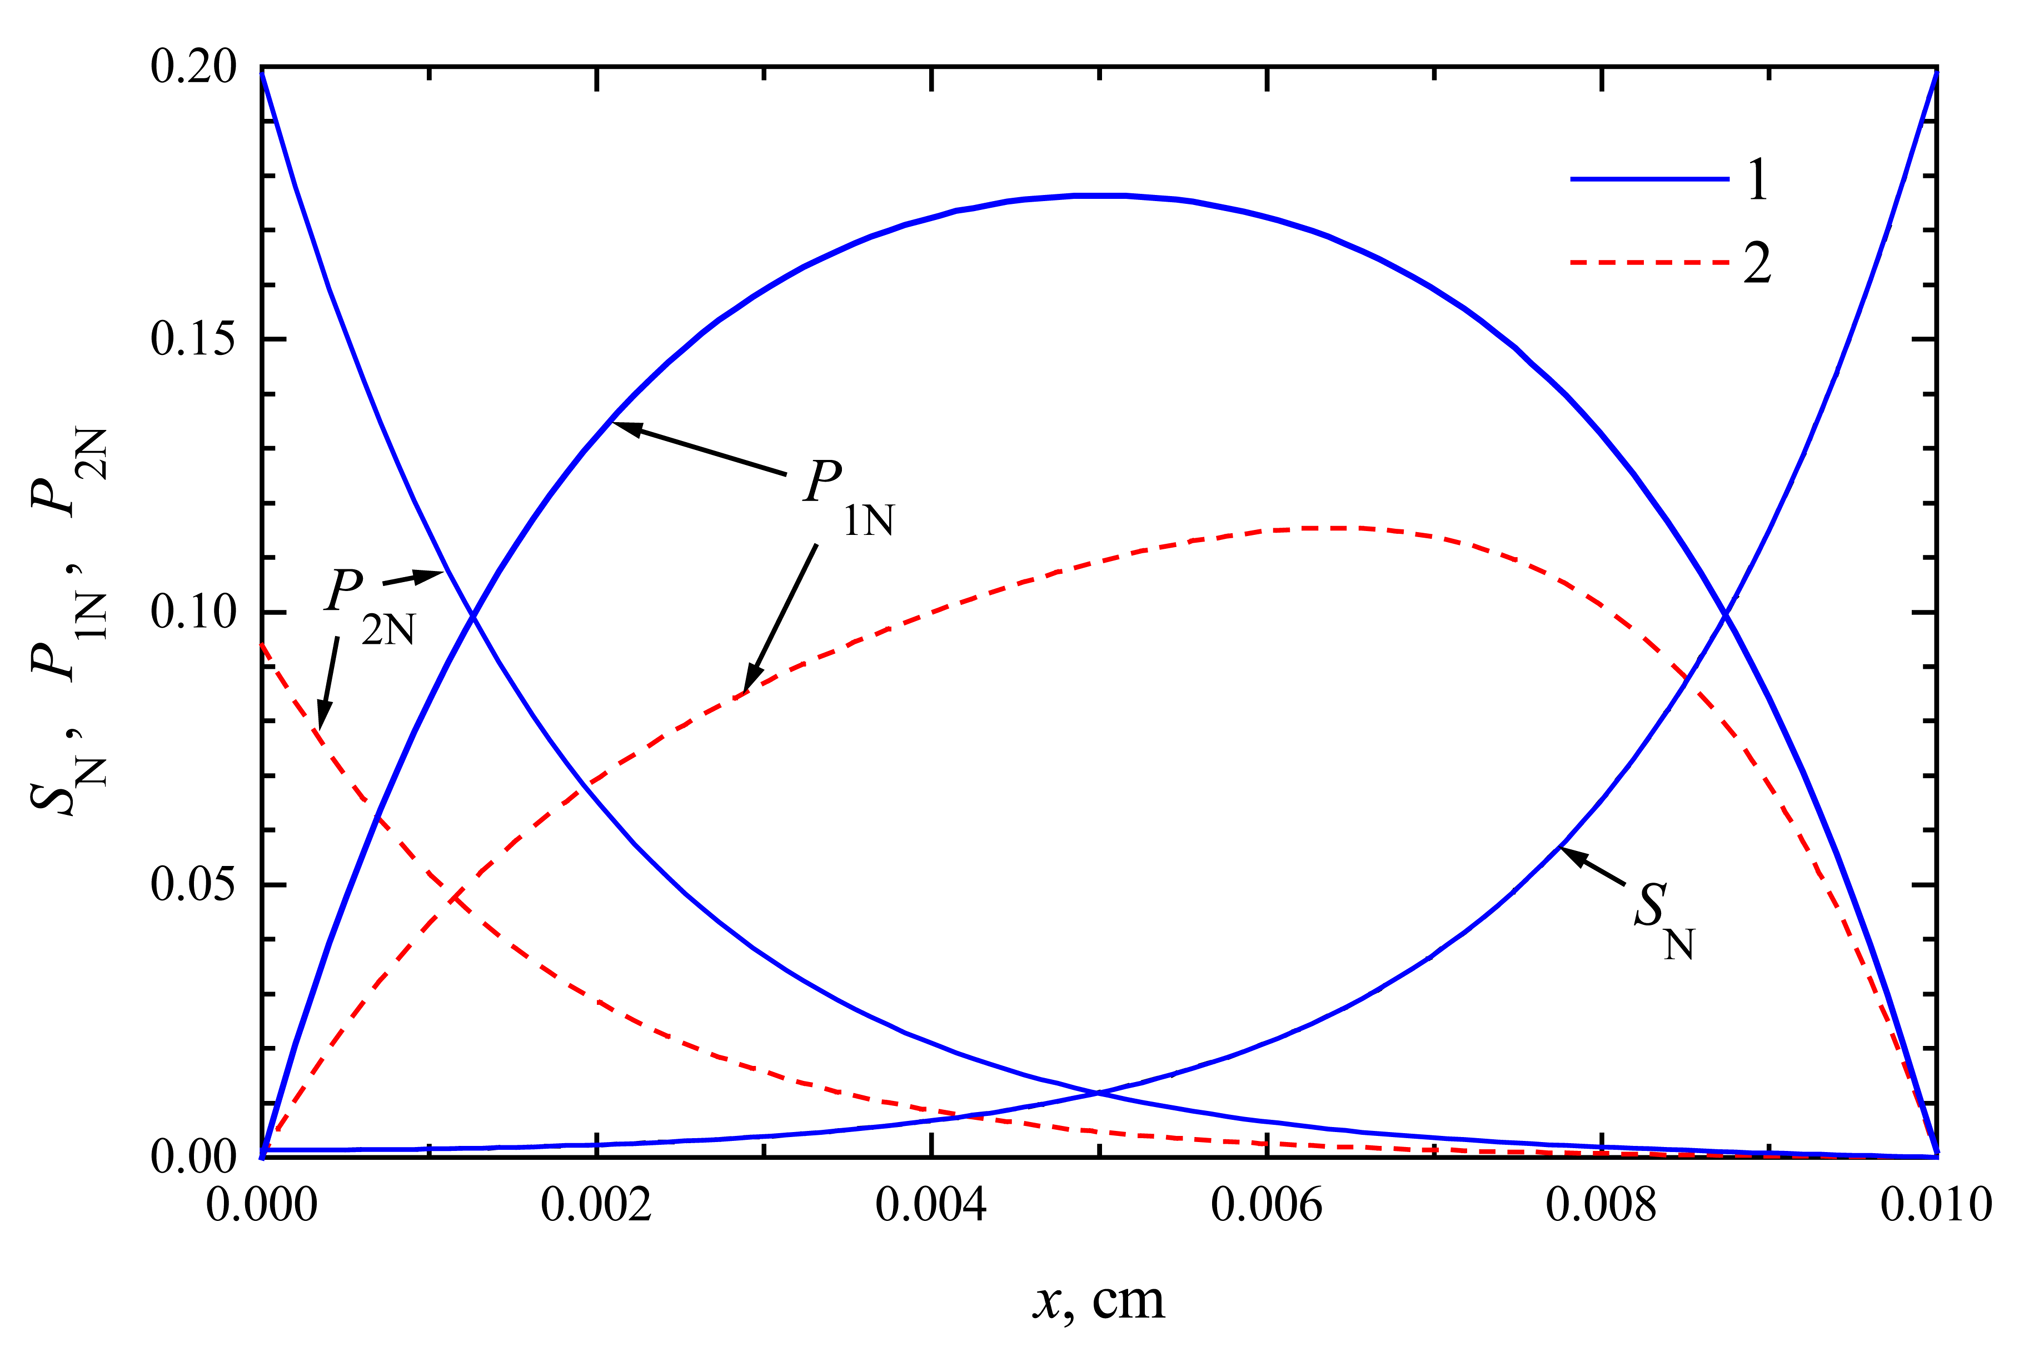
Figs. 1 and
2, the profiles of substrate as well as product concentration in the enzyme layer are presented for biosensors acting in CEC and CCE modes. For calculations, the maximal enzymatic rate
V1 =
V2 = 100 nmol/(cm
3s), substrate concentration
S0 = 20 nmol/cm
3 and membrane thickness
d = 0.01 cm were used. The profiles show the concentrations normalized to the Michaelis constant
KM, assuming
KM =
K1 =
K2 = 5
S0,
S0N = 0.2:
The concentration profiles in
Figs. 1,
2 are shown at the time when the steady-state as well as 50% of the steady-state response has been reached. Note that for both biosensors the concentration of the substrate at steady-state conditions is approximately the same. At the time when the half of the steady-state response is reached, no significant difference has been observed, too. This is true in the entire enzyme layer,
x ∈ [0,
d]. The substrate concentration is described by equations (
4), (
7), (
9) and (
10), which are valid in both modes of biosensor action. This explains the similarity of substrate concentration in both modes.
The steady-state current is similar for both types of biosensors,
ICEC ≈
iCEC(123) ≈ 6.23 μA/cm
2,
ICCE ≈
iCCE(124) ≈ 6.09 μA/cm
2. The time of steady-state is also approximately the same in both these cases. At the steady-state conditions, i.e.
∂S/
∂t =
∂P1/
∂t =
∂P2/
∂t = 0, because of the boundary conditions (
9)-(
12), the equality
S(
x,
t) +
P1(
x,
t) +
P2(
x,
t) =
S0 holds for all
x ∈ [0,
d] when
t → ∞. This can be observed in both
Figs. 1 and
2.
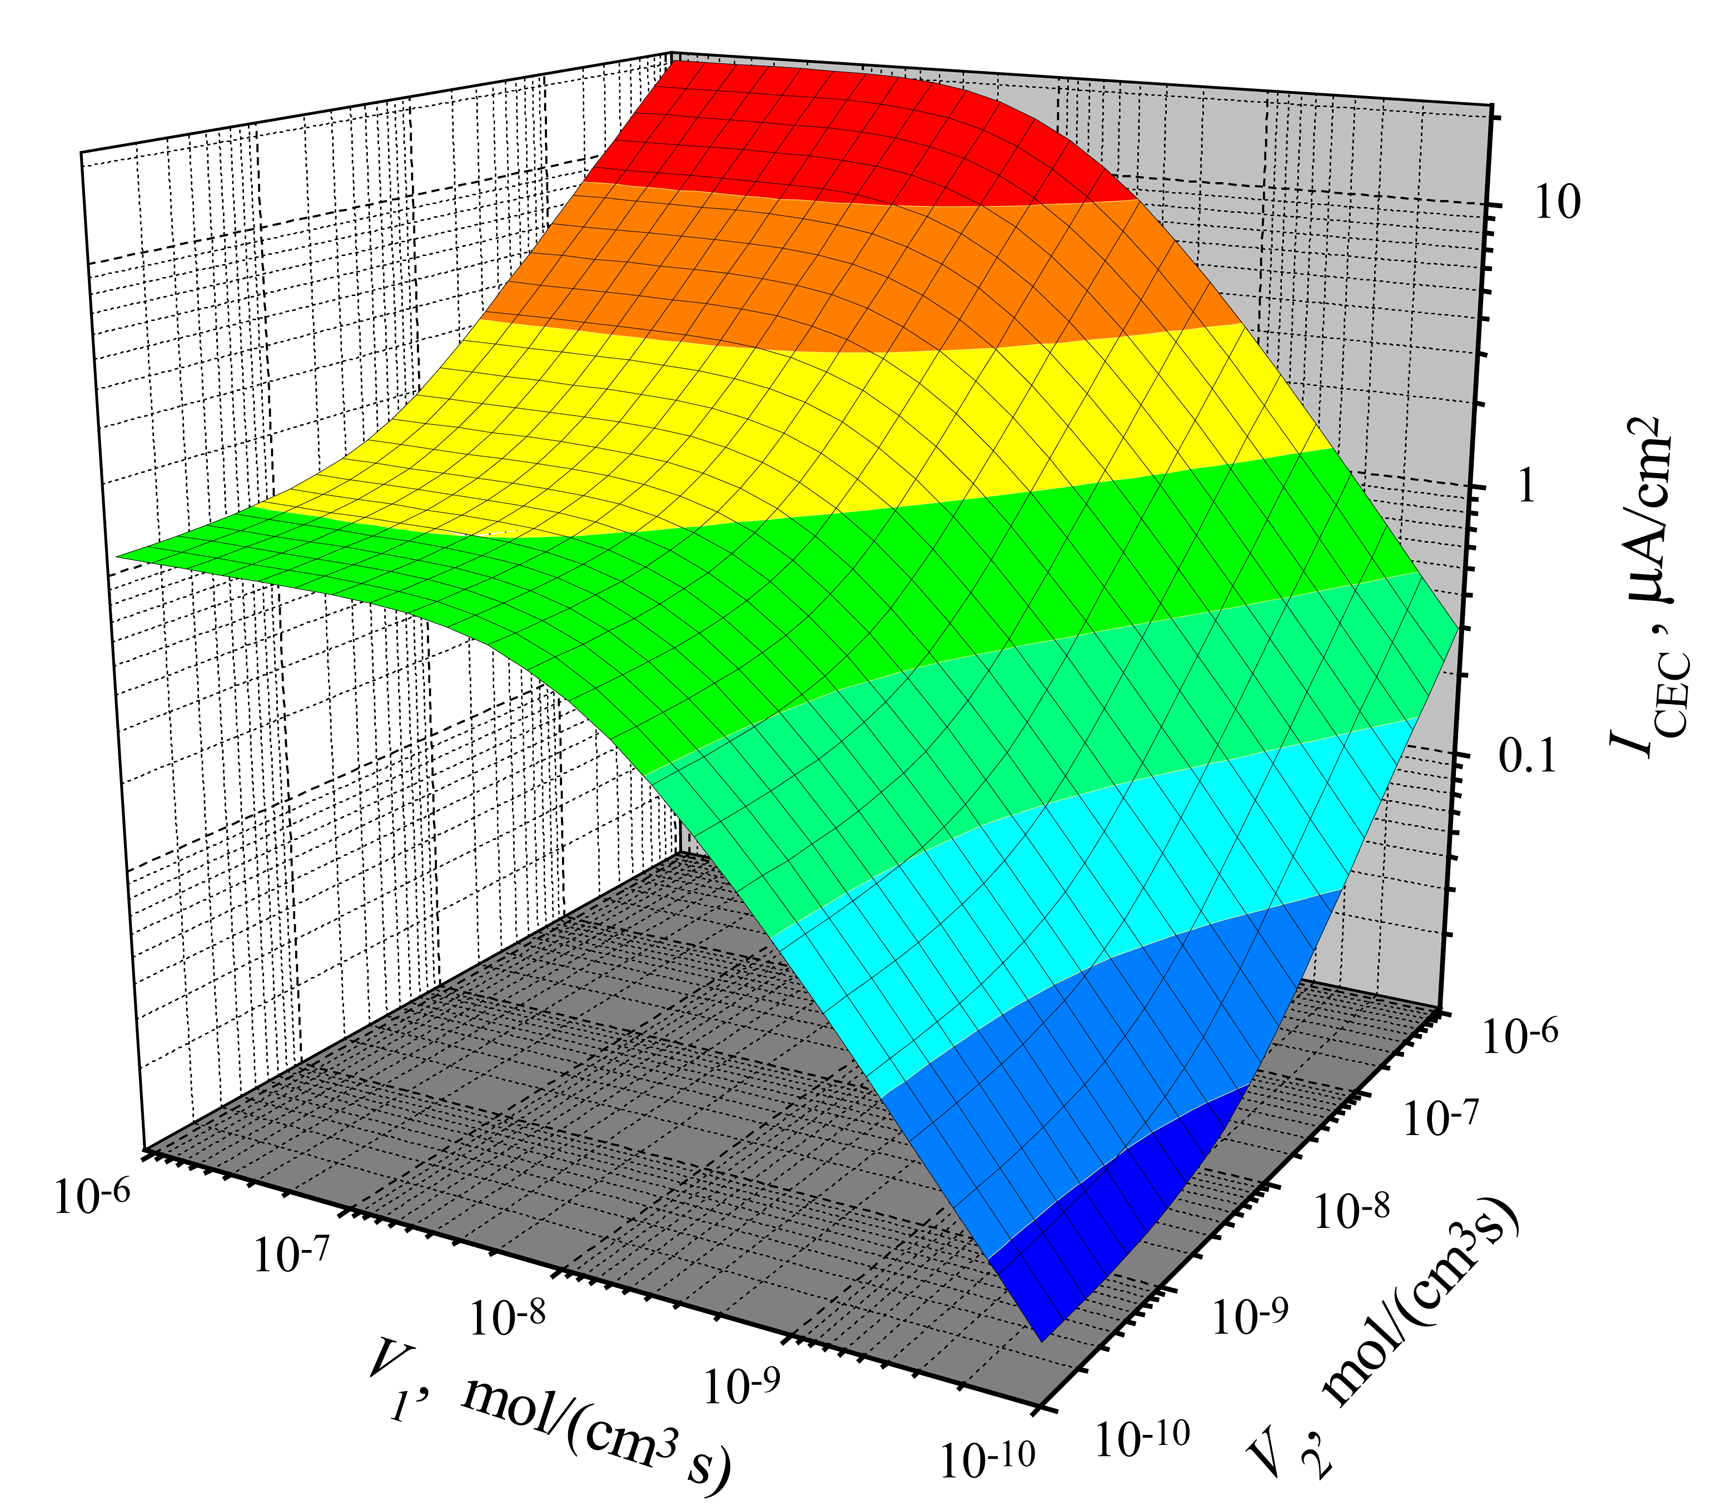
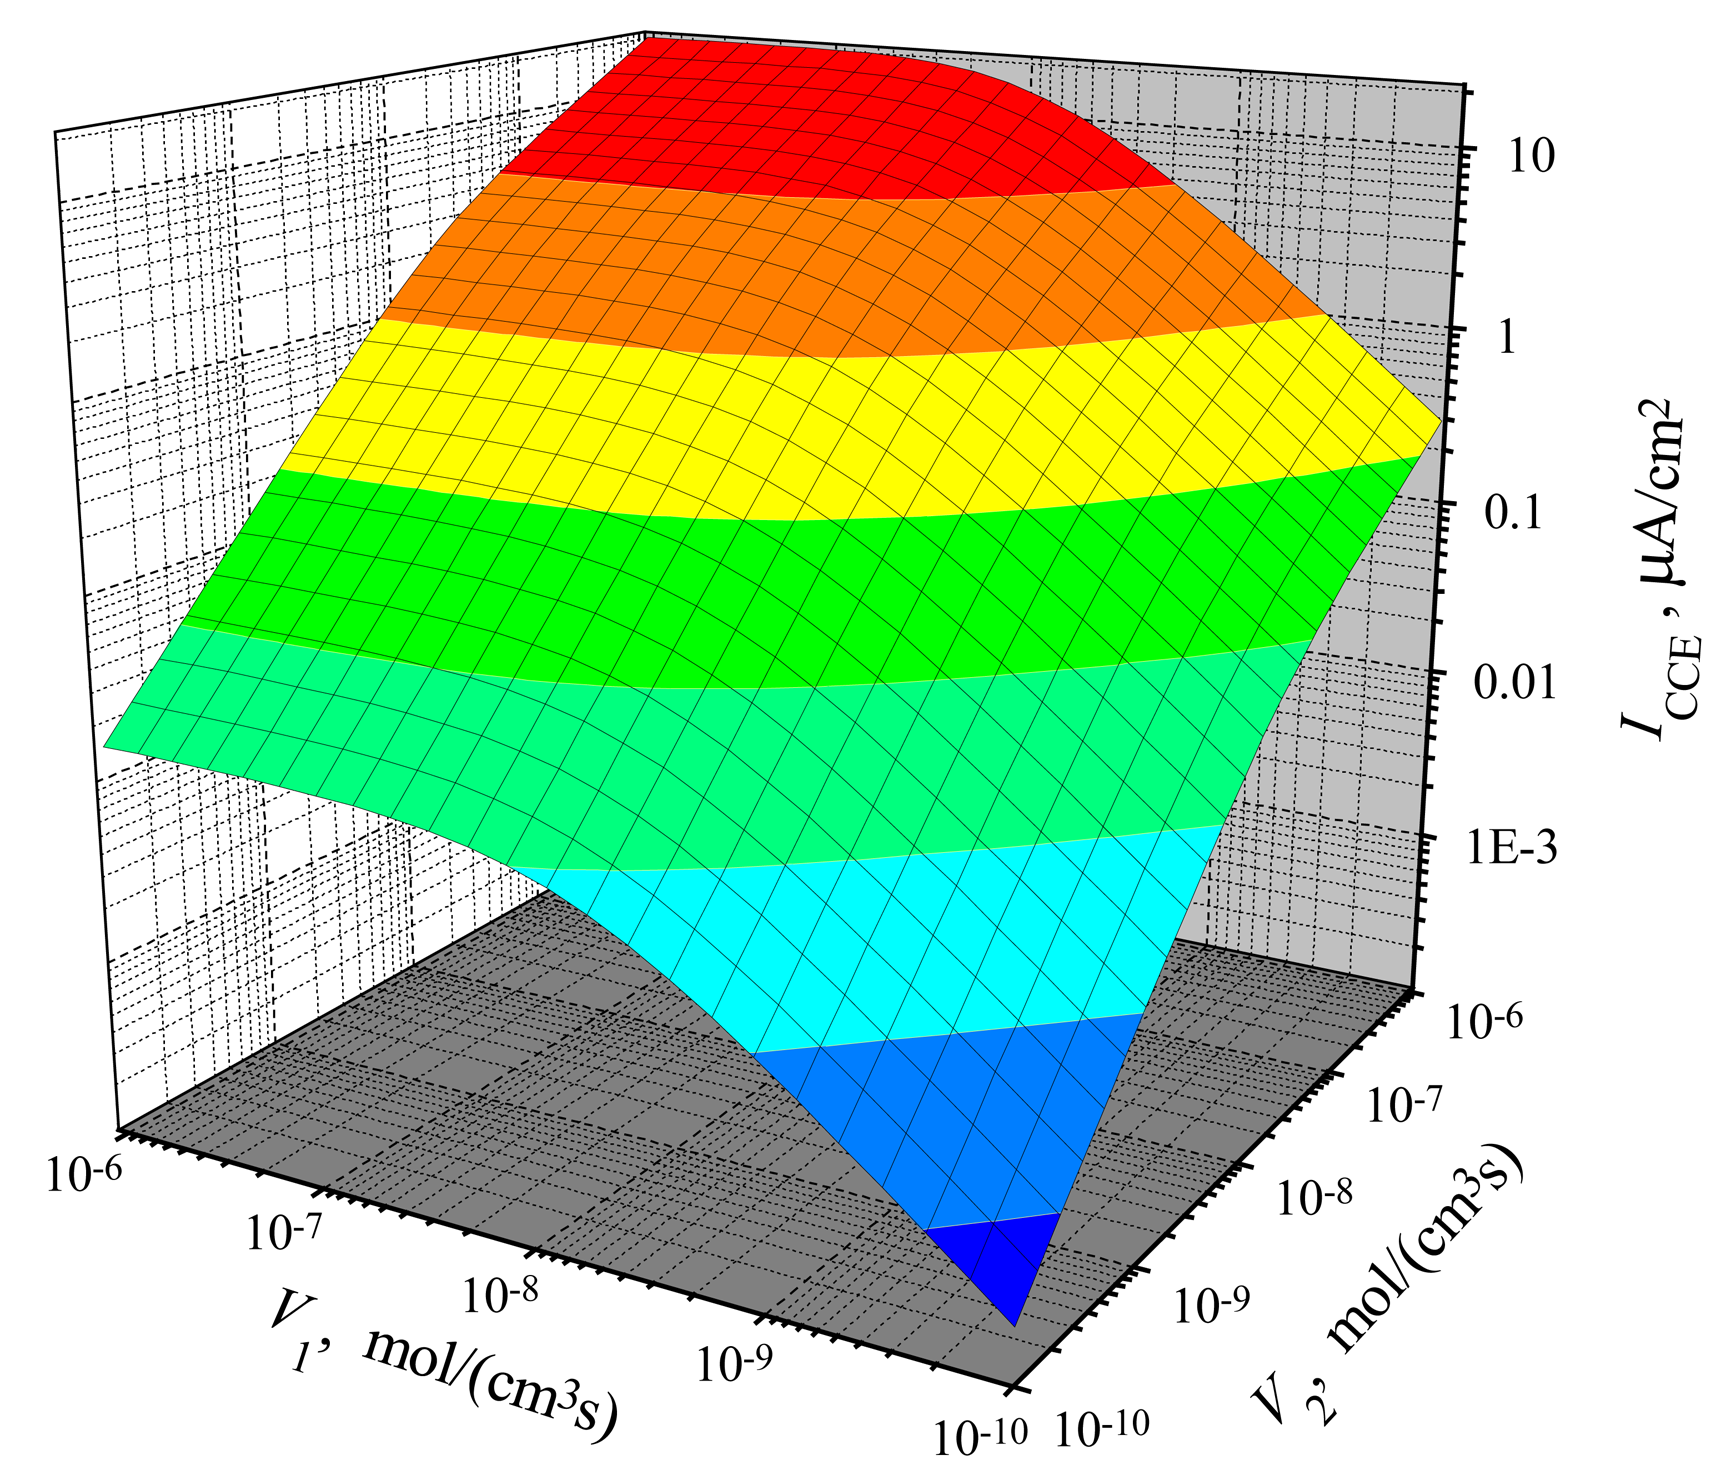
The dependence of the steady-state current on the reactions rates
The dependence of the steady-state current on the activity of both enzymes is shown in
Figs. 3,
4 for CEC and CCE modes. In calculations,
V1 and
V2 varied from 10
−10 to 10
−6 mol/(cm
3s), the substrate concentration
S0 was 20 nmol/cm
3,
S0N was 0.2 and membrane thickness
d was 0.01 cm. One can see in
Figs. 3 and
4 that
ICEC(
V1,
V2) as well as
ICCE(
V1,
V2) are monotonously increasing functions of both arguments:
V1 and
V2.
In the case of CEC mode, an application of an active enzyme E
2 (
V2 > 0) stimulates an increase of the biosensor current. In the case of
V2 = 0, the biosensor acting in CEC mode generates the current if only
V1 > 0. However, in the case of CCE mode, the appearance of an active enzyme E
2 (
V2 > 0) is a critical factor for the biosensor current.
ICCE = 0 if
V2 = 0 even if the activity of an enzyme E
1 is very high (
V1 ≫ 0). Because of this, at low values of
V2, the steady-state current
ICCE increases very quickly with increase of
V2. That effect is noted in
Figs. 3 and
4 as the surface salience. The salience of the surface
ICCE(
V1,
V2) (
Fig. 4) is more noticeable than the salience of the surface
ICEC(
V1,
V2) (
Fig. 3).
Consequently, when
V2 → 0 at any
V1 > 0, in the CEC mode:
ICCE(
V1,
V2) → 0, while in another mode (CEC) of triggering:
ICEC(
V1,
V2) →
ICEC(
V1, 0) =
ICE(
V1). On the other hand,
Figs. 3 and
4 show, that
ICEC(
V1,
V2) ≈
ICCE(
V1,
V2) at a high maximal enzymatic rate
V2.
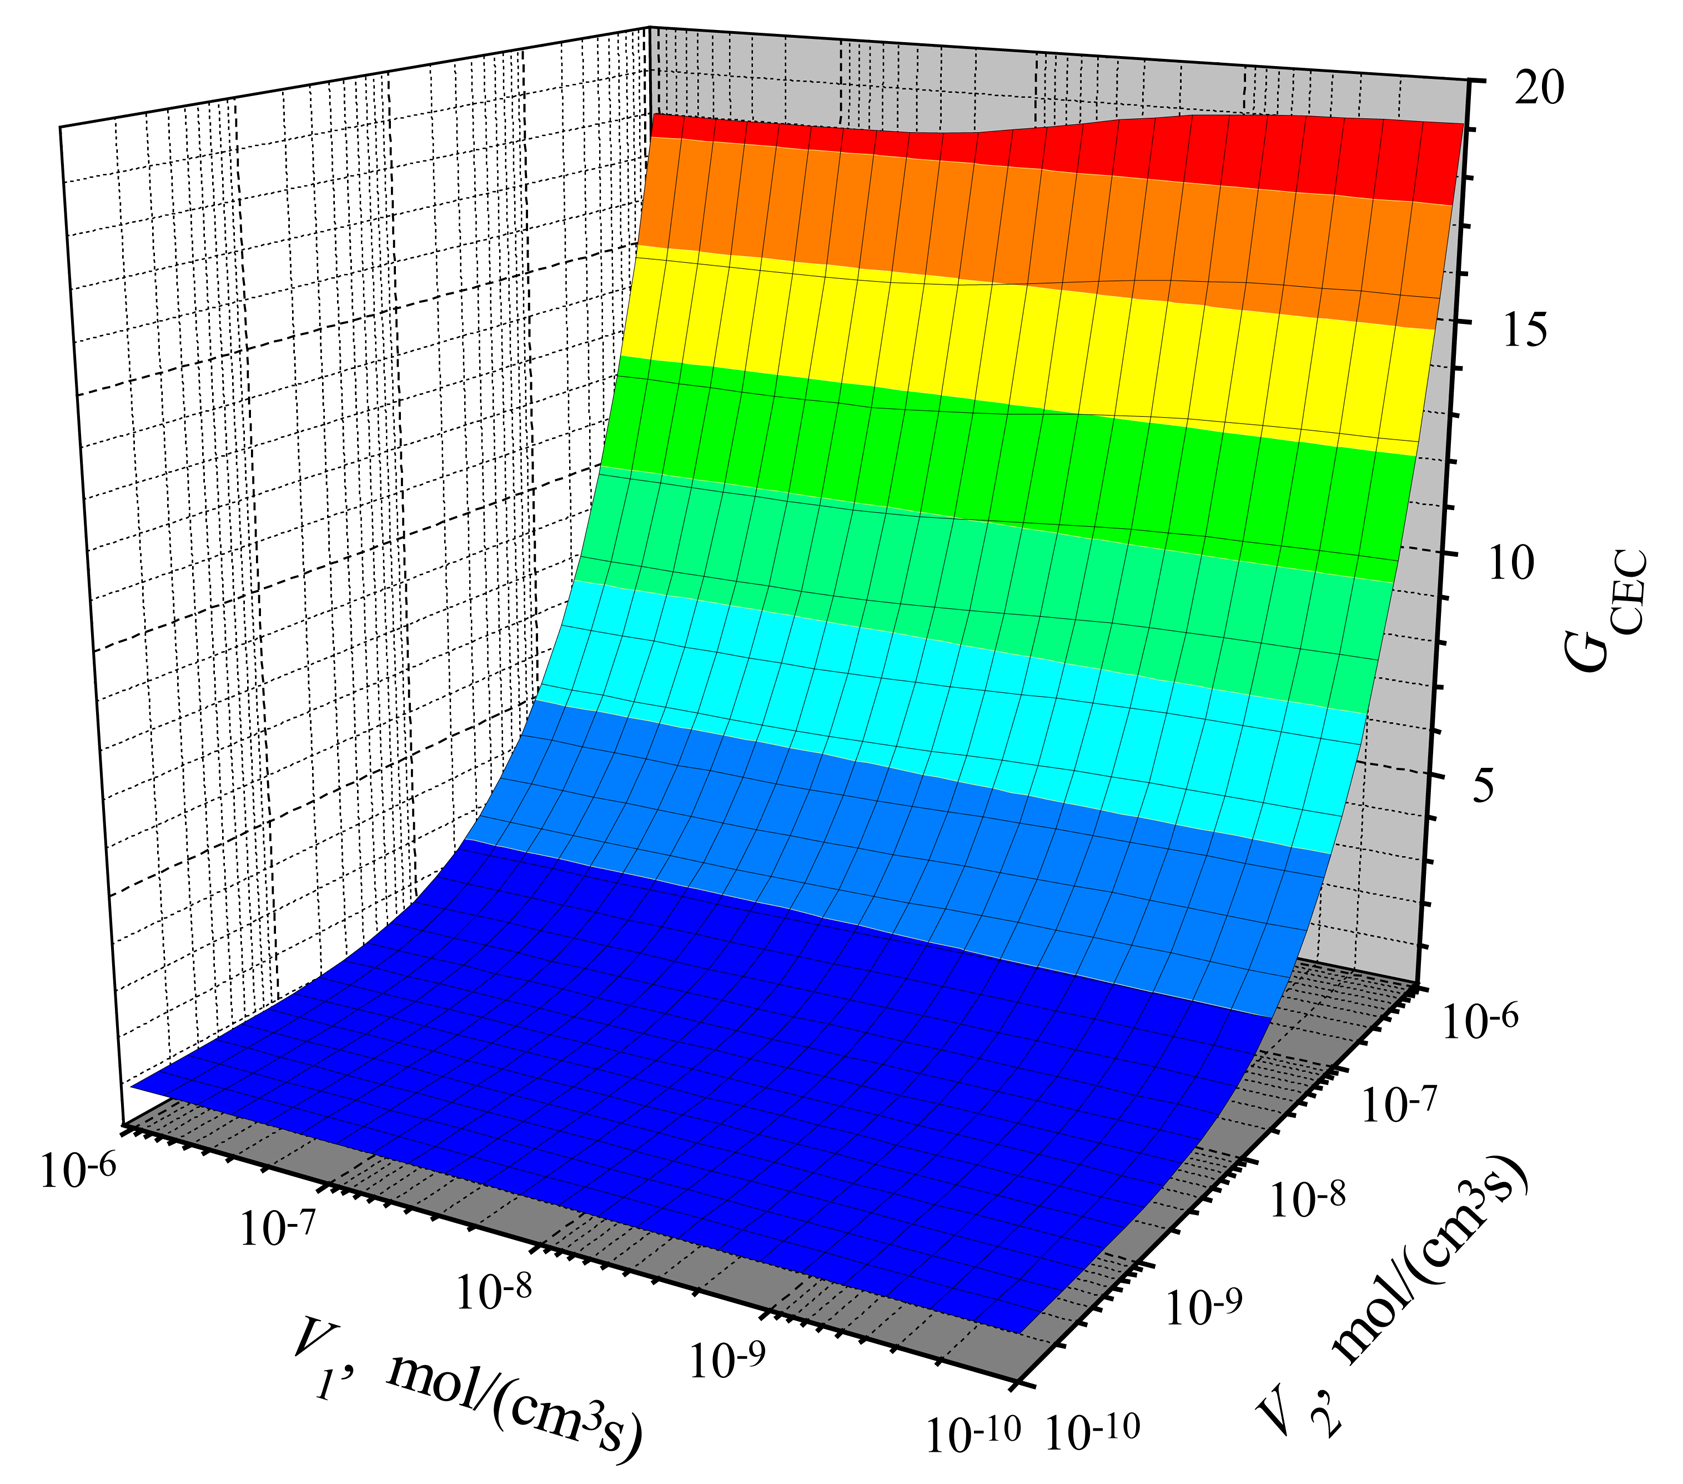
The dependence of the amplification on the reactions rates
To investigate the effect of the amplification,
ICE(
V1) has been calculated at the same conditions as above. Having
ICEC(
V1,
V2),
ICCE(
V1,
V2) and
ICE(
V1), we calculated the gains
GCEC(
V1,
V2) and
GCCE(
V1,
V2). Results of calculations are depicted in
Figs. 5 and
6. One can see in both figures that the gain increases with increase of
V2. The increase is especially notable at high values of
V2. The variation of
V1 on the response gain is slight by only. The gain varies from 18.0 to 19.1 at
V2 = 1 μmol/(cm
3s) in both action modes: CEC and CCE.
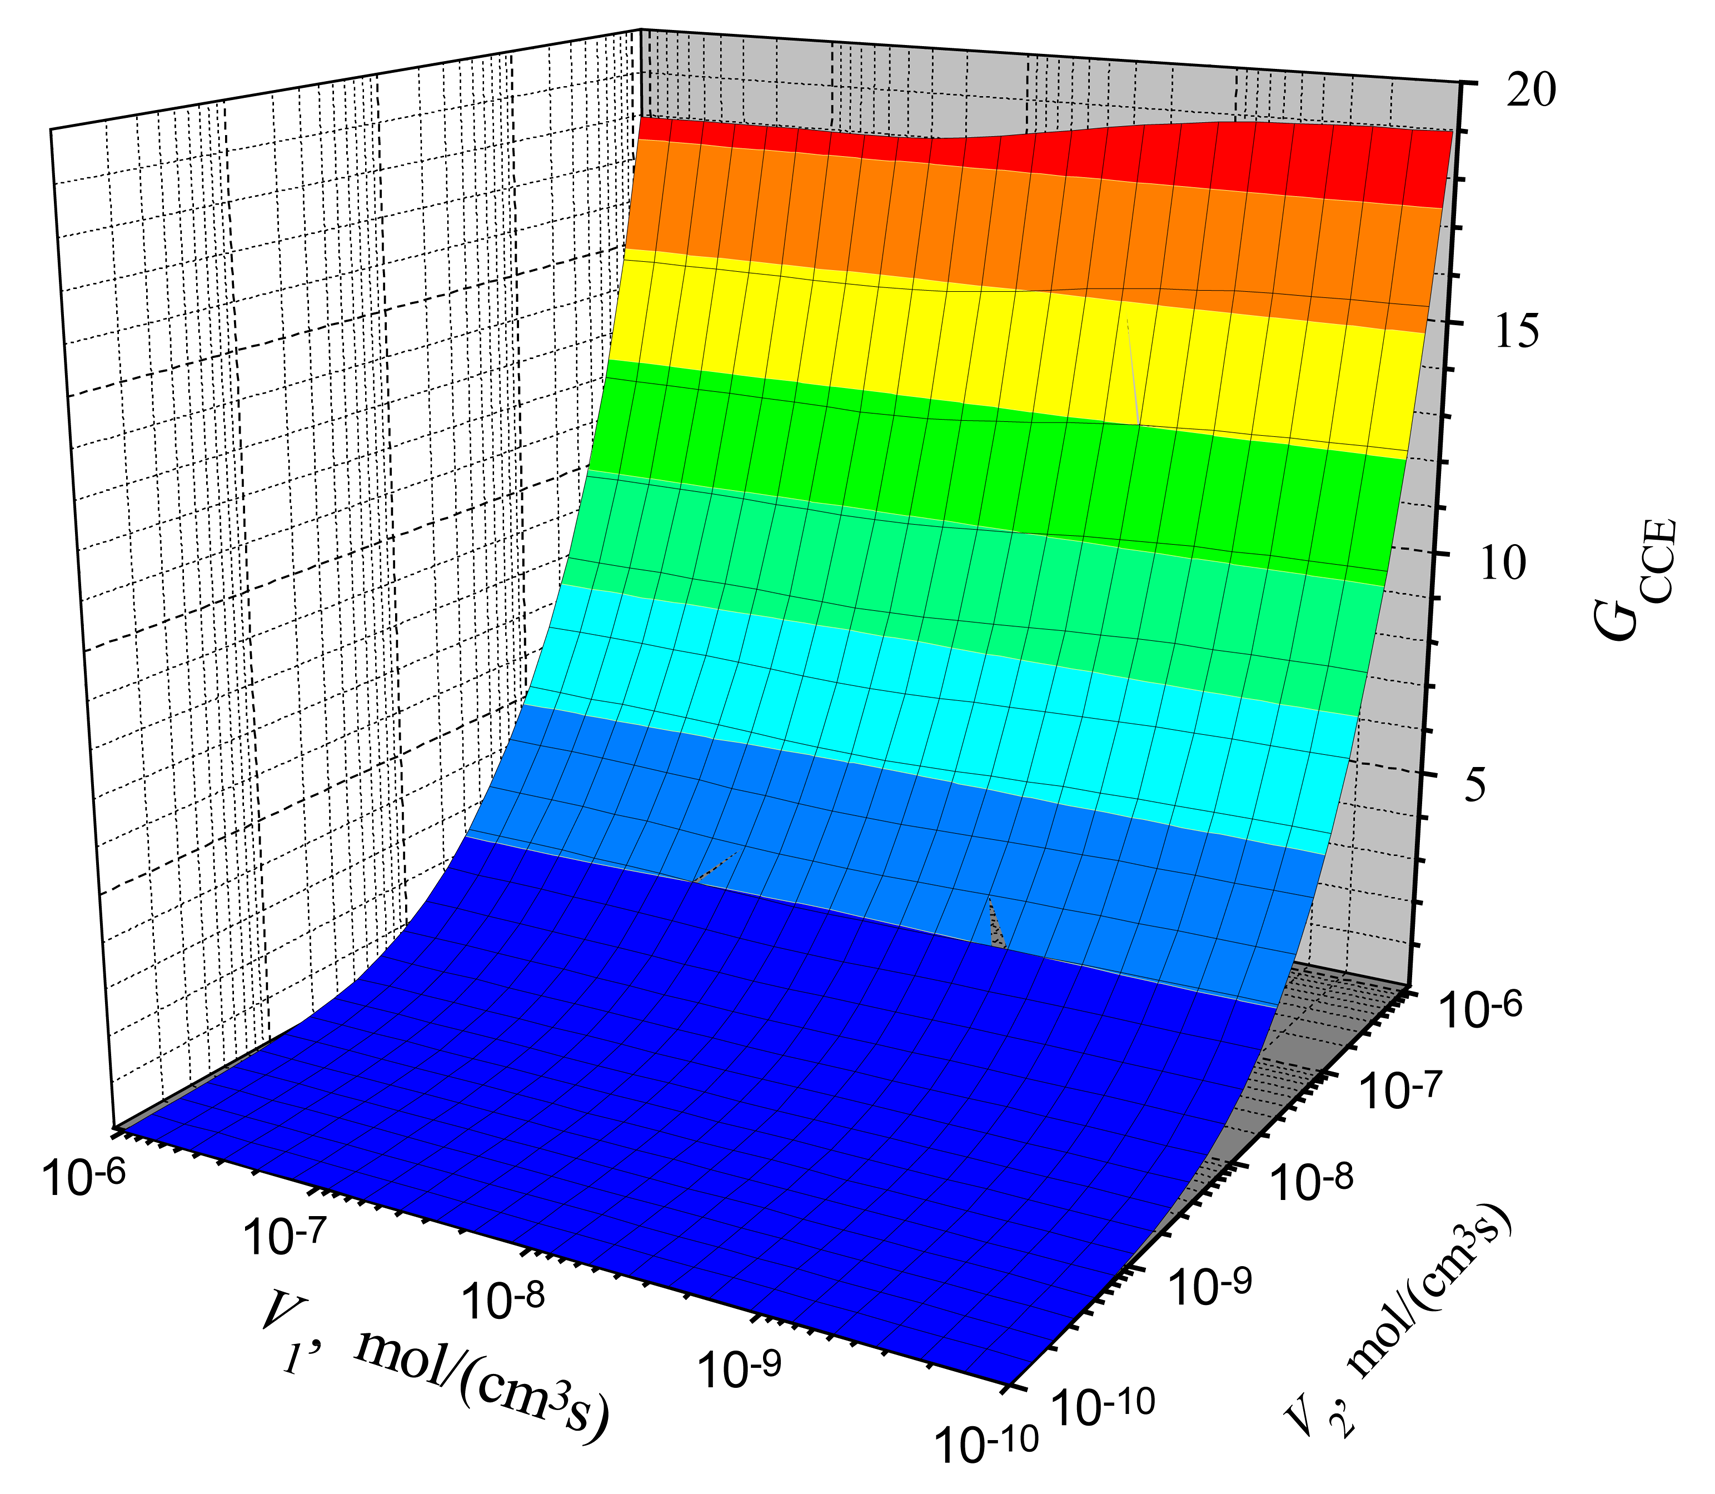
Comparing the gain in the CEC mode (
Fig. 5) with the gain in the CCE mode (
Fig. 6), one can notice a significant difference at low values of
V2. The gain
GCEC starts to increase from about unity, while
GCCE at low values of
V2 (
V2 < ≈ 1 nmol/(cm
3s)) is even less than unity. It means that in the case of low activity of enzyme E
2, the steady-state current of a biosensor is acting in the CCE mode even less than the steady-state current of a biosensor acting in the CE mode at the same conditions.
From the model of the CCE biosensor follows that
P2(
x,
t) ≈ 0 when
V2 → 0. Consequently,
GCCE(
V1,
V2) → 0 when
V2 → 0 at any
V1 > 0, while in the CEC mode:
GCEC(
V1,
V2) → 1 when
V2 → 0. On the other hand,
Figs. 5 and
6 show, that
GCEC(
V1,
V2) ≈
GCCE(
V1,
V2) at a high maximal enzymatic rate
V2, e.g. at
V2 = 1 μmol/(cm
3s).
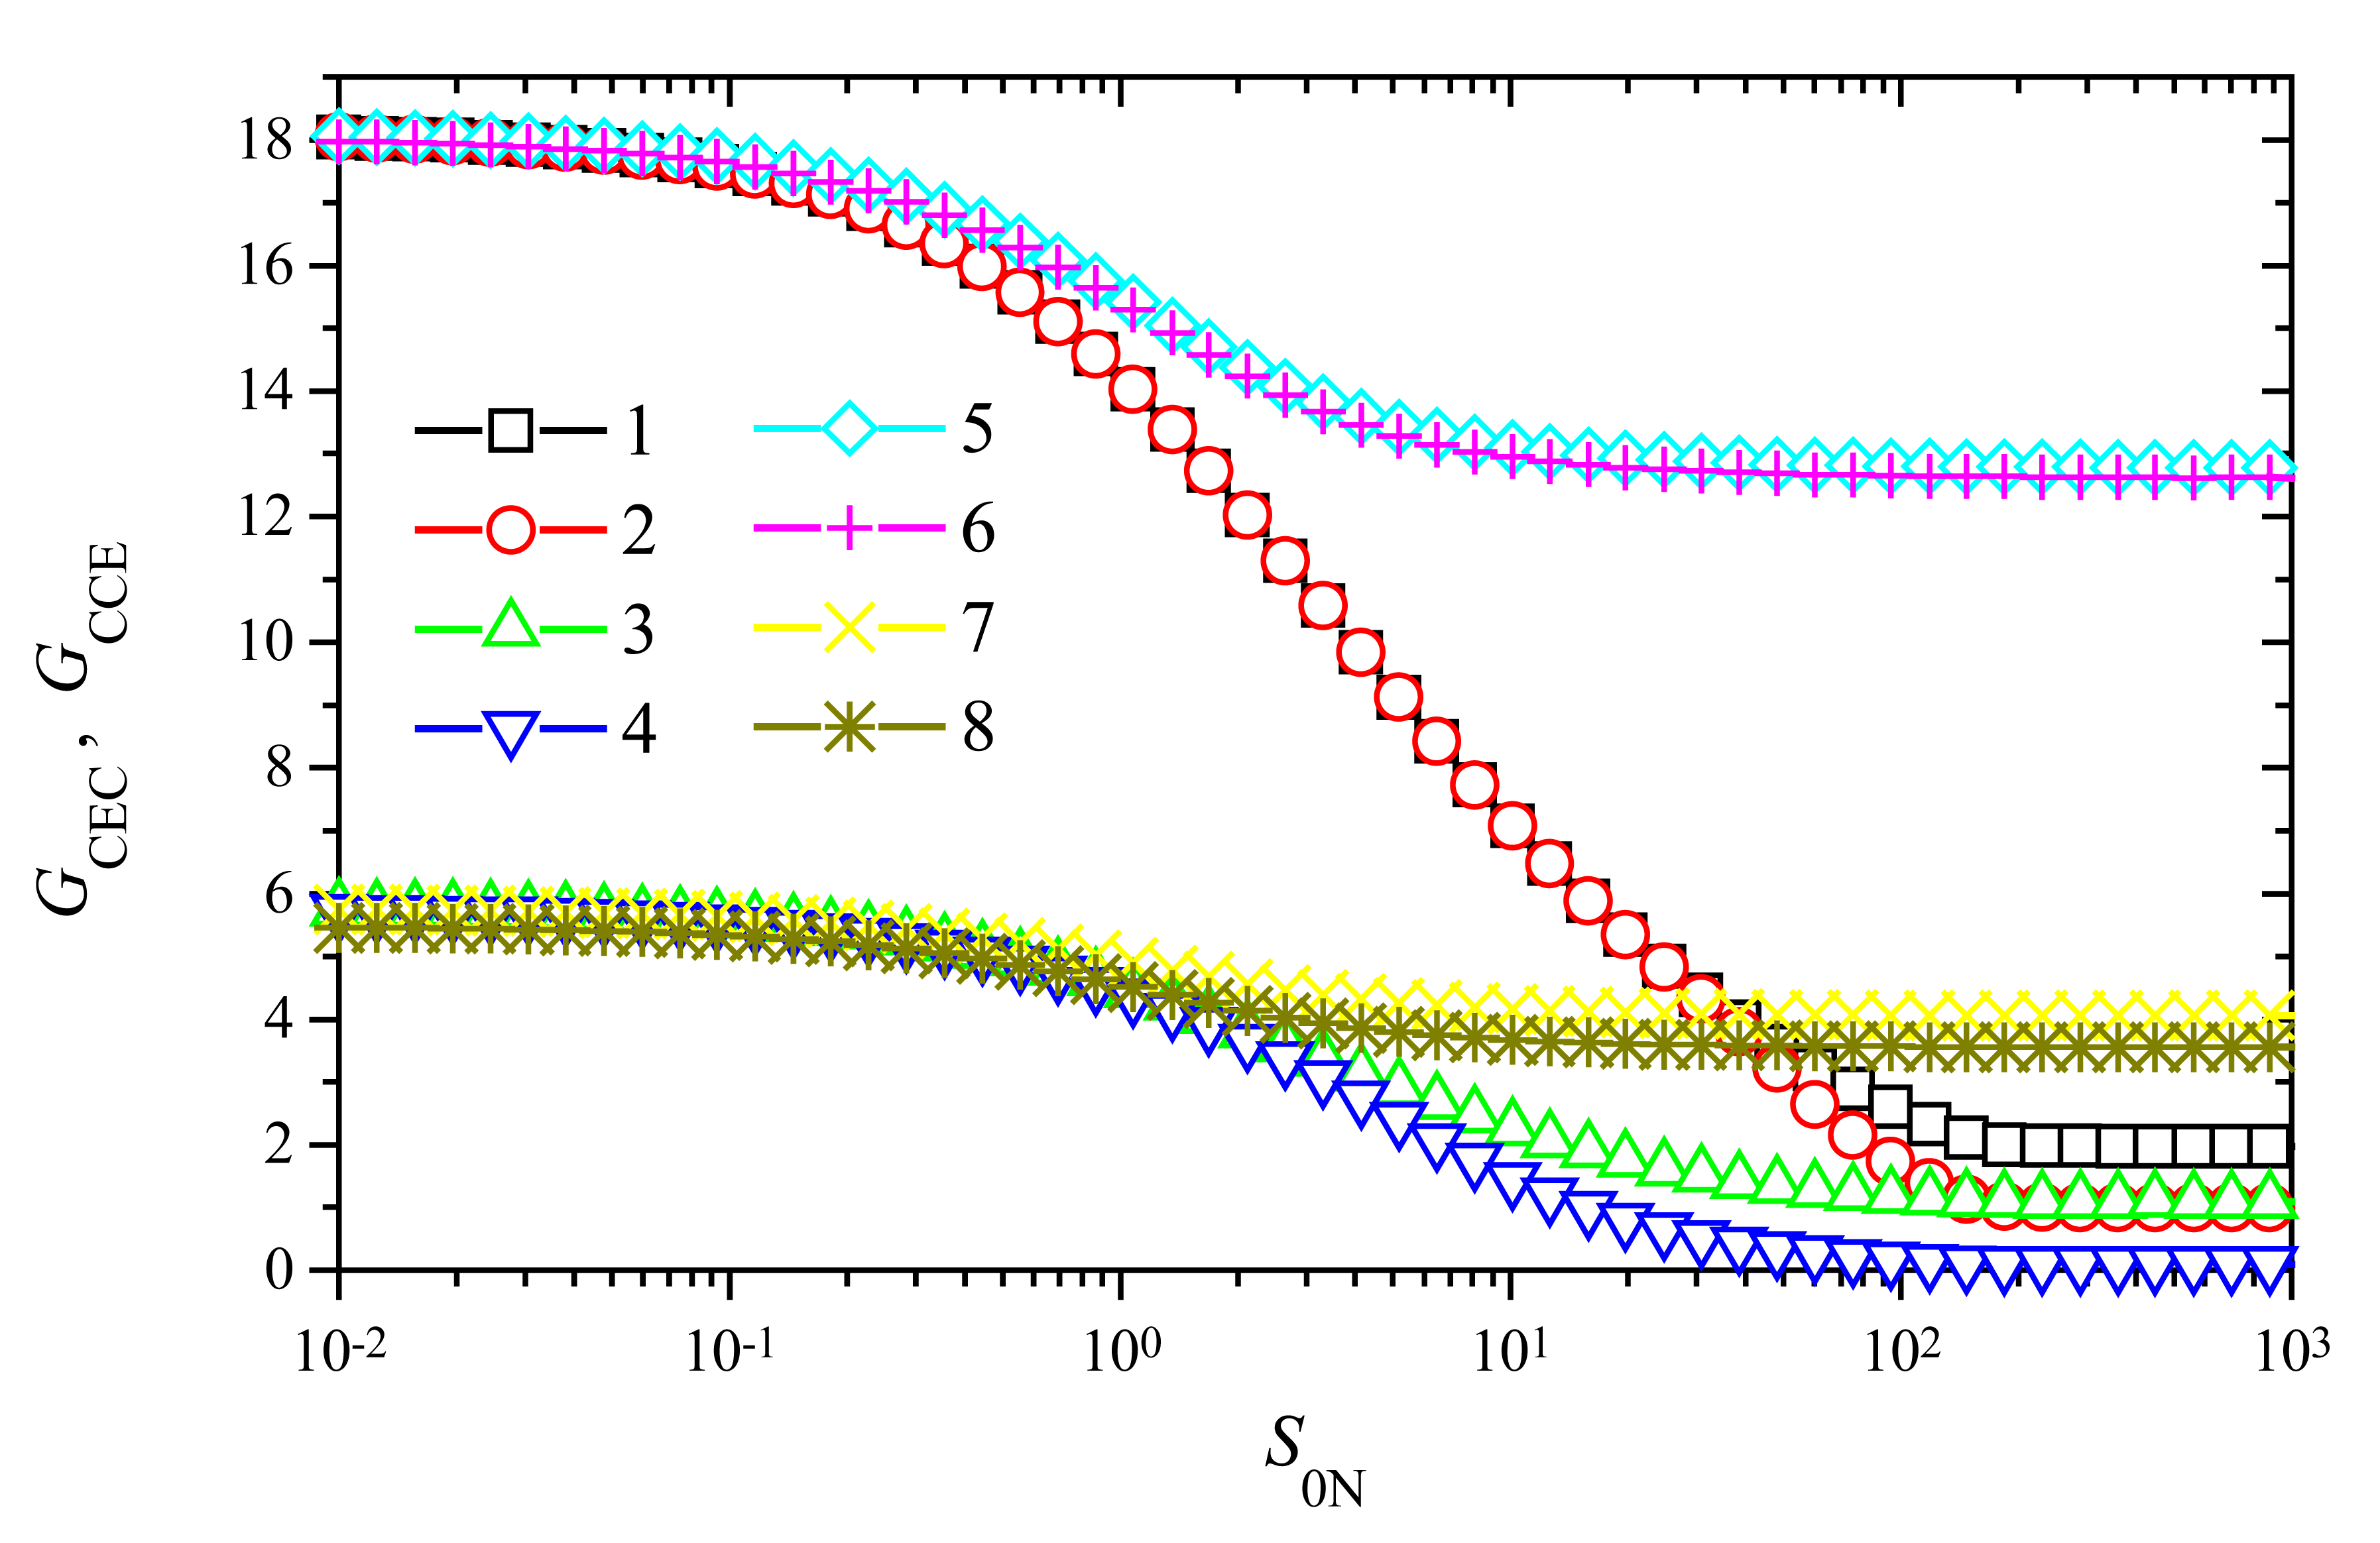
The dependence of the amplification on the substrate concentration
To investigate the dependence of the signal gain on the substrate concentration
S0, the response of biosensors varying
S0 from 10
−10 to 10
−4 mol/cm
3 was simulated. Since the gain of trigger biosensors is significant only at a relatively high maximal enzymatic rate
V2 of enzyme E
2 (
Figs. 5 and
6), we employed the following two values of
V2: 10
−6 and 10
−7 mol/(cm
3s). We chose also two different values of the maximal enzymatic rate
V1 of enzyme E
1: 10
−6 and 10
−8 mol/(cm
3s). Since the influence of
V1 on the signal gain is not so significant as that of
V2, the chosen two values of
V1 differ in two orders of magnitude while values of
V2 differ only in one. The results of calculations at the enzyme membrane thickness
d = 0.01 cm are depicted in
Fig. 7.
As one can see in
Fig. 7, the behaviour of the signal gain versus the substrate concentration is very similar for both modes of the biosensor action: CEC and CCE. Some noticeable difference between values of
GCEC and
GCCE is observed at high substrate concentrations only,
S0N > 1. However, in a case of a higher value of
V2,
V2 = 10
−6 mol/(cm
3s), and a lower
V1,
V1 = 10
−8 mol/(cm
3s), no noticeable difference is observed between values of
GCEC (curve 5 in
Fig. 7) and
GCCE (curve 6 in
Fig. 7) in the entire domain of substrate concentration. A very similar effect can be noticed at the same value of
V1,
V1 = 10
−6 mol/(cm
3s), and a ten times higher value of
V2,
V2 = 10
−7 mol/(cm
3s), curves 7 and 8.
Fig. 7 shows the significant importance of the maximal enzymatic rate
V2 to both signal gains:
GCEC and
GCCE. Such an importance is especially perceptible at low and moderate concentrations of substrate,
S0N < 1. At
S0N < 0.1 and
V2 = 1 μmol/(cm
3s) due to the amplification, the steady-state current increases up to about 18 times (
GCEC ≈
GCCE ≈ 18). However, at the same
S0N and ten times lower value of
V2, the gain is about three times less,
GCEC ≈
GCCE ≈ 5.7. Consequently, at low substrate concentrations,
S0N < 0.1, and wide range of the maximal enzymatic rate
V1, the tenfold reduce of
V2 reduces the signal gain about three times. This property is valid for both modes of triggering: CEC and CCE.
When increasing the substrate concentration, the signal gain starts to decrease when
S0N becomes greater than unity (
Fig. 7), i.e. when
S0 >
K1 =
K2. However, the decrease is perceptible in cases of a high enzymatic rate
V1 only. At low activity of enzyme
E1 when
V1 = 1 nmol/(cm
3s), the gain varies less than 30% for both values of
V2: 10 and 100 nmol/(cm
3s). Additional calculations showed, that at a less activity of enzyme
E1 when
V1 = 10
−10 mol/(cm
3s), the gain practically does not vary changing the substrate concentration in the domain. Because of a very stable amplification at a wide range of substrate concentration, the usage of biosensors acting in a trigger mode is especially reasonable at a relatively low maximal enzymatic activity (rate
V1) of enzyme E
1 and a high activity (rate
V2) of enzyme E
2. In the cases of relatively high maximal enzymatic activity
V1 the signal amplification is stable only for low concentrations of the substrate.
Additional calculations showed that the signal gain vanishes fast with the decrease of the enzymatic activity
V2 of enzyme E
2. For example, in the case of
V2 = 1 nmol/(cm
3s) the gain becomes less than 2 even at a low substrate concentration,
GCEC ≈ 1.91,
GCCE ≈ 1.3 at
S0N = 0.01. This effect is also observed in
Figs. 5 and
6. Calculations approved the property that the tenfold reduce of
V2 reduces the signal gain about three times is valid at a wide range, also of
V2.
A similar dependence of the signal gain on the substrate concentration was observed in the case of an amperometric enzyme electrode with immobilized laccase, in which a chemical amplification by cyclic substrate conversion takes place in a single enzyme membrane [
15]. In the case of the biosensor with substrate cyclic conversion, the signal gain of 36 times was observed at the maximal enzymatic rate of 1 μmol/(cm
3s) and the membrane thickness of 0.02 cm. For comparison of that gain with the gain achieved in the trigger mode, we calculate
GCEC and
GCCE for the enzyme membrane of thickness
d = 0.02 cm. The result of the calculation showed the amplification,
GCEC ≈
GCCE ≈ 34 at
V1 =
V2 = 1 μmol/cm
3s,
d = 0.02 cm, very similar to the amplification noticed in [
15,
16].
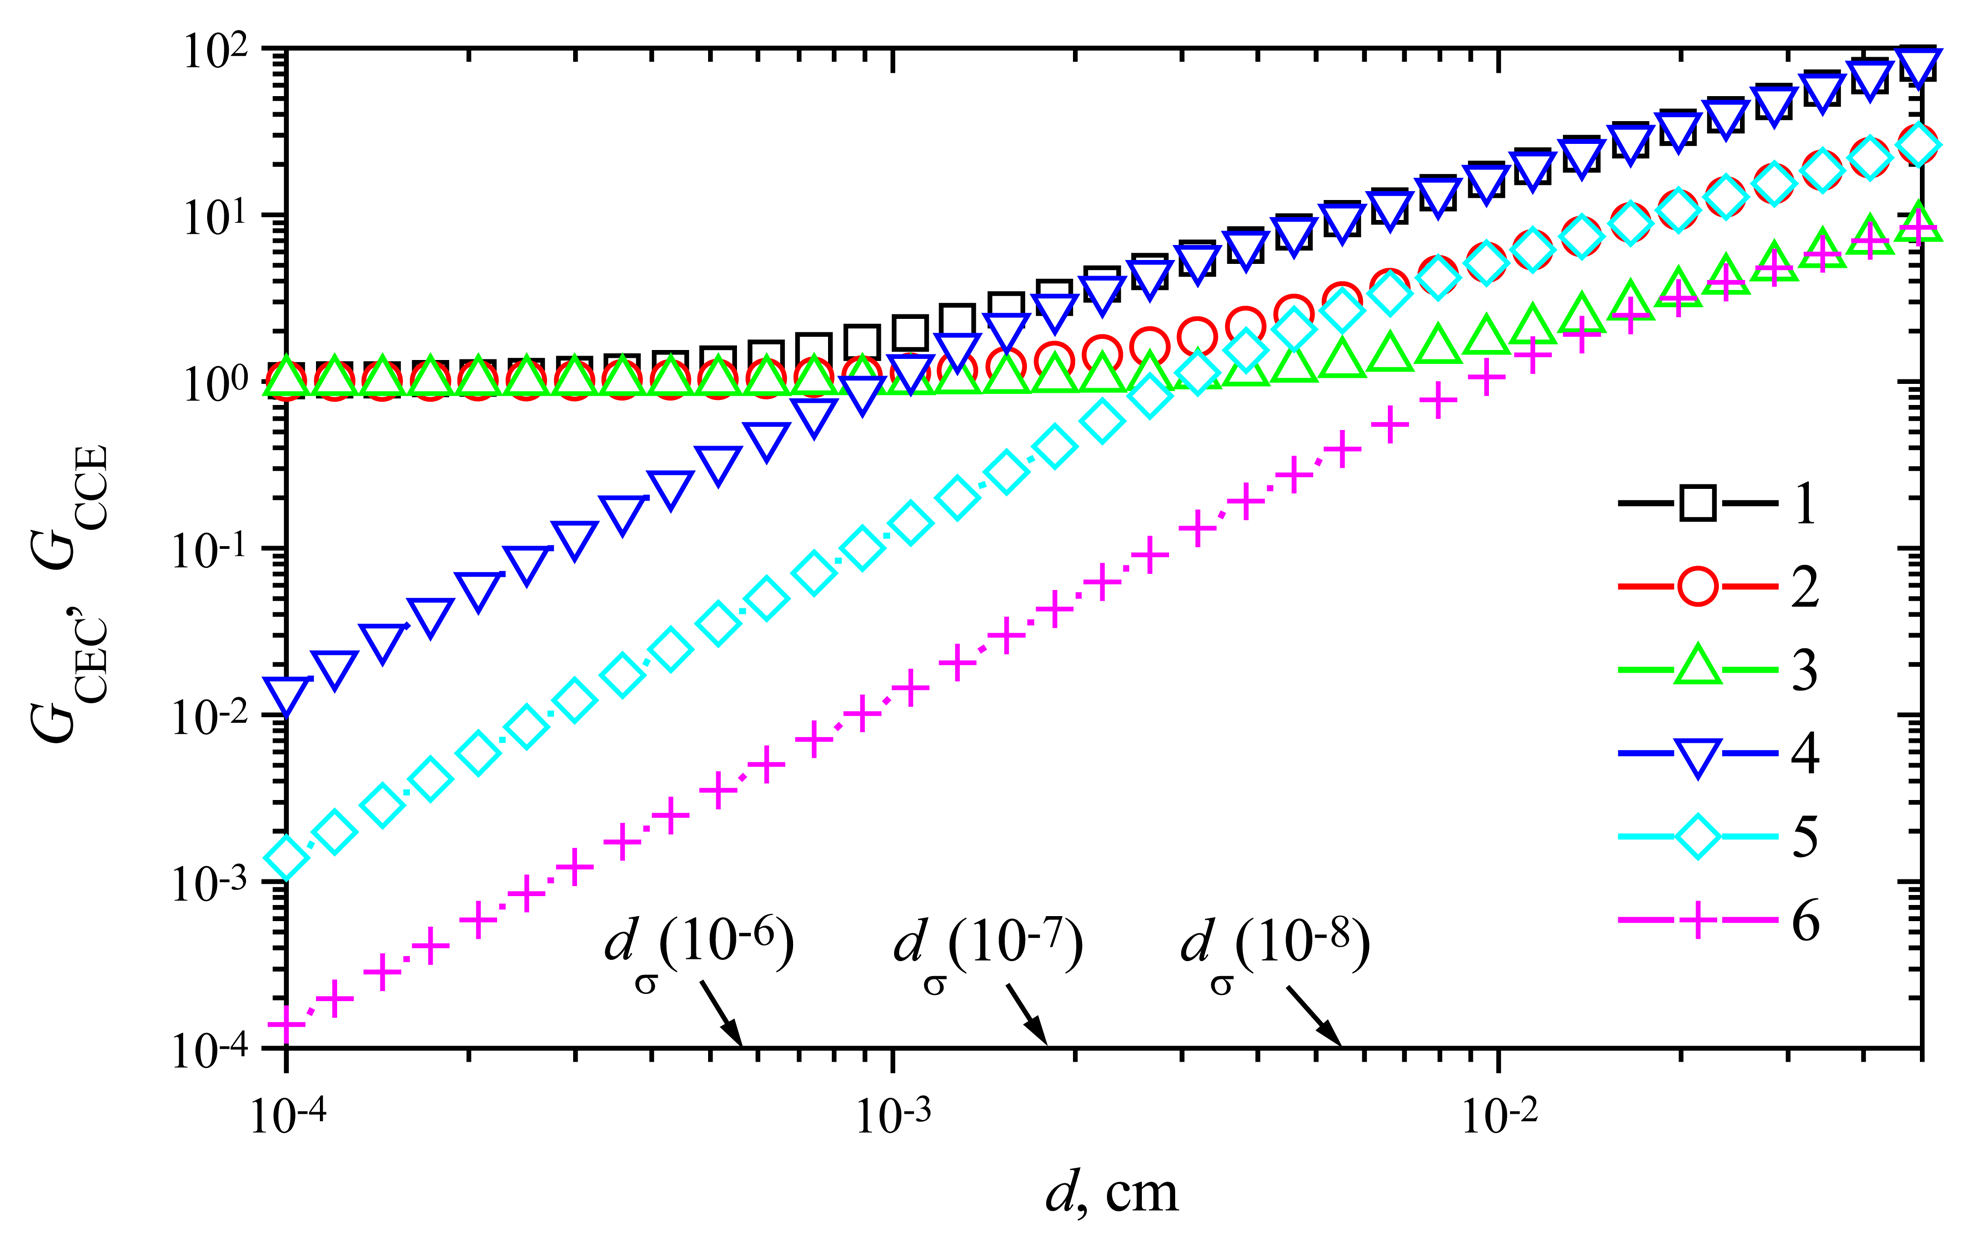
The effect of the enzyme membrane thickness on the amplification
The steady-state current of membrane biosensors significantly depends on the thickness of the enzyme layer [
6,
16,
24,
27]. The steady-state time varies even in orders of magnitude. To investigate the dependence of the signal gain on the membrane thickness
d, the response of biosensors varying
d from 0.0001 to 0.05 cm at different maximal enzymatic rate
V1 of enzyme E
1 and rate
V2 of enzyme E
2 was simulated.
Fig. 8 shows the signal gains
GCEC and
GCCE versus the membrane thickness
d at the maximal enzymatic rate
V1 = 1 μmol/(cm
3s) and three values of the rate
V2: 1, 10 and 100 nmol/(cm
3s). Comparing the gain
GCEC with
GCCE, one can notice valuable differences in behaviour of the signal gains. In the case of a CEC biosensor action, no notable amplification is observed in cases of a thin enzyme membrane (
d < 10
−3 cm). A more distant increase of the thickness causes an increase of the gain
GCEC. The thickness at which
GCEC starts to increase, depends on the maximal enzymatic rate
V2.
The response of amperometric biosensors is known to be under mass-transport control if the diffusion modulus
σ2 is greater than unity, otherwise the enzyme kinetics controls the response:
where
Vmax is the maximal enzymatic rate and
KM is the Michaelis constant. Since the diffusion coefficient
DS and
KM =
K1 =
K2 are constant in all our numerical experiments as defined in (
30) and the behaviour of biosensors acting in a trigger mode is mainly determined by the enzymatic rate
V2, (
Figs. 5 and
6) the thickness
dσ of the enzyme layer as a function of
V2 at which
σ2 = 1 has been introduced:
Comparing the value
dσ(10
−6) ≈ 5.5×10
−4 cm with the membrane thickness at which the gain
GCEC starts to increase
V2 = 10
−6 mol/(cm
3s), one can notice that the amplification becomes noticeable when the mass transport by diffusion starts to control the biosensor response. As one can see in
Fig. 8, this effect is also valid for two other values of the maximal enzymatic rate
V2: 10 and 100 nmol/(cm
3s). However, this is valid in the case of the biosensor acting in the CEC mode only. In the case of CCE mode, the gain
GCCE increases notably with increase of the thickness
d in the entire domain.
GCCE is approximately a linear increasing function of
d. However, the real amplification takes place in cases of relatively thick membranes only,
GCCE > 1 if only
d > ≈2
dσ. As it was noticed above (see
Fig. 6), the steady-state current of the biosensor acting in the CCE mode may be even significantly less than the steady-state current of the corresponding biosensor acting in the CE mode at the same conditions. In a case of a relatively thick enzyme membrane, the gain
GCCE equals approximately to
GCEC,
GCCE ≈
GCEC.
Using a computer simulation, we calculated more precisely the thickness
dG of the enzyme membrane at which
GCCE = 1 for different enzymatic rates
V2. Accepting
V1 = 1 μmol/(cm
3s) it was found that
dG ≈ 0.0009 at
V2 = 100,
dG ≈ 0.003 at
V2 = 10, and
dG ≈ 0.009 cm at
V2 = 100 nmol/(cm
3s). These values of the membrane thickness compare favourably with values of the thickness
dmax at which the steady-state current as a function of the membrane thickness
d gains the maximum [
24]:
Consequently, for a low substrate concentration the thickness
dG of the enzyme membrane at which
GCEC = 1 can be precisely enough expressed as
dG ≈ 1.5
dσ, where
dσ was defined in (
33). Additional calculations showed that this property is valid for wide ranges of both maximal enzymatic rates:
V1 and
V2, if only the normalized substrate concentration
S0N is less than unity.
The effect of the membrane thickness on the response time
For comparing the time of a steady-state amplified biosensor response with the steady-state time of the response without amplification, we introduce a prolongation (
L) of the response time as a ratio of the steady-state time of the trigger biosensor to the steady-state time of the corresponding CE biosensor:
where
Tm(
V1,
V2) is the steady-state time of the triggering biosensor acting in mode
m at the maximal activity
Vi of the enzyme E
i,
m = CEC, CCE,
i = 1, 2,
TCE(
V1) is the steady-state time of the corresponding CE biosensor at the maximal enzymatic rate
V1. Since the action of the CE biosensor can be simulated as an action of a CEC biosensor accepting
V2 = 0, we assume
TCE(
V1) =
TCEC(
V1, 0).
Fig. 9 shows the change of the response time versus the membrane thickness
d at
V1 = 1 μmol/(cm
3s) and different values of
V2. One can see in
Fig. 9, in all the presented cases, the prolongation of the response time (
LCEC as well as
LCCE) is a non-monotonous function of the thickness
d. A shoulder on curves is especially noticeable at high maximal enzymatic rates. A similar effect was noticed in the case of biosensors with substrate cyclic conversion [
16] and during the oxidation of β-nicotinamide adenine dinucleotide (NADH) at poly(aniline)-coated electrodes [
28].
In the cases of thin enzyme membranes (d < 0.001 cm), the prolongation of the response time is insignificant. However, increasing the membrane thickness, the response time prolongation increases up to 3.4 times in both modes: CEC and CCE.
In the case of the CEC mode, the slight influence of the maximal enzymatic rate
V2 on
LCEC can be noticed in
Fig. 9, while no notable influence of
V2 on
LCCE is observed in the case of CCE action mode. Additional calculations showed that the response time prolongation slightly depends on the substrate concentration
S0 as well as the maximal activity
V1 of the enzyme E
1.
