

Design and Manufacture of an Optimised Side-Shifted PPM EMAT Array for Use in Mobile Robotic Localisation
 , ,
, ,  , and
, and
Abstract
:1. Introduction
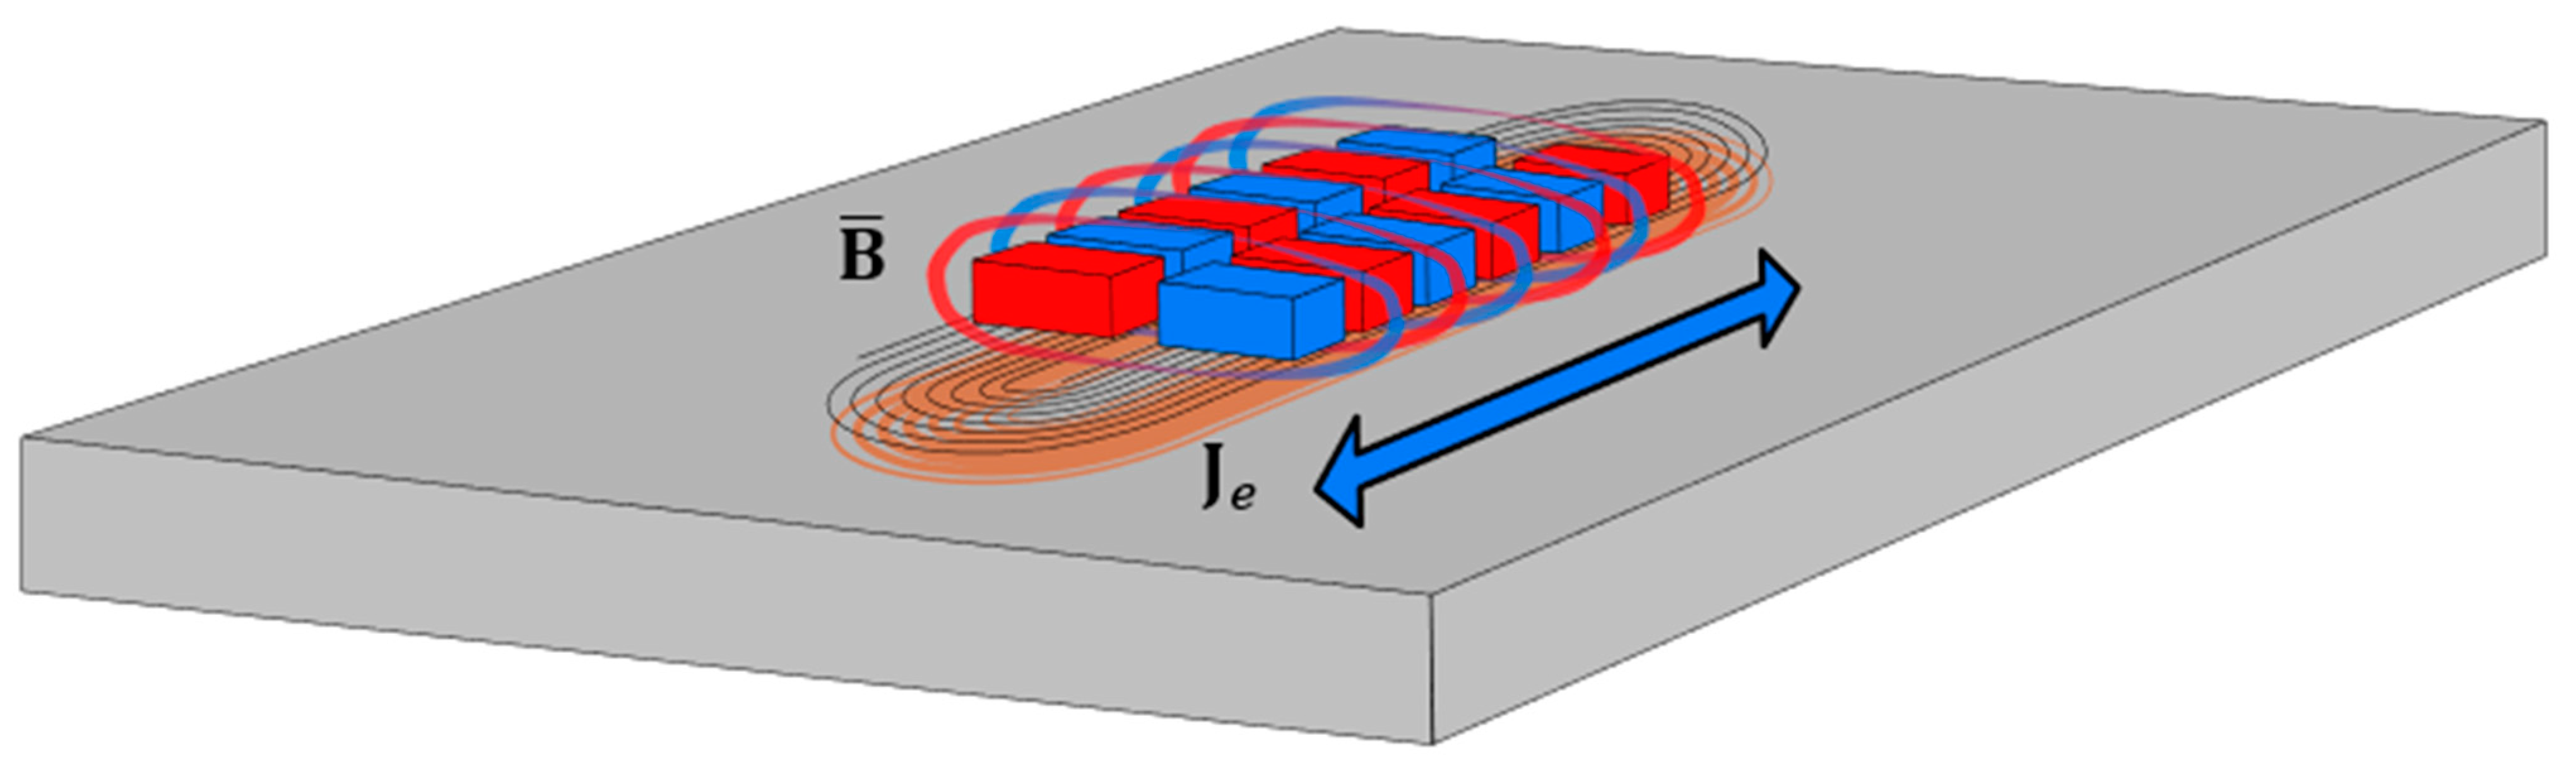
1.1. PPM EMATs
1.2. Unidirectional EMATs
1.3. This Work
2. Optimisation and Methodology
2.1. Transmitter Coil Optimisation
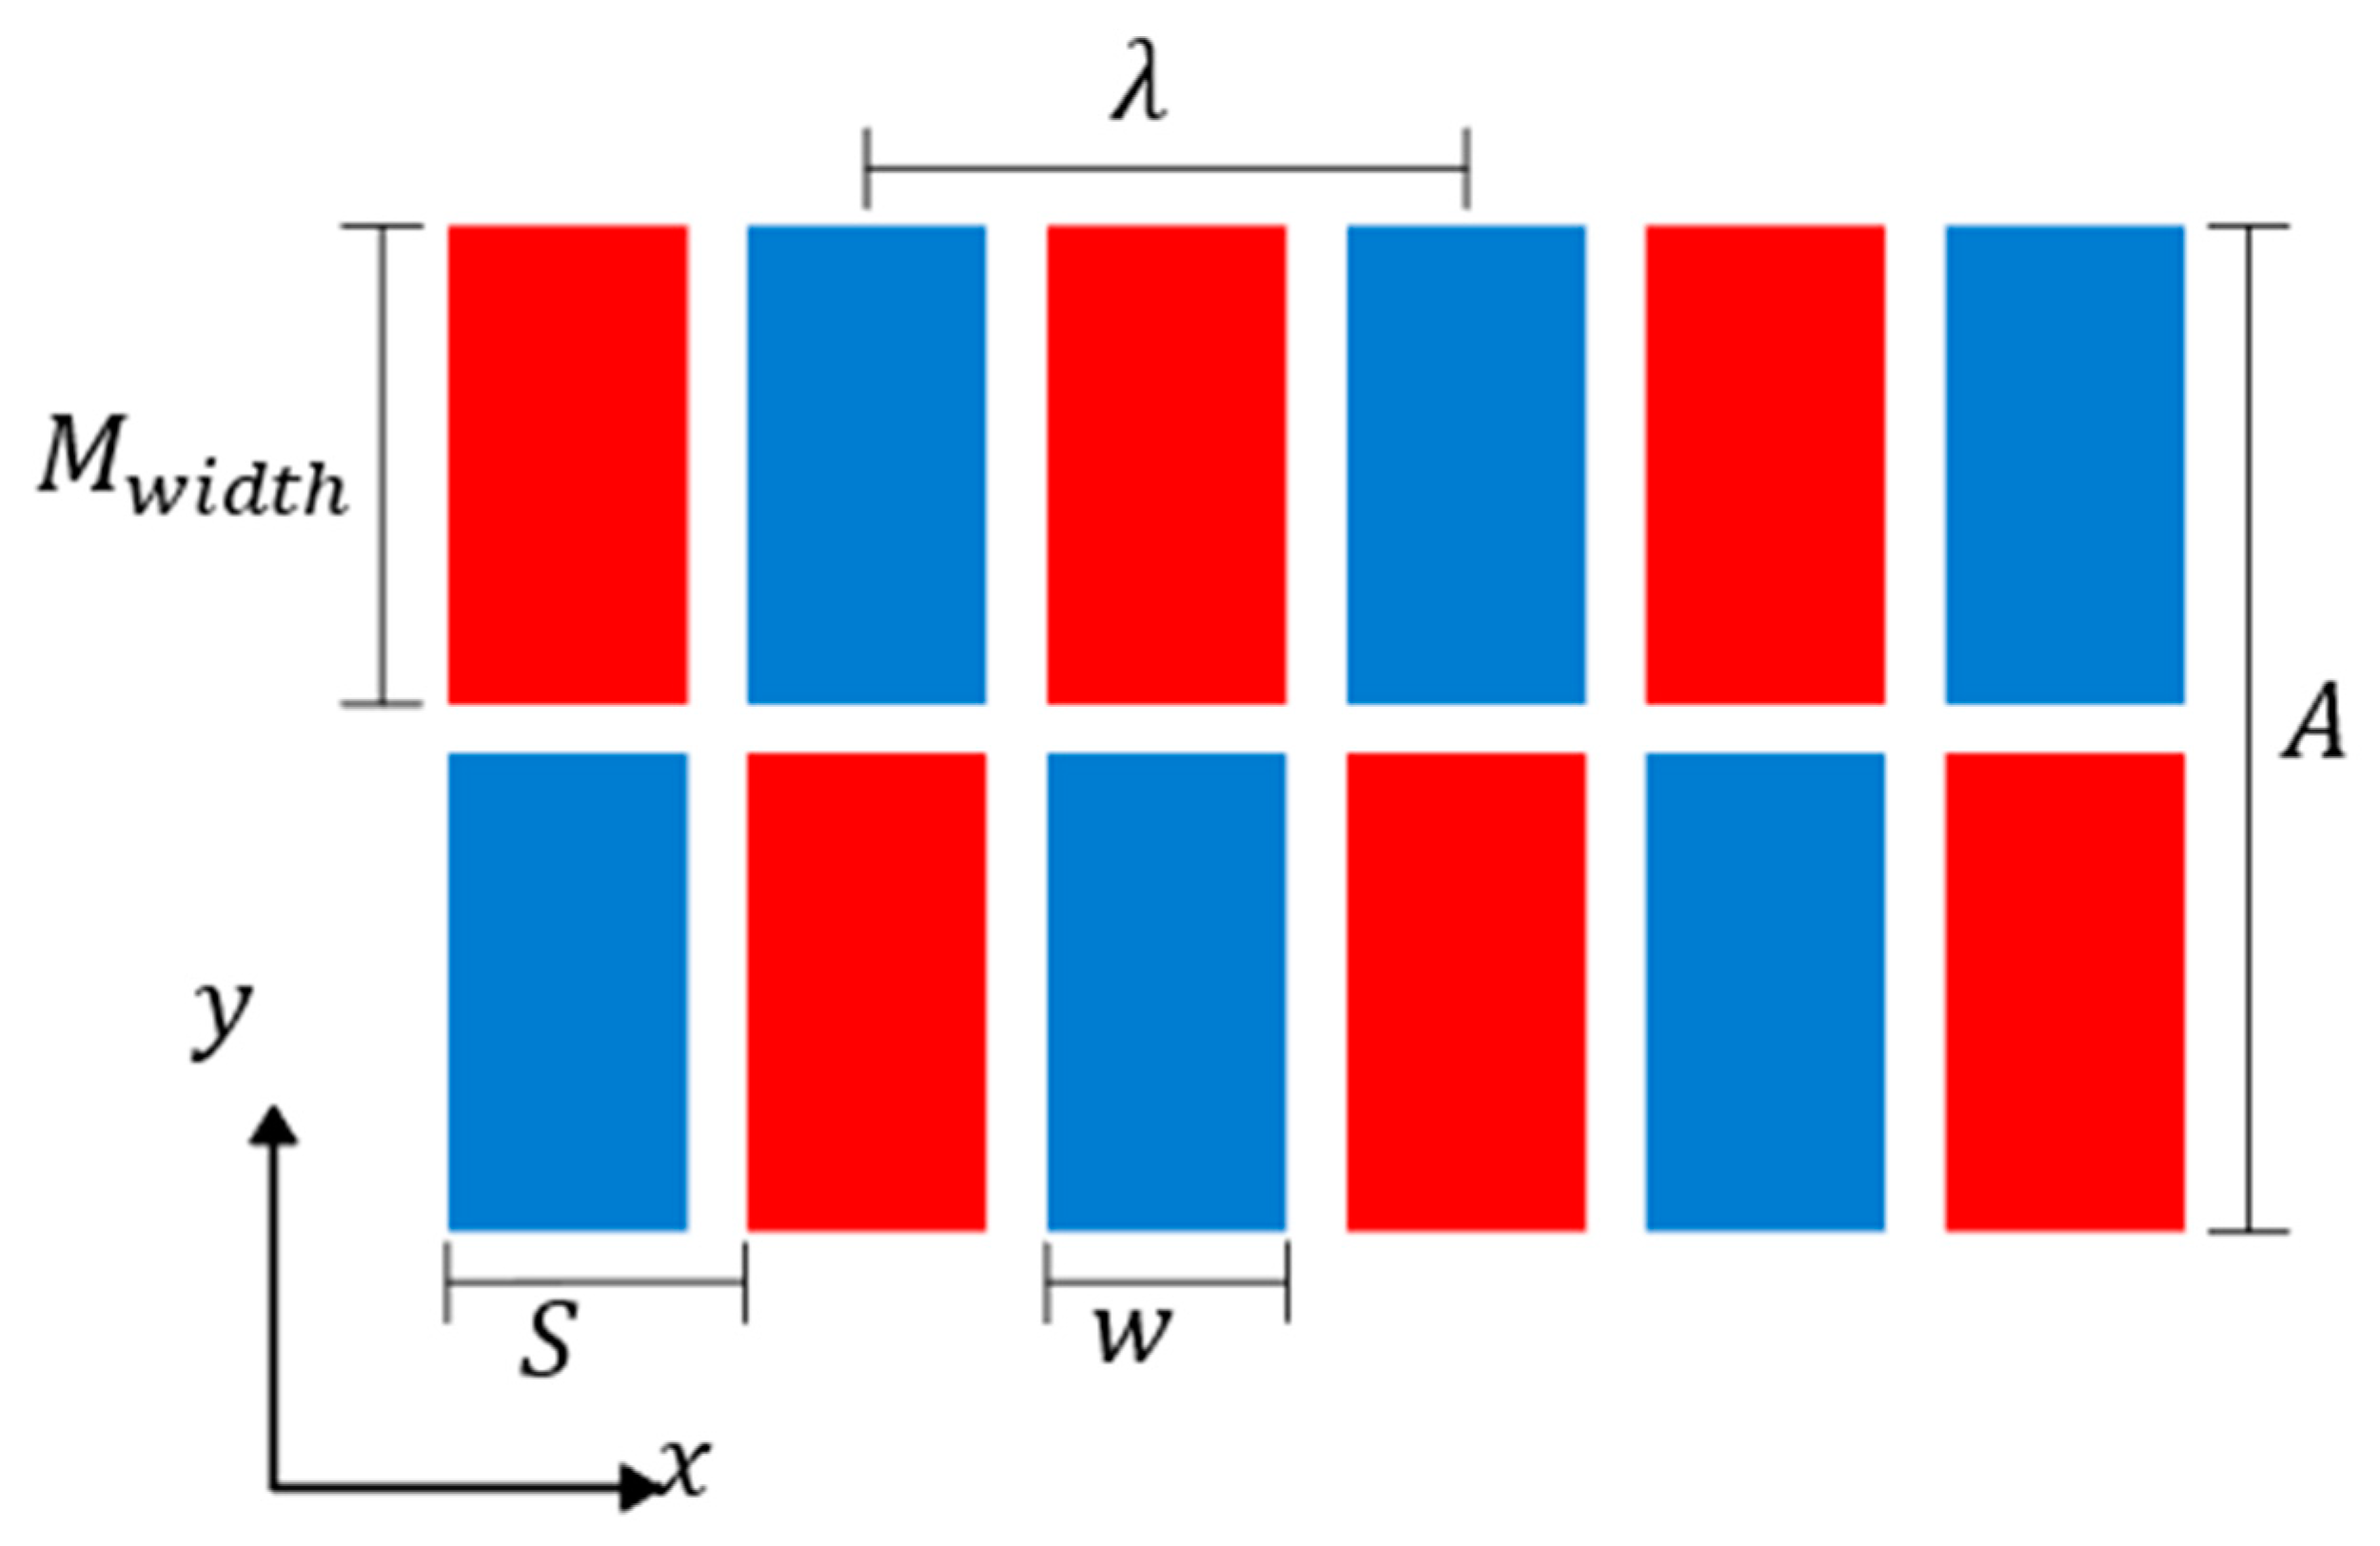
2.2. Transmitter Magnet Array Optimisation
3. Validation of Optimisation Model
3.1. Magnetisation Validation via Experiment
3.2. Industrial EMAT Comparison
4. Mobile Robotic Transducer Design
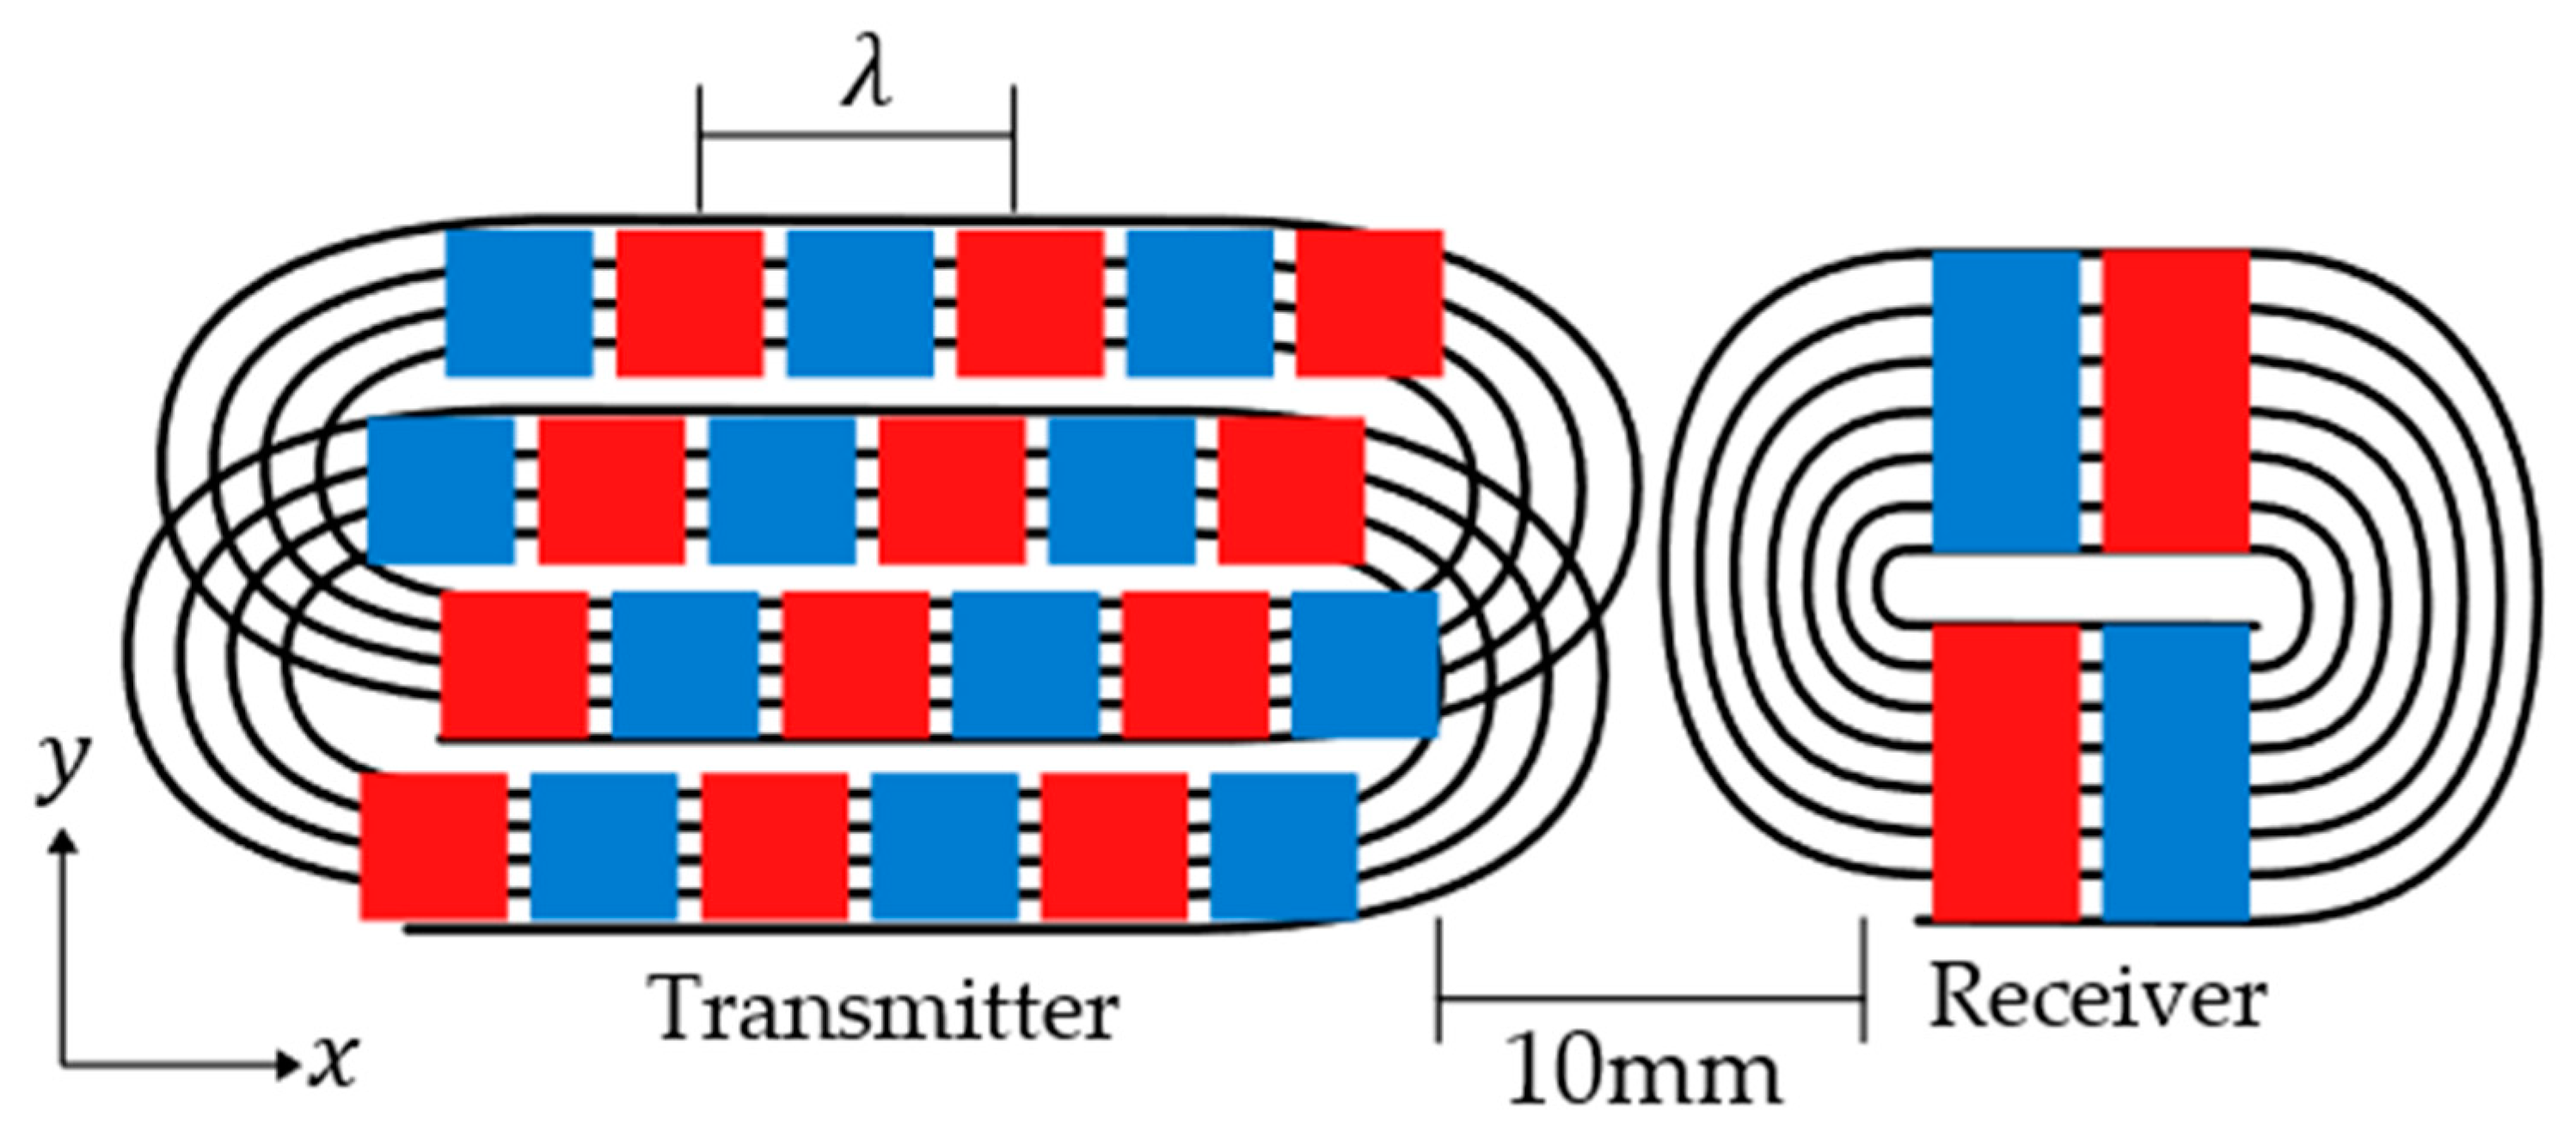
4.1. Transmitter/Receiver Setup
4.2. Transmitter EMAT Design
4.3. Reduced Size Receiver EMAT Design
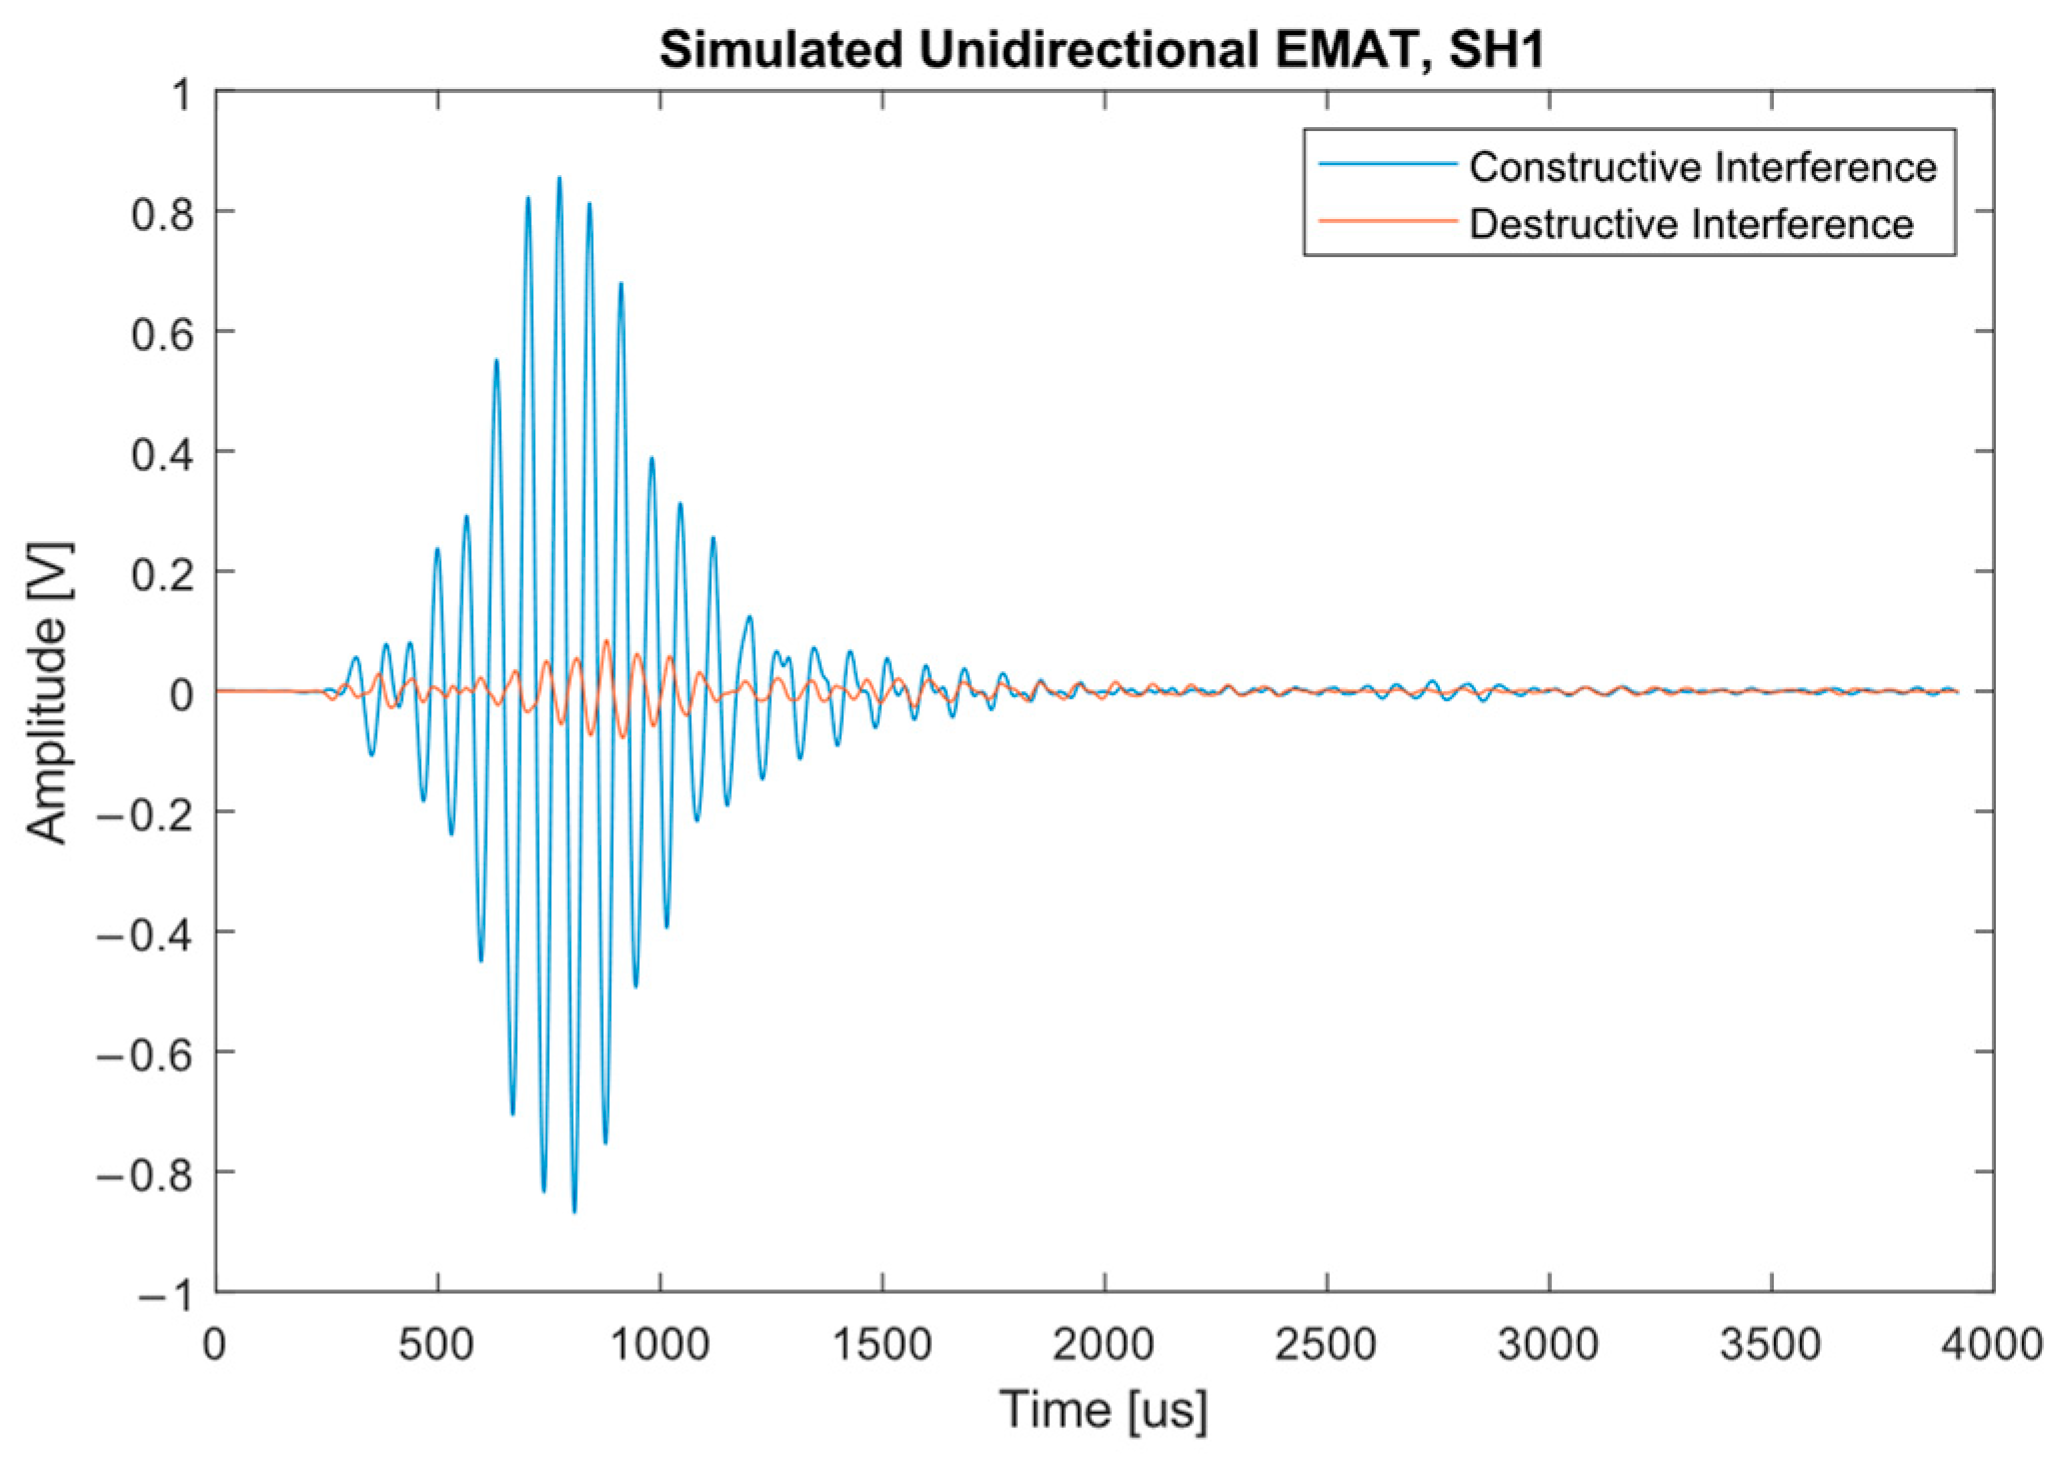
4.4. Simulation of Unidirectional Transmitter EMAT
4.4.1. Simulation Setup
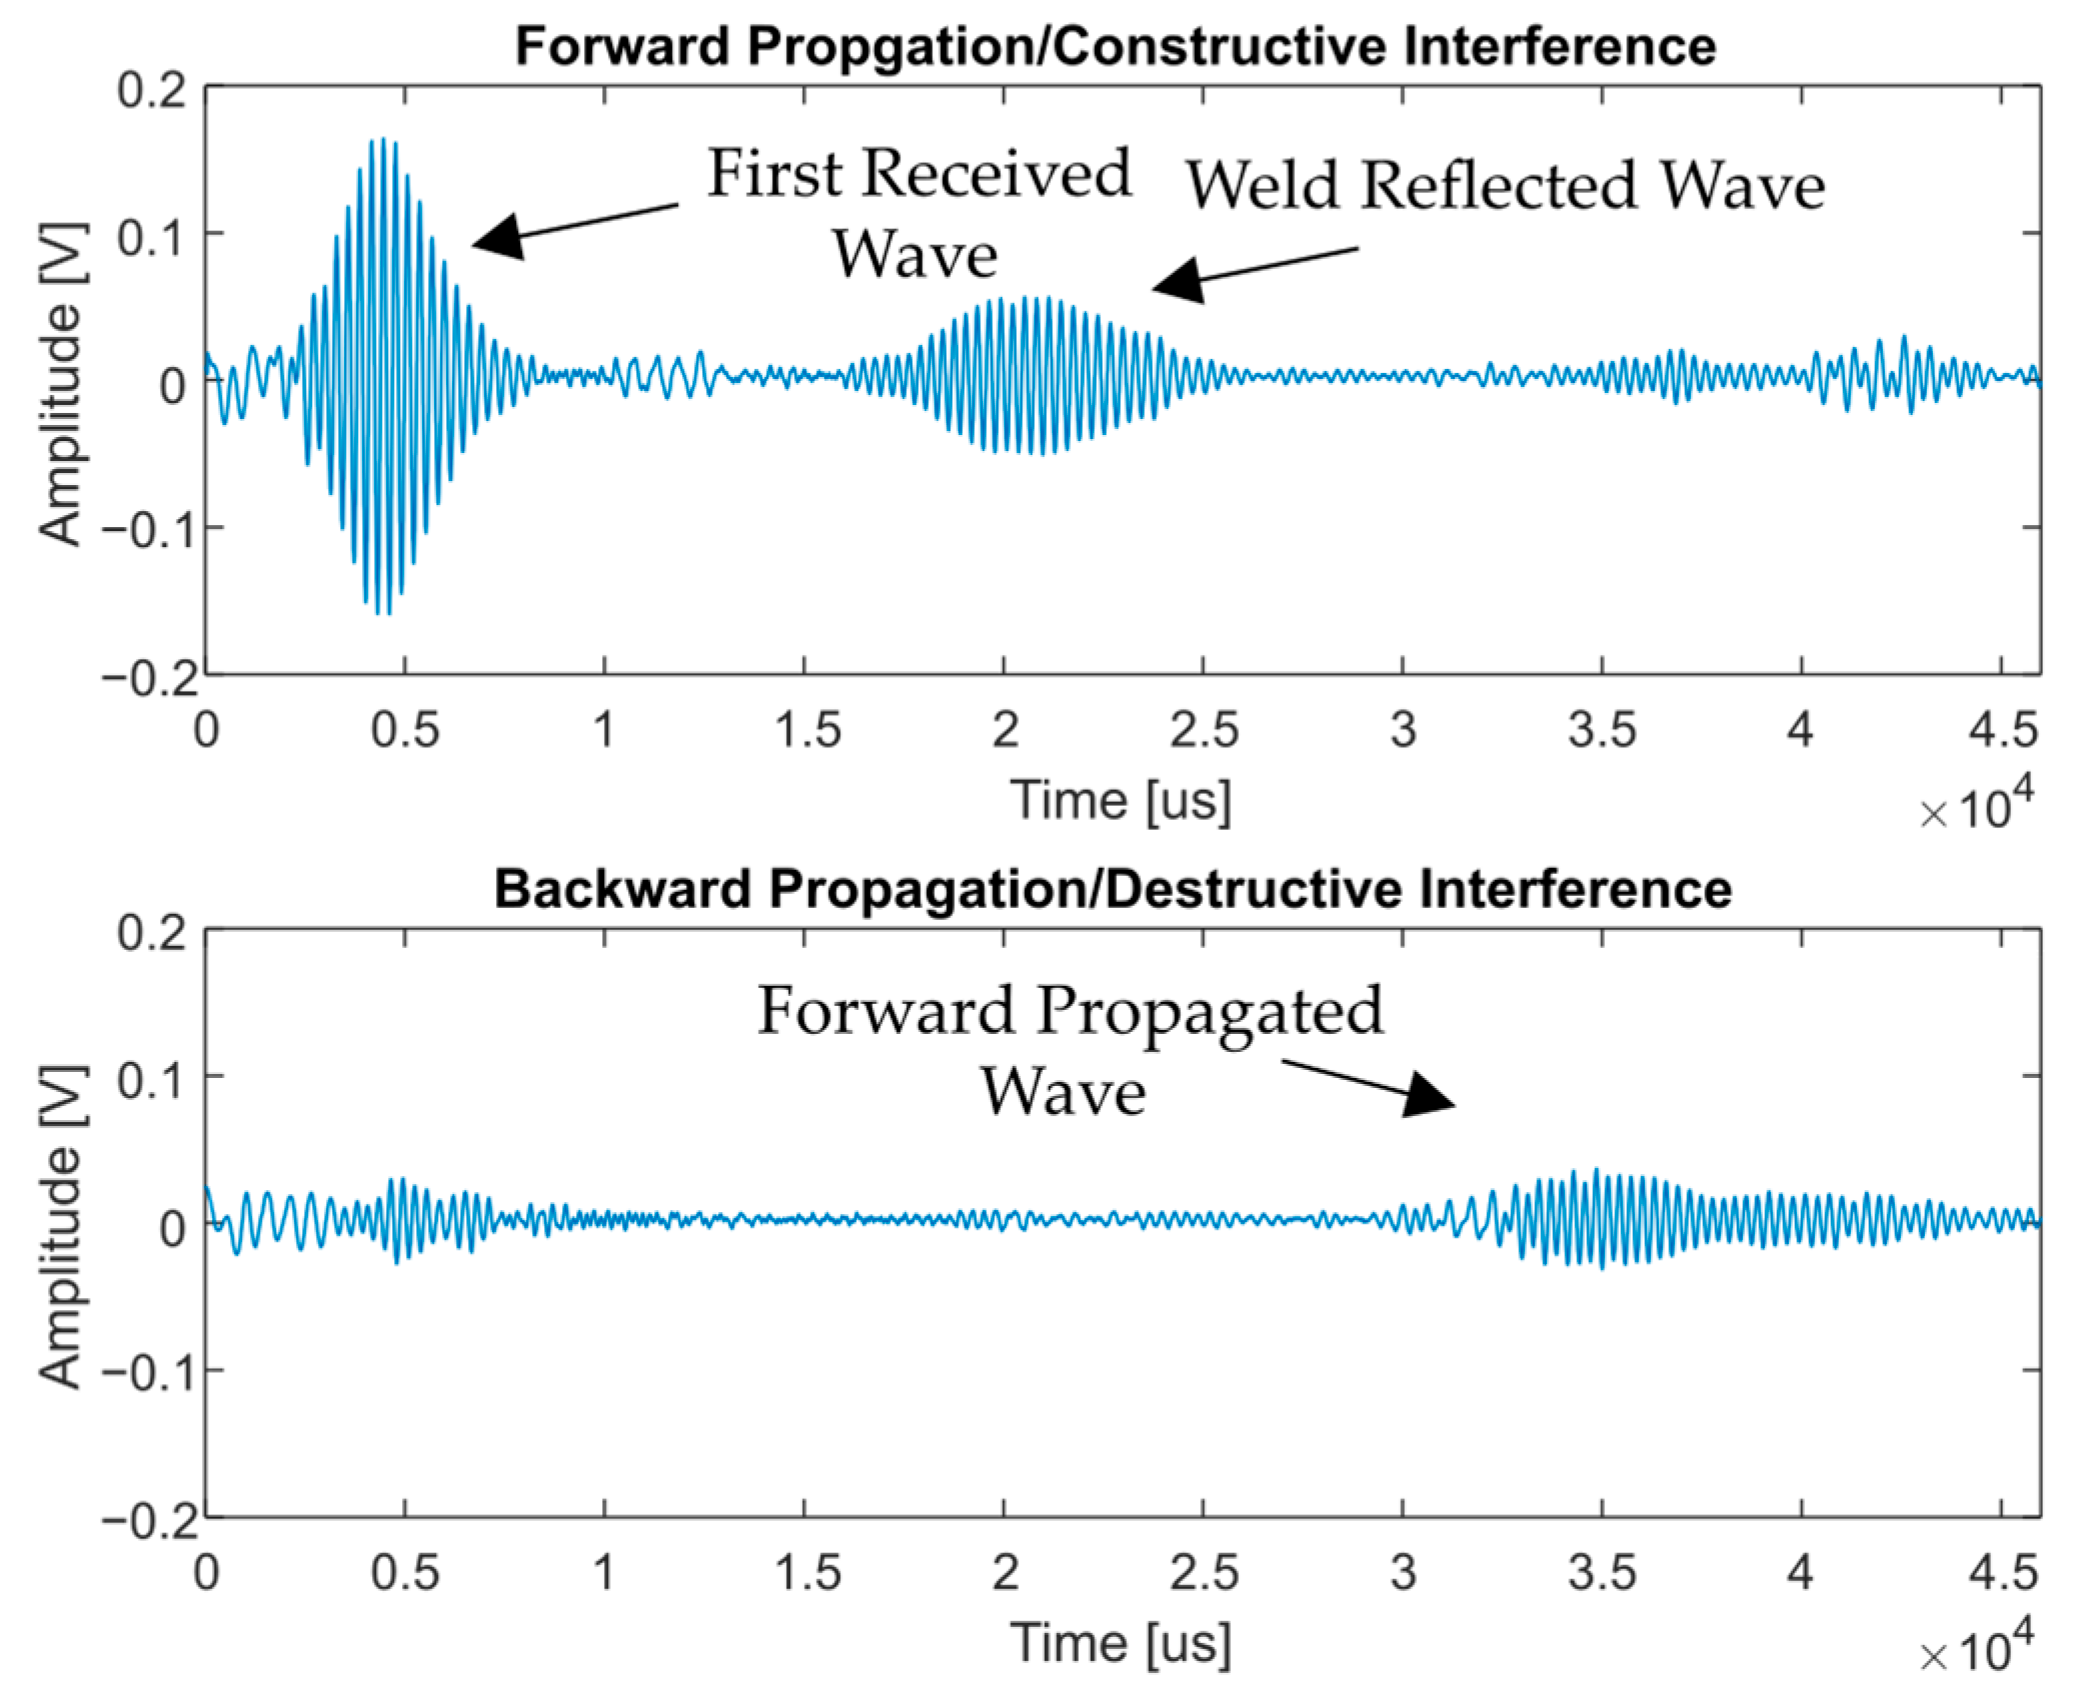
4.4.2. Simulation Results
4.5. Experimental Test of Unidirectional EMAT
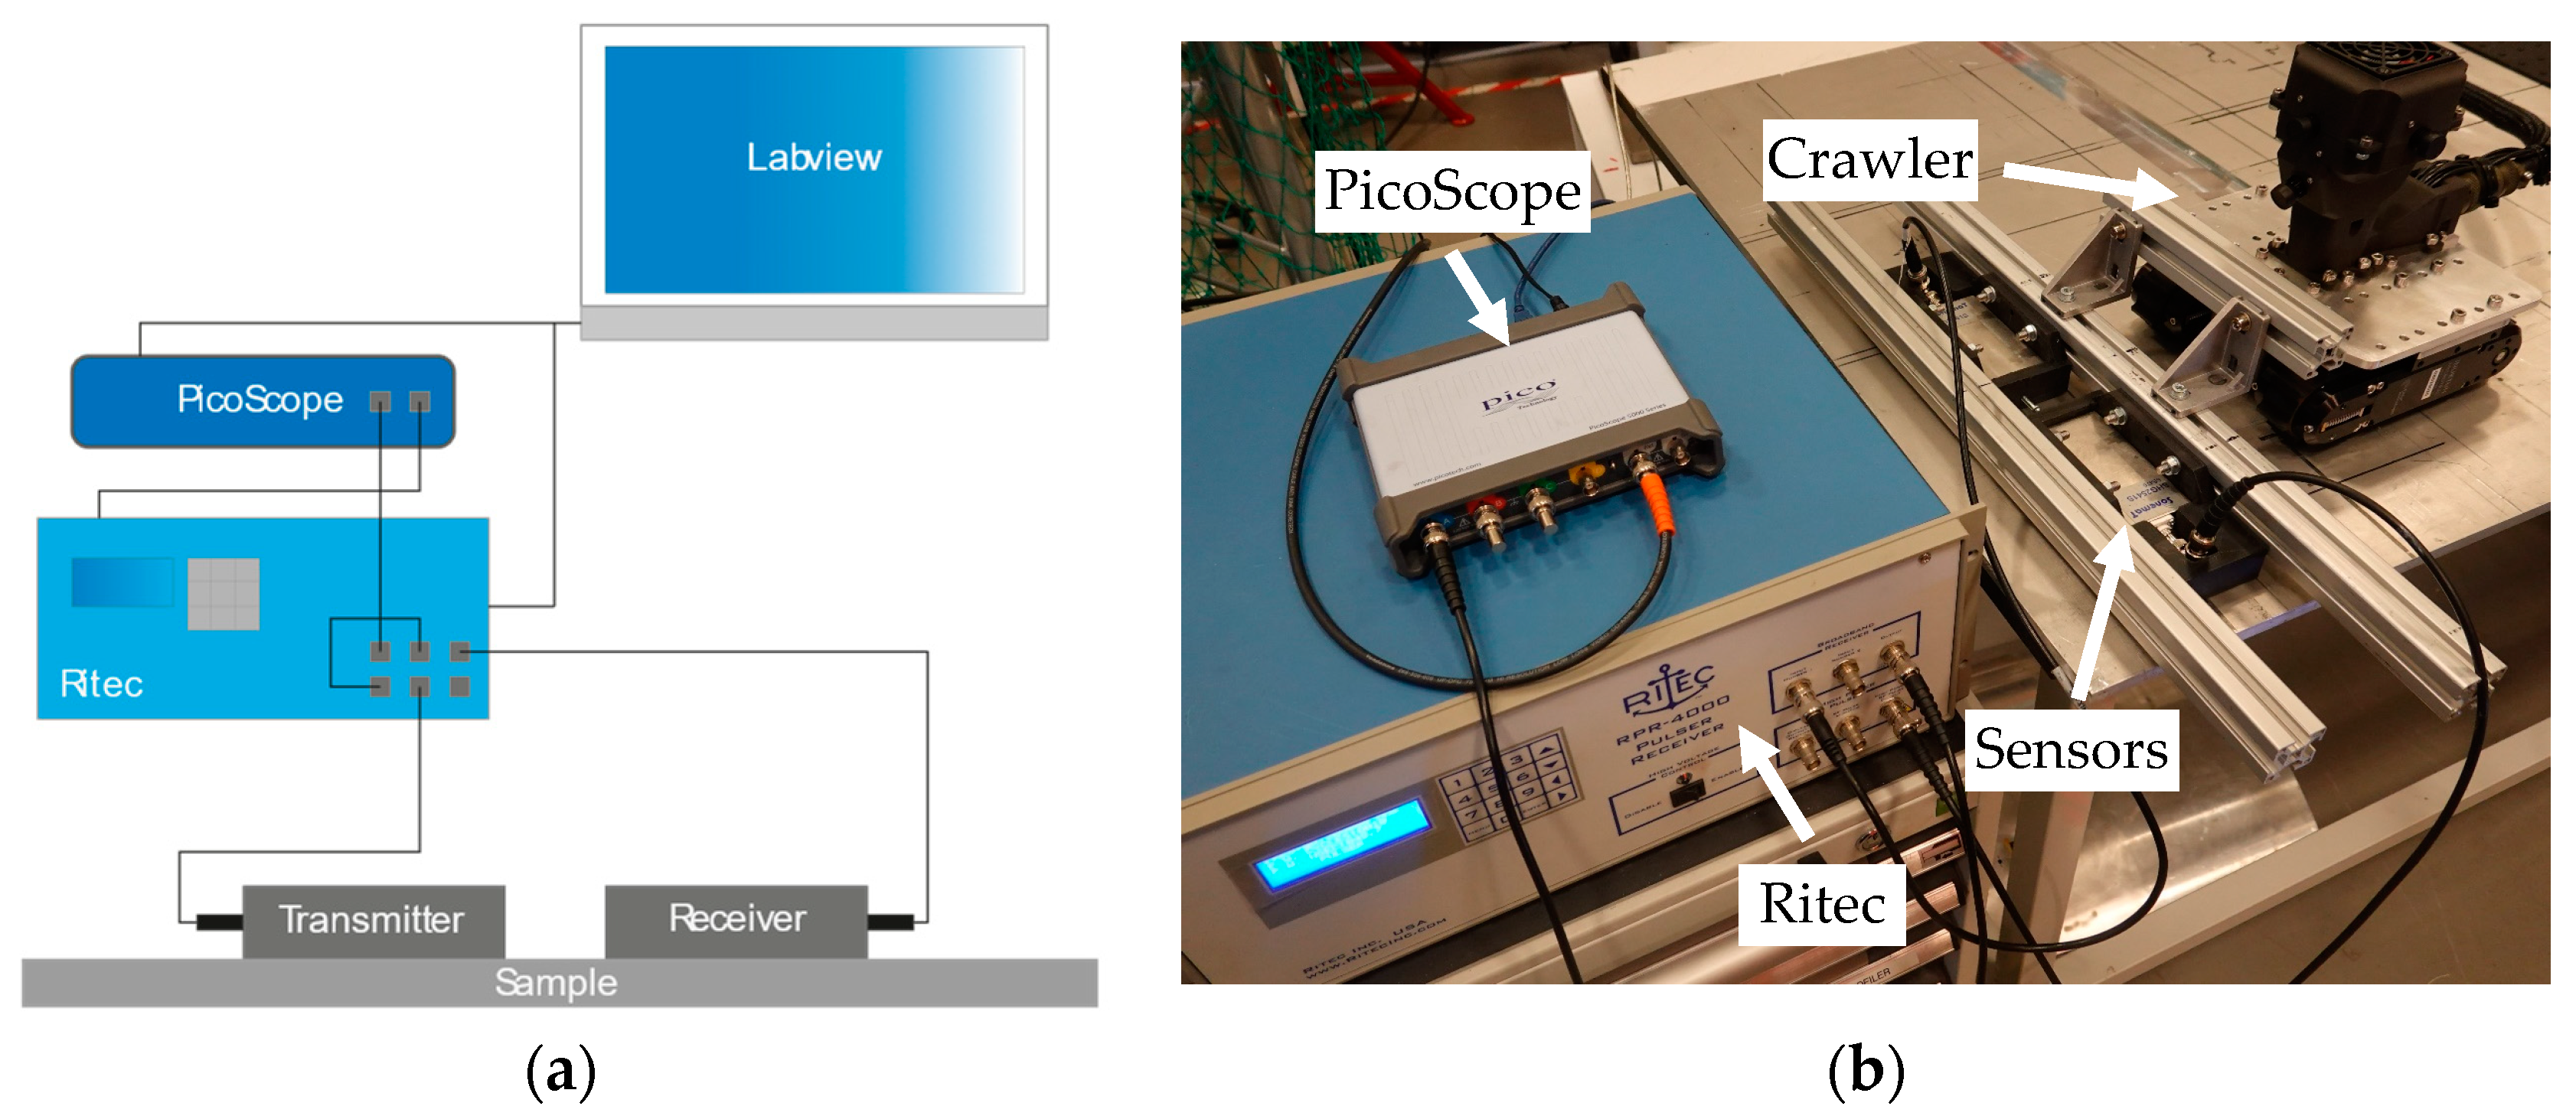
4.5.1. Experimental Setup
4.5.2. Transmitter Test Results
4.5.3. Receiver Test Results
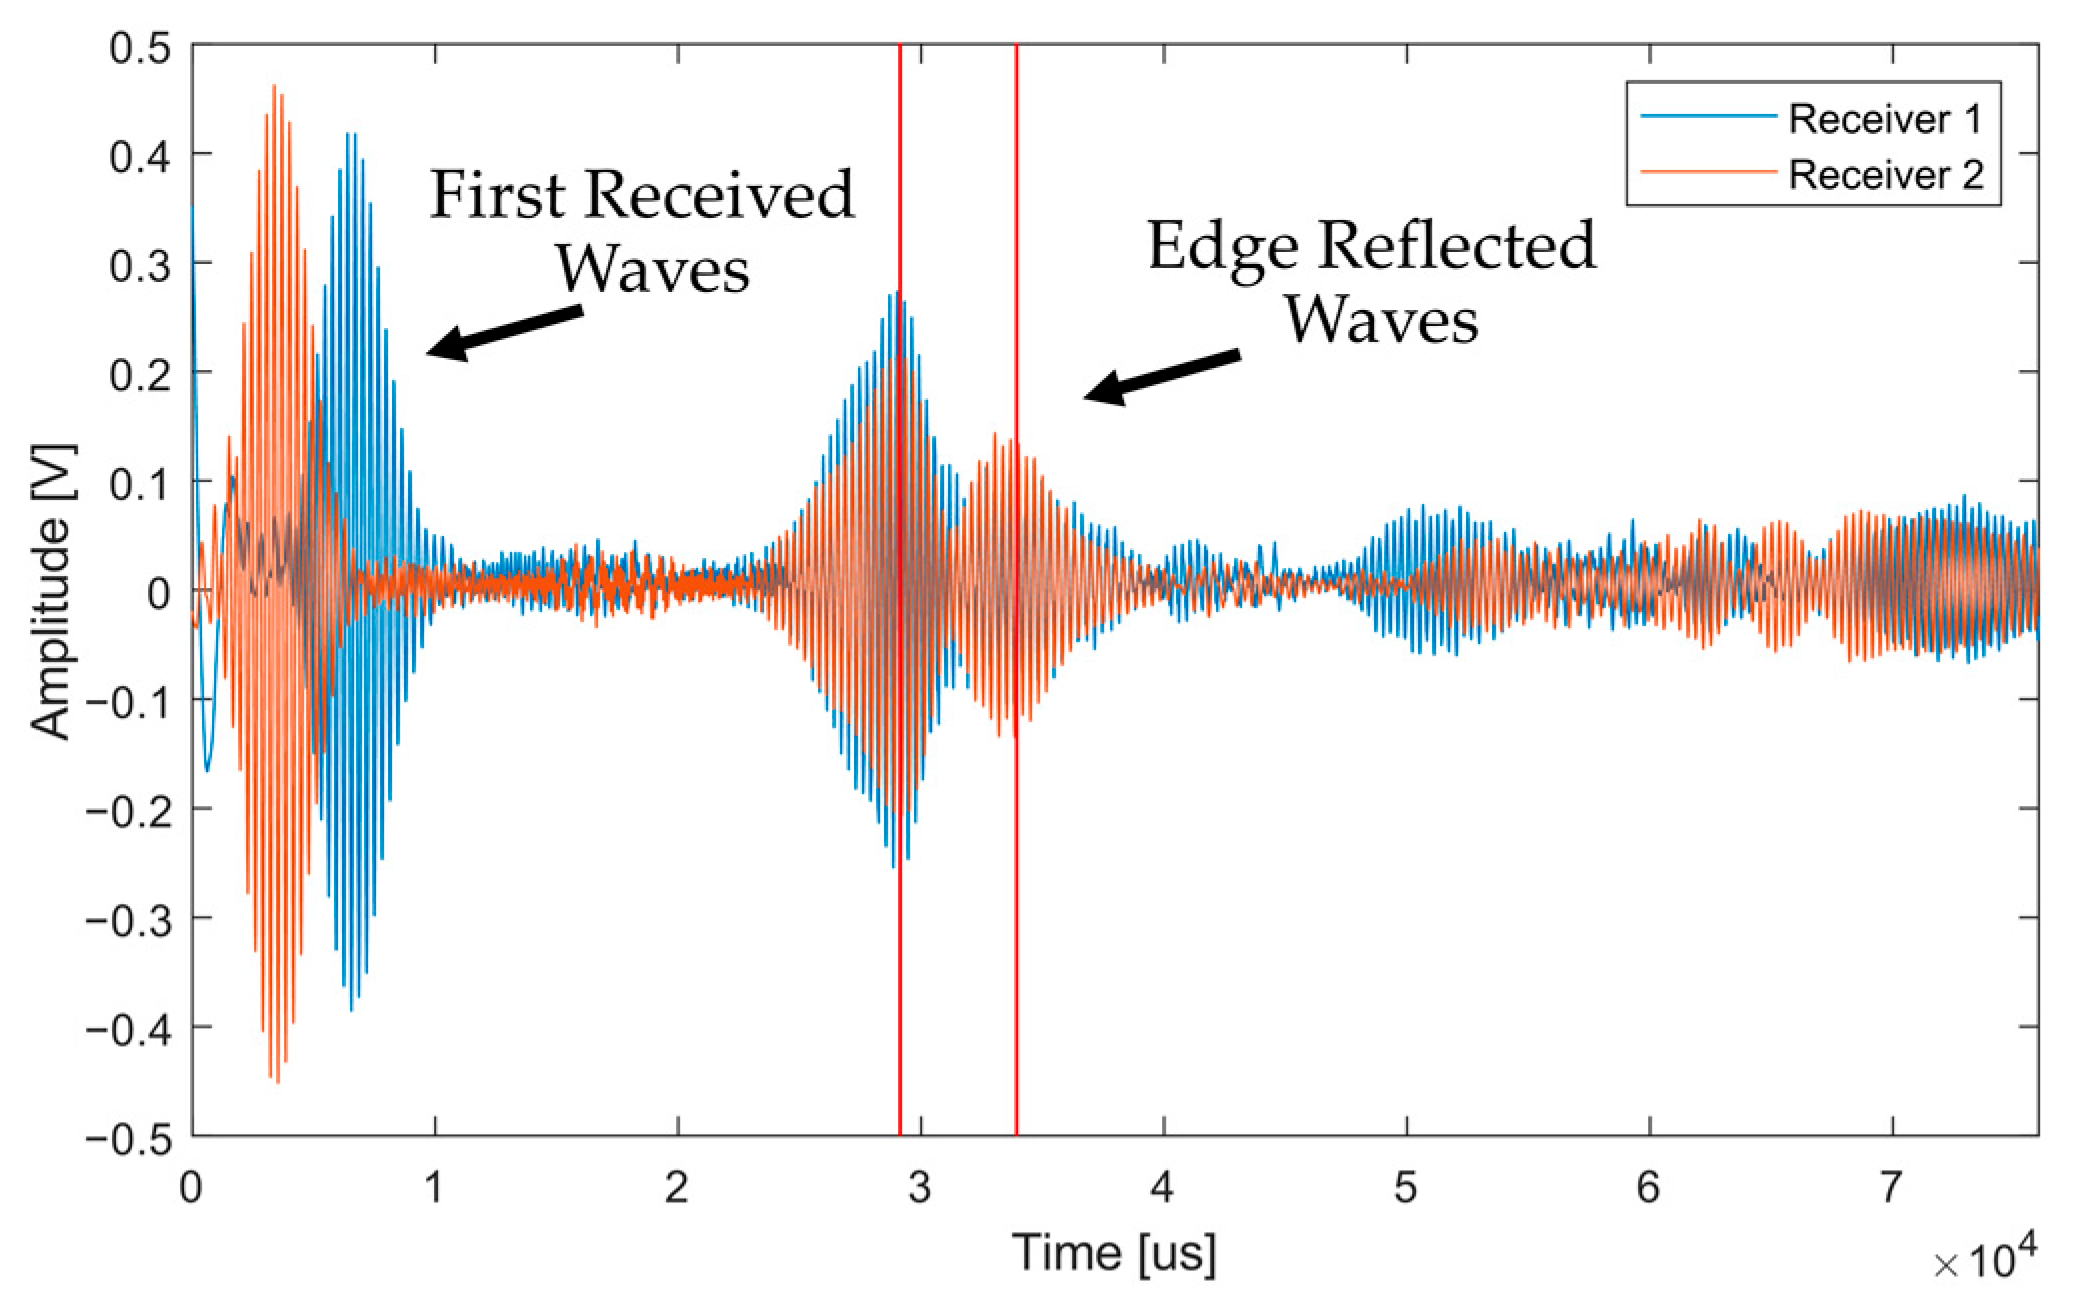
4.6. Transducer Ranging
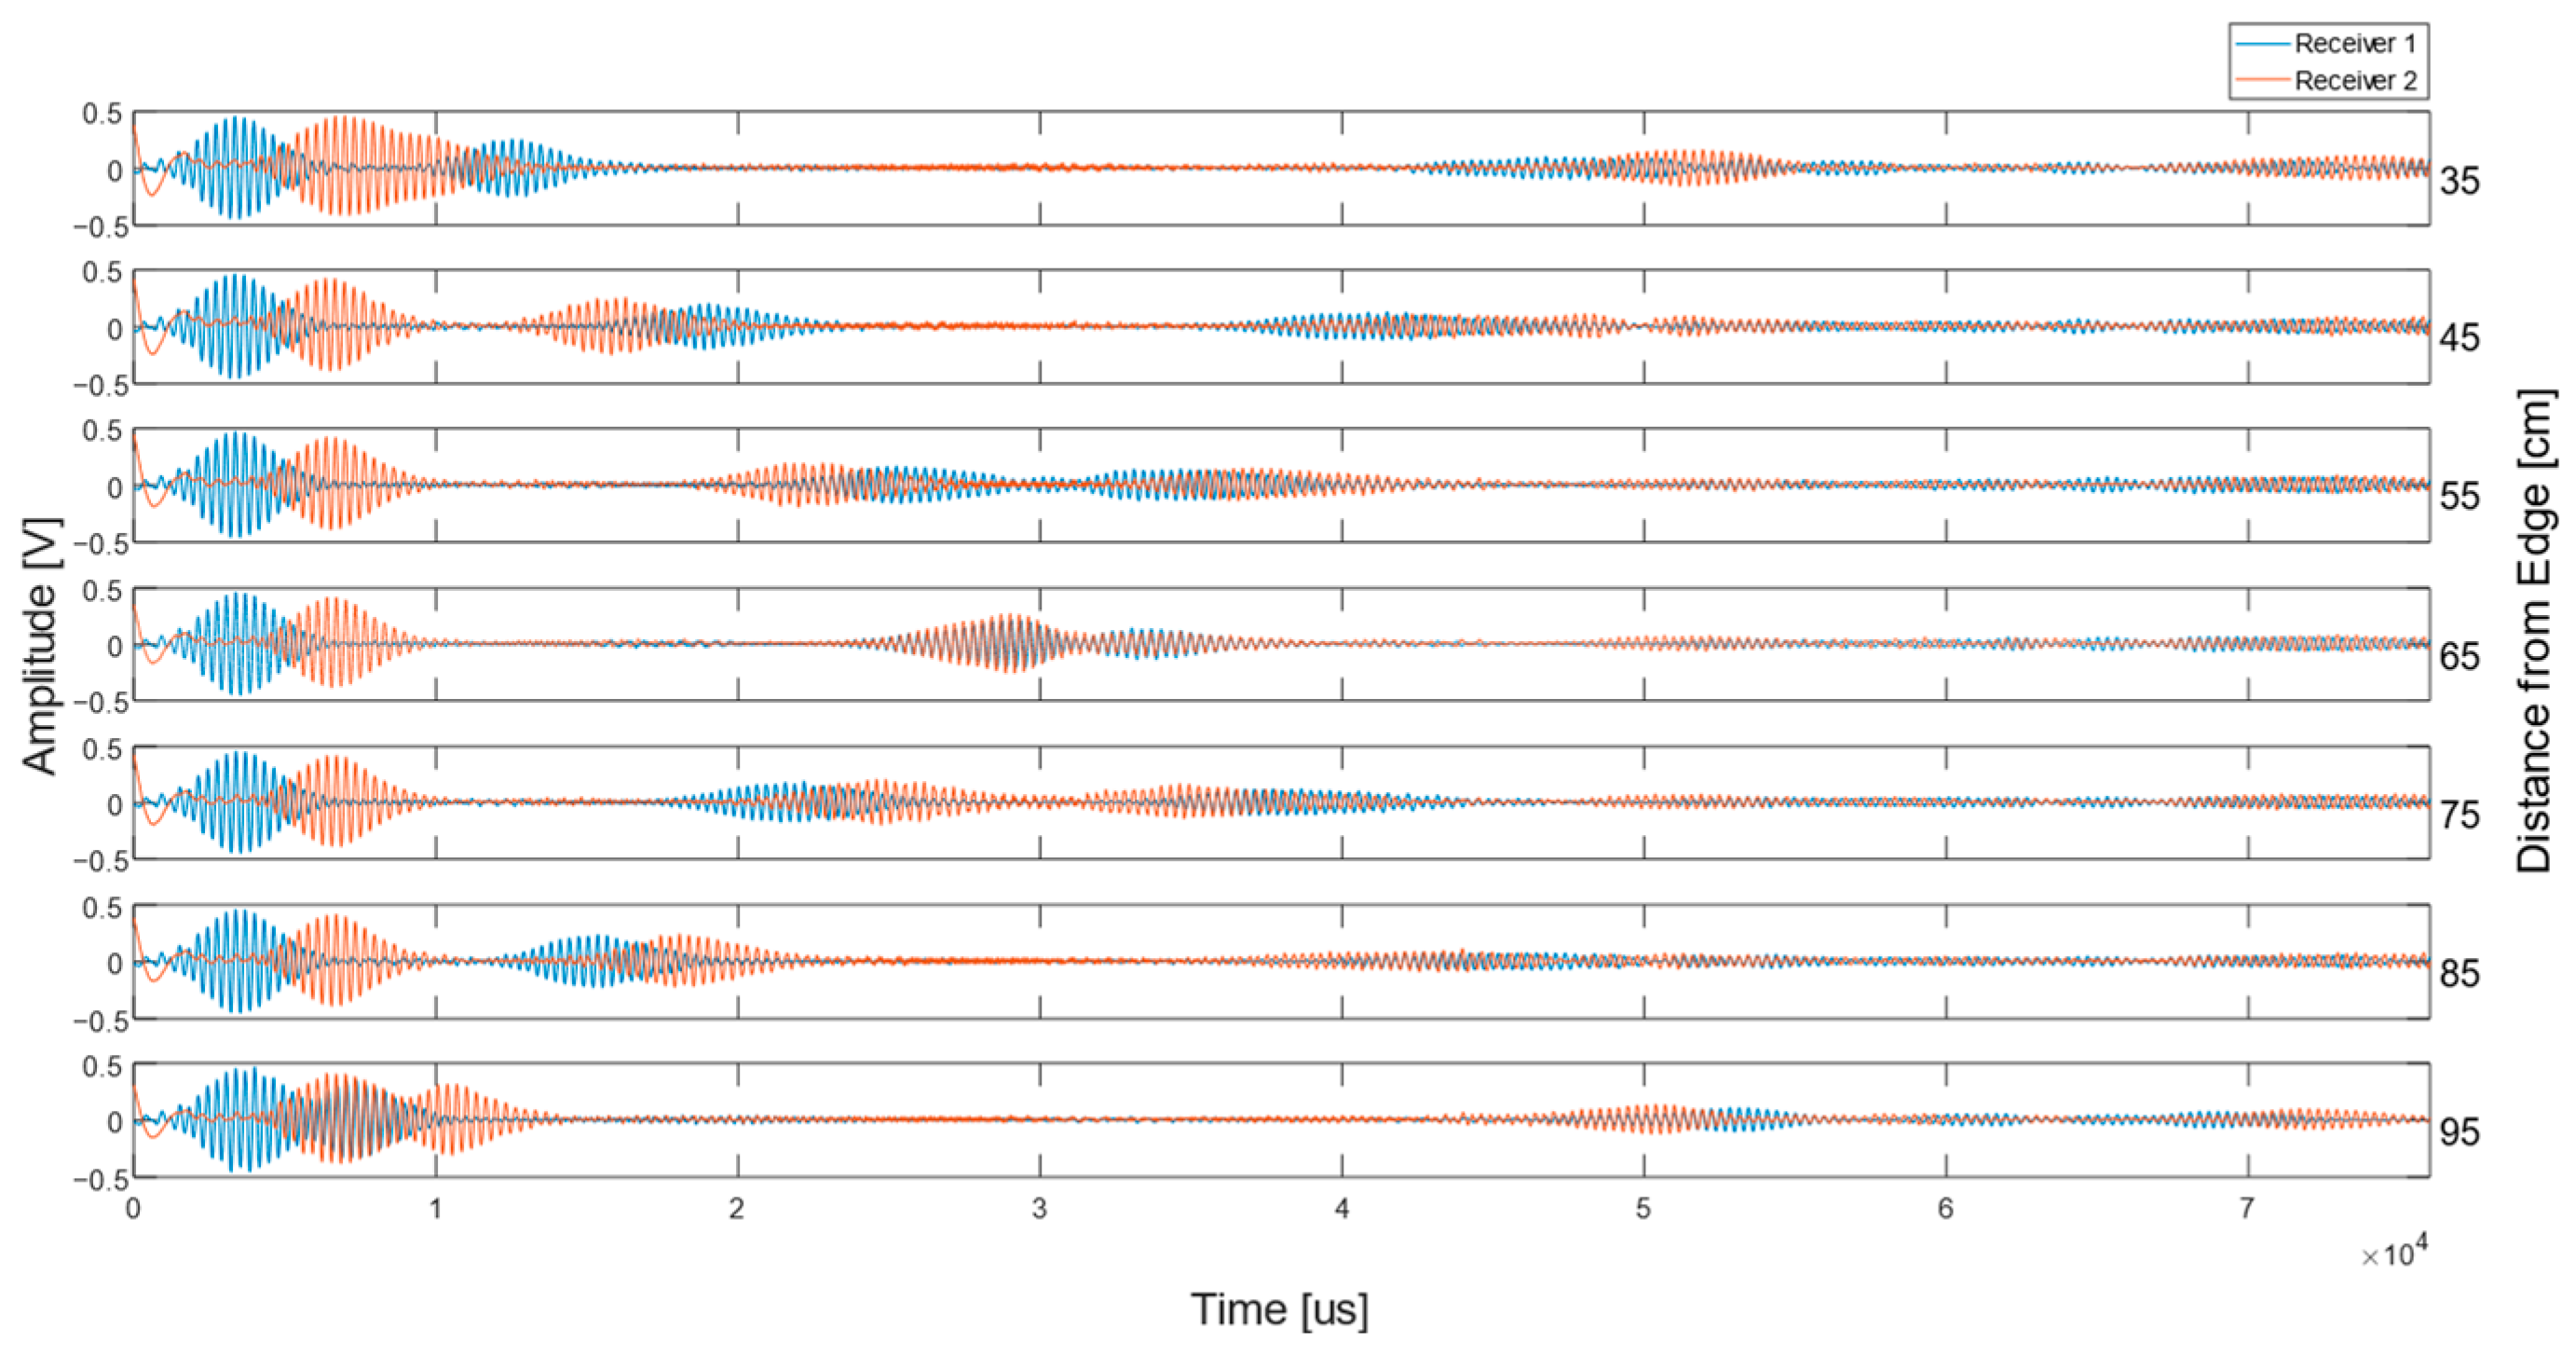
4.6.1. Mapping Performance Setup
4.6.2. Mapping Performance Results
5. Conclusions
Author Contributions
Funding
Institutional Review Board Statement
Informed Consent Statement
Data Availability Statement
Acknowledgments
Conflicts of Interest
References
- Farley, J.M.; Babcock, M.; Renfrew, U.K. Best practice in the application of NDT–An update. In Proceedings of the 16th World Conference on NDT, Montreal, QC, Canada, 30 August–3 September 2004. [Google Scholar]
- Horrocks, P.; Mansfield, D.; Parker, K.; Thomson, J.; Atkinson, T.; Worsley, J. Managing Ageing Plant; HSE Books: Warrington, UK, 2010; p. 53. [Google Scholar]
- Rubio, F.; Valero, F.; Llopis-Albert, C. A review of mobile robots: Concepts, methods, theoretical framework, and applications. Int. J. Adv. Robot. Syst. 2019, 16, 1729881419839596. [Google Scholar] [CrossRef]
- Human Factors/Ergonomics, Health and Safety in the Workplace. Available online: https://www.hse.gov.uk/humanfactors/index.htm (accessed on 13 May 2021).
- Tabatabaeipour, M.; Trushkevych, O.; Dobie, G.; Edwards, R.S.; McMillan, R.; Macleod, C.; O’Leary, R.; Dixon, S.; Gachagan, A.; Pierce, S.G. Application of ultrasonic guided waves to robotic occupancy grid mapping. Mech. Syst. Signal Process. 2021, 163, 108151. [Google Scholar] [CrossRef]
- McMillan, R.; Tabatabaeipour, M.; Hampson, R.; Loukas, C.; Zhao, T.; Edwards, R.S.; Macleod, C.; Dobie, G. Characterization of EMAT Guided Wave Reflectivity on Welded Structures for use in Ranging. IEEE Sens. J. 2022; Early Access. [Google Scholar] [CrossRef]
- Thrun, S.; Burgard, W.; Fox, D. Probabilistic Robotics, 1st ed.; The MIT Press: Cambridge, MA, USA, 2006. [Google Scholar]
- Lowe, M.J.S.; Cawley, P. Long Range Guided Wave Inspection Usage—Current Commercial Capabilities and Research Directions; Imperial College London: London, UK, 2006; p. 40. [Google Scholar]
- Rose, J.L. Ultrasonic Guided Waves in Solid Media; Cambridge University Press (CUP): Cambridge, UK, 2014. [Google Scholar]
- Wilcox, P.D. Lamb Wave Inspection of Large Structures Using Permanently Attached Transducers; University of Bristol: Bristol, UK, 1998; p. 223. [Google Scholar]
- Luo, W.; Zhao, X.; Rose, J.L. A Guided Wave Plate Experiment for a Pipe. J. Press. Vessel. Technol. 2005, 127, 345–350. [Google Scholar] [CrossRef]
- Ribichini, R.; Cegla, F.; Nagy, P.B.; Cawley, P. Study and comparison of different EMAT configurations for SH wave inspection. IEEE Trans. Ultrason. Ferroelectr. Freq. Control. 2011, 58, 2571–2581. [Google Scholar] [CrossRef] [PubMed]
- Hirao, M.; Ogi, H. Electromagnetic Acoustic Transducers; Springer: Tokyo, Japan, 2017. [Google Scholar]
- Ribichini, R. Modelling of Electromagnetic Acoustic Transducers; Imperial College London: London, UK, 2011; p. 154. [Google Scholar]
- Petcher, P.; Burrows, S.; Dixon, S. Shear horizontal (SH) ultrasound wave propagation around smooth corners. Ultrasonics 2014, 54, 997–1004. [Google Scholar] [CrossRef]
- Ribichini, R.; Cegla, F.; Nagy, P.; Cawley, P. Experimental and numerical evaluation of electromagnetic acoustic transducer performance on steel materials. NDT E Int. 2012, 45, 32–38. [Google Scholar] [CrossRef]
- Thompson, R. A model for the electromagnetic generation of ultrasonic guided waves in ferromagnetic metal polycrystals. IEEE Trans. Sonics Ultrason. 1978, 25, 7–15. [Google Scholar] [CrossRef]
- Trushkevych, O.; Tabatabaeipour, M.; Dixon, S.; Potter, M.D.G.; Dobie, G.; Macleod, C.; Edwards, R.S. Miniaturised SH EMATs for Fast Robotic Screening of Wall Thinning in Steel Plates. IEEE Sens. J. 2020, 21, 1386–1394. [Google Scholar] [CrossRef]
- Wang, S.; Su, R.; Chen, X.; Kang, L.; Zhai, G. Numerical and experimental analysis of unidirectional meander-line coil electromagnetic acoustic transducers. IEEE Trans. Ultrason. Ferroelectr. Freq. Control. 2013, 60, 2657–2664. [Google Scholar] [CrossRef] [PubMed]
- Rieger, K.; Erni, D.; Rueter, D. Unidirectional emission and detection of Lamb waves based on a powerful and compact coils-only EMAT. NDT E Int. 2021, 122, 102492. [Google Scholar] [CrossRef]
- Kubrusly, A.C.; Kang, L.; Dixon, S. Unidirectional Shear Horizontal Wave Generation with Side-Shifted Periodic Permanent Magnets Electromagnetic Acoustic Transducer. IEEE Trans. Ultrason. Ferroelectr. Freq. Control. 2020, 67, 2757–2760. [Google Scholar] [CrossRef]
- Kubrusly, A.C.; Kang, L.; Martins, I.S.; Dixon, S. Unidirectional Shear Horizontal Wave Generation by Periodic Permanent Magnets Electromagnetic Acoustic Transducer with Dual Linear-Coil Array. IEEE Trans. Ultrason. Ferroelectr. Freq. Control. 2021, 68, 3135–3142. [Google Scholar] [CrossRef]
- Martinho, L.M.; Kubrusly, A.C.; Kang, L.; Dixon, S. Enhancement of the Unidirectional Radiation Pattern of Shear Horizontal Ultrasonic Waves Generated by Side-Shifted Periodic Permanent Magnets Electromagnetic Acoustic Transducers with Multiple Rows of Magnets. IEEE Sens. J. 2022, 22, 7637–7644. [Google Scholar] [CrossRef]
- Thon, A.; Painchaud-April, G.; Le Duff, A.; Bélanger, P. Optimization of a Lorentz forces EMAT for the reconstruction of the circumferential thickness profile of a steel pipe using high order shear horizontal modes. NDT E Int. 2022, 128, 102631. [Google Scholar] [CrossRef]
- Huang, S.L.; Sun, H.Y.; Wang, Q.; Wang, S.; Zhao, W. Unidirectional focusing of horizontally polarized shear elastic waves electromagnetic acoustic transducers for plate inspection. J. Appl. Phys. 2019, 125, 164504. [Google Scholar] [CrossRef]
- Sun, H.; Huang, S.; Wang, Q.; Wang, S.; Zhao, W. Improvement of unidirectional focusing periodic permanent magnet shear-horizontal wave electromagnetic acoustic transducer by oblique bias magnetic field. Sens. Actuators A Phys. 2019, 290, 36–47. [Google Scholar] [CrossRef]
- Sun, H.; Wang, S.; Huang, S.; Peng, L.; Wang, Q.; Zhao, W.; Zou, J. Point-Focusing Shear-Horizontal Guided Wave EMAT Optimization Method Using Orthogonal Test Theory. IEEE Sens. J. 2020, 20, 6295–6304. [Google Scholar] [CrossRef]
- Sun, H.; Peng, L.; Wang, S.; Wang, Q.; Zhao, W.; Huang, S. Effective Focal Area Dimension Optimization of Shear Horizontal Point-Focusing EMAT Using Orthogonal Test Method. IEEE Trans. Instrum. Meas. 2021, 70, 1–8. [Google Scholar] [CrossRef]
- Suresh, N.; Balasubramaniam, K. Quantifying the lowest remnant thickness using a novel broadband wavelength and frequency EMAT utilizing the cut-off property of guided waves. NDT E Int. 2020, 116, 102313. [Google Scholar] [CrossRef]
- Dobbs, E. Electromagnetic generation of ultrasonic waves in metals. J. Phys. Chem. Solids 1970, 31, 1657–1667. [Google Scholar] [CrossRef]
- Isla, J.; Seher, M.; Challis, R.; Cegla, F. Optimal impedance on transmission of Lorentz force EMATs. AIP Conf. Proc. 2016, 1706, 90012. [Google Scholar] [CrossRef]
- Eagle, ‘Spiral Coil ULP’. Available online: https://github.com/plusea/EAGLE/blob/1345db3c7c3f31b4594a9f26fd8a48d5925e276a/ulp/spiral-coil.ulp (accessed on 6 September 2022).
- IPC. IPC-2221A Generic Standard on Printed Board Design. 2003. Available online: http://www-eng.lbl.gov/~shuman/NEXT/CURRENT_DESIGN/TP/MATERIALS/IPC-2221A(L).pdf (accessed on 11 September 2022).
- Cove, S.R.; Ordonez, M. Wireless-Power-Transfer Planar Spiral Winding Design Applying Track Width Ratio. IEEE Trans. Ind. Appl. 2014, 51, 2423–2433. [Google Scholar] [CrossRef]
- Rosa, E.B.; Grover, F.W. Formulas and Tables for the Calculation of Mutual and Self-Inductance; U.S. Government Printing Office: Washington, DC, USA, 1948; p. 237.
- Li, Z.; He, X.; Shu, Z. Design of coils on printed circuit board for inductive power transfer system. IET Power Electron. 2018, 11, 2515–2522. [Google Scholar] [CrossRef]
- Rose, J.; Pelts, S.; Quarry, M. A comb transducer model for guided wave NDE. Ultrasonics 1998, 36, 163–169. [Google Scholar] [CrossRef]
- Krautkrämer, J.; Krautkrämer, H. Ultrasonic Testing of Materials; Springer Science & Business Media: Berlin, Germany, 1990. [Google Scholar]
- Kubrusly, A.C.; Freitas, M.A.; von der Weid, J.P.; Dixon, S. Interaction of SH guided waves with wall thinning. NDT E Int. 2018, 101, 94–103. [Google Scholar] [CrossRef]
- Petcher, P.A.; Dixon, S. Mode mixing in shear horizontal ultrasonic guided waves. Nondestruct. Test. Eval. 2016, 32, 113–132. [Google Scholar] [CrossRef]
- Eurocode Applied. Table of material properties for structural steel S235, S275, S355, S420. Available online: https://eurocodeapplied.com/design/en1993/steel-design-properties (accessed on 18 April 2021).
- Leckey, C.A.; Wheeler, K.R.; Hafiychuk, V.N.; Hafiychuk, H.; Timuçin, D.A. Simulation of guided-wave ultrasound propagation in composite laminates: Benchmark comparisons of numerical codes and experiment. Ultrasonics 2017, 84, 187–200. [Google Scholar] [CrossRef] [PubMed]


| Parameter | Value | Parameter | Value |
|---|---|---|---|
| 116 mm | 0.25 mm | ||
| 36 mm | 0.5 mm | ||
| 10 mm | 1600 V | ||
| 0.25 mm | 50 Ω | ||
| 0.25 mm | 205 kHz | ||
| 2 oz/ft2 | Steel |
Disclaimer/Publisher’s Note: The statements, opinions and data contained in all publications are solely those of the individual author(s) and contributor(s) and not of MDPI and/or the editor(s). MDPI and/or the editor(s) disclaim responsibility for any injury to people or property resulting from any ideas, methods, instructions or products referred to in the content. |
© 2023 by the authors. Licensee MDPI, Basel, Switzerland. This article is an open access article distributed under the terms and conditions of the Creative Commons Attribution (CC BY) license (https://creativecommons.org/licenses/by/4.0/).
Share and Cite
McMillan, R.; Hampson, R.; Tabatabaeipour, M.; Jackson, W.; Zhang, D.; Tzaferis, K.; Dobie, G. Design and Manufacture of an Optimised Side-Shifted PPM EMAT Array for Use in Mobile Robotic Localisation. Sensors 2023, 23, 2012. https://doi.org/10.3390/s23042012
McMillan R, Hampson R, Tabatabaeipour M, Jackson W, Zhang D, Tzaferis K, Dobie G. Design and Manufacture of an Optimised Side-Shifted PPM EMAT Array for Use in Mobile Robotic Localisation. Sensors. 2023; 23(4):2012. https://doi.org/10.3390/s23042012
Chicago/Turabian StyleMcMillan, Ross, Rory Hampson, Morteza Tabatabaeipour, William Jackson, Dayi Zhang, Konstantinos Tzaferis, and Gordon Dobie. 2023. "Design and Manufacture of an Optimised Side-Shifted PPM EMAT Array for Use in Mobile Robotic Localisation" Sensors 23, no. 4: 2012. https://doi.org/10.3390/s23042012