
Multi-Parameter Optical Monitoring Solution Applied to Underground Medium-Voltage Electric Power Distribution Networks

 ,
,  ,
,  ,
,  , ,
, ,
Abstract
:1. Introduction
2. Materials and Methods
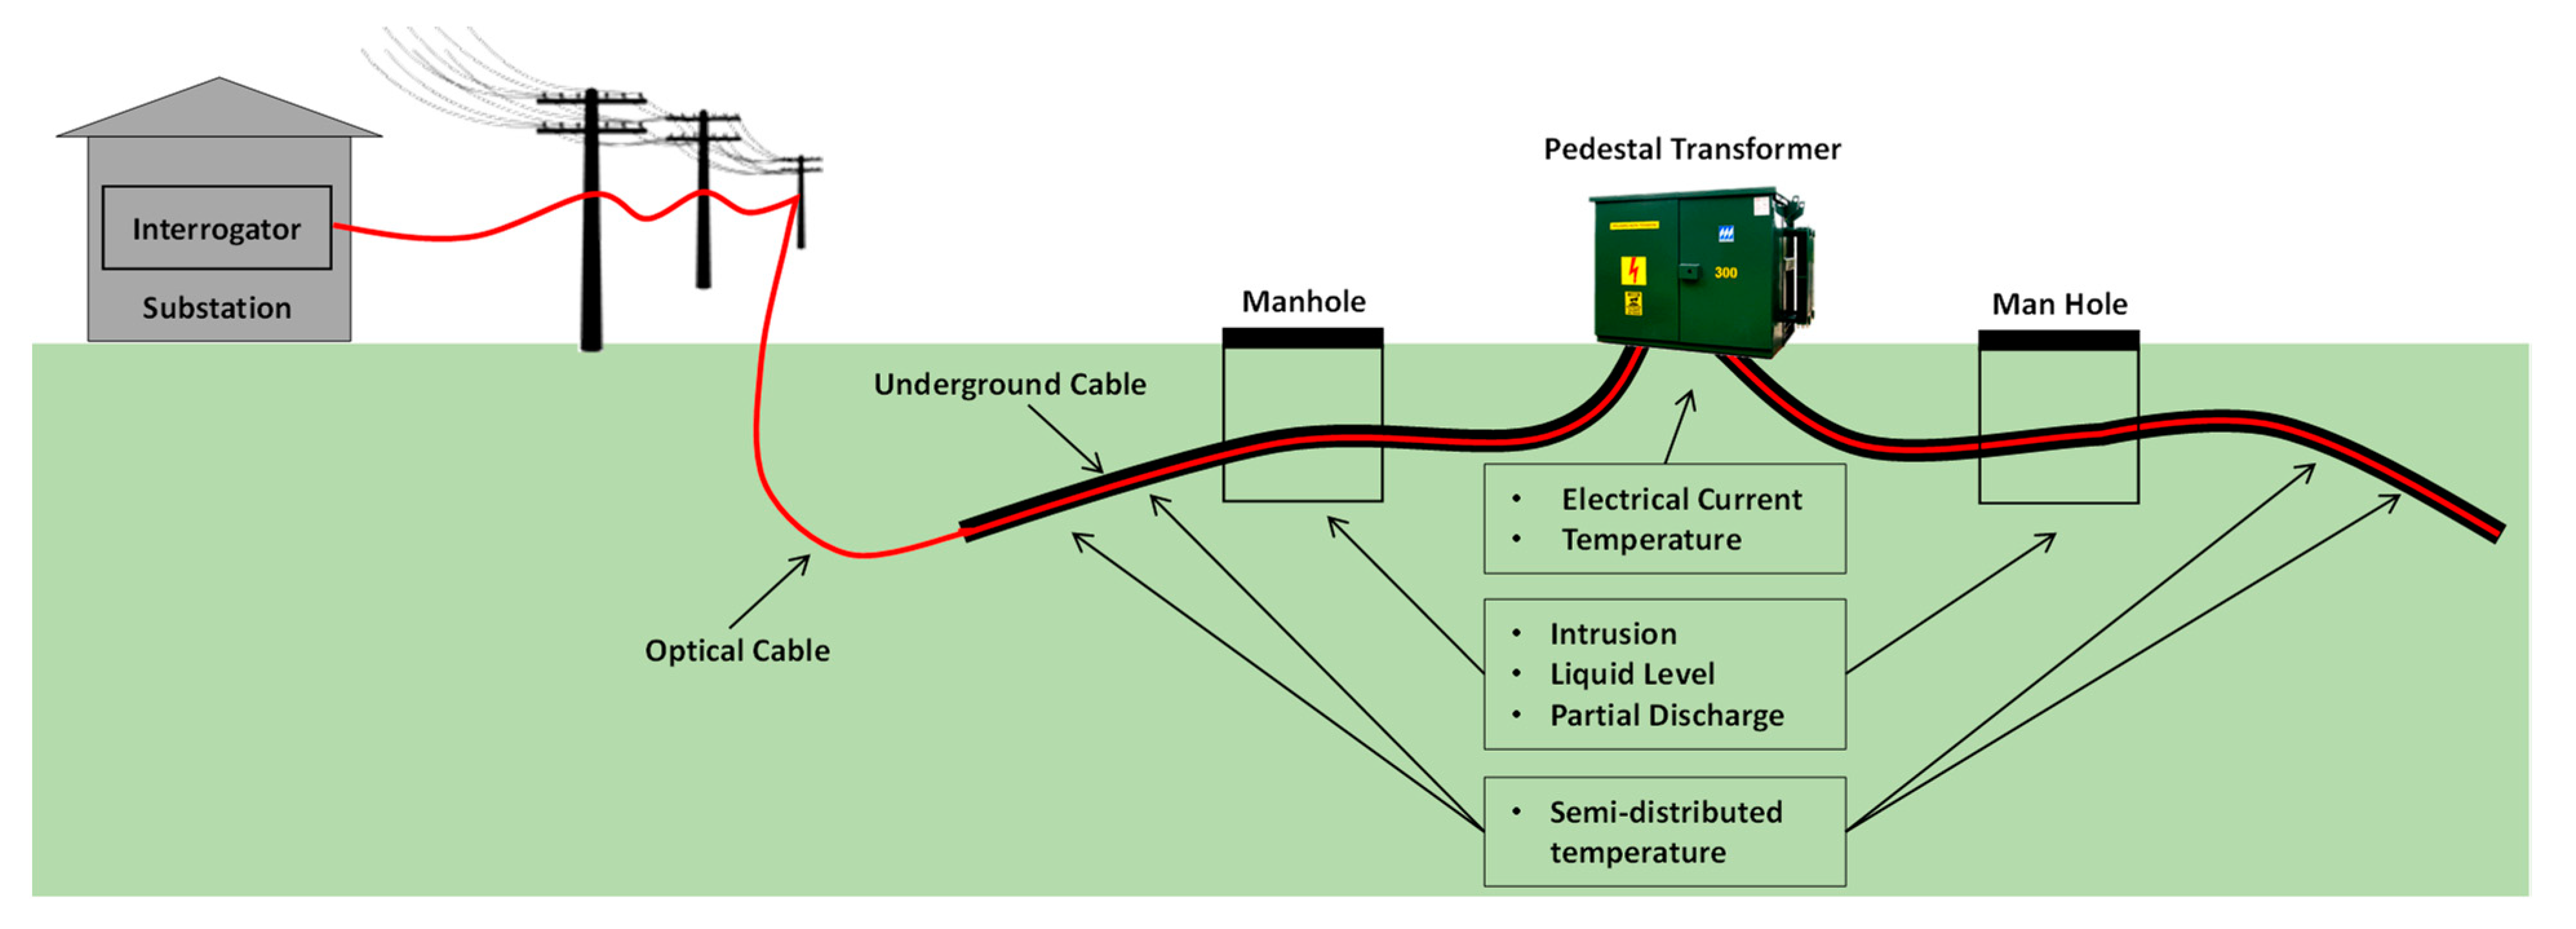
2.1. The Proposed Monitoring System
2.2. The Interrogator
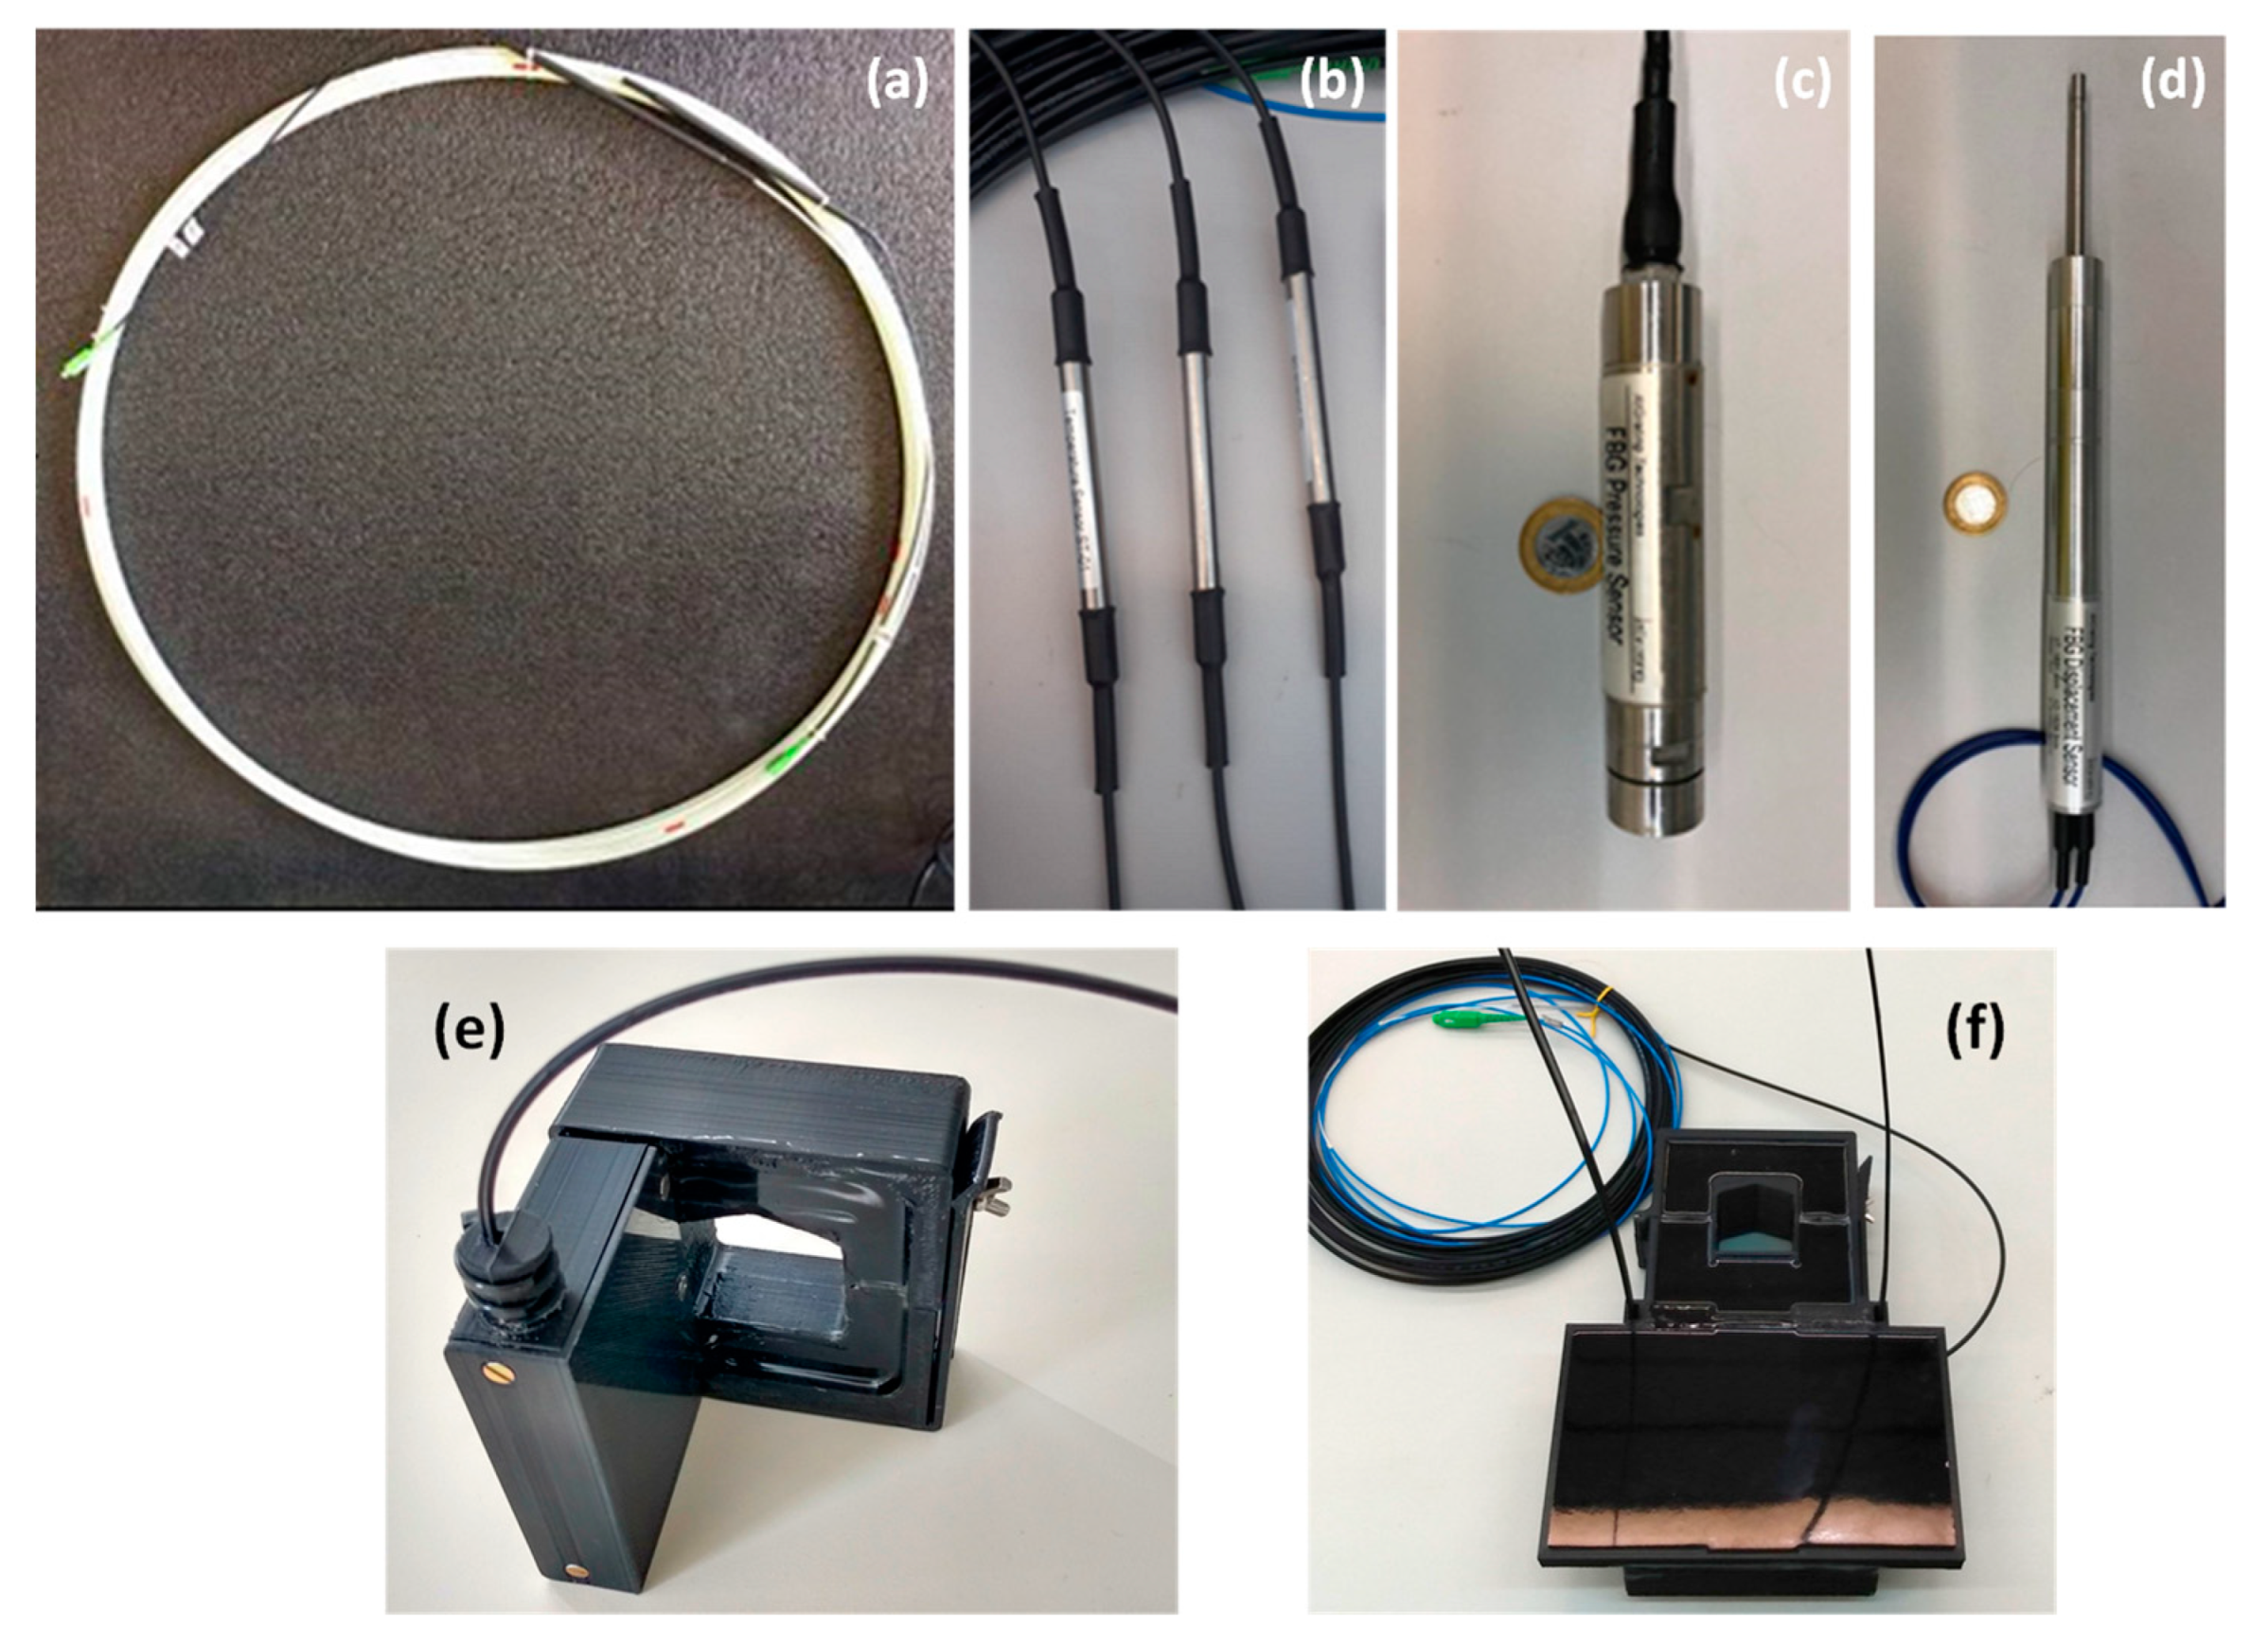
2.3. The Sensors
2.4. The Monitored Underground Distribution Network
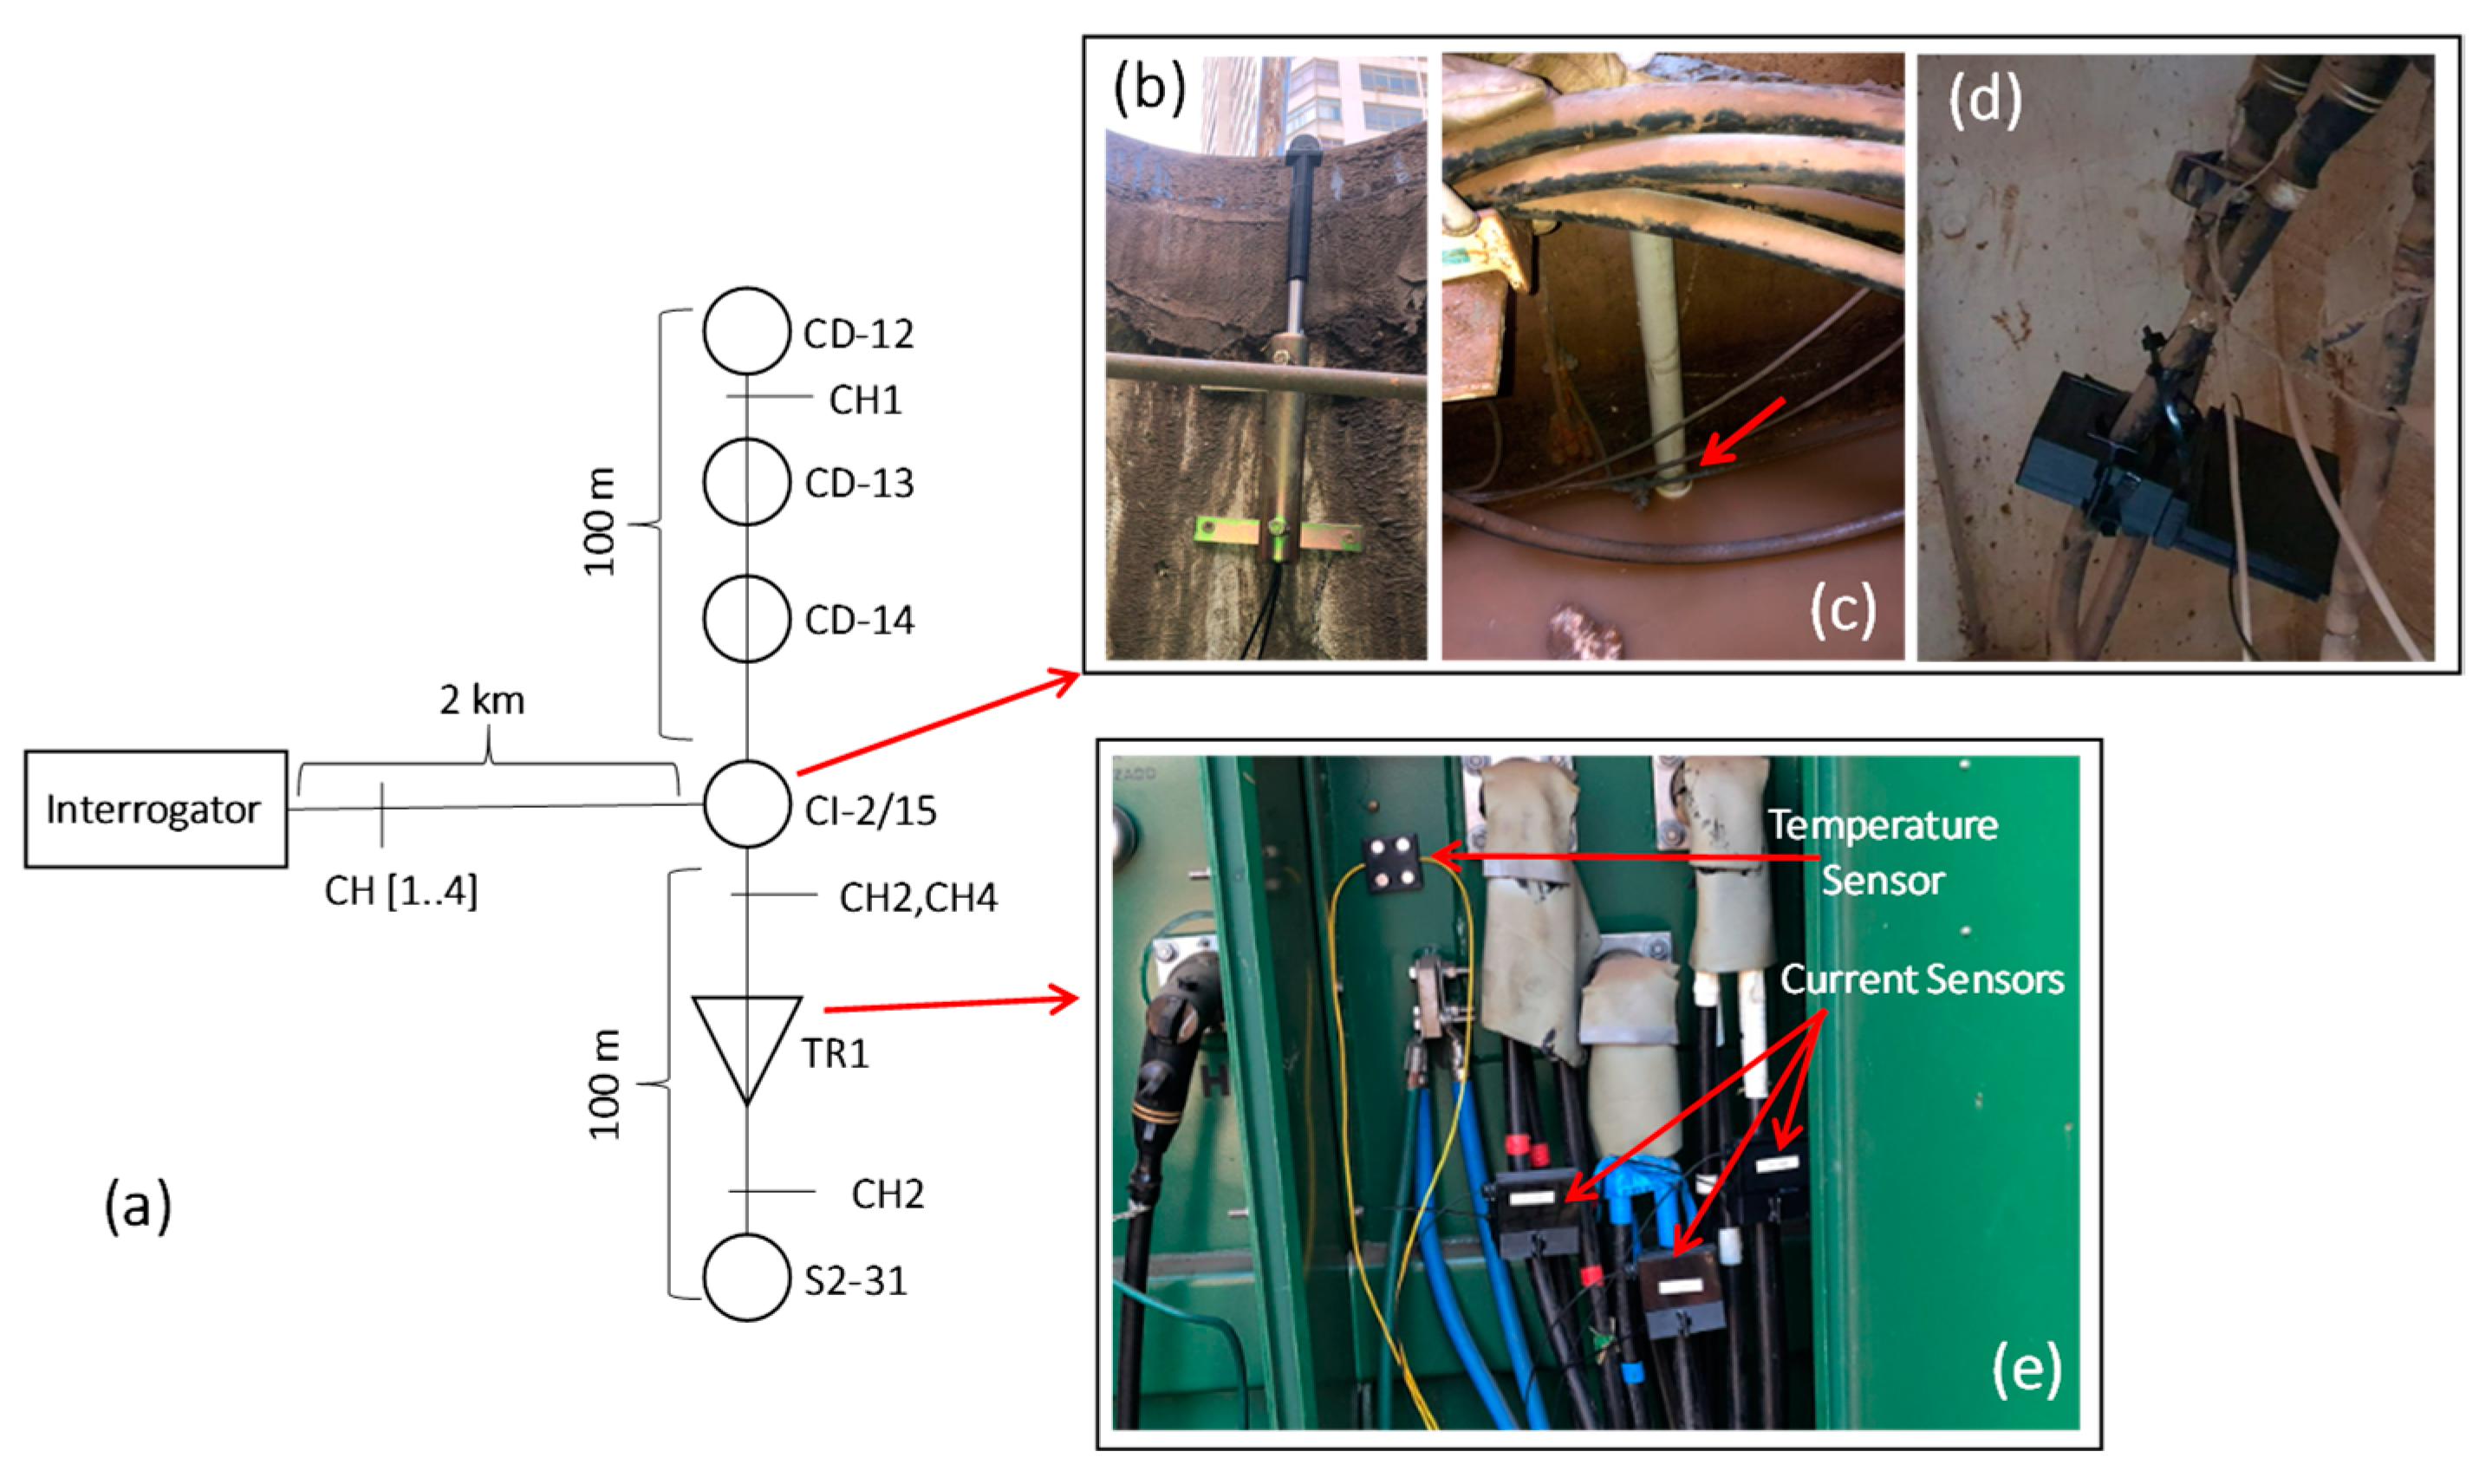
2.4.1. Downtown Underground Distribution Network Monitoring
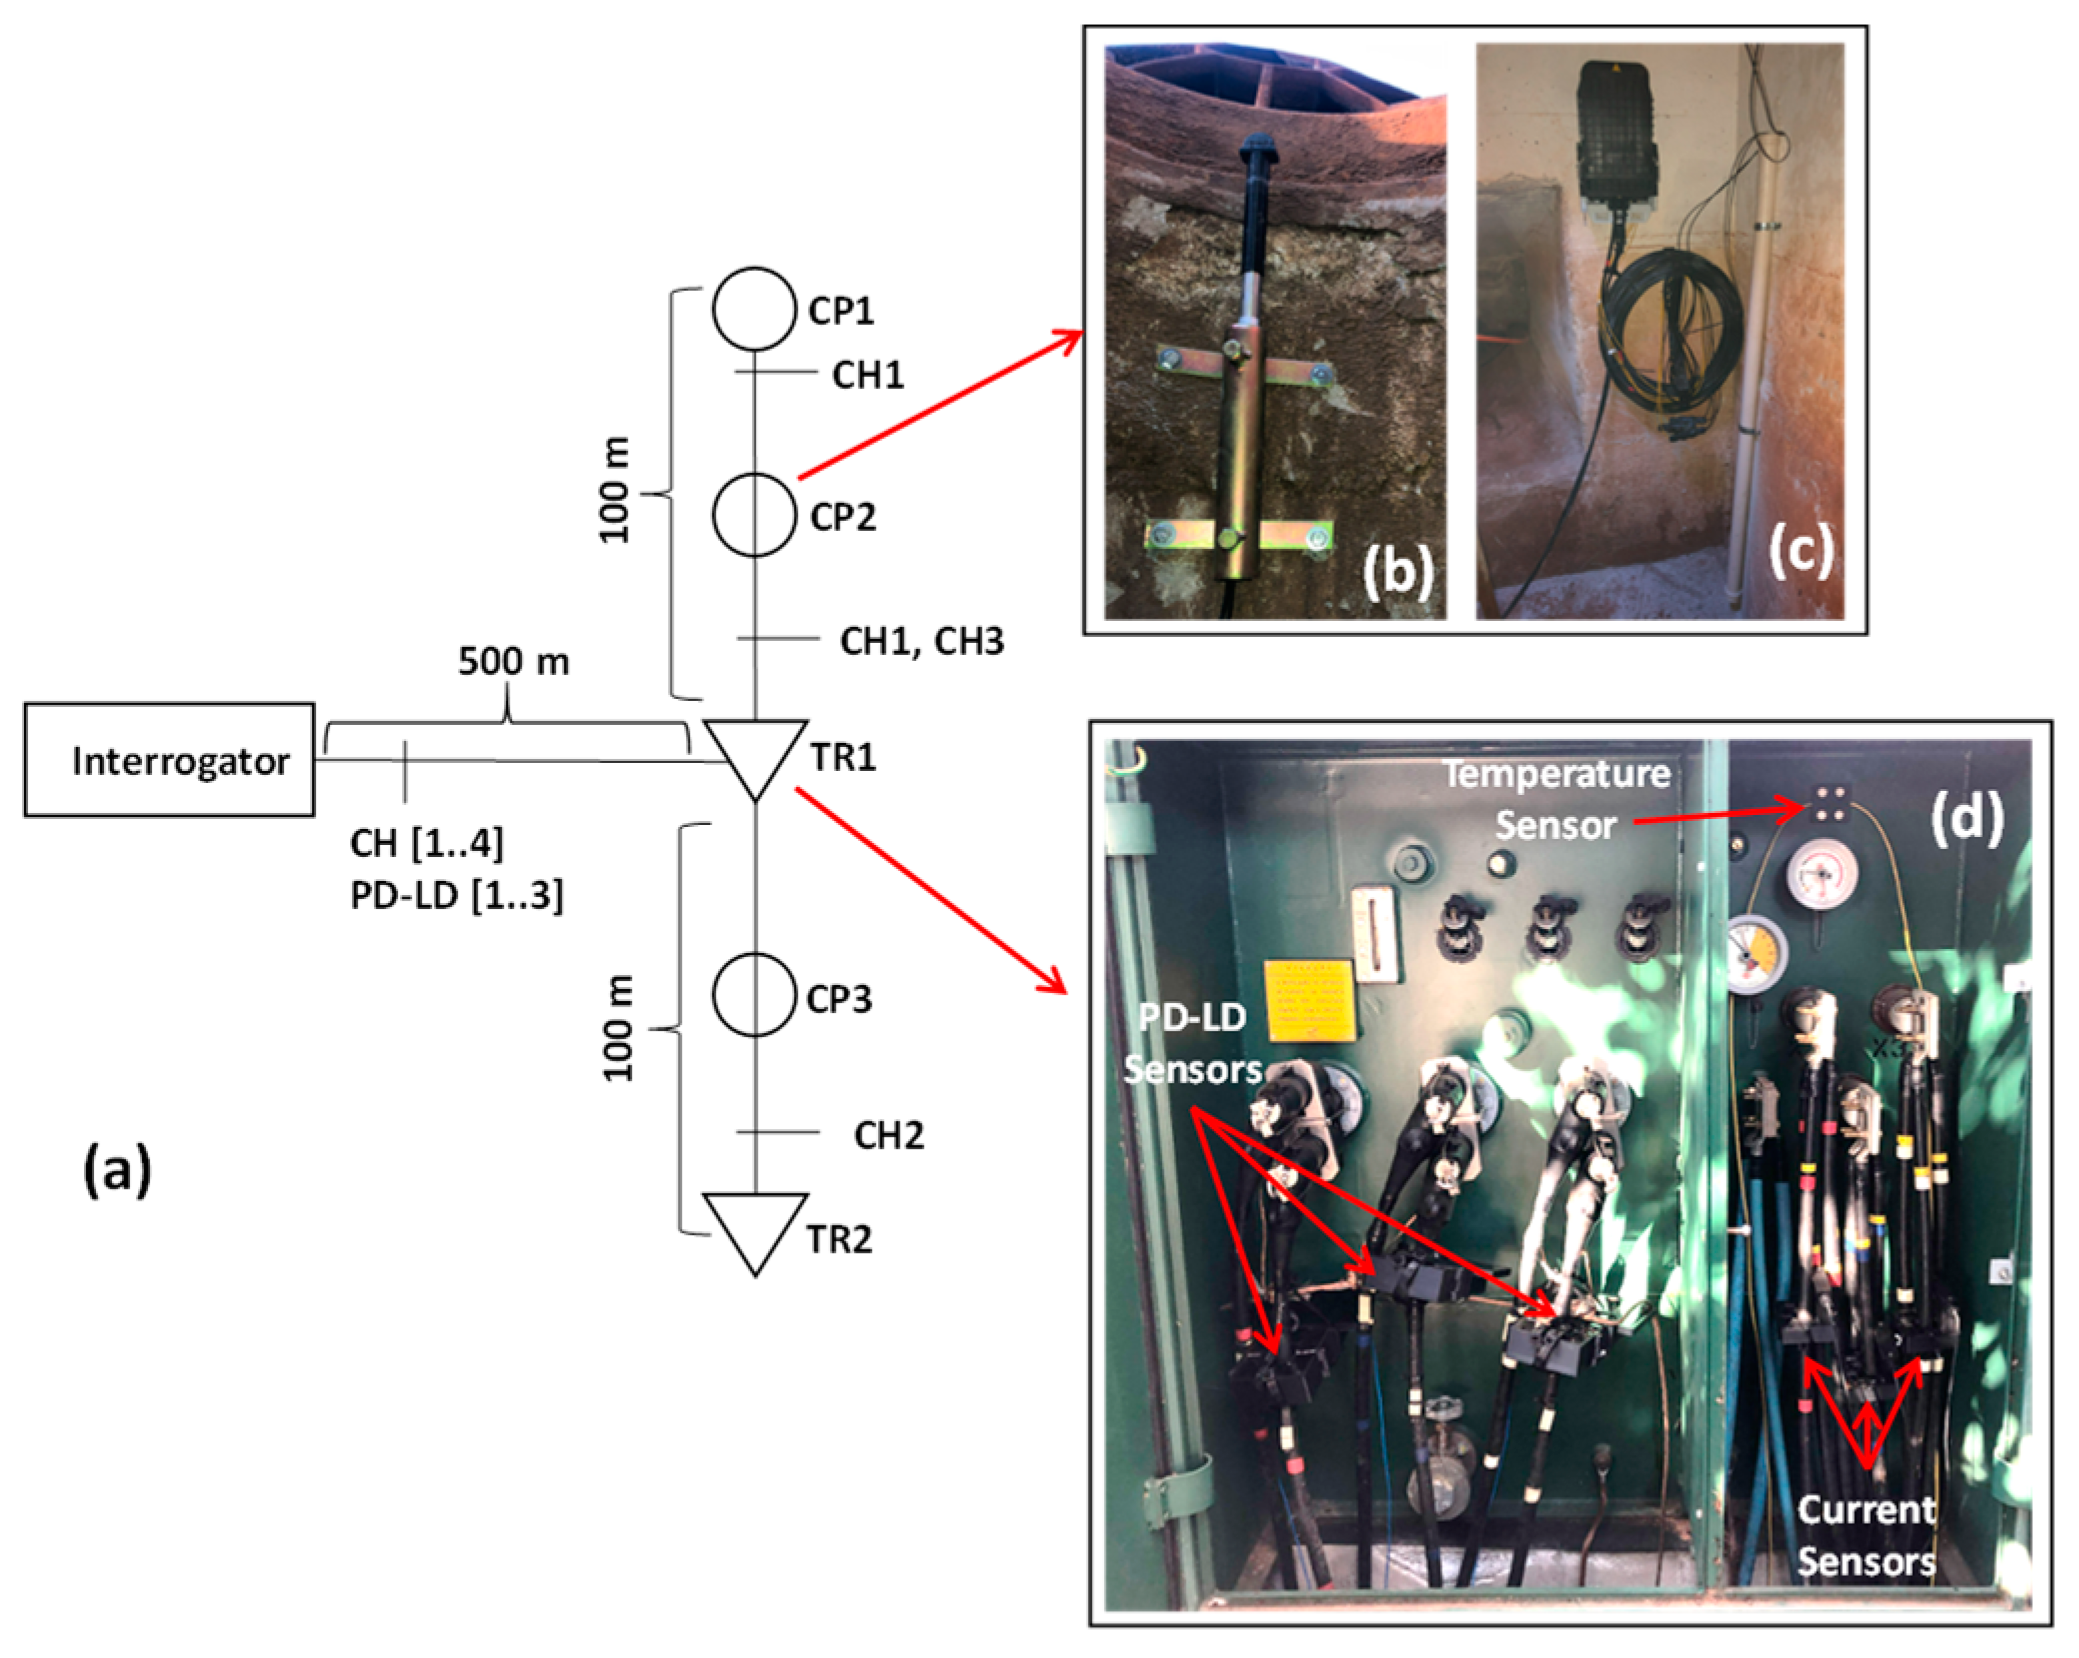
2.4.2. Condominium Underground Distribution Network Monitoring
3. Results
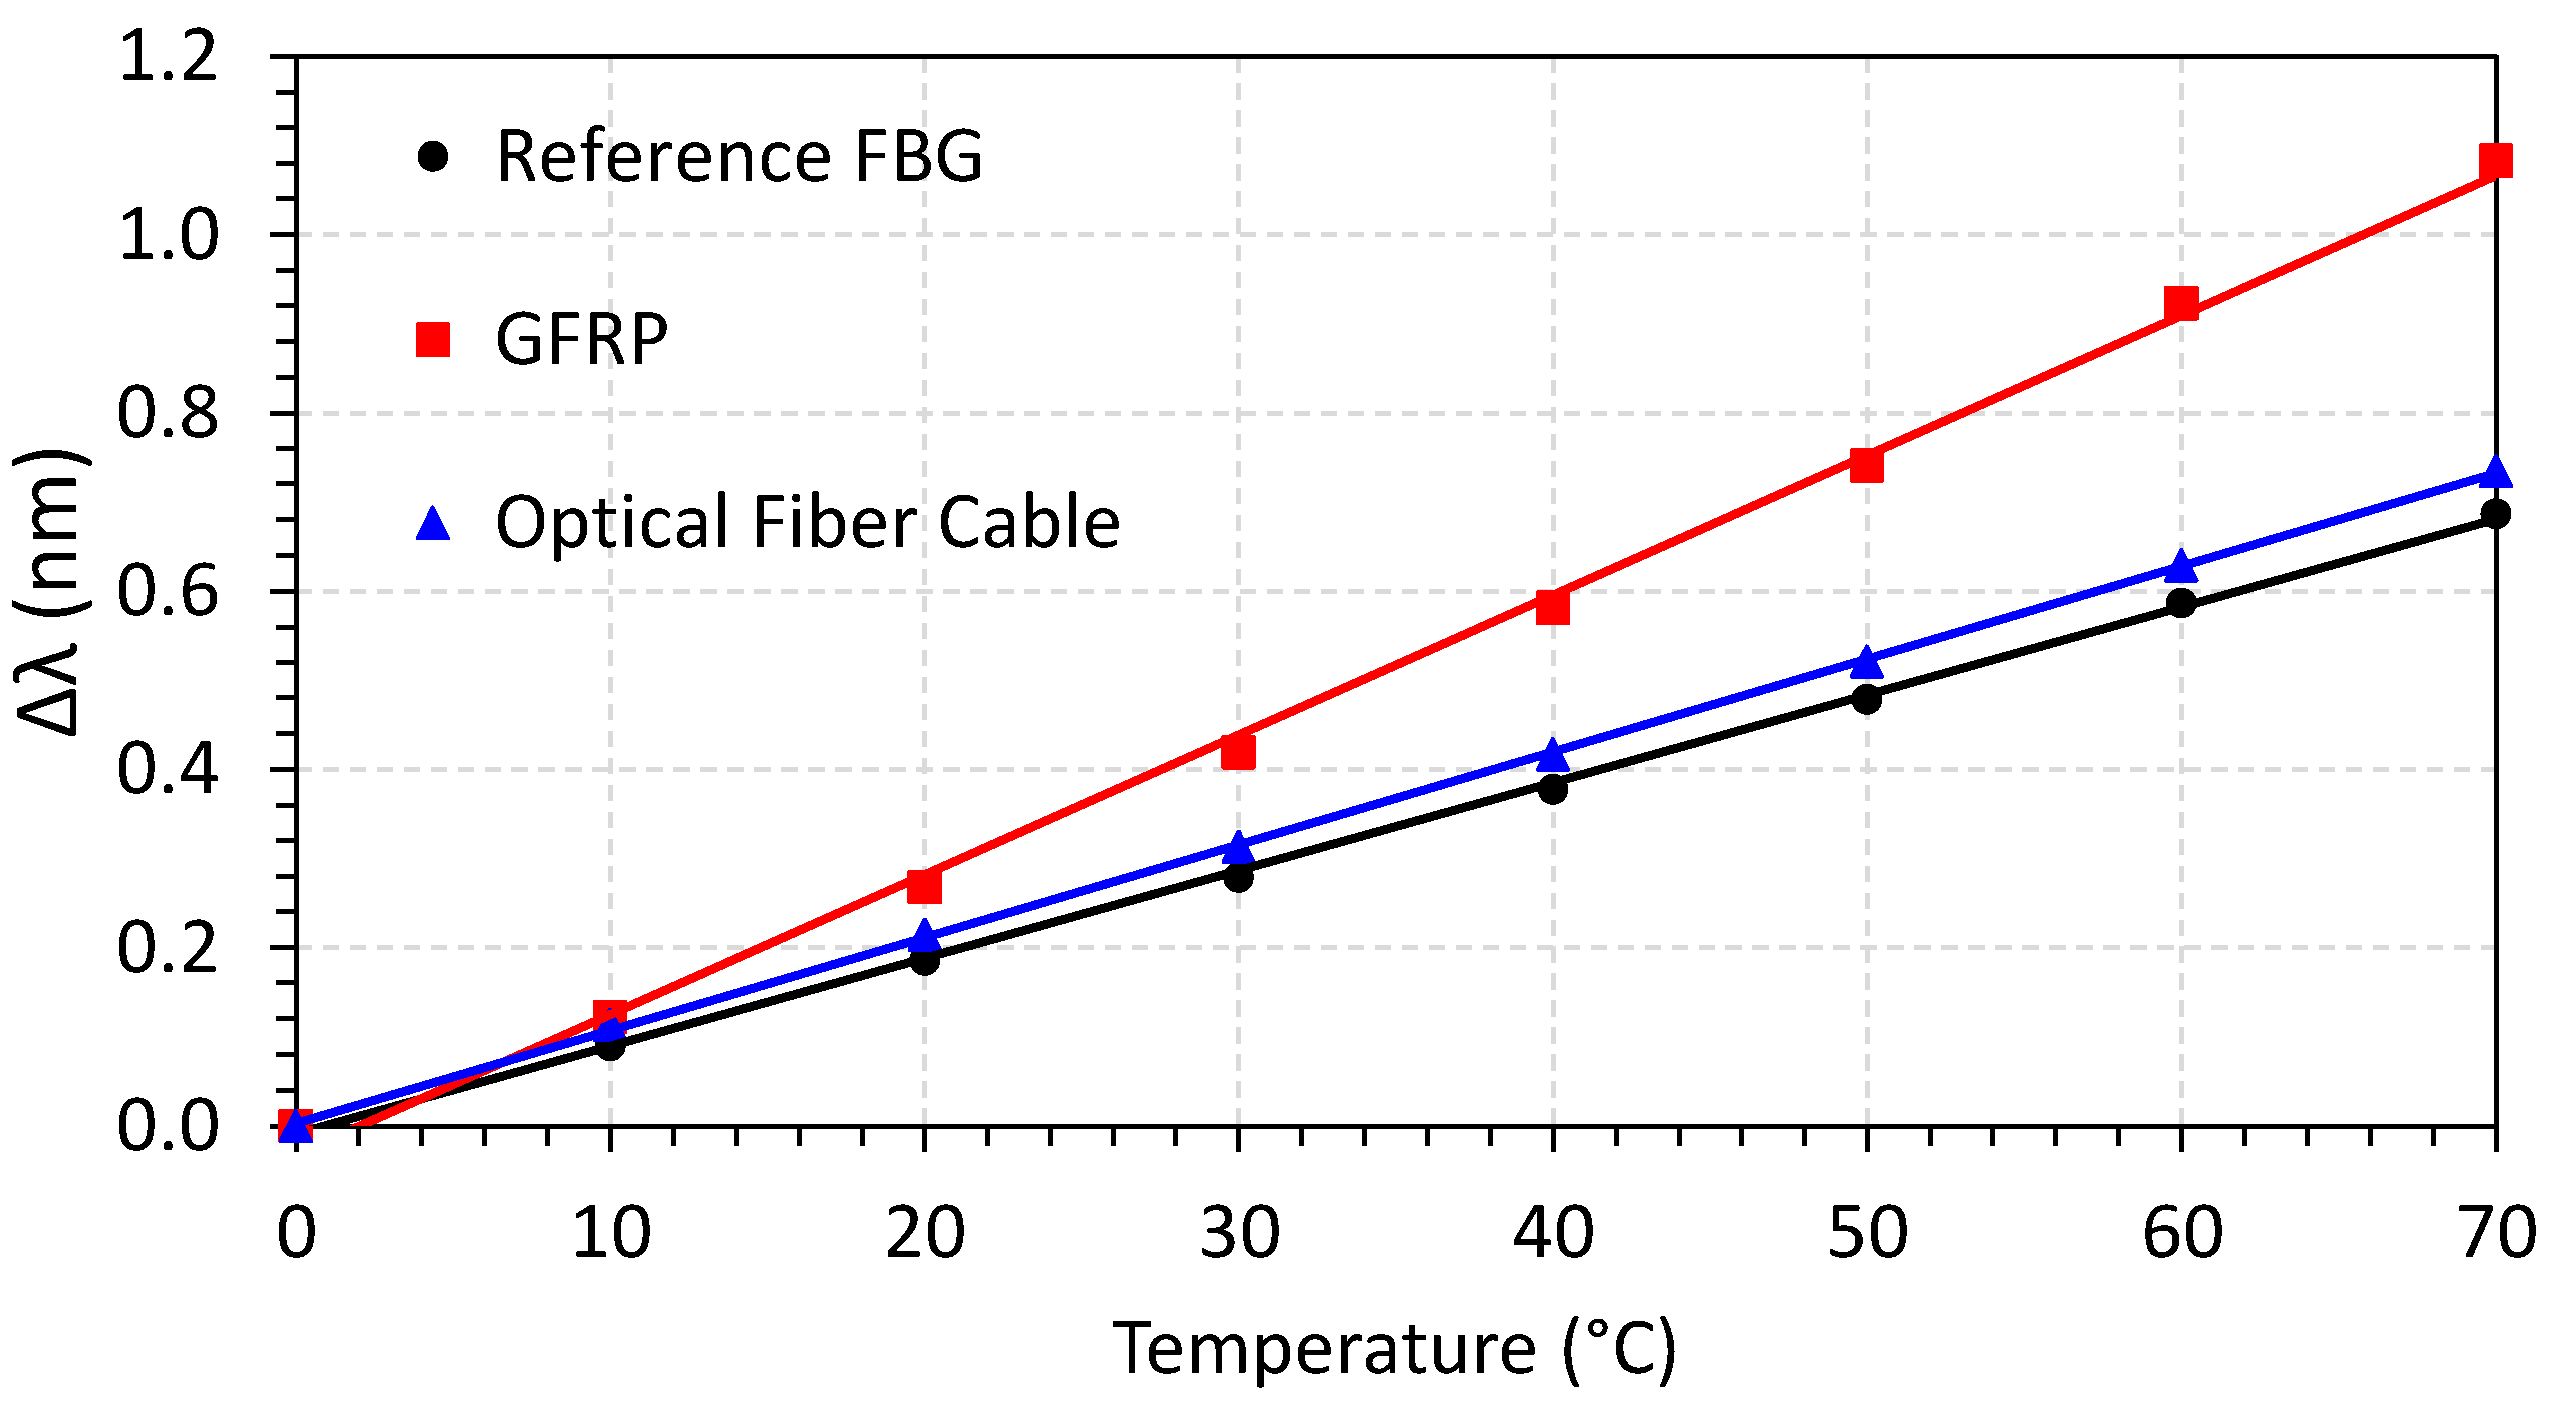
3.1. Sensors’ Characterization in Laboratory
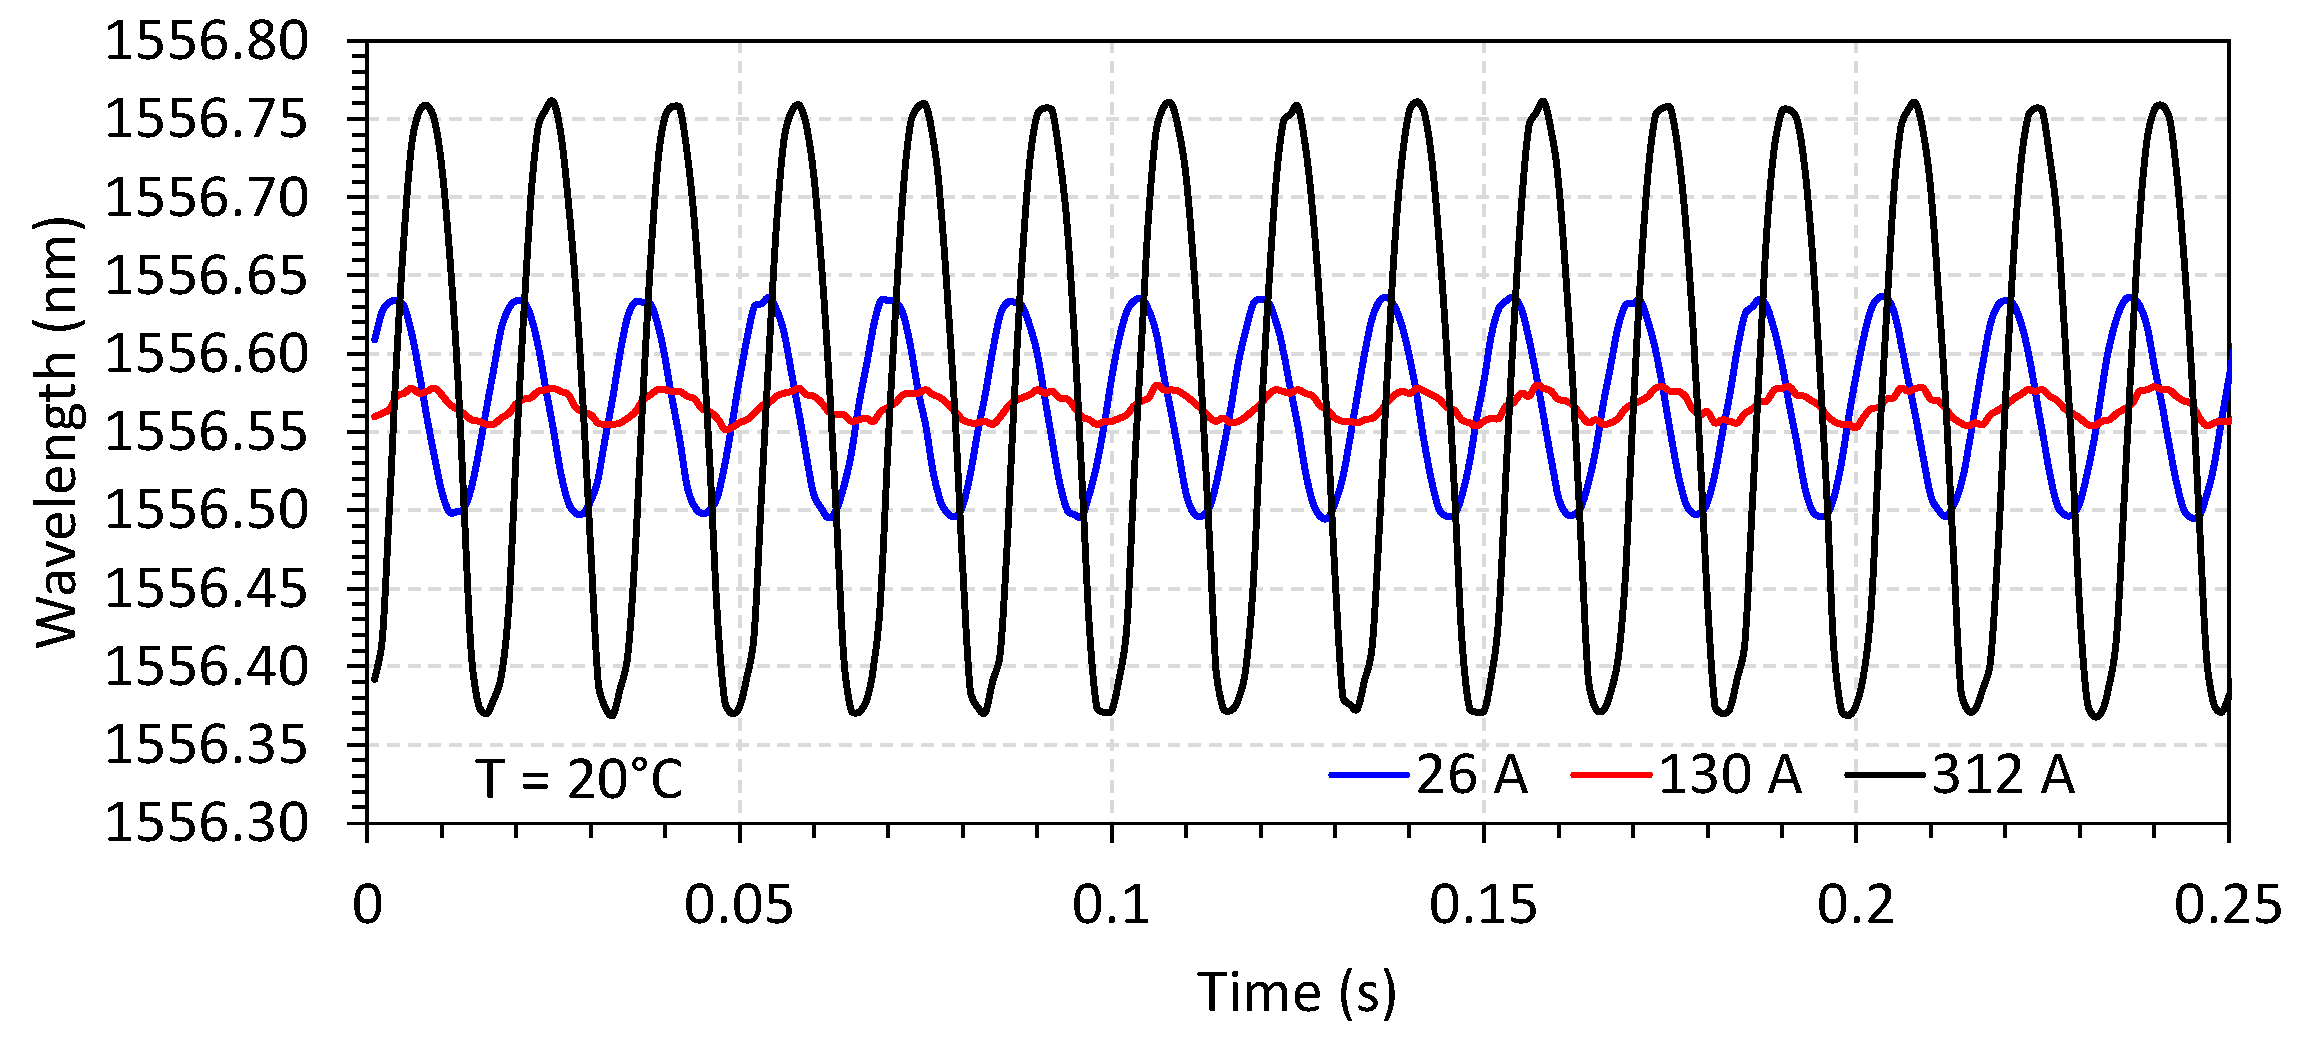
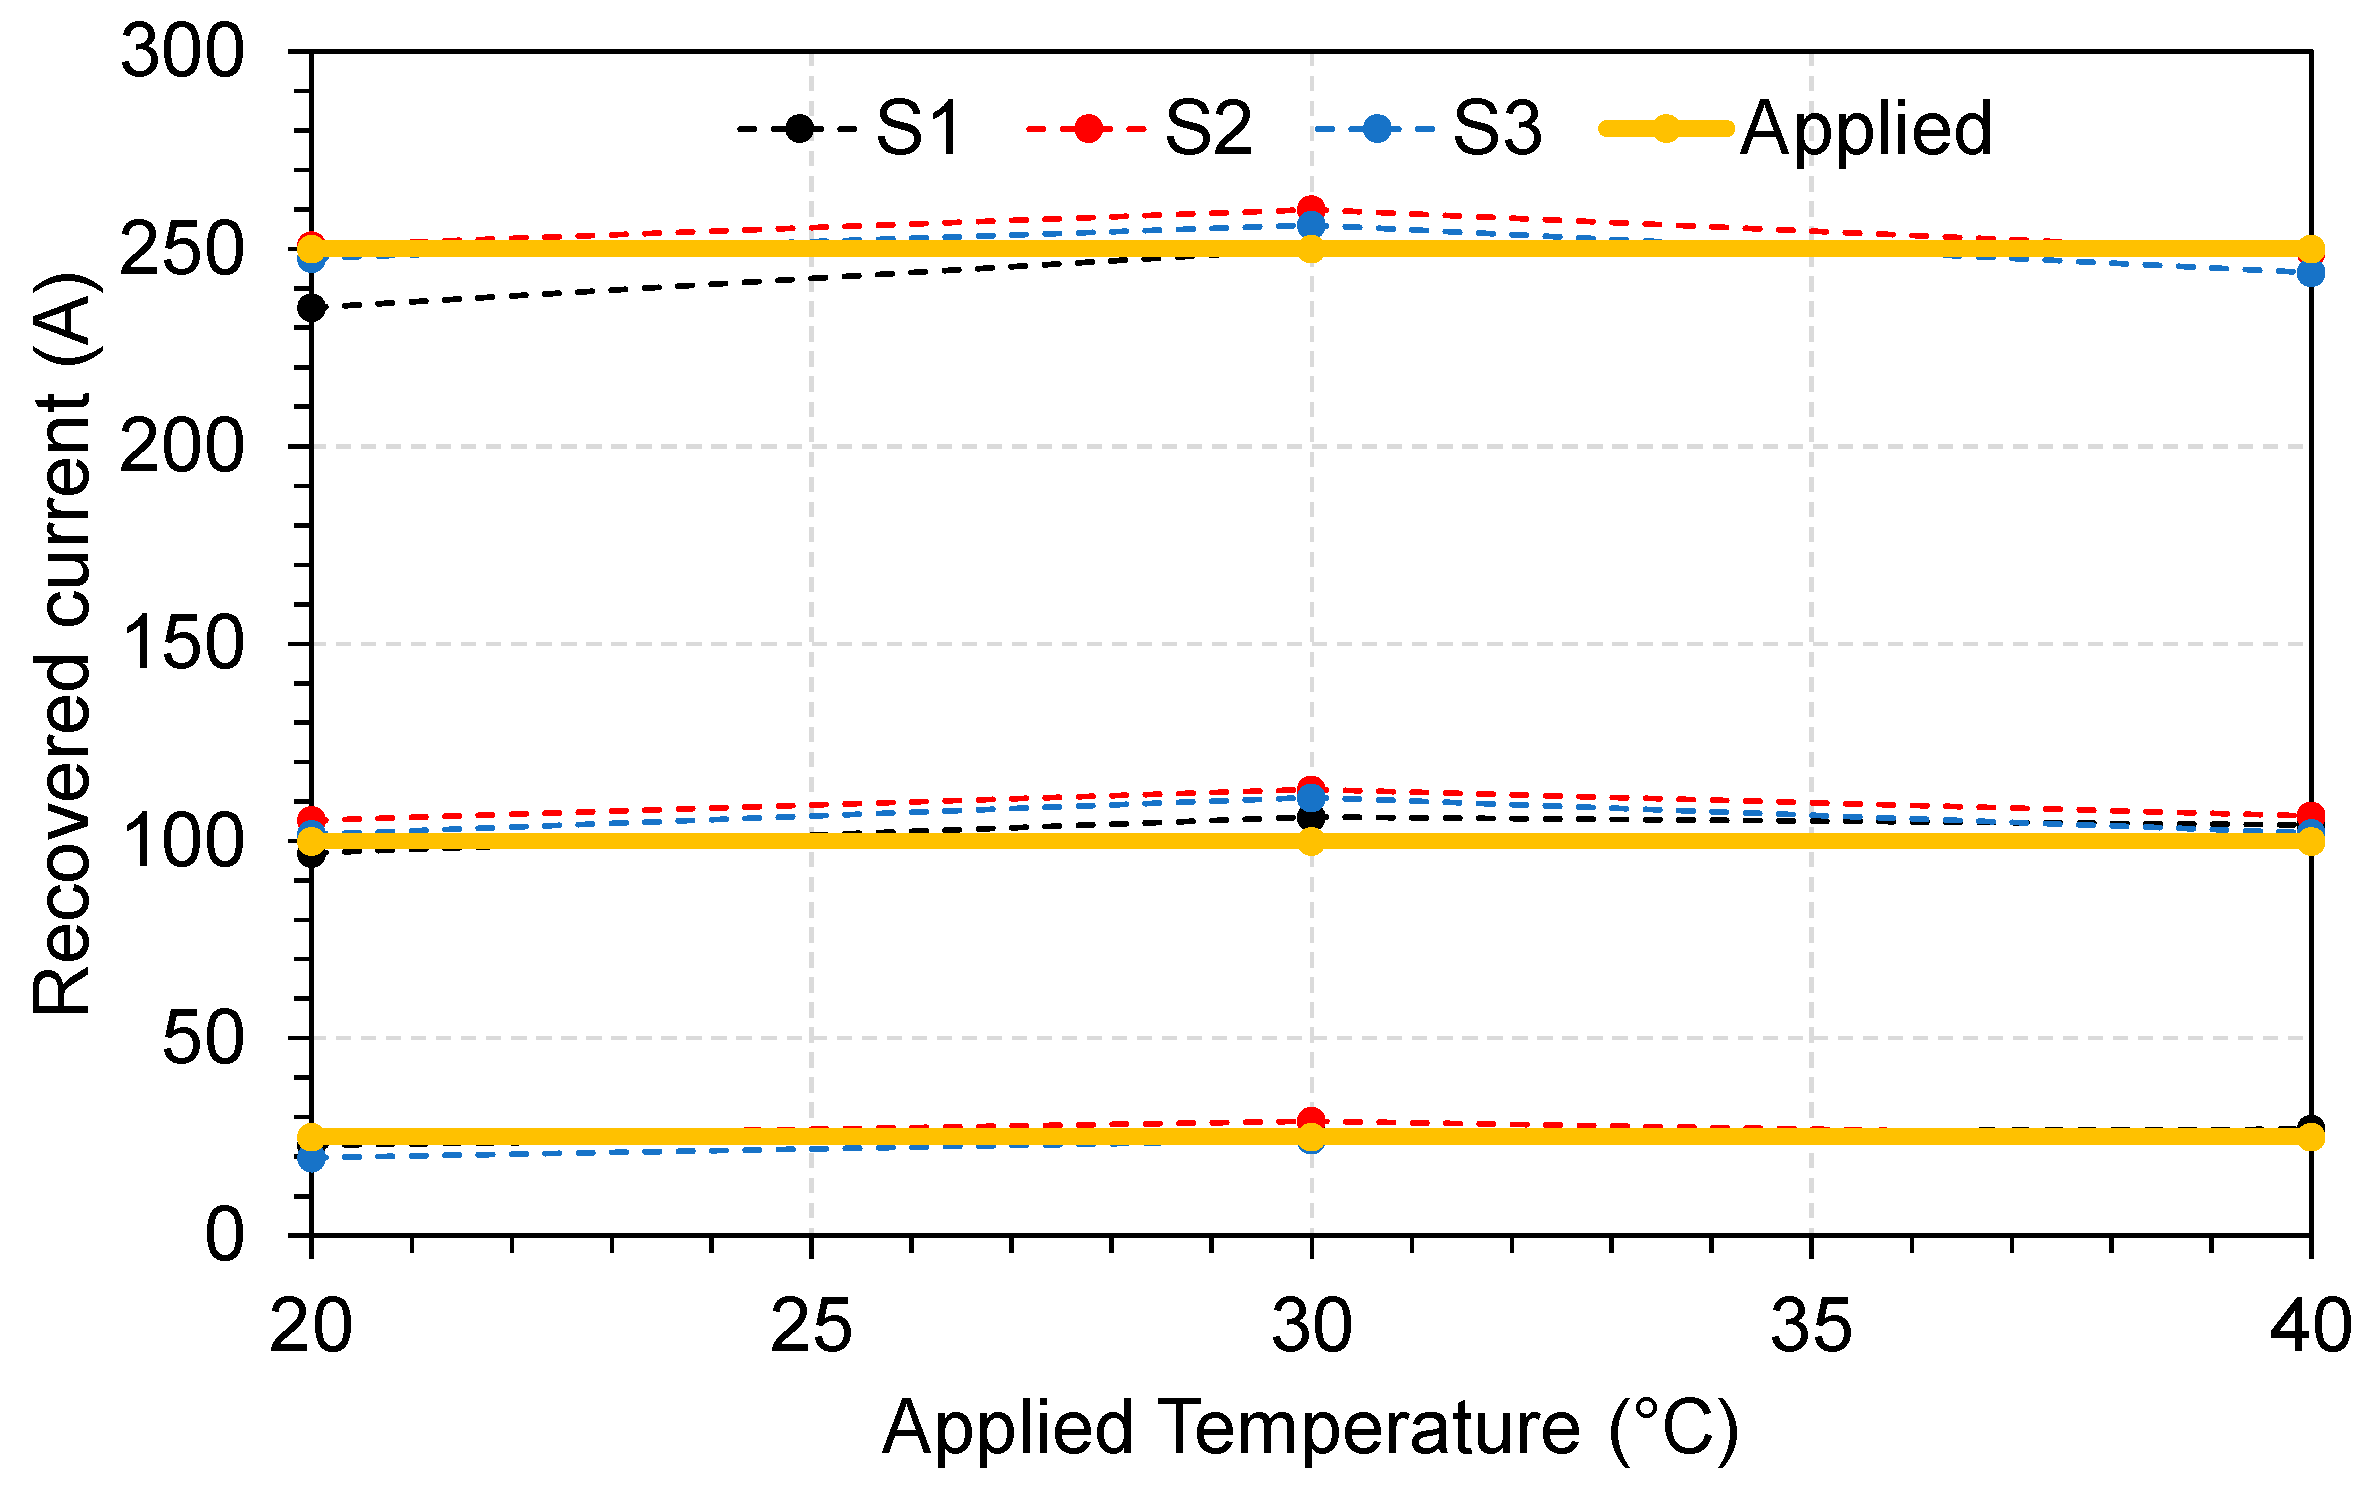
3.1.1. Homemade FBG Current Sensor
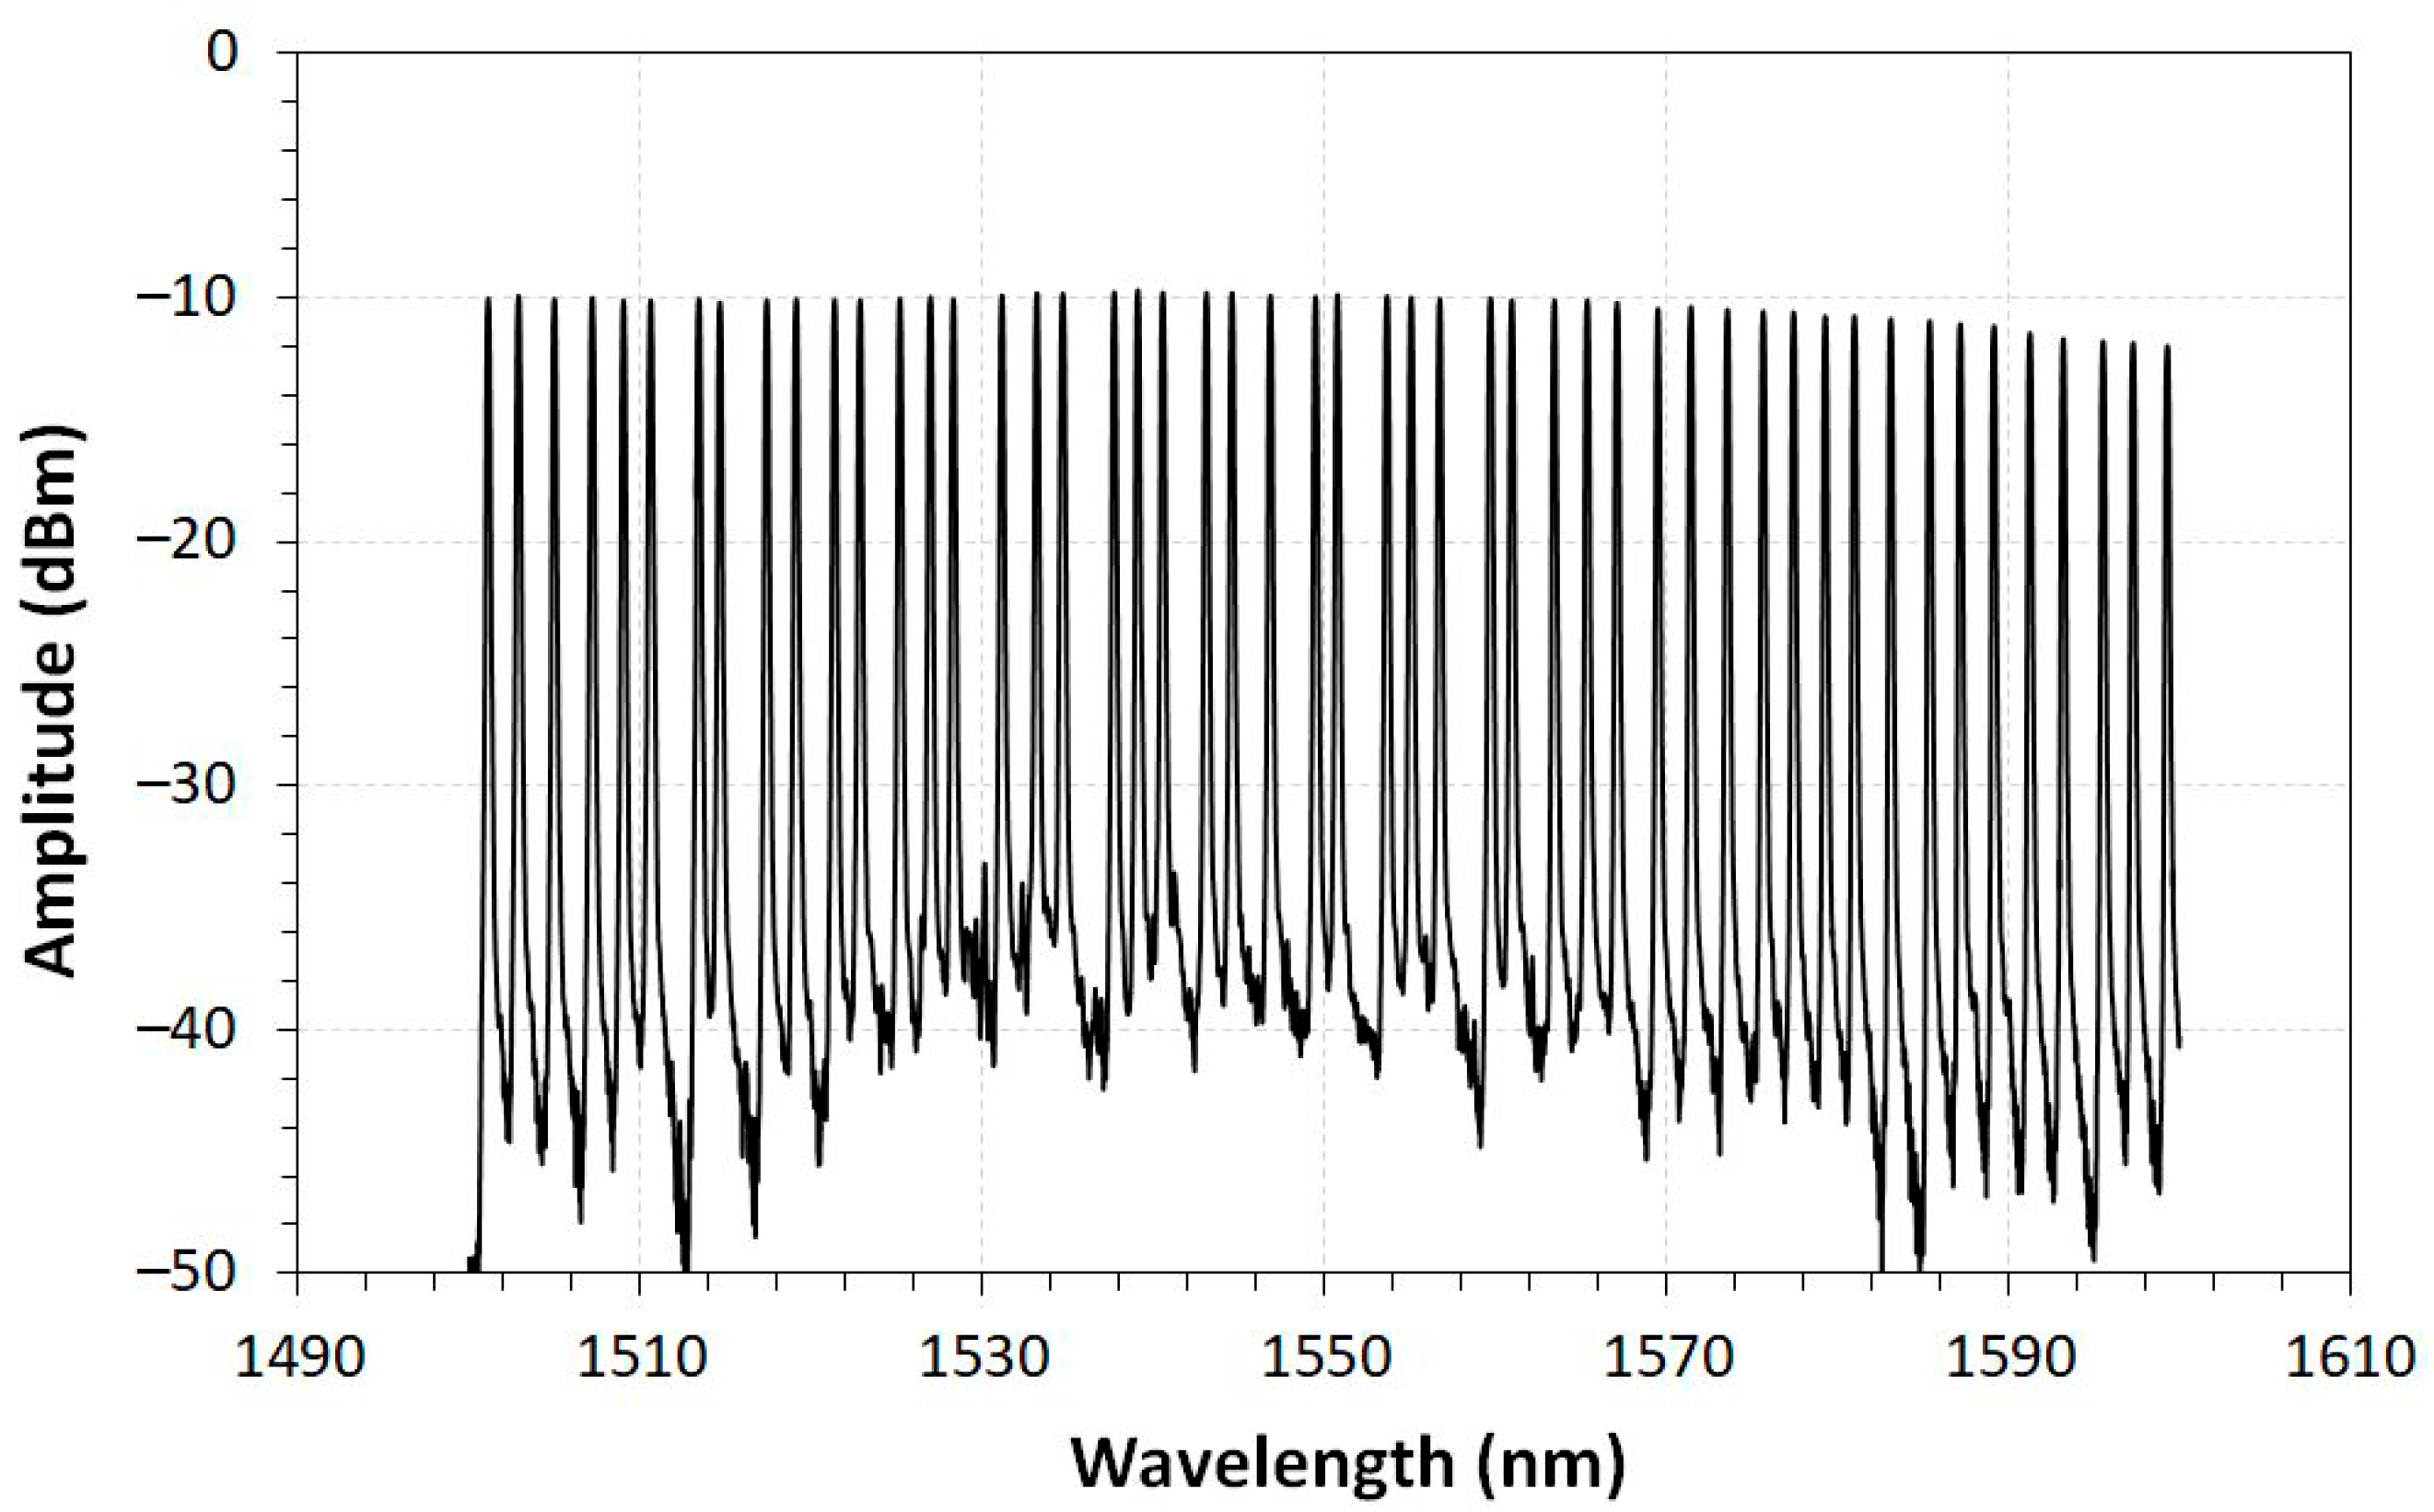
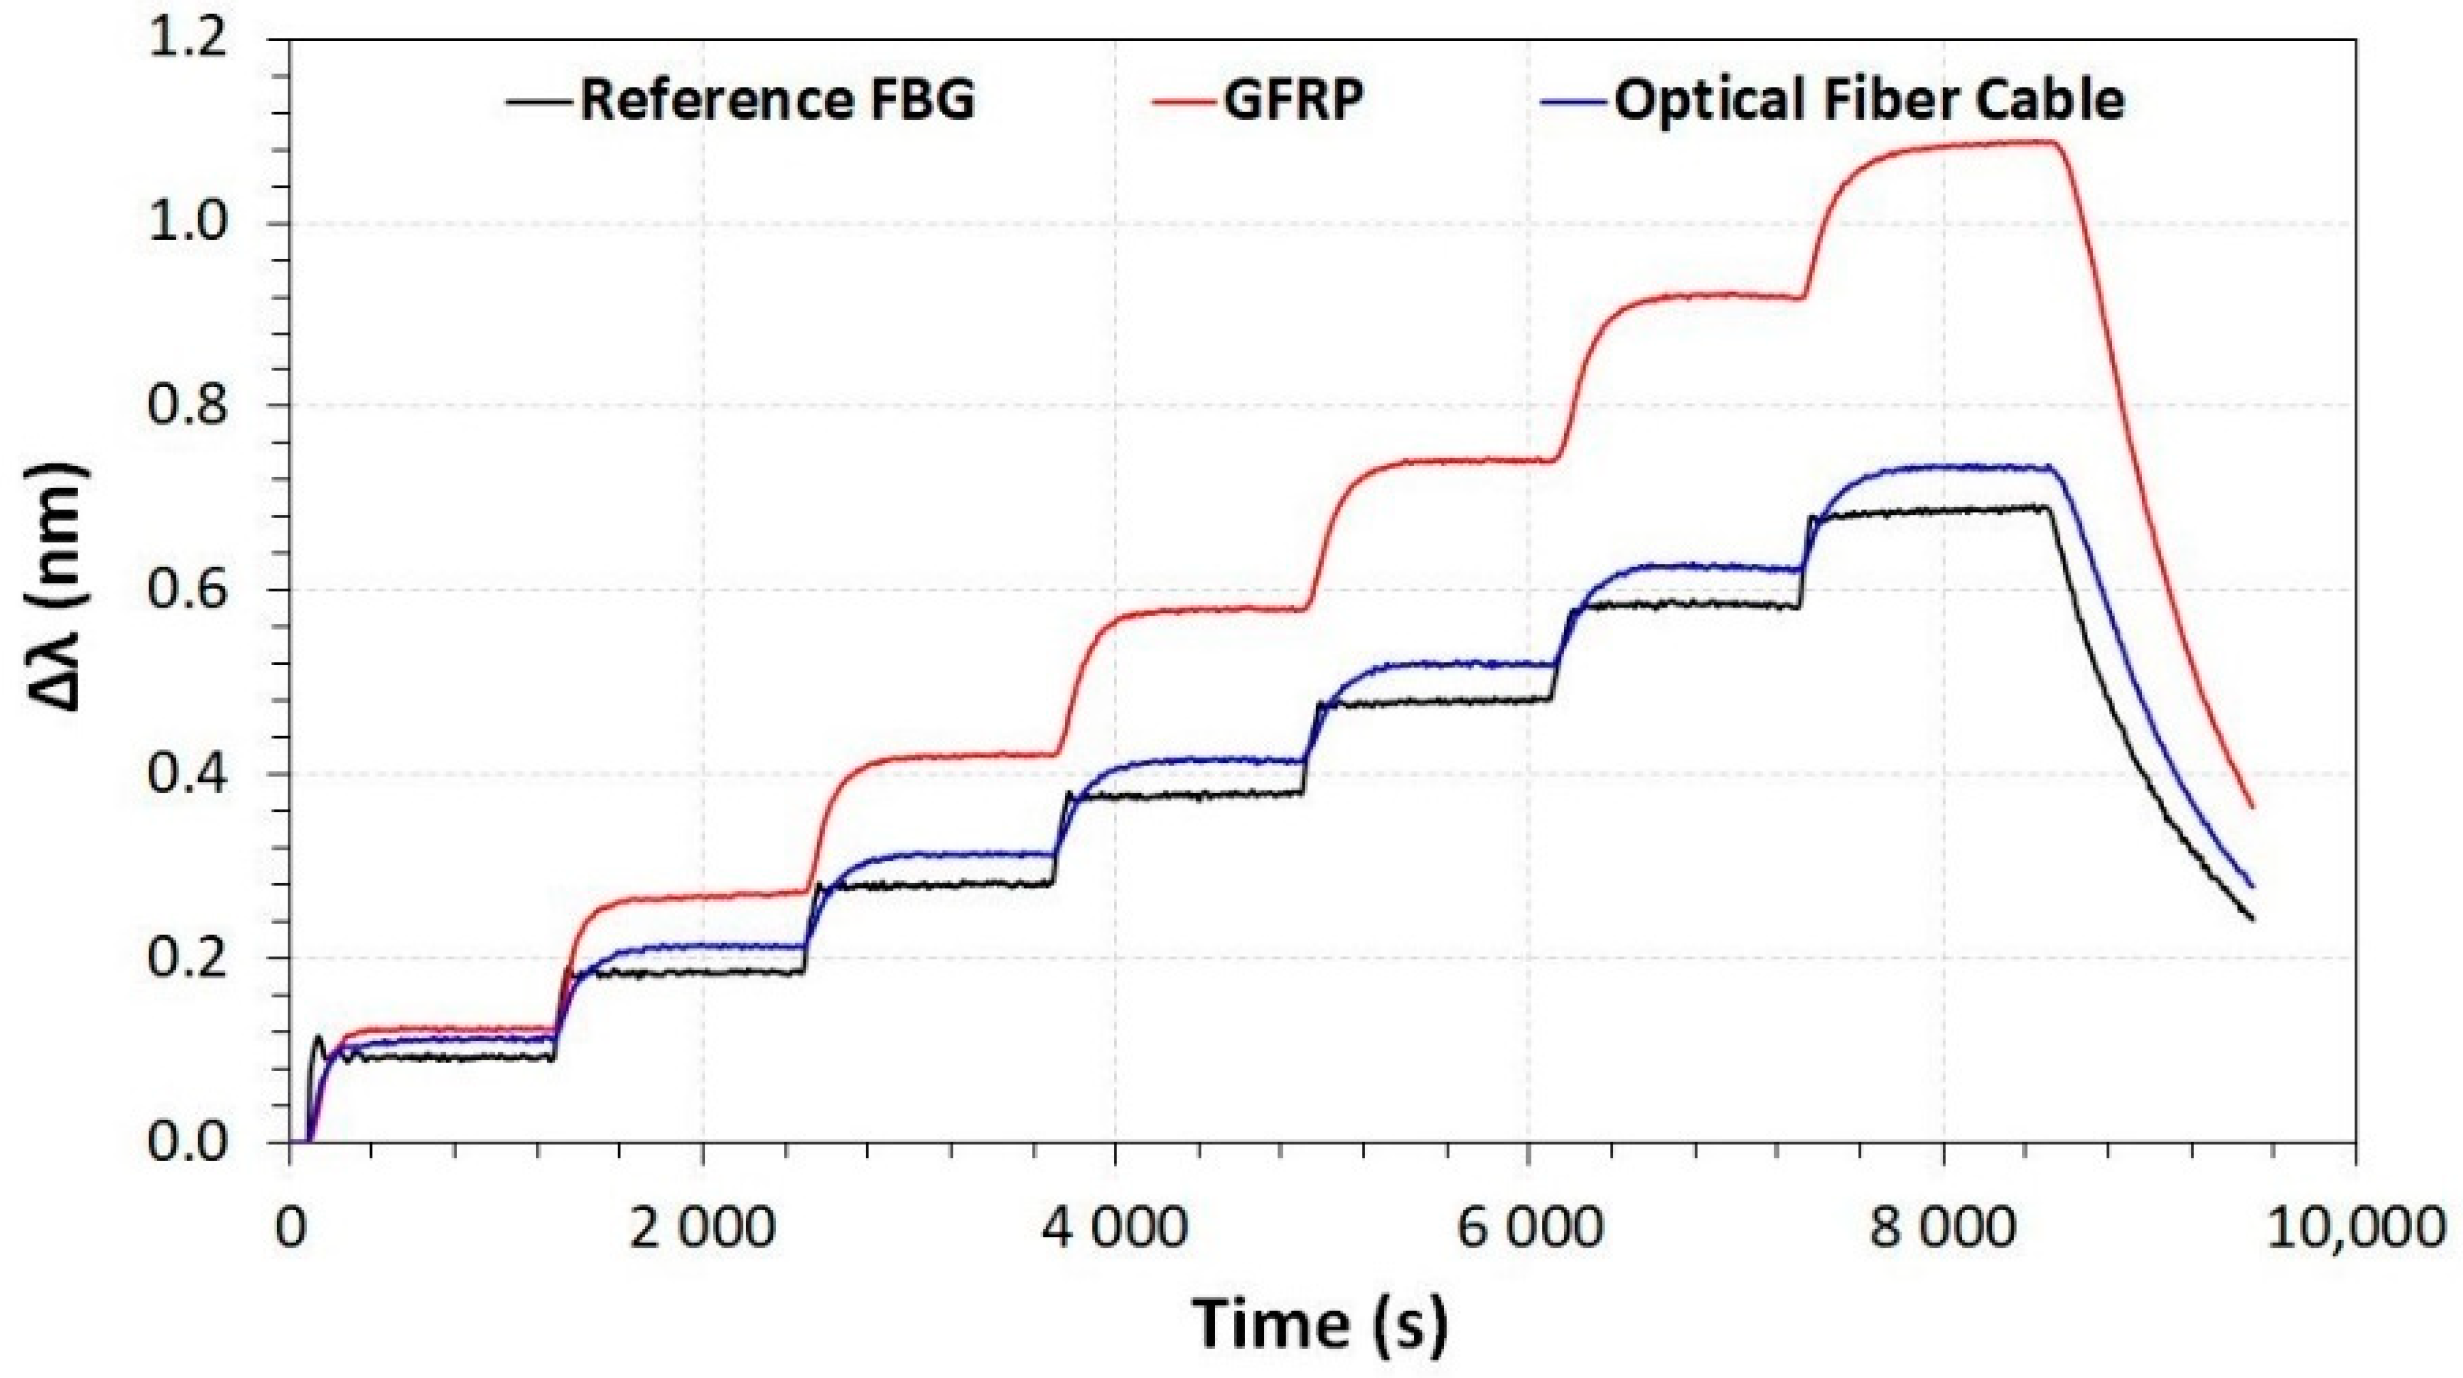
3.1.2. Commercial FBG Array, Temperature, Liquid Level, and Intrusion Sensors
3.1.3. Homemade PD-LD Sensor
3.2. Field Evaluation
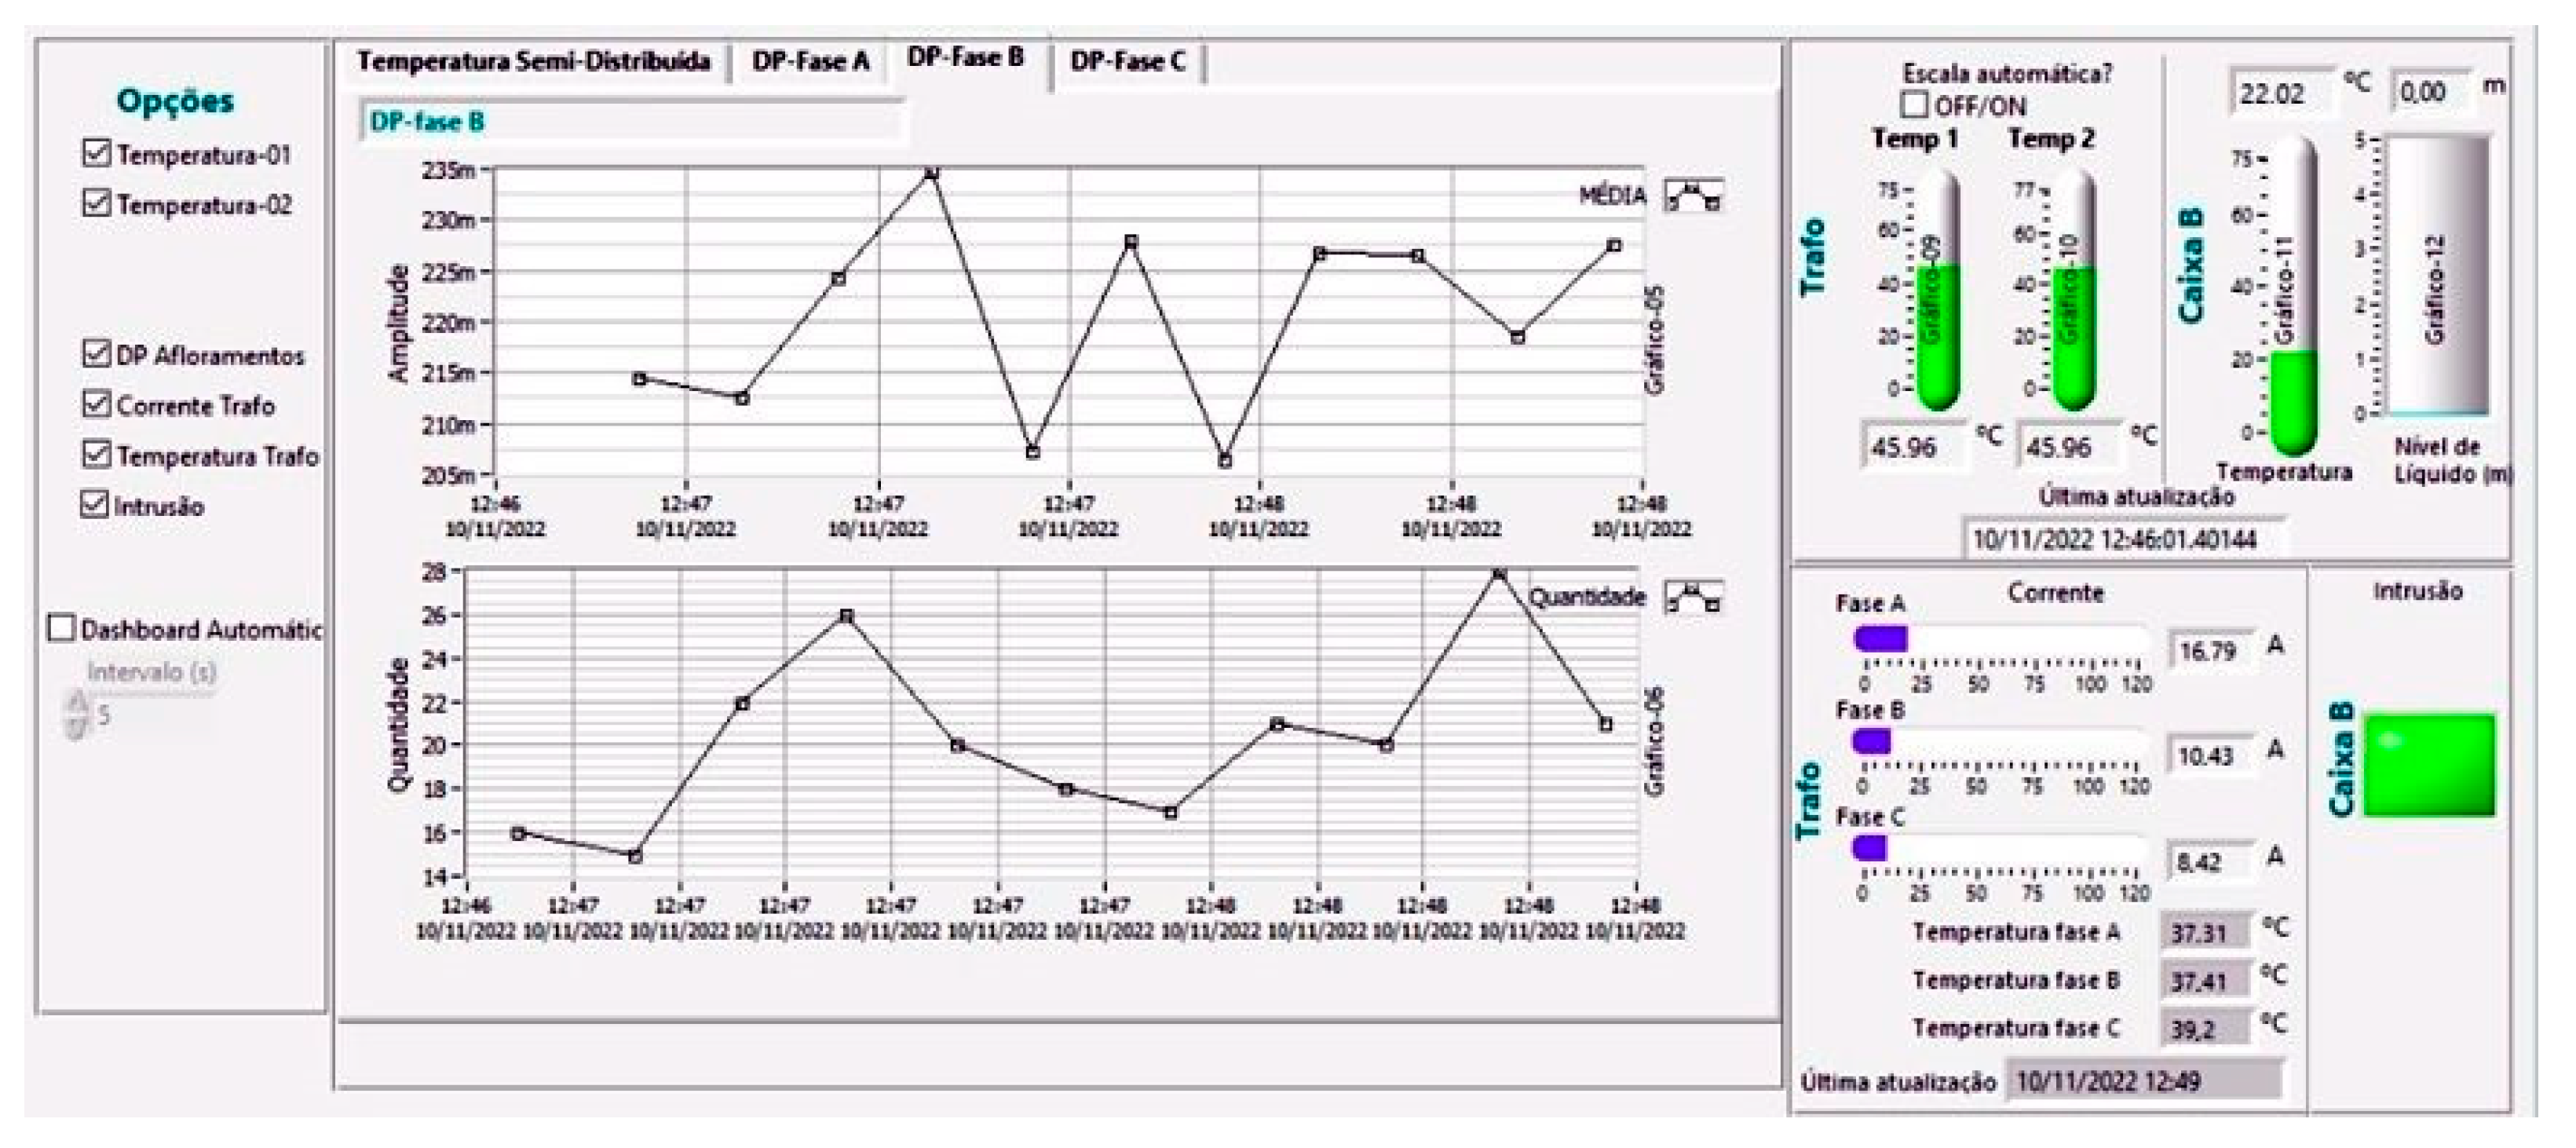
3.2.1. Acquisition and Processing and Visualization Software
- Reading buttons and controls to monitor user inputs;
- NI-DAQ (Data Acquisition) device periodically reads the high-speed interrogator data;
- State machine controls software actions according to the state read from the state queue (initialize, configure, measure, and error);
- Periodically read the FBG interrogator output used for the low-speed sensors;
- Data treatment and display that applies the necessary mathematical operations to the measured signals and displays the results on a dashboard;
- DNP3 communication with the DNP3 server;
- Local storage of measurements for software analysis (possible debugs);
- Send commands to the high-speed interrogator firmware. In normal operation, the firmware is already calibrated. This loop is used if a local configuration is required.
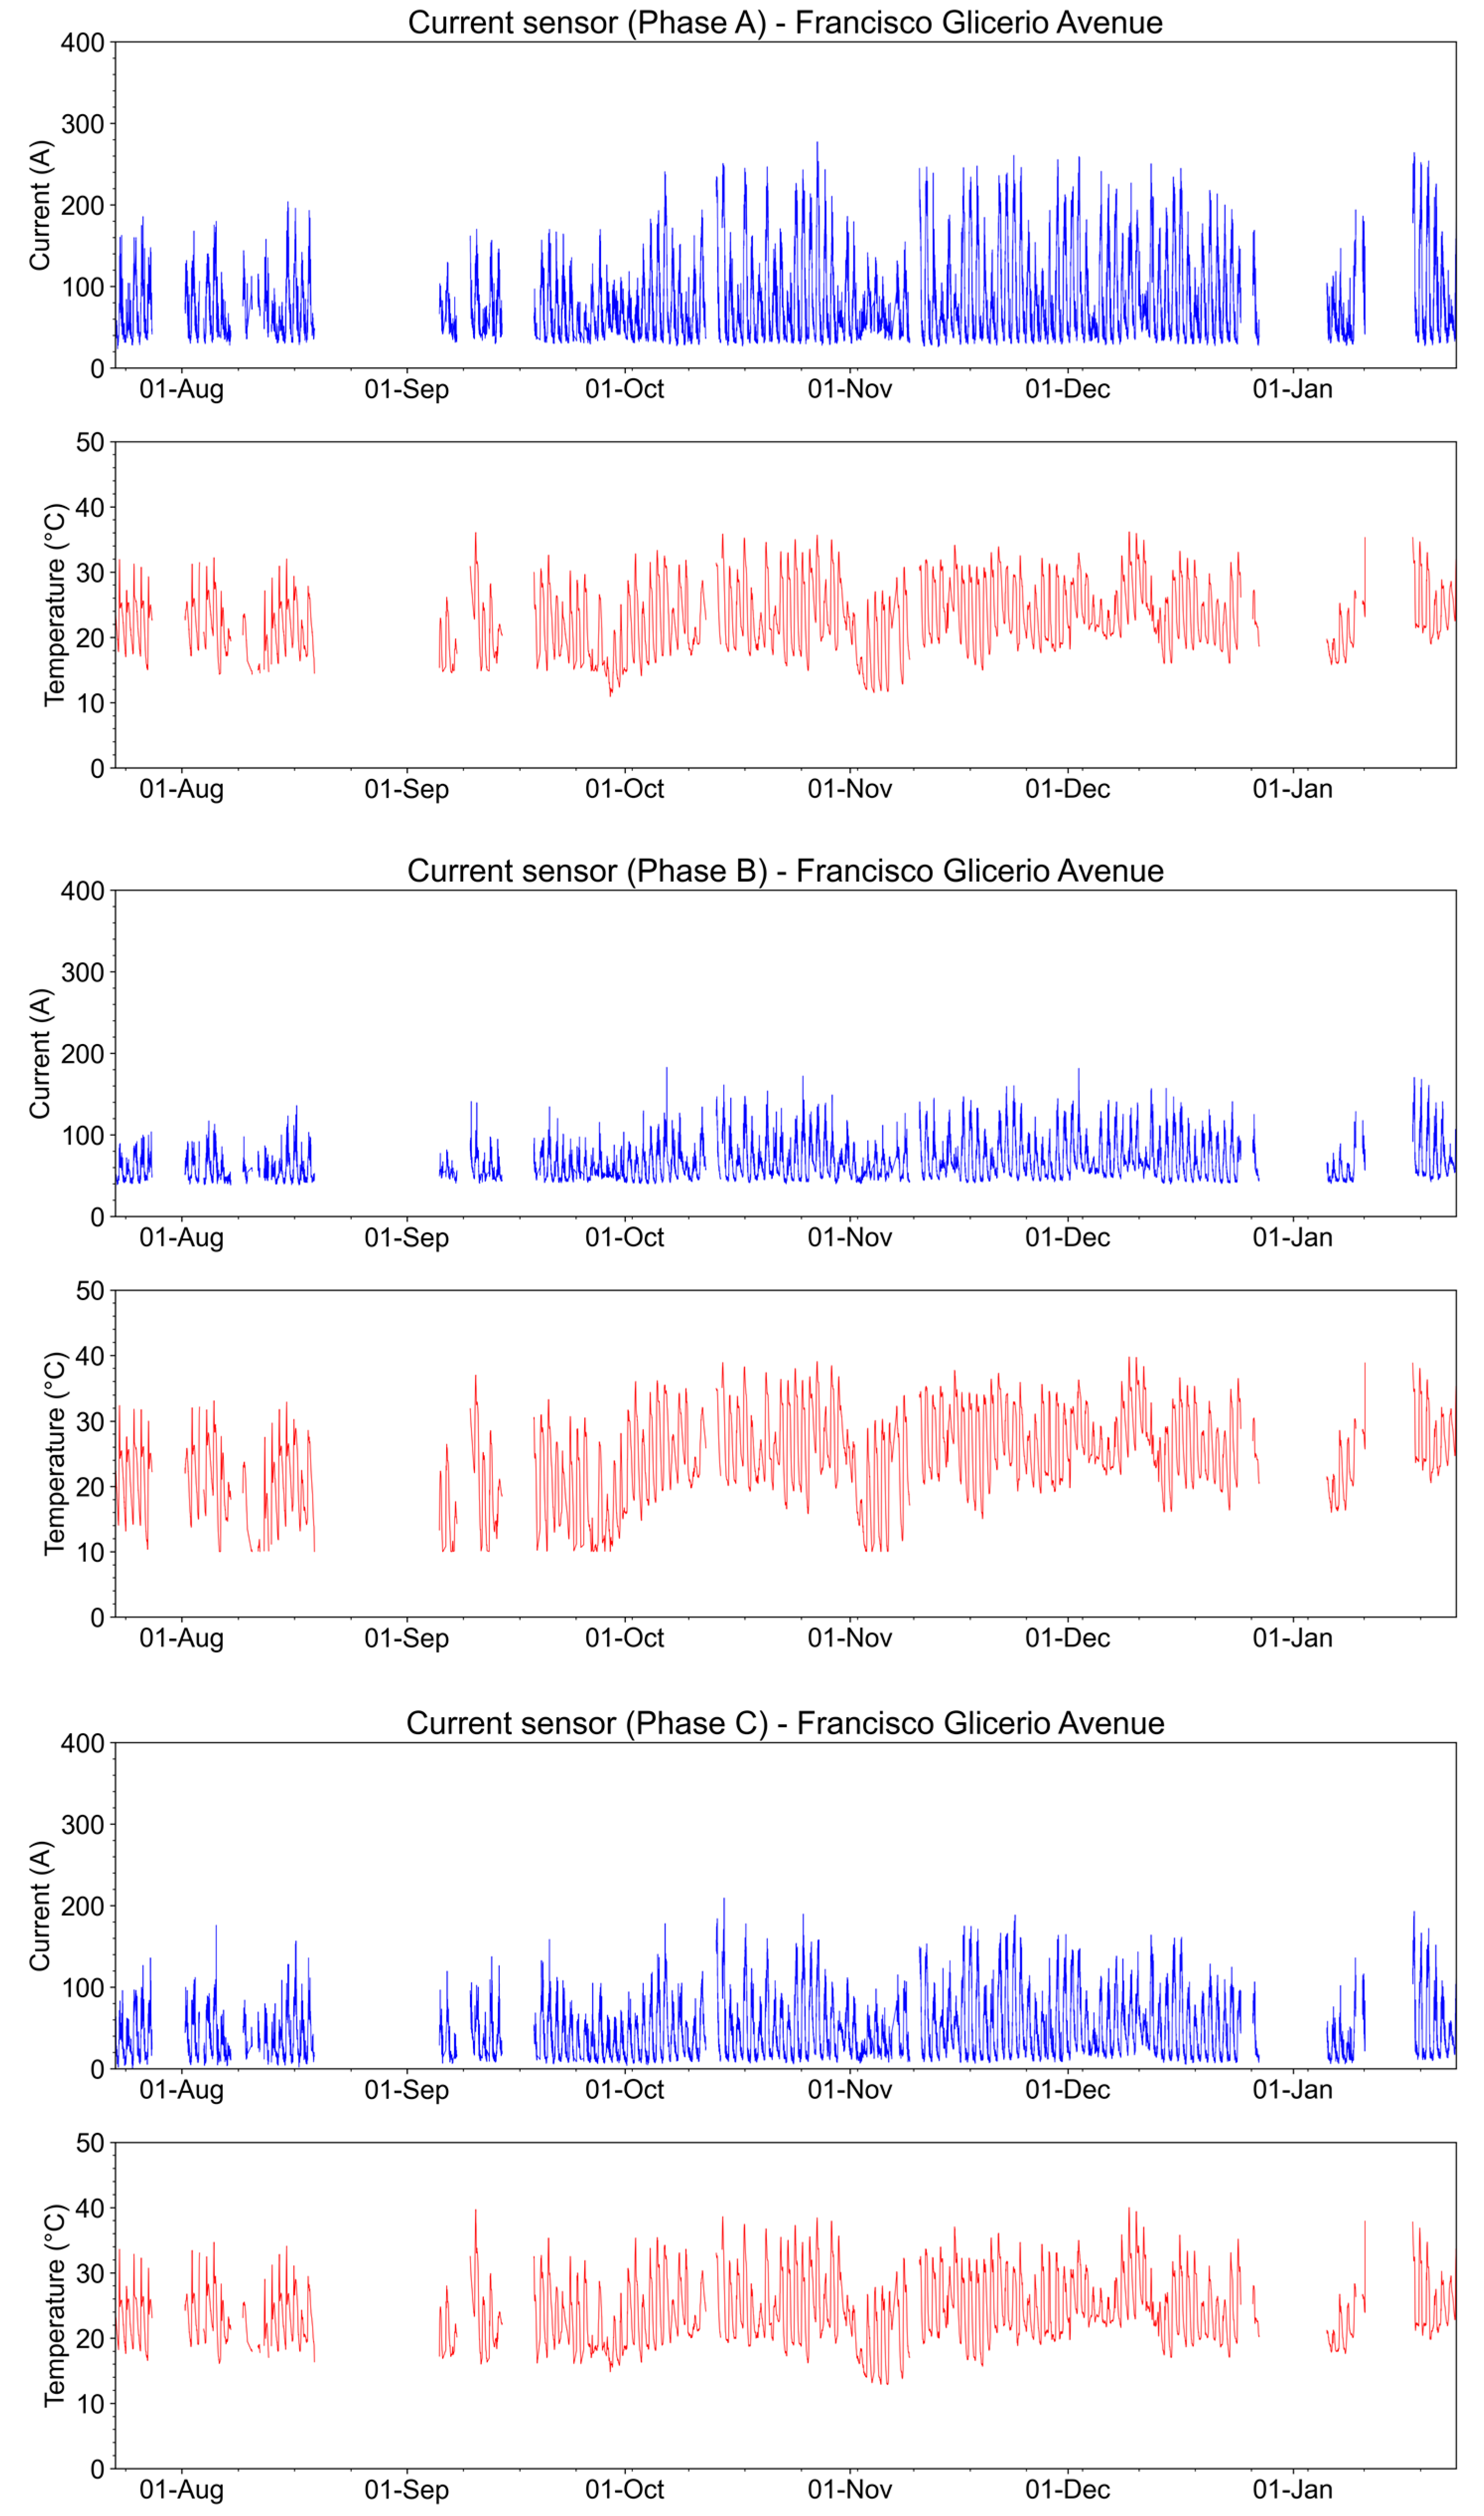
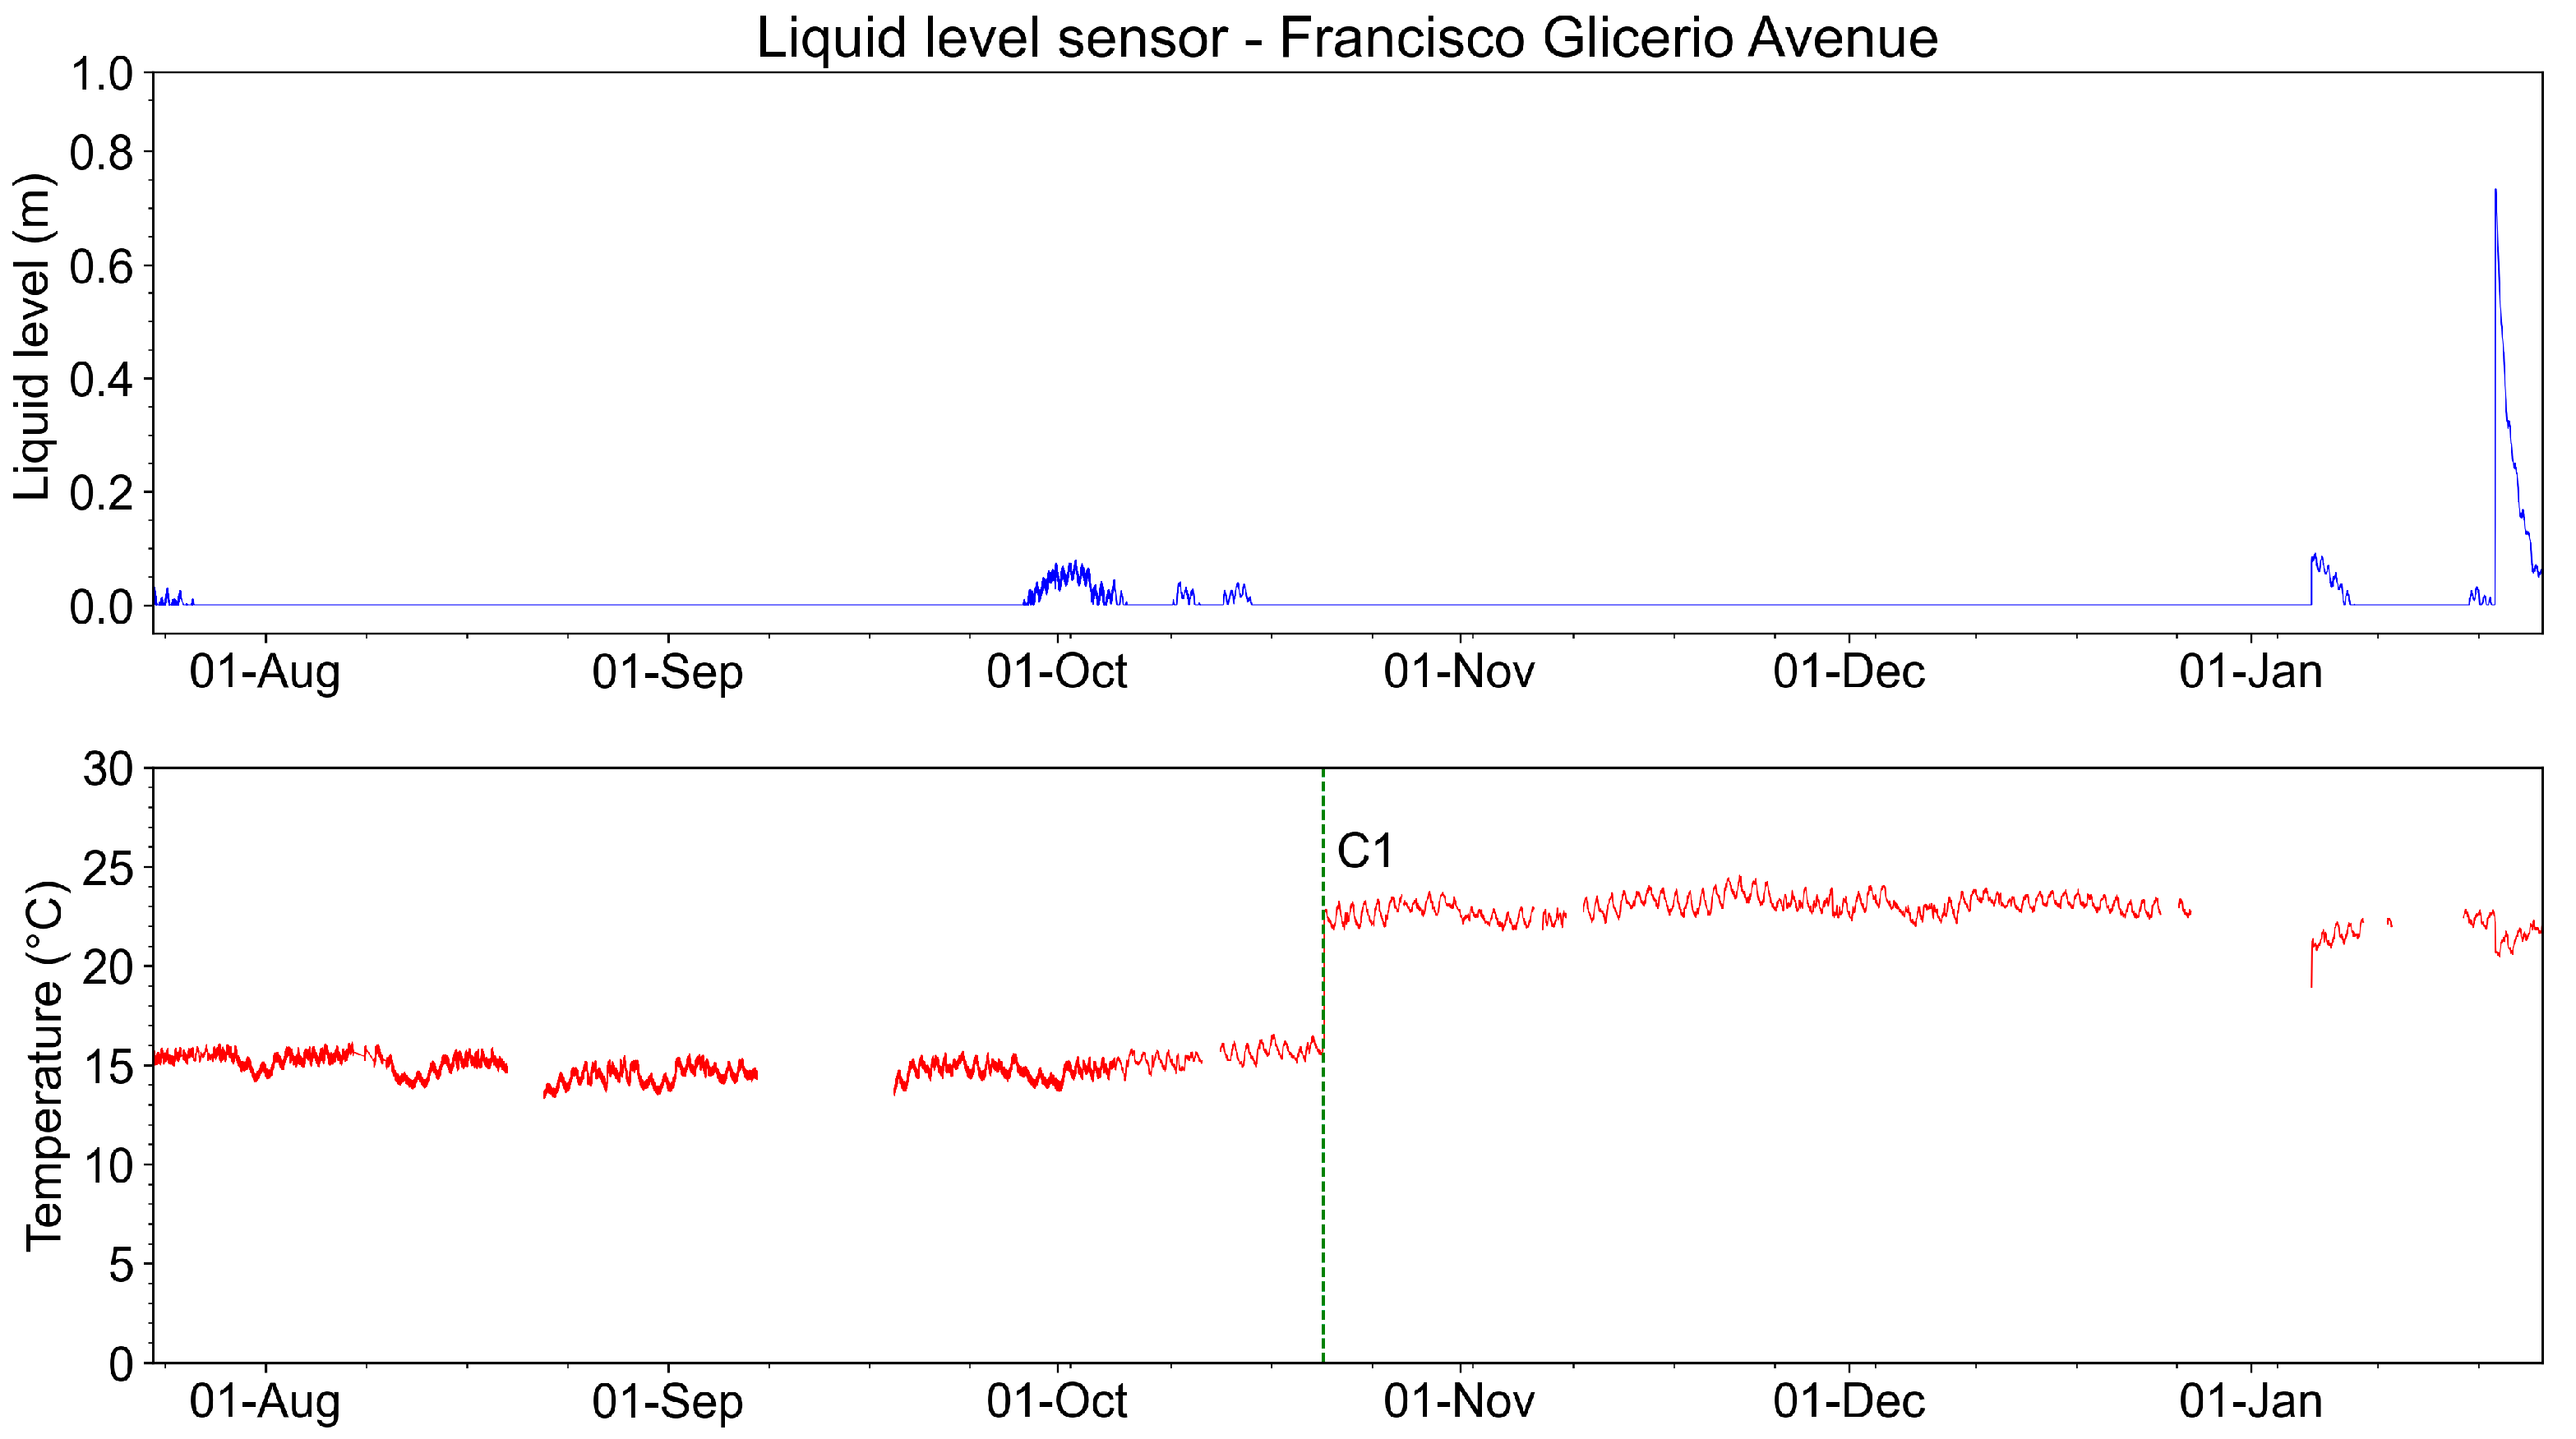
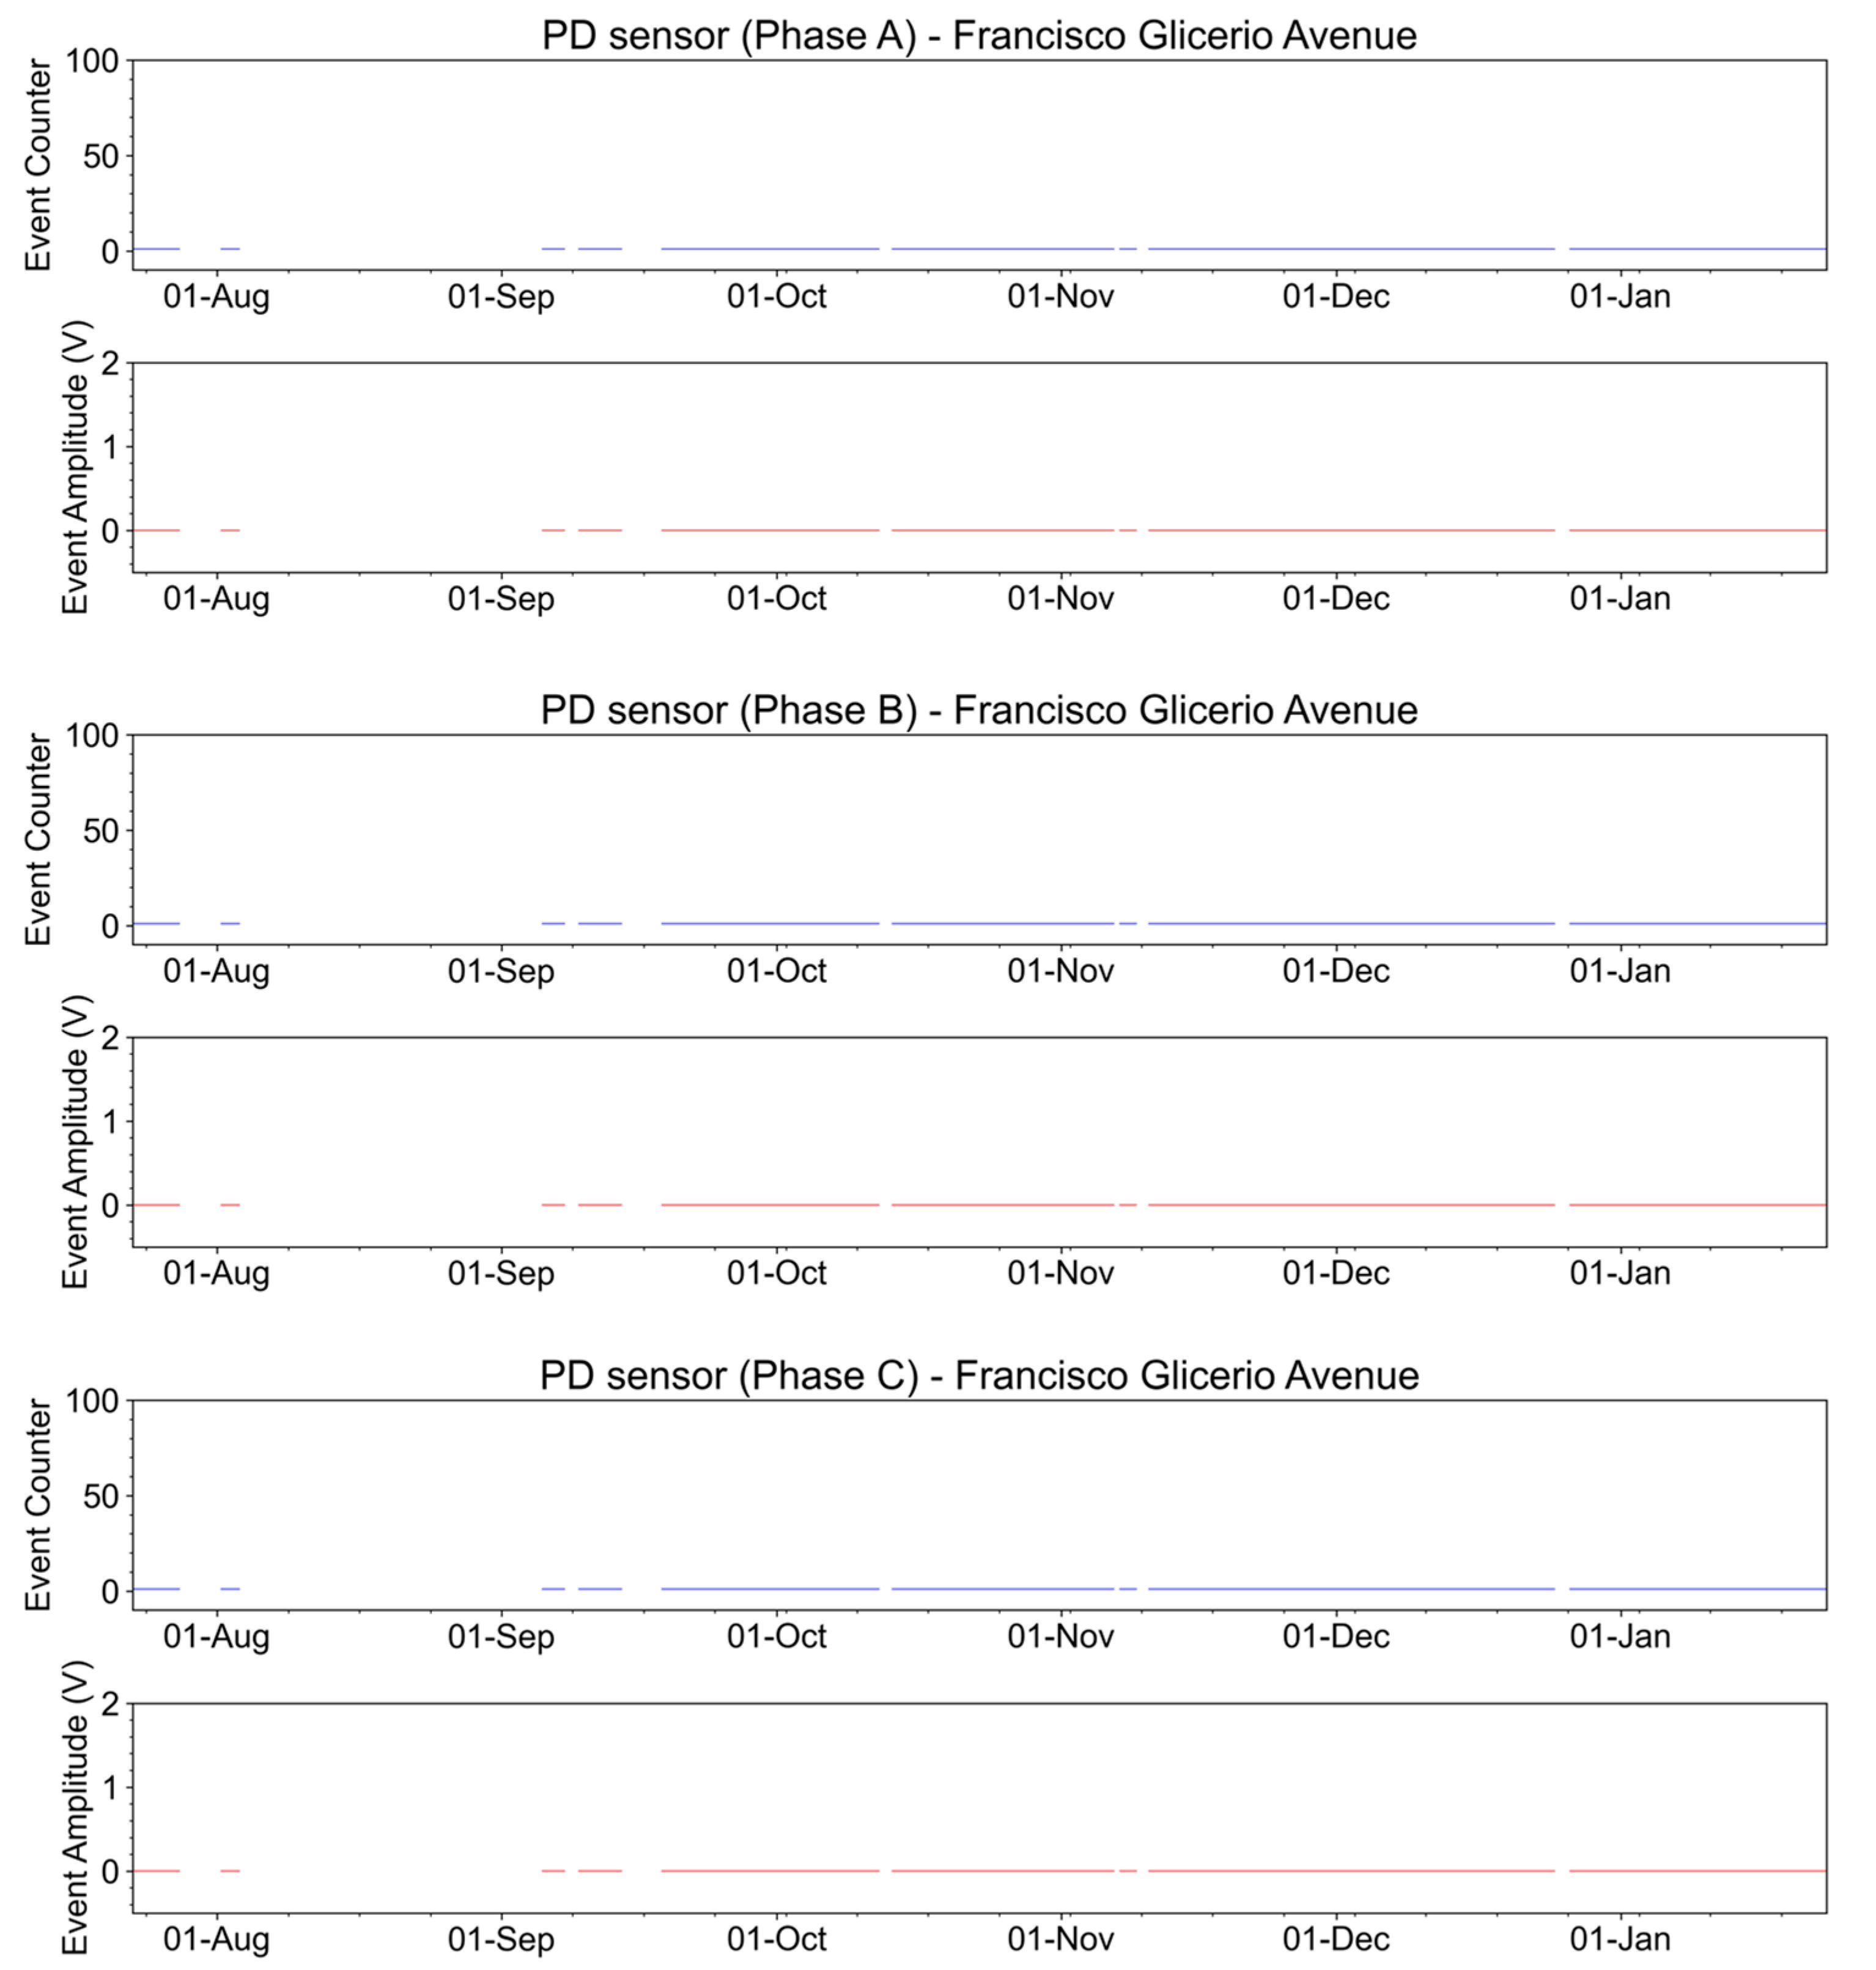
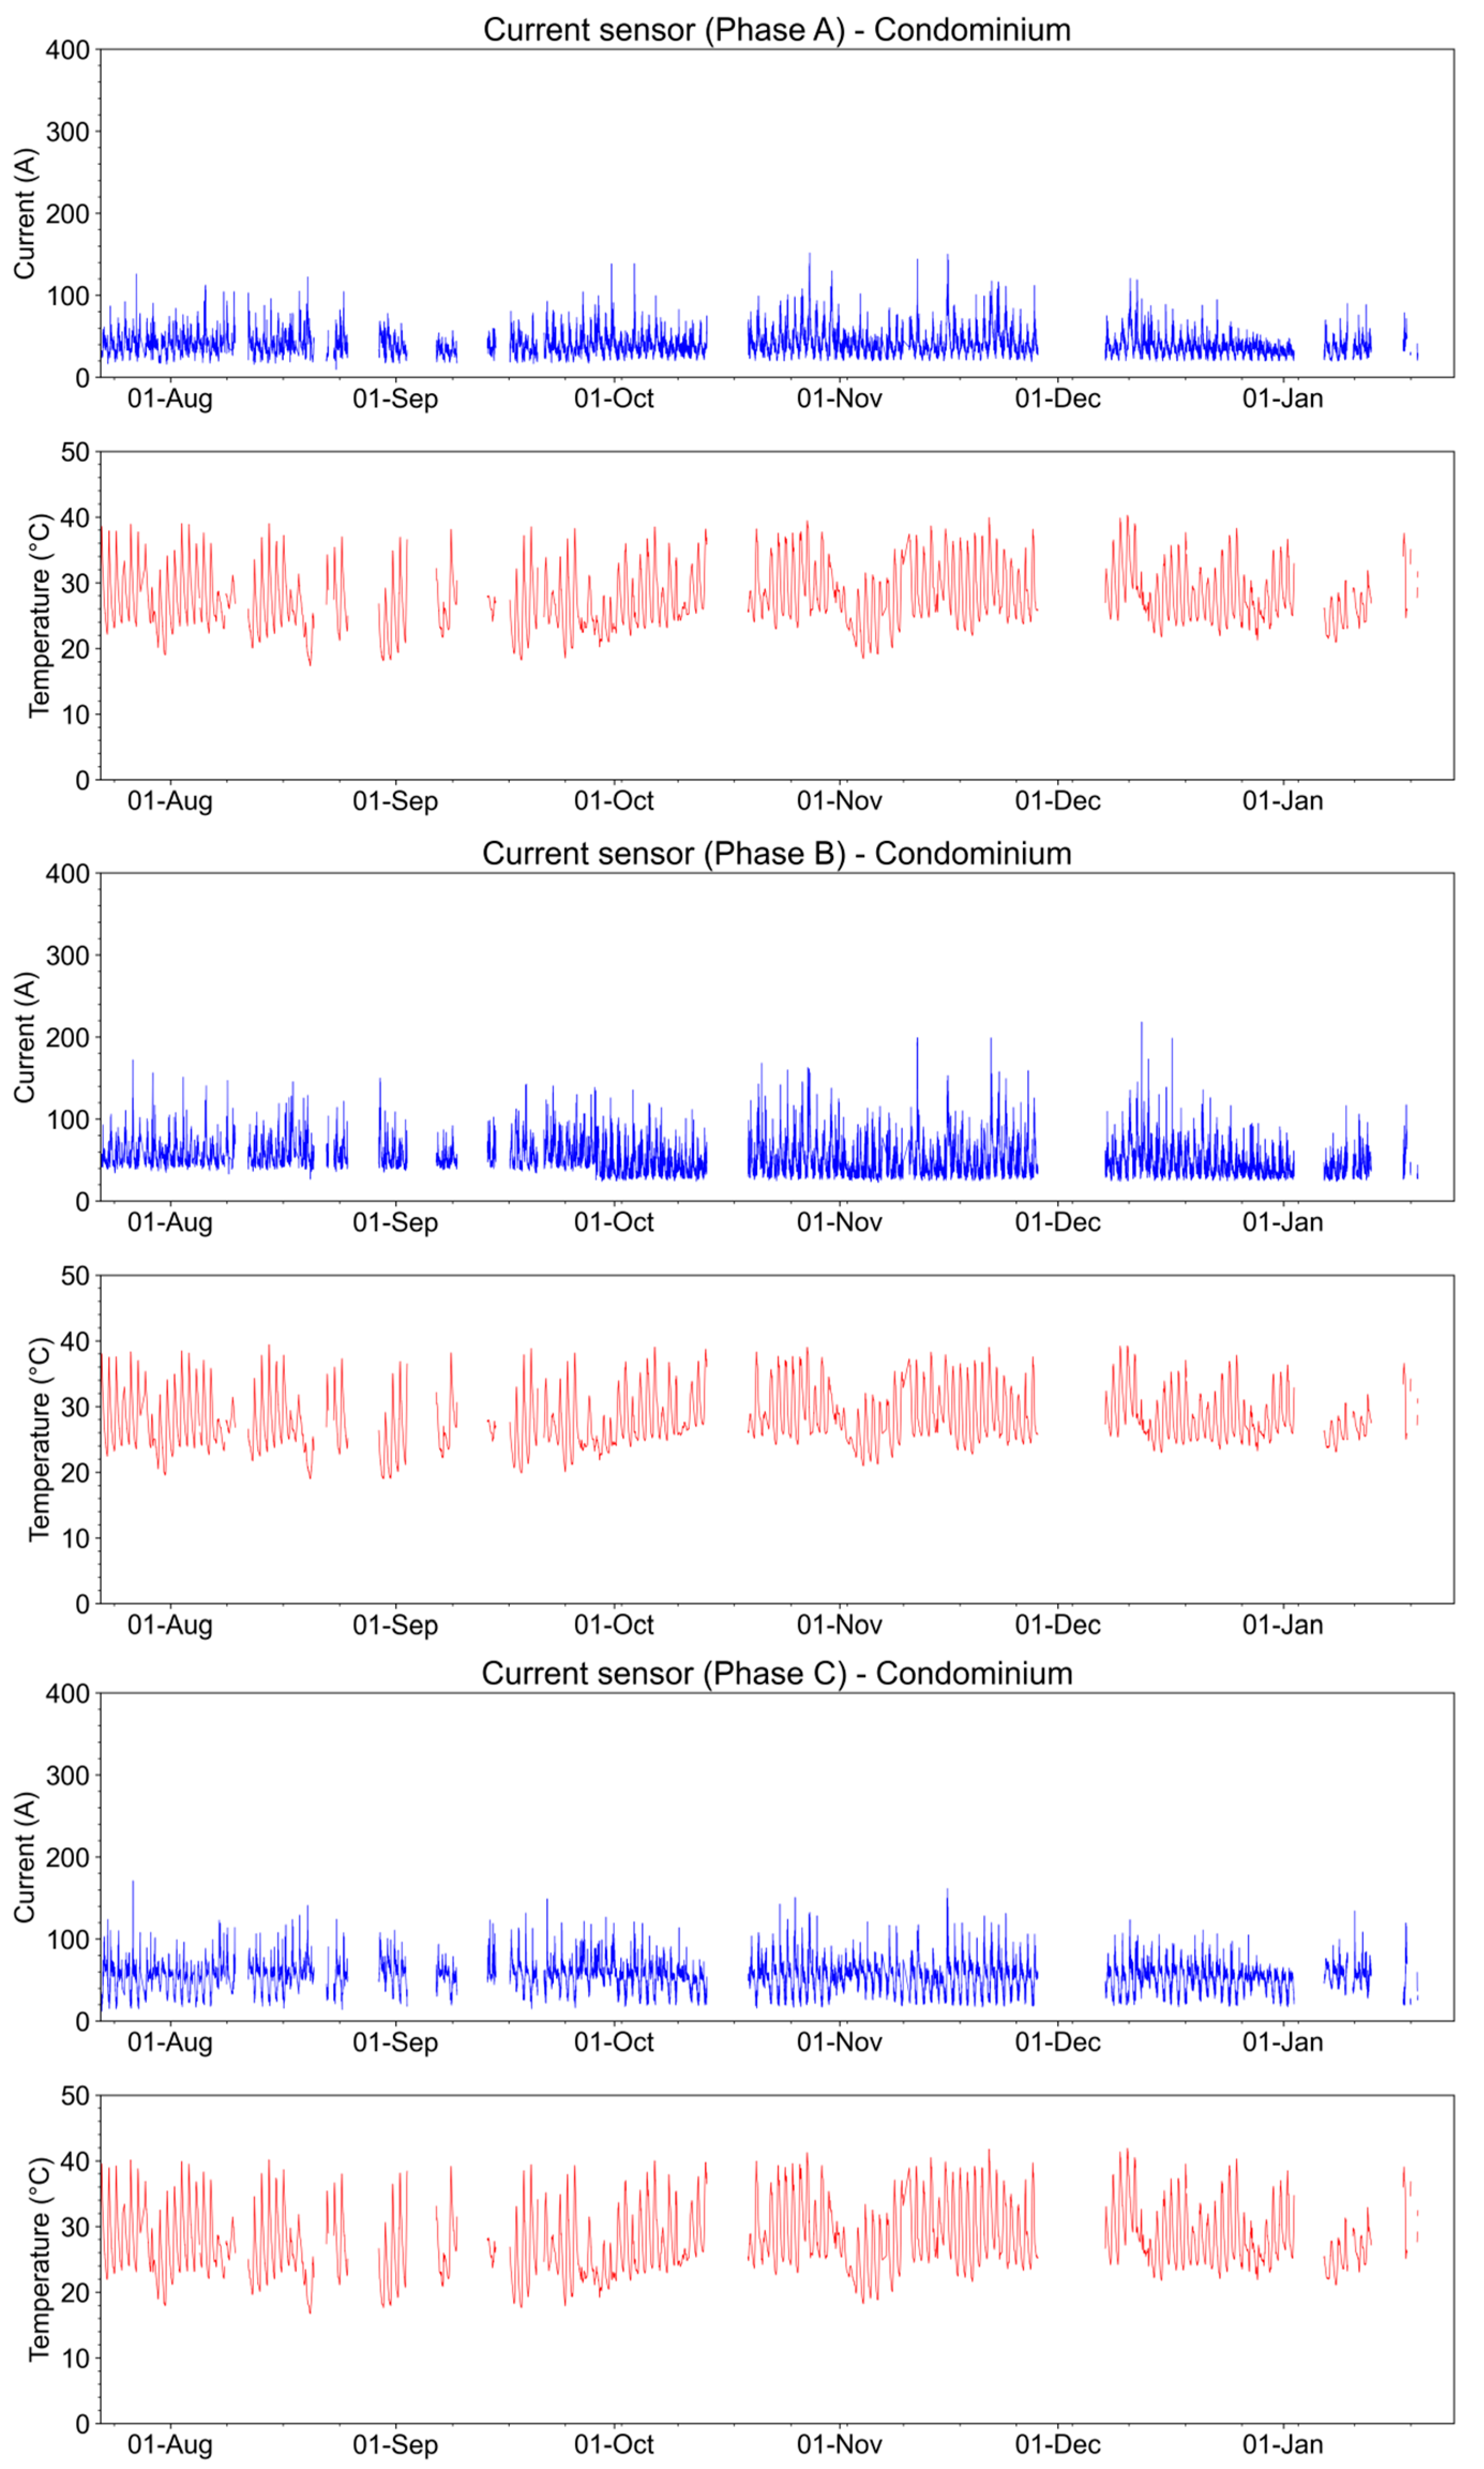
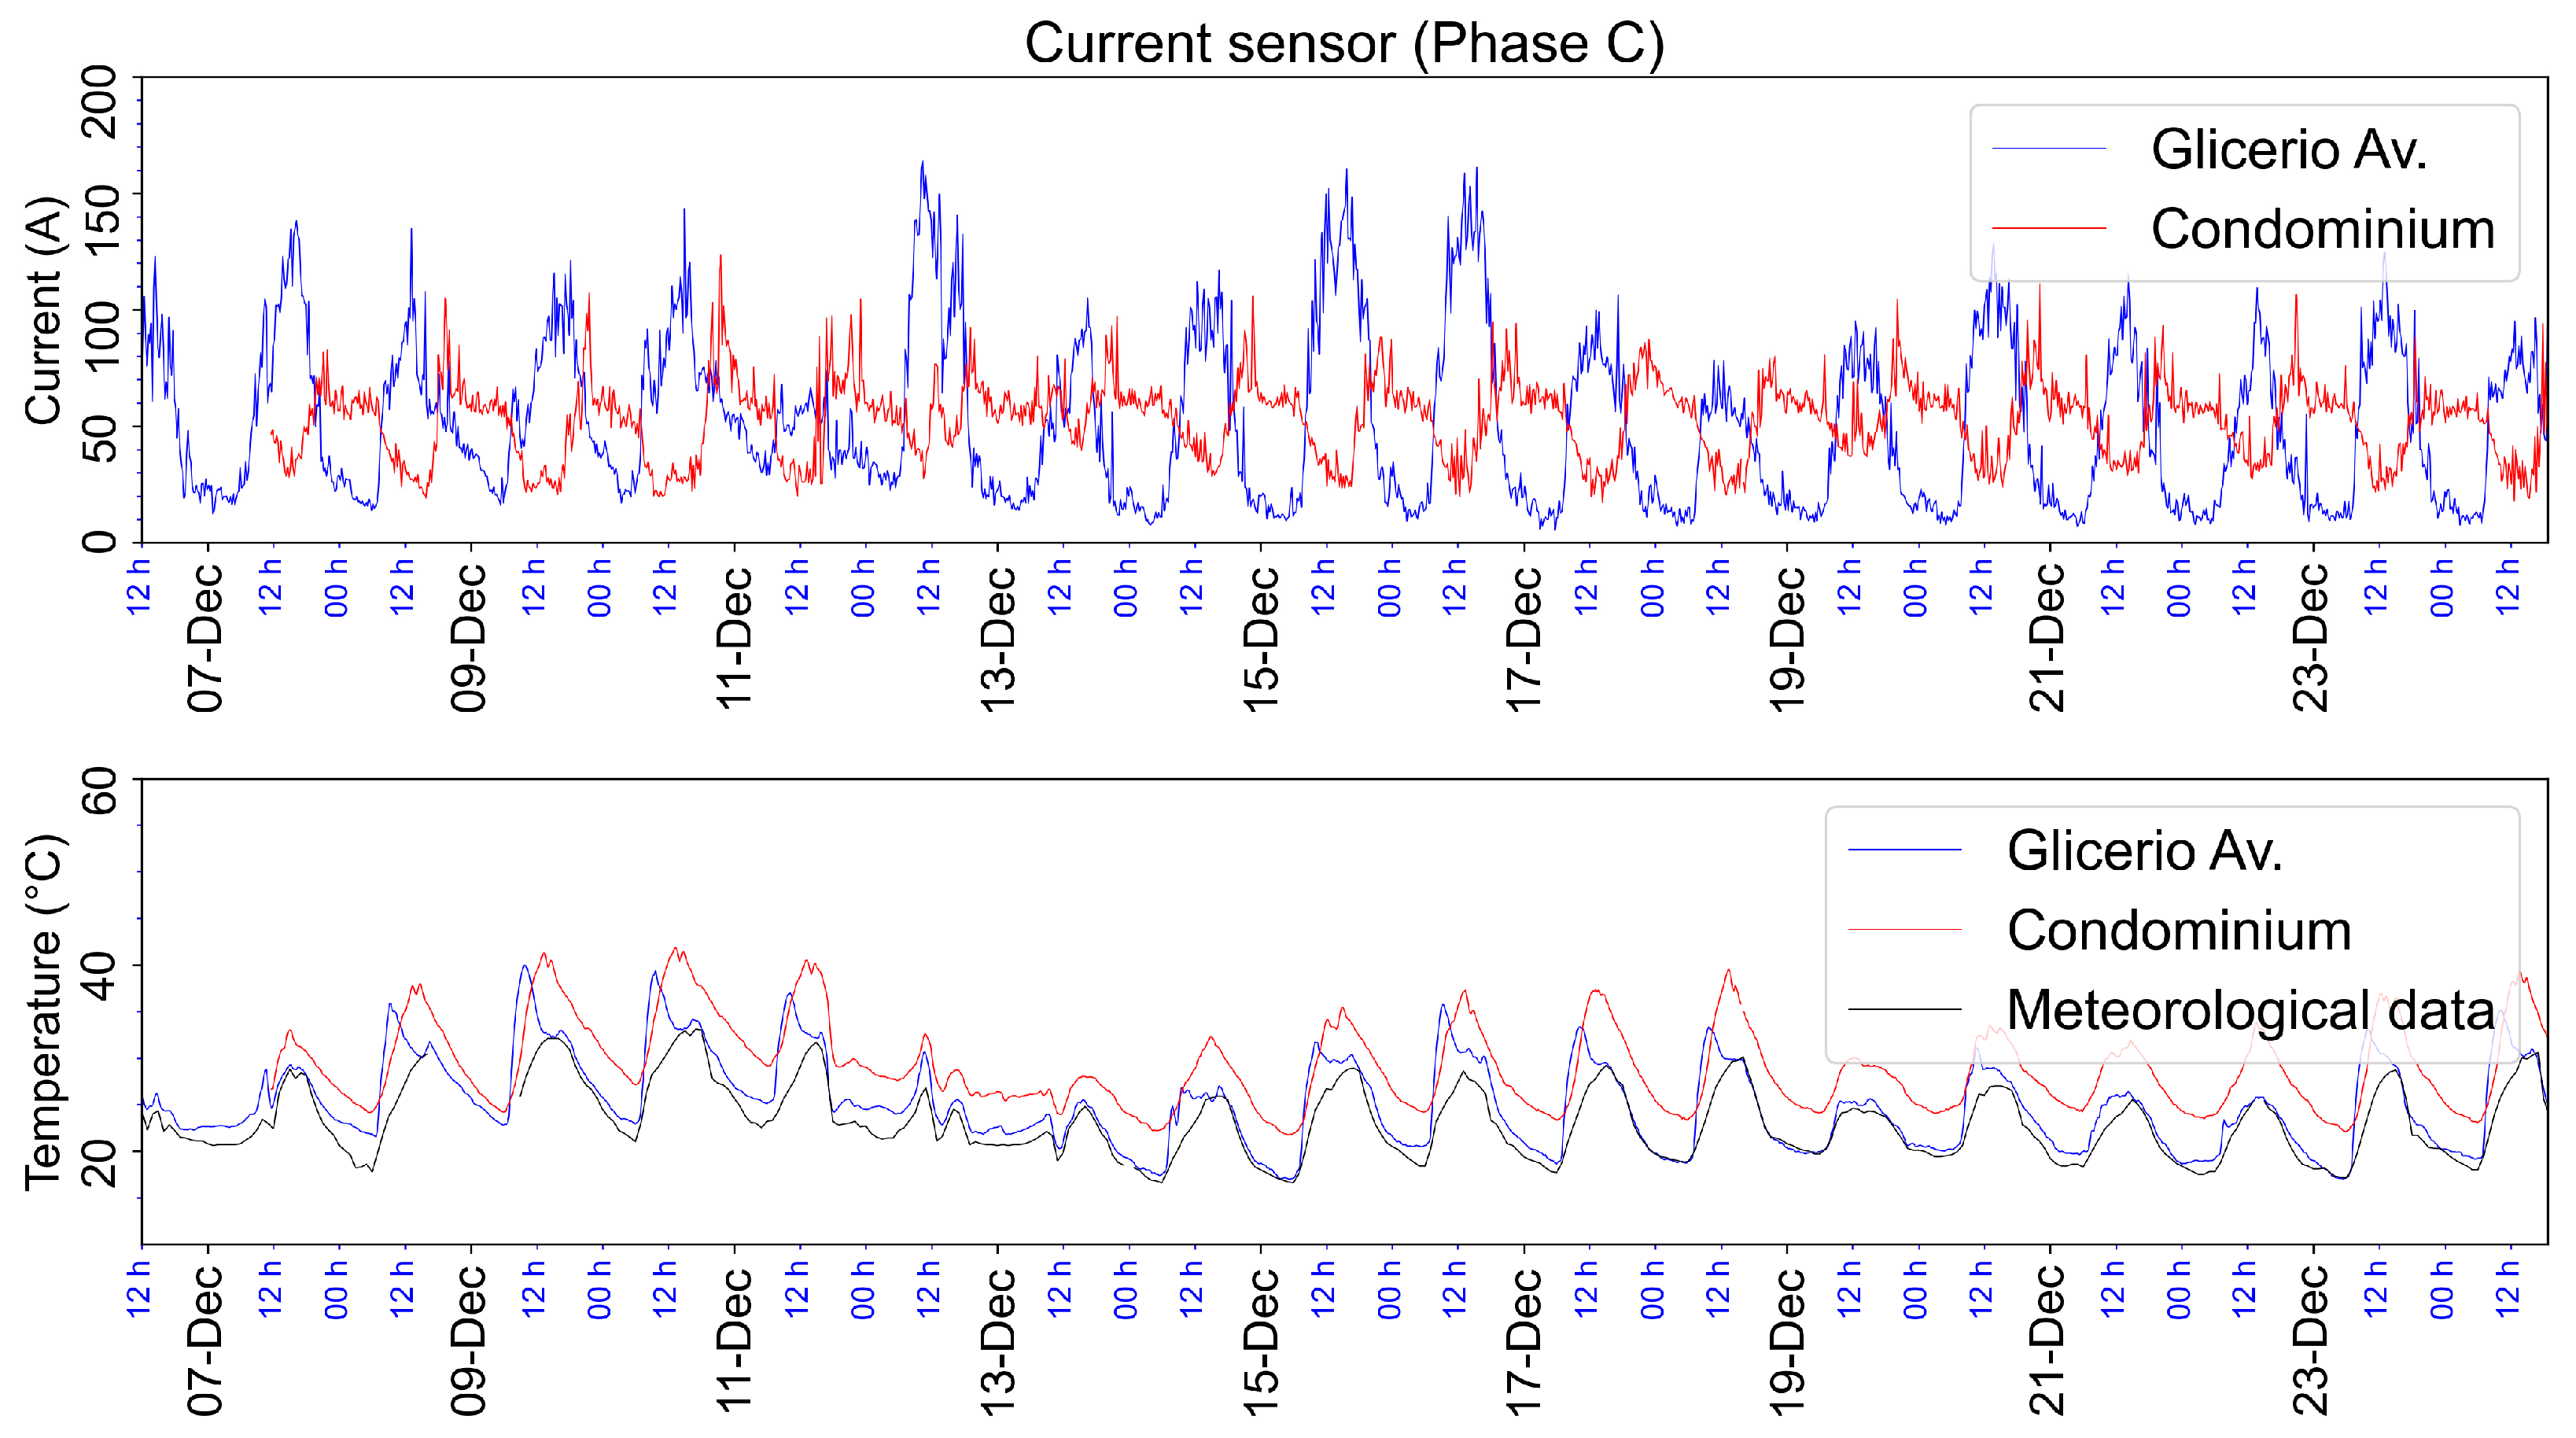
3.2.2. Data Analyses from the Field Tests
Downtown Underground Distribution Network
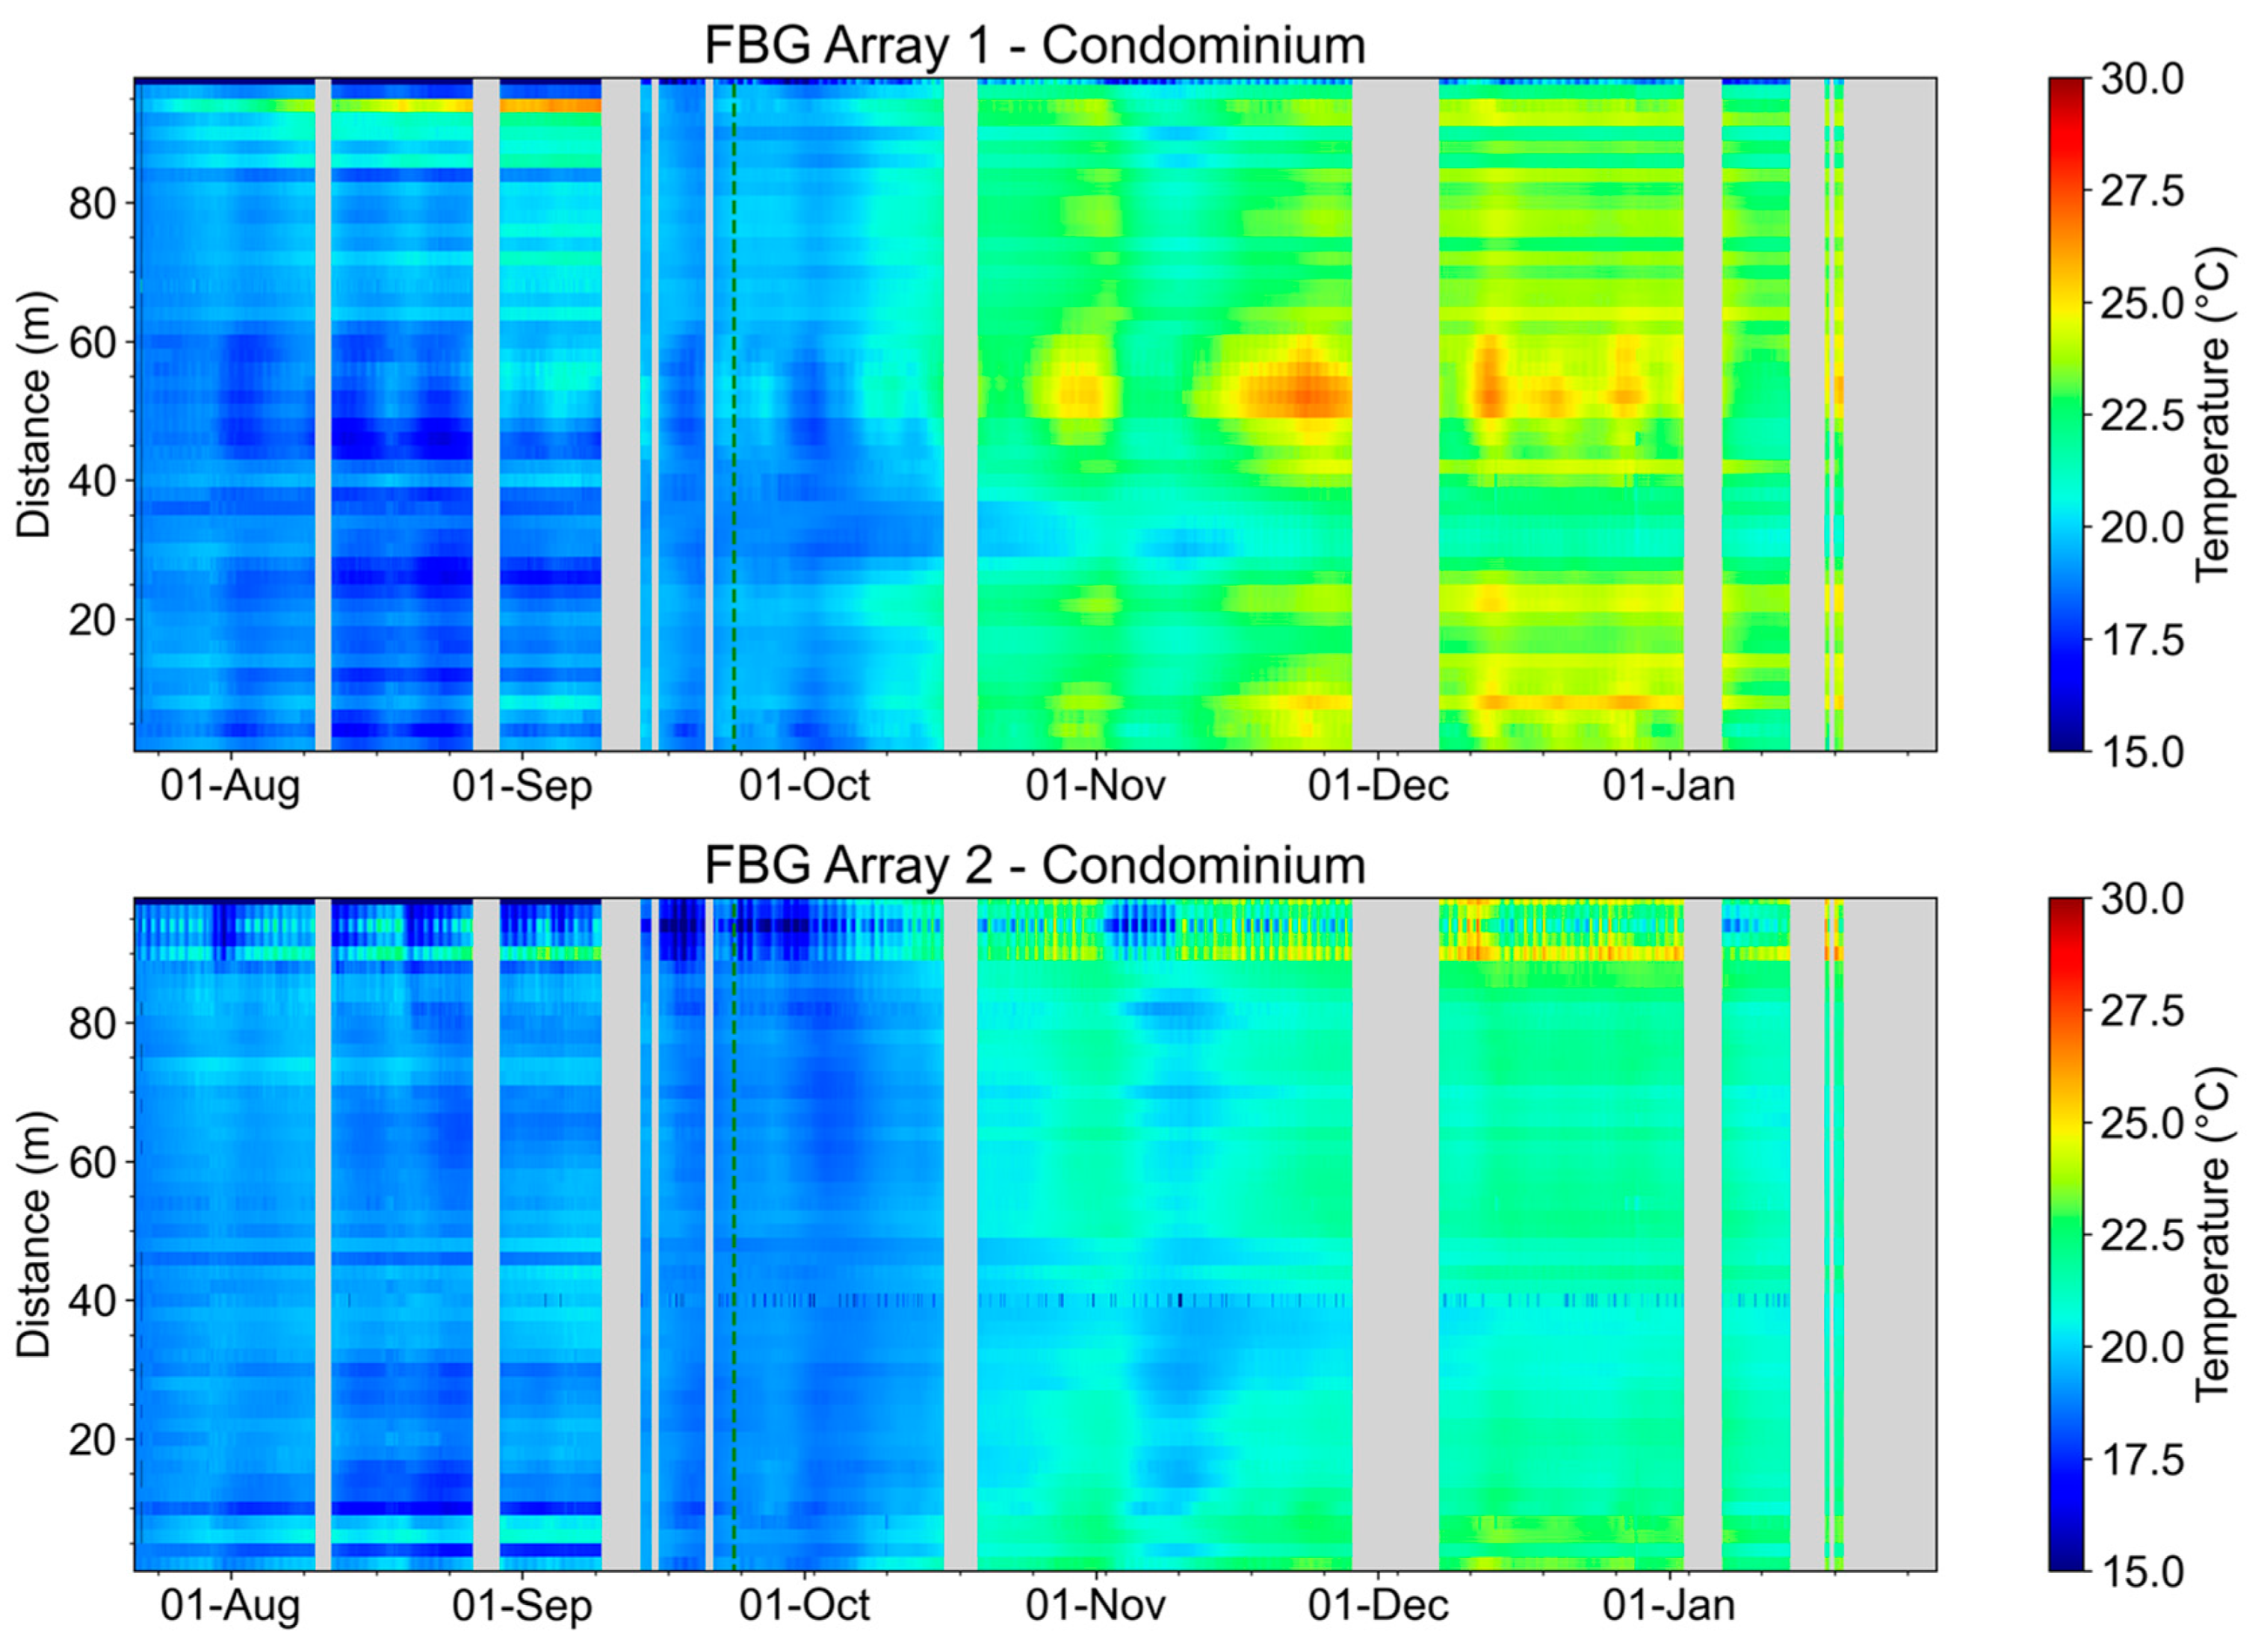
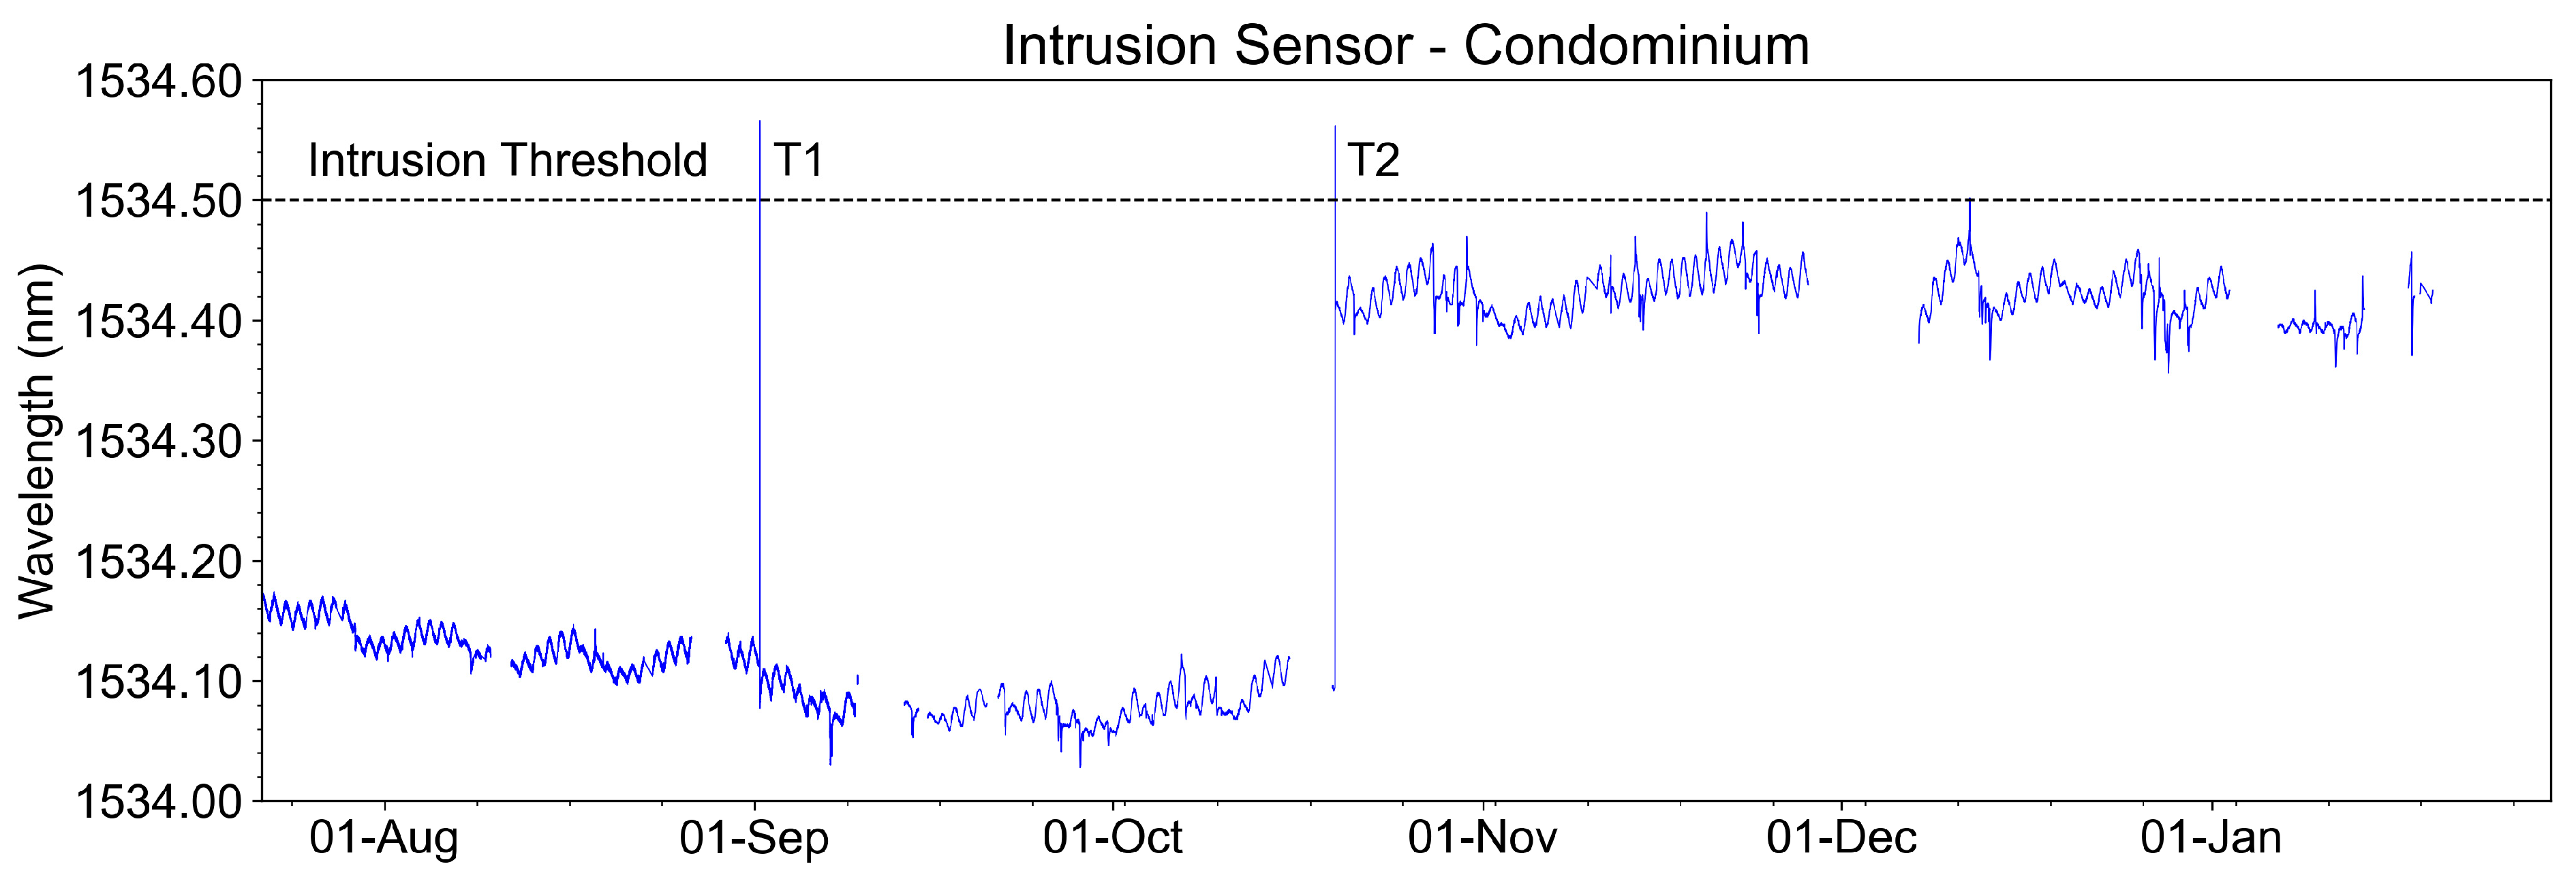
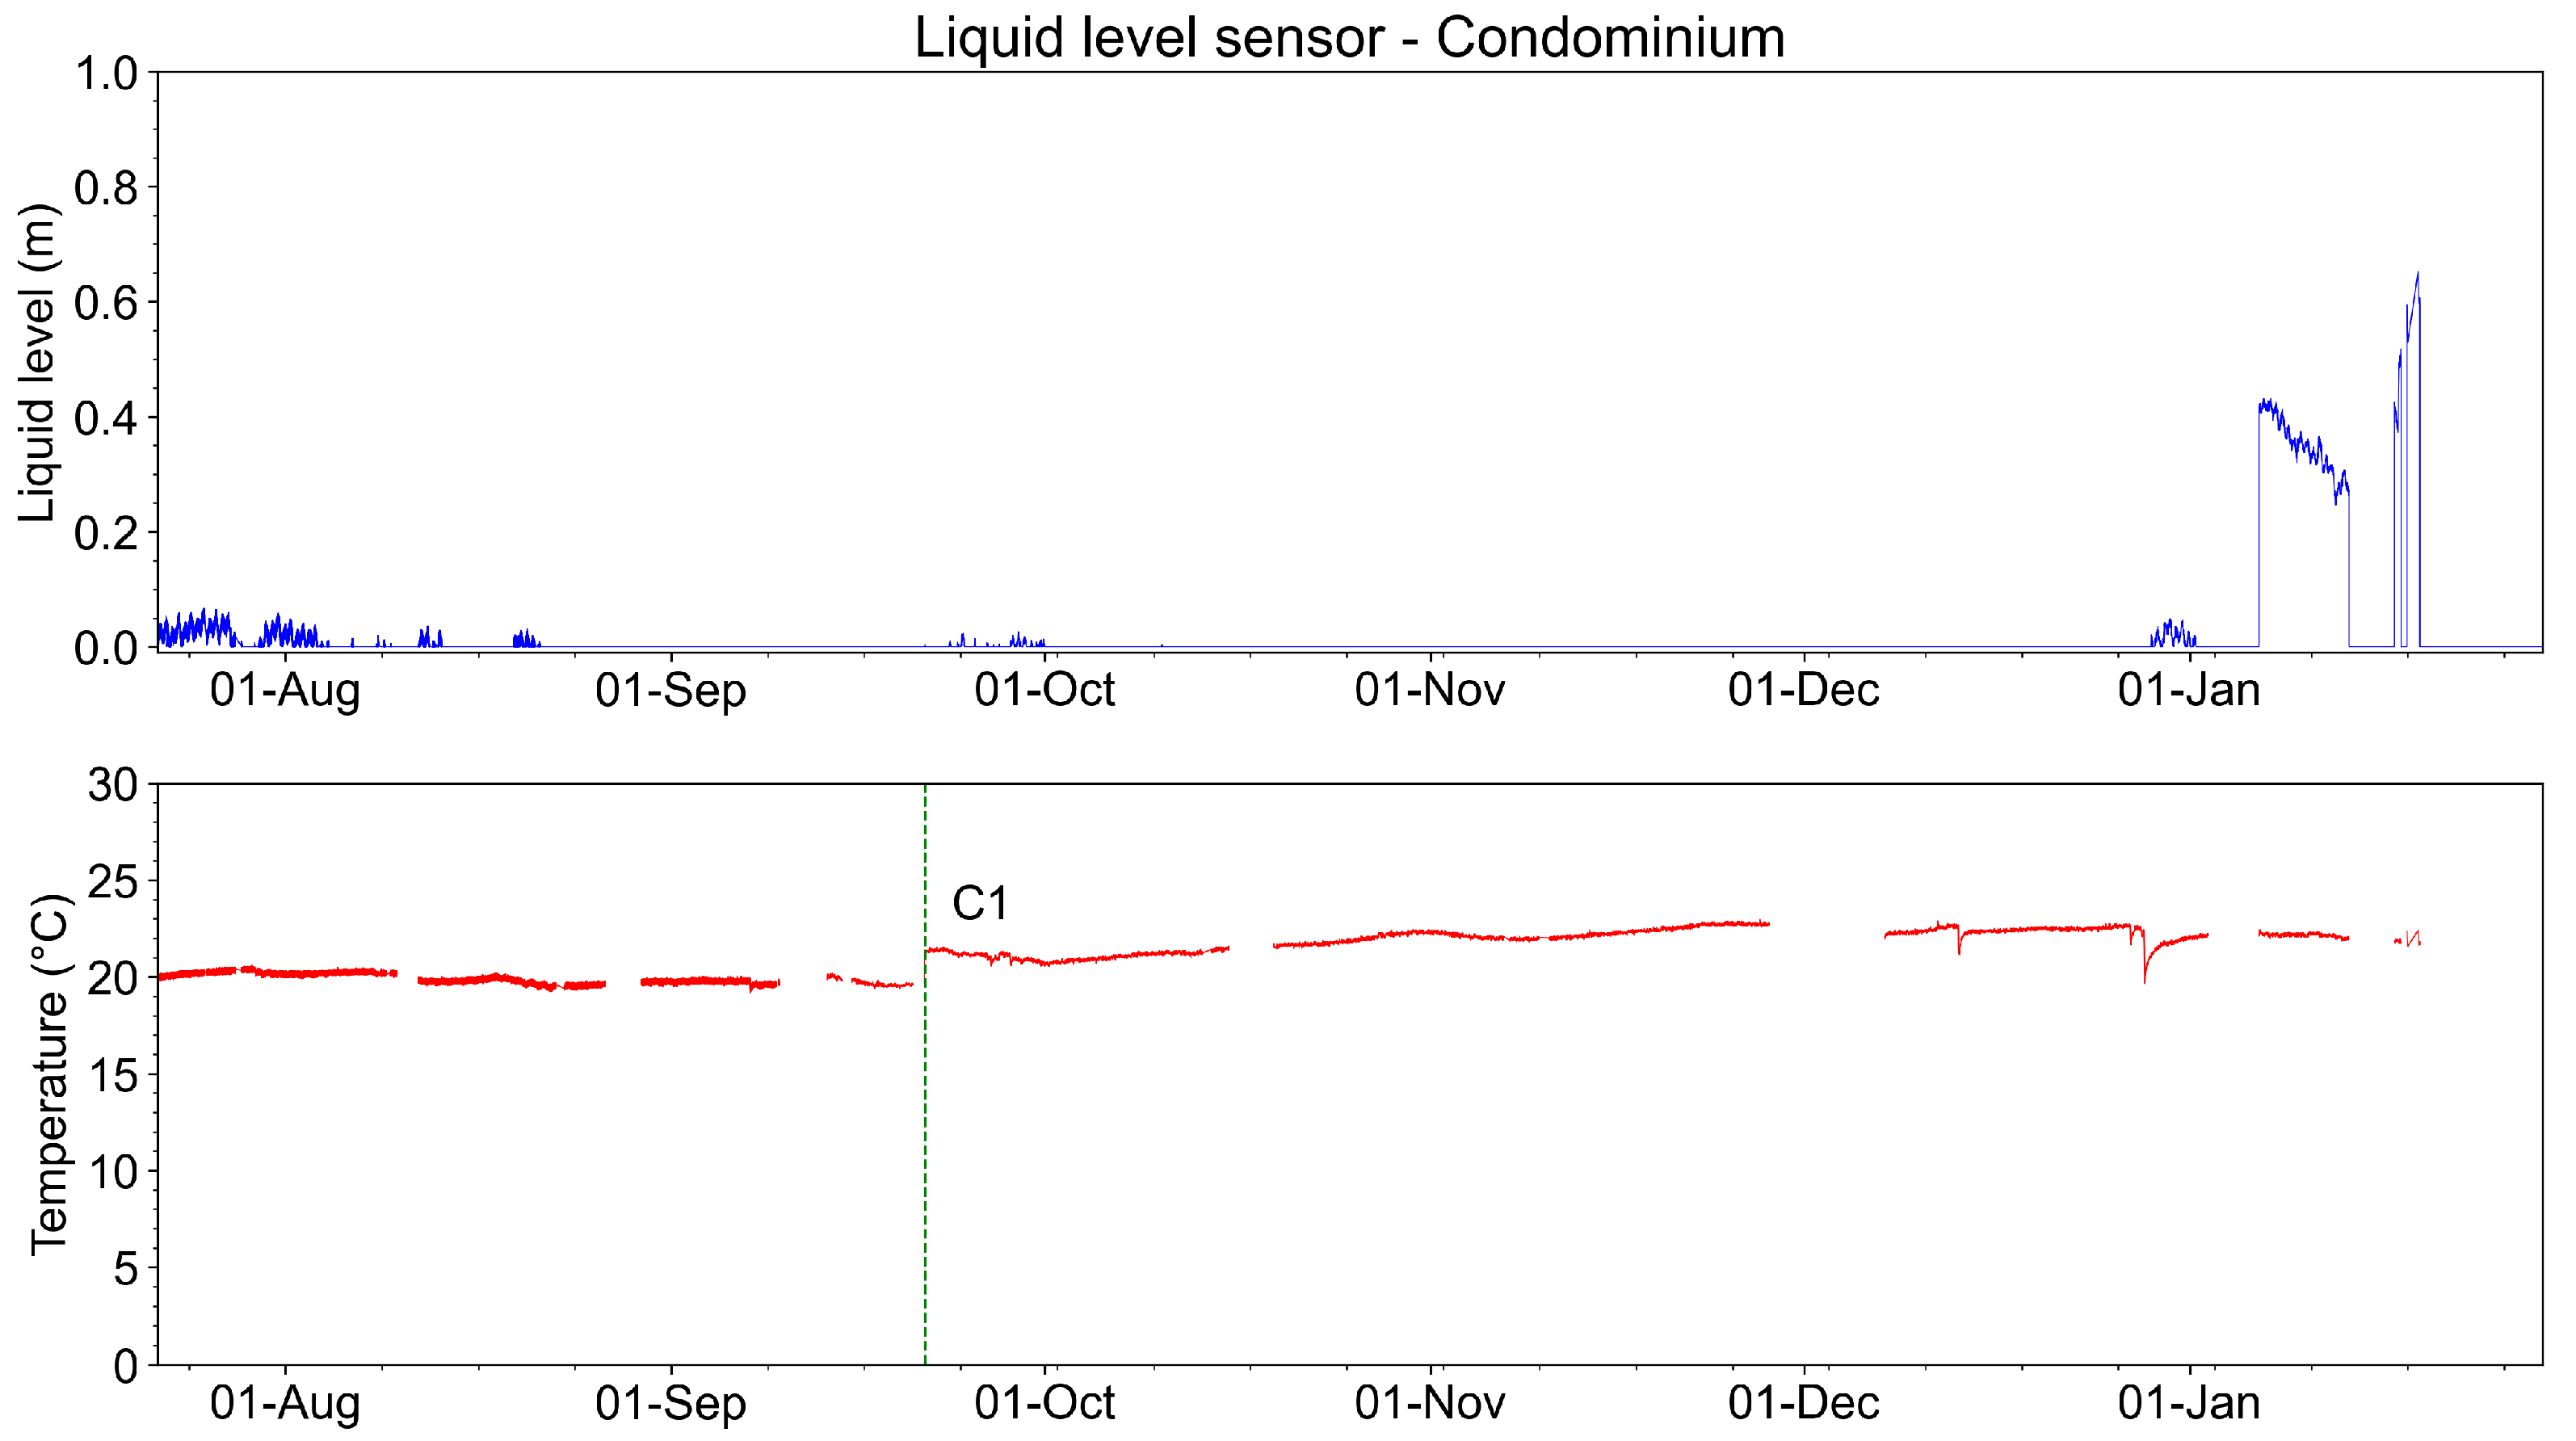
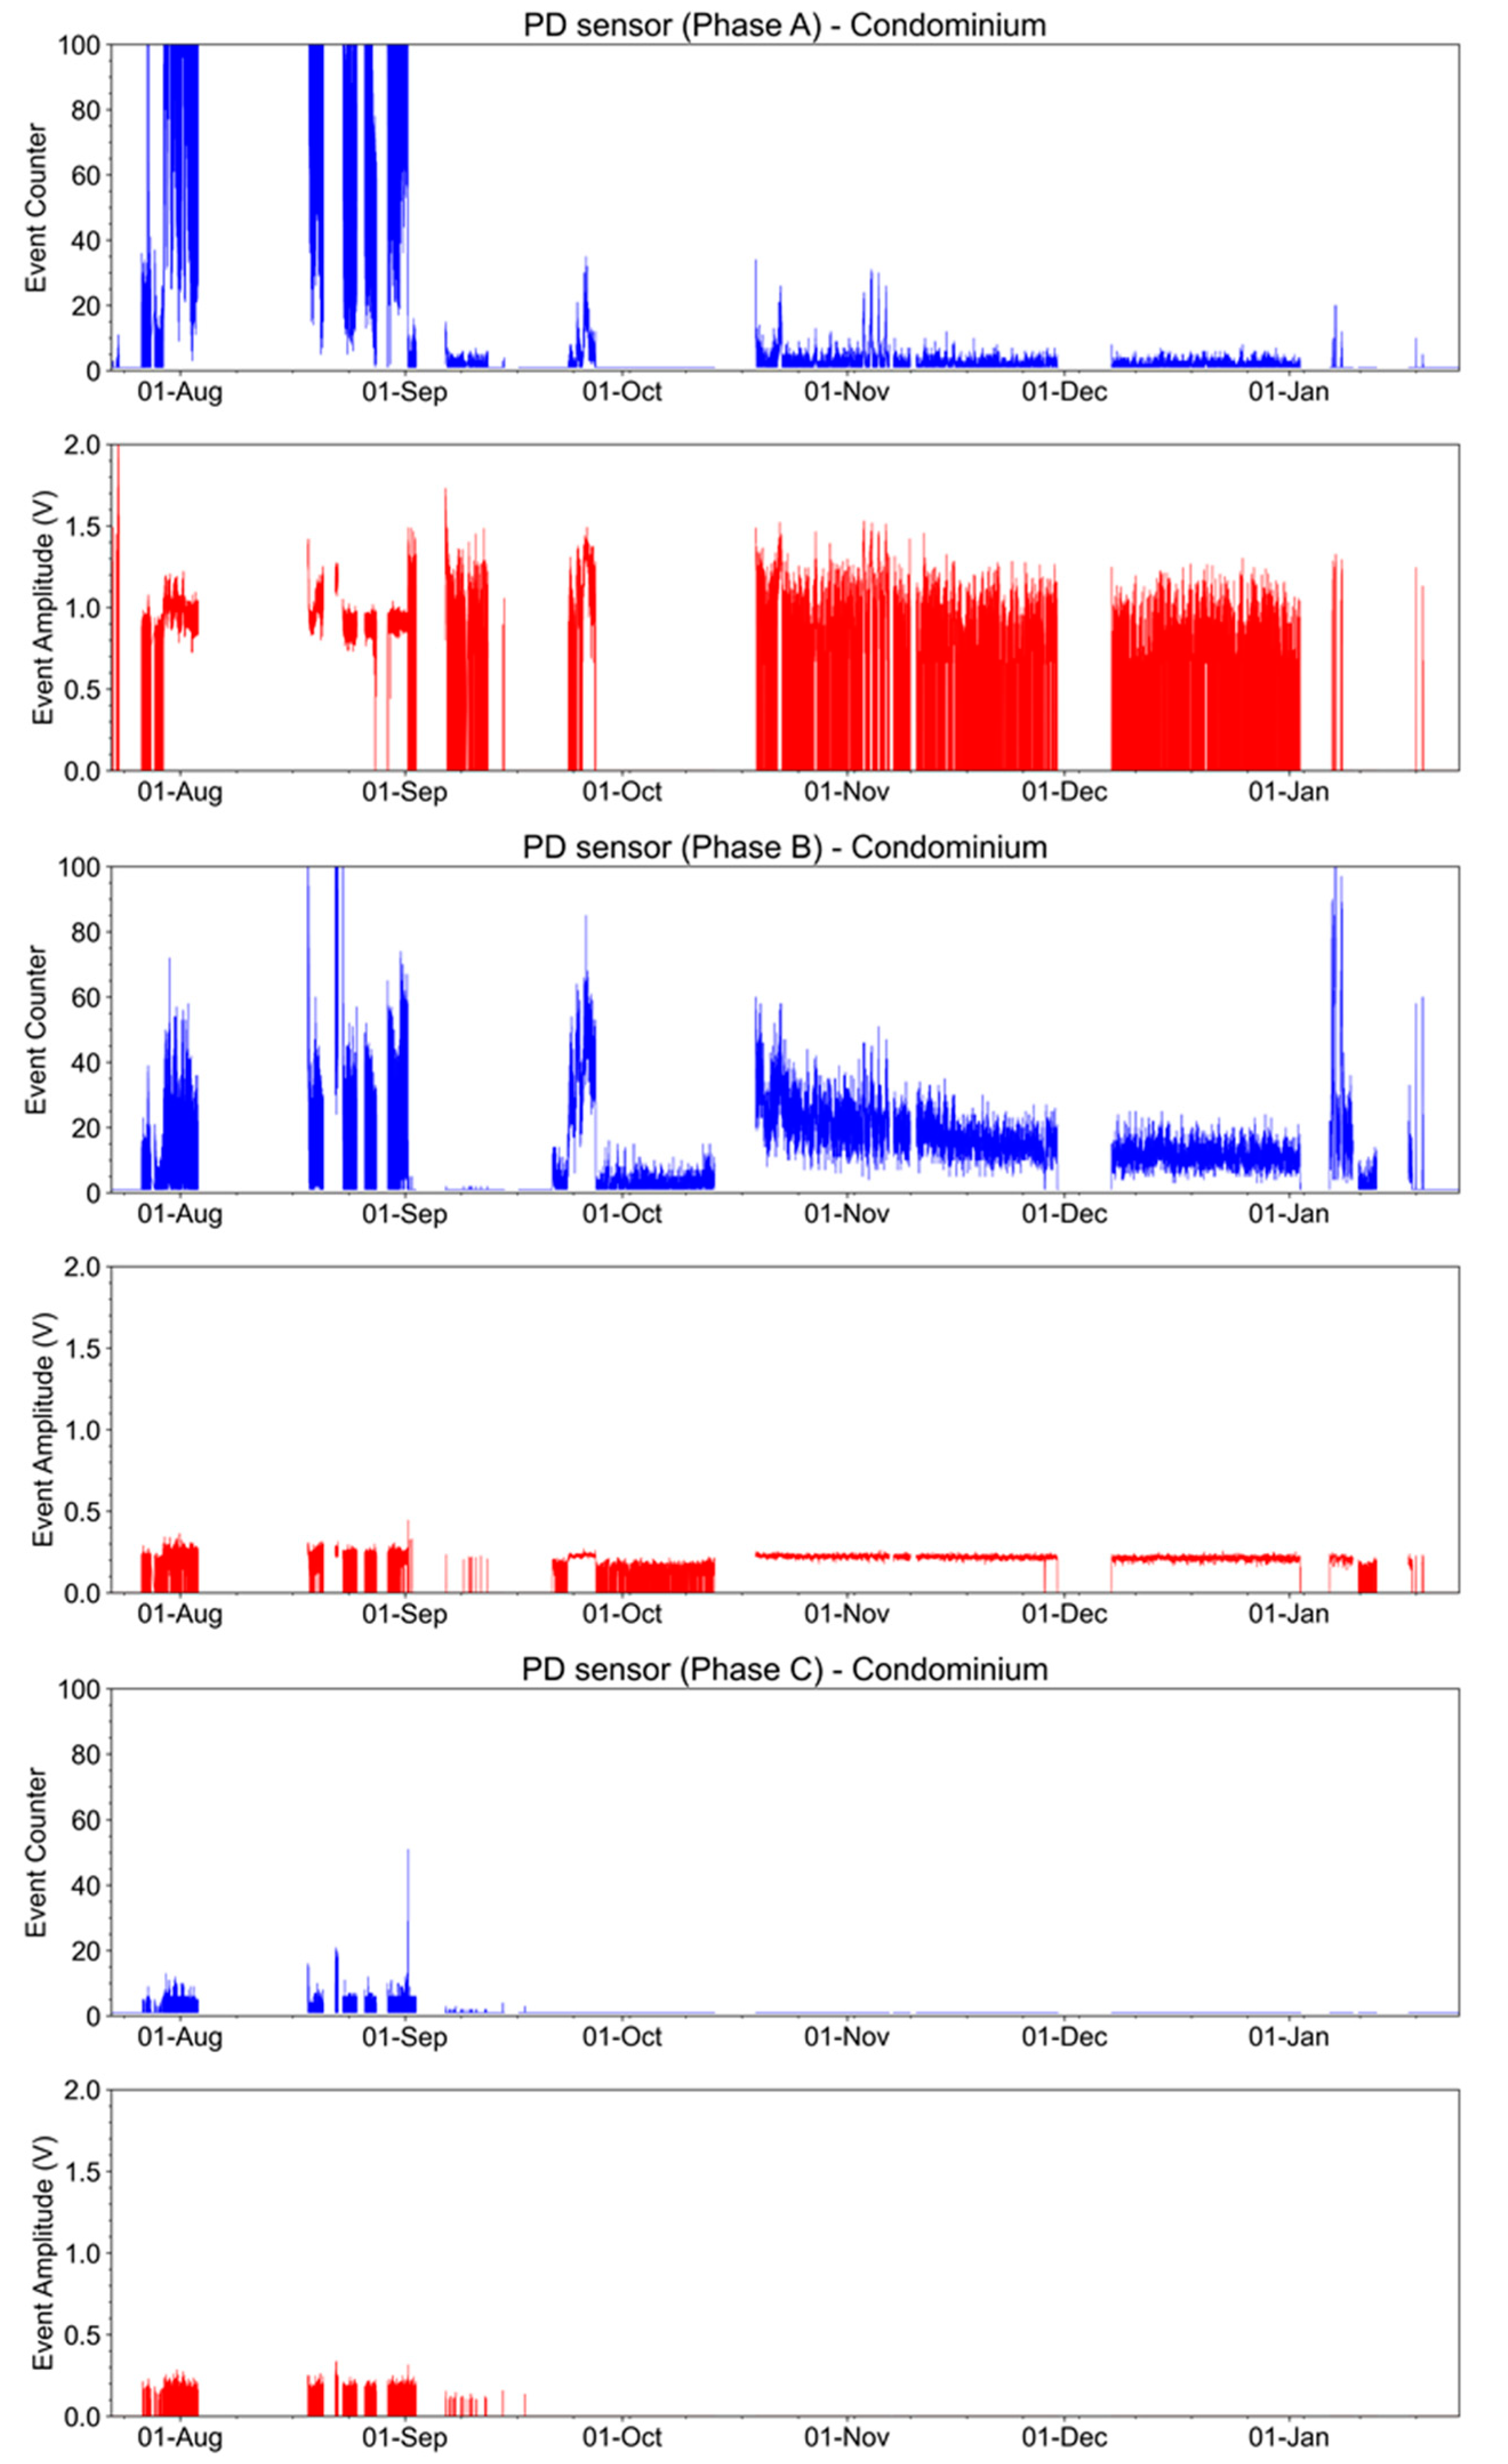
Condominium Underground Distribution Network
4. Discussion
5. Conclusions
- Real-time conductor loading control;
- Real-time transformer loading control;
- Undue intrusion detection;
- Knowledge of submerged points (manholes);
- Knowledge of partial discharge evolution.
Supplementary Materials
Author Contributions
Funding
Institutional Review Board Statement
Informed Consent Statement
Data Availability Statement
Conflicts of Interest
References
- Lyall, S.; Nourbakhsh, G.; Zhao, H.C. Underground power cable environment on-line monitoring and analysis. In Proceedings of the 2000 Power Engineering Society Summer Meeting, Seattle, WA, USA, 16–20 July 2000. [Google Scholar] [CrossRef]
- Nemati, H.; Sant’Anna, A.; Nowaczyk, S. Reliability Evaluation of Underground Power Cables with Probabilistic Models. In Proceedings of the DMIN’15: The 2015 International Conference on Data Mining, Las Vegas, Nevada, USA, 27–30 July 2015; pp. 37–43. [Google Scholar]
- Nakamura, S.; Morooka, S.; Kawasaki, K. Conductor temperature monitoring system in underground power transmission XLPE cable joints. IEEE Trans. Power Deliv. 1992, 7, 1688–1697. [Google Scholar] [CrossRef]
- Mazzanti, G. The Effects of Seasonal Factors on Life and Reliability of High Voltage AC Cables Subjected to Load Cycles. IEEE Trans. Power Deliv. 2020, 35, 2080–2088. [Google Scholar] [CrossRef]
- EPRI. Evaluation of Medium-Voltage Cable Joints: New and Modified Single-Phase Cold Shrink and Separable Connector Cable Joints; EPRI: Palo Alto, CA, USA, 2006; p. 1014439. [Google Scholar]
- Sidhu, T.S.; Xu, Z. Detection and classification of incipient faults in underground cables in distribution systems. In Proceedings of the 2009 Canadian Conference on Electrical and Computer Engineering, St. John’s, NL, Canada, 3–6 May 2009. [Google Scholar] [CrossRef]
- Khan, A.; Malik, M.; Al-Arainy, A.; Alghuwainem, S. A review of condition monitoring of underground power cables. In Proceedings of the 2012 IEEE International Conference on Condition Monitoring and Diagnosis, Bali, Indonesia, 23–27 September 2012; pp. 909–912. [Google Scholar] [CrossRef]
- Aizenberg, I.; Belardi, R.; Bindi, M.; Grasso, F.; Manetti, S.; Luchetta, A.; Piccirilli, M.C. Failure Prevention and Malfunction Localization in Underground Medium Voltage Cables. Energies 2021, 14, 85. [Google Scholar] [CrossRef]
- Zavoda, F.; Rodriguez, E.; Fofeldea, G. Underground and overhead monitoring systems for MV distribution networks. In Proceedings of the 24th International Conference on Electricity Distribution—CIRED, Glasgow, UK, 12–15 June 2017. [Google Scholar]
- Zavoda, F.; Fofeldea, G.; Rodriguez, E. Underground distribution network monitoring so much easier. In Proceedings of the 25th International Conference on Electricity Distribution—CIRED, Madrid, Spain, 3–6 June 2019. [Google Scholar]
- Parejo, A.; Personal, E.; Larios, D.F.; Guerrero, J.I.; García, A.; León, C. Monitoring and Fault Location Sensor Network for Underground Distribution Lines. Sensors 2019, 19, 576. [Google Scholar] [CrossRef]
- Sahoo, R.; Karmakar, S. Health Index Prediction of Underground Cable System using Artificial Neural Network. In Proceedings of the Odisha International Conference on Electrical Power Engineering, Communication and Computing Technology, Bhubaneswar, India, 21 May 2021. [Google Scholar] [CrossRef]
- Hill, K.O.; Meltz, G. Fiber Bragg grating technology fundamentals and overview. J. Light. Technol. 1997, 15, 1263–1276. [Google Scholar] [CrossRef]
- Chen, S.; Wang, J.; Zhang, C.; Li, M.; Li, N.; Wu, H.; Liu, Y.; Peng, W.; Song, Y. Marine Structural Health Monitoring with Optical Fiber Sensors: A Review. Sensors 2023, 23, 1877. [Google Scholar] [CrossRef] [PubMed]
- Akhyurna, S.; Abdellatif, E.; Mousa, A.; Pong, P.W.T. Sensor Technologies for Transmission and Distribution Systems: A Review of the Latest Developments. Energies 2022, 15, 7339. [Google Scholar] [CrossRef]
- Gan, W.; Wang, Y. Application of the distributed optical fiber grating temperature sensing technology in high-voltage cable. In Proceedings of the 2011 International Conference on Electronic & Mechanical Engineering and Information Technology, Harbin, China, 12–14 August 2011; pp. 4538–4541. [Google Scholar] [CrossRef]
- Shi, J. The Research of Power Cable On-line Measurement System Based on Fiber Bragg Grating Sensor. Chem. Eng. Trans. 2016, 51, 1255–1260. [Google Scholar]
- Jie, X.; Li, Z.-B.; Huang, Q.-T.; Liu, C. A new packaged FBG sensor for underground cable temperature monitoring. In Proceedings of the 2017 IEEE 2nd Advanced Information Technology, Electronic and Automation Control Conference (IAEAC), Chongqing, China, 25–26 March 2017; pp. 1789–1793. [Google Scholar]
- Kim, H.; Lee, M.; Jung, W.-S.; Oh, S.-H. Temperature monitoring techniques of power cable joints in underground utility tunnels using a fiber Bragg grating. ICT Express 2022, 8, 626–632. [Google Scholar] [CrossRef]
- Kim, H.; Park, S.; Yeo, C.; Kang, H.S.; Park, H. Thermal analysis of 22.9-kV crosslinked polyethylene cable joint based on partial discharge using fiber Bragg grating sensors. Opt. Eng. 2021, 60, 034101. [Google Scholar] [CrossRef]
- Czaszejko, T.; Sookun, J. Acoustic Emission from Partial Discharges in Cable Termination. In Proceedings of the 2014 International Symposium on Electrical Insulating Materials, Niigata, Japan, 1–5 June 2014. [Google Scholar] [CrossRef]
- Wu, X.; Li, R.; Ni, H.; Ding, P.; Li, X.; Zhou, X.; Cheng, Y.; Yu, H. Integrated Detection of Temperature and Partial Discharge on Cables Based on FBG. In Proceedings of the 2019 2nd International Conference on Electrical Materials and Power Equipment (ICEMPE), Guangzhou, China, 7–10 April 2019. [Google Scholar] [CrossRef]
- Gonçalves, M.N.; Werneck, M.M. Optical Voltage Transformer Based on FBG-PZT for Power Quality Measurement. Sensors 2021, 21, 2699. [Google Scholar] [CrossRef] [PubMed]
- Yasser, E.; Gabbar, H.A. FBG Sensing Technology for an Enhanced Microgrid Performance. Energies 2022, 15, 9273. [Google Scholar] [CrossRef]
- Rosolem, J.B.; Floridia, C.; Sanz, J.P.M. Field and Laboratory Demonstration of a Fiber-Optic/RF Partial Discharges Monitoring System for Hydrogenerators Applications. IEEE Trans. Energy Convers. 2010, 25, 884–890. [Google Scholar] [CrossRef]
- Rosolem, J.B.; Tomiyama, E.K.; Dini, D.C.; Bassan, F.R.; Penze, R.S.; Leonardi, A.A.; Floridia, C.; Fracarolli, J.P.V.; Teixeira, R.M. A fiber optic powered sensor designed for partial discharges monitoring on high voltage bushings. In Proceedings of the 2015 SBMO/IEEE MTT-S International Microwave and Optoelectronics Conference (IMOC), Porto de Galinhas, Brazil, 3–6 November 2015; pp. 1–5. [Google Scholar] [CrossRef]
- Rosolem, J.B.; Hortencio, C.A.; Floridia, C.; Dini, D.C.; Penze, R.S.; Aires, B.N.; Bassan, F.R.; Morbach, R.A.; da Costa, R.F.; Salgado, F.C.; et al. Field trial of a multi-parameters’ monitoring network using FBGs adapted directly in the conventional instruments of dams. In Fiber Optic Sensors and Applications XIII; SPIE: Baltimore, MD, USA, 2016; Volume 98520K. [Google Scholar] [CrossRef]
- Floridia, C.; de Araújo Silva, A.; Batista Rosolem, J.; Renato Bassan, F.; Penze, R.S.; Peres, R.; Coimbra, C.M.; Riboldi, V.B.; de Moraes, M. An Improved Solution for Simultaneous Measurement of Current and Temperature on Terfenol-D FBG Optical Sensor. IEEE Sens. J. 2022, 22, 357–364. [Google Scholar] [CrossRef]
- NBR 14039; Medium Voltage Electrical Installations from 1.0 kV to 36.2 kV. Third Edition. Brazilian Association of Technical Standards: Rio de Janeiro, Brazil, 3 December 2021. (In Portuguese)
- IEC 61936-1:2002; Power Installations Exceeding 1 kV a.c.—Part 1: Common Rules. International Electrotechnical Commission: Geneva, Switzerland, 2002.
- NF C13-200; High voltage electrical installations—Additional rules for production sites and industrial, commercial and agricultural installations. Afnor: Paris, France, 2009.


| Interrogator Channel | Sensor | Installation Place | Reference Wavelength (nm) |
|---|---|---|---|
| 1 | Temperature FBG Array (50 FBG, 2 m space) | CI-2/15 → CD-12 | 1500.5–1598.5 |
| 2 | Temperature FBG Array (50 FBG, 2 m space) | CI-2/15 → S2-31 | 1500.5–1598.5 |
| 3 | Liquid Level | CI-2/15 | 1511.5 |
| 3 | Intrusion | CI-2/15 | 1555 |
| 3 | PD-LD Phase 1 | CI-2/15 | 1470 |
| 3 | PD-LD Phase 2 | CI-2/15 | 1490 |
| 3 | PD-LD Phase 3 | CI-2/15 | 1610 |
| 4 | Temperature | TR1 | 1524 |
| 4 | Current Phase 1 | TR1 | 1556 |
| 4 | Current Phase 2 | TR1 | 1558 |
| 4 | Current Phase 3 | TR1 | 1568 |
| Interrogator Channel | Sensor | Installation Place | Reference Wavelength (nm) |
|---|---|---|---|
| 1 | Temperature FBG Array (50 FBG, 2 m space) | TR1 → CP1 | 1500.5–1598.5 |
| 2 | Temperature FBG Array (50 FBG, 2 m space) | TR1 → TR2 | 1500.5–1598.5 |
| 3 | Liquid Level | CP2 | 1539.5 |
| 3 | Intrusion | CP2 | 1530 |
| 4 | Temperature | TR1 | 1526.5 |
| 4 | Current Phase 1 | TR1 | 1560 |
| 4 | Current Phase 2 | TR1 | 1562 |
| 4 | Current Phase 3 | TR1 | 1571 |
| RX PD-LD 1 | PD-LD Phase 1 | TR1 | 1470 |
| RX PD-LD 2 | PD-LD Phase 2 | TR1 | 1490 |
| RX PD-LD 3 | PD-LD Phase 3 | TR1 | 1610 |
| FBG Array 1 | FBG Array 2 | |
|---|---|---|
| Interrogator channel | Channel 1 | Channel 2 |
| Monitoring path | CI-2/15–CD-14–CD-13–CD-12 * | Trafo 1–CP3–Trafo 2 ** |
| FBG spatial distance | 2 m | 2 m |
| Spectral window | 1500–1600 nm | 1500–1600 nm |
| FBG Array 1 | FBG Array 2 | |
|---|---|---|
| Interrogator channel | Channel 1 | Channel 2 |
| Monitoring path | CP1–CP2–Trafo 1 * | Trafo 1–CP3–Trafo 2 ** |
| FBG spatial distance | 2 m | 2 m |
| Spectral window | 1500–1600 nm | 1500–1600 nm |
| FBG inside cable duct | 50 |
Disclaimer/Publisher’s Note: The statements, opinions and data contained in all publications are solely those of the individual author(s) and contributor(s) and not of MDPI and/or the editor(s). MDPI and/or the editor(s) disclaim responsibility for any injury to people or property resulting from any ideas, methods, instructions or products referred to in the content. |
© 2023 by the authors. Licensee MDPI, Basel, Switzerland. This article is an open access article distributed under the terms and conditions of the Creative Commons Attribution (CC BY) license (https://creativecommons.org/licenses/by/4.0/).
Share and Cite
Bassan, F.R.; Rosolem, J.B.; Floridia, C.; Penze, R.S.; Aires, B.N.; Roncolatto, R.A.; Peres, R.; Júnior, J.R.N.; Fracarolli, J.P.V.; da Costa, E.F.; et al. Multi-Parameter Optical Monitoring Solution Applied to Underground Medium-Voltage Electric Power Distribution Networks. Sensors 2023, 23, 5066. https://doi.org/10.3390/s23115066
Bassan FR, Rosolem JB, Floridia C, Penze RS, Aires BN, Roncolatto RA, Peres R, Júnior JRN, Fracarolli JPV, da Costa EF, et al. Multi-Parameter Optical Monitoring Solution Applied to Underground Medium-Voltage Electric Power Distribution Networks. Sensors. 2023; 23(11):5066. https://doi.org/10.3390/s23115066
Chicago/Turabian StyleBassan, Fabio R., Joao B. Rosolem, Claudio Floridia, Rivael S. Penze, Bruno N. Aires, Ronaldo A. Roncolatto, Rodrigo Peres, João R. Nogueira Júnior, João Paulo V. Fracarolli, Eduardo F. da Costa, and et al. 2023. "Multi-Parameter Optical Monitoring Solution Applied to Underground Medium-Voltage Electric Power Distribution Networks" Sensors 23, no. 11: 5066. https://doi.org/10.3390/s23115066