
Error Analysis of Narrowband Power-Line Communication in the Off-Grid Electrical System

 , , ,
, , ,  ,
, 
Abstract
:1. Introduction
1.1. Current Research
1.2. Motivation of Research
2. Research Objectives
- Demonstration of the influence of the appliance or combination of appliances on the investigated communication parameters;
- Finding a means to improve the resilience of the PLC communication itself in the off-grid system environment;
- Implementation of communication between the appliances themselves so that they interact with each other regarding the electricity consumption (future work of the authors team).
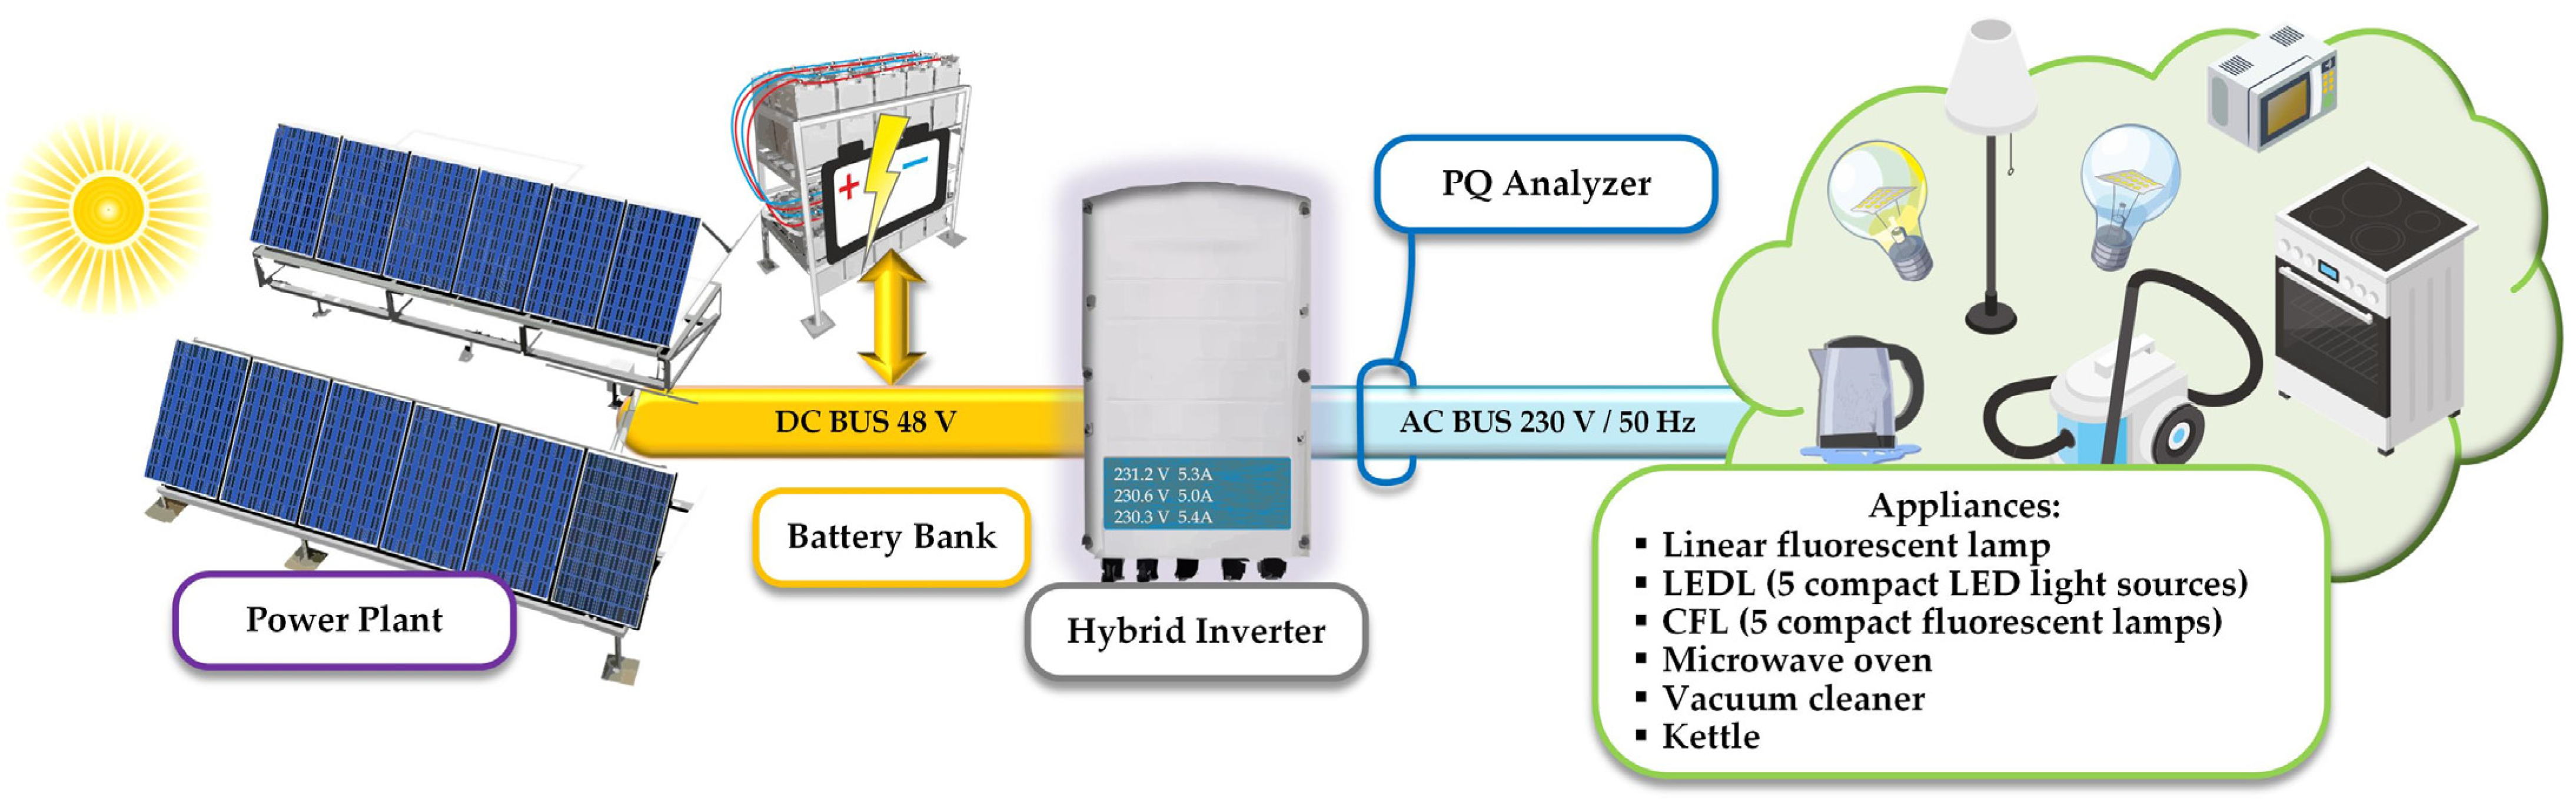
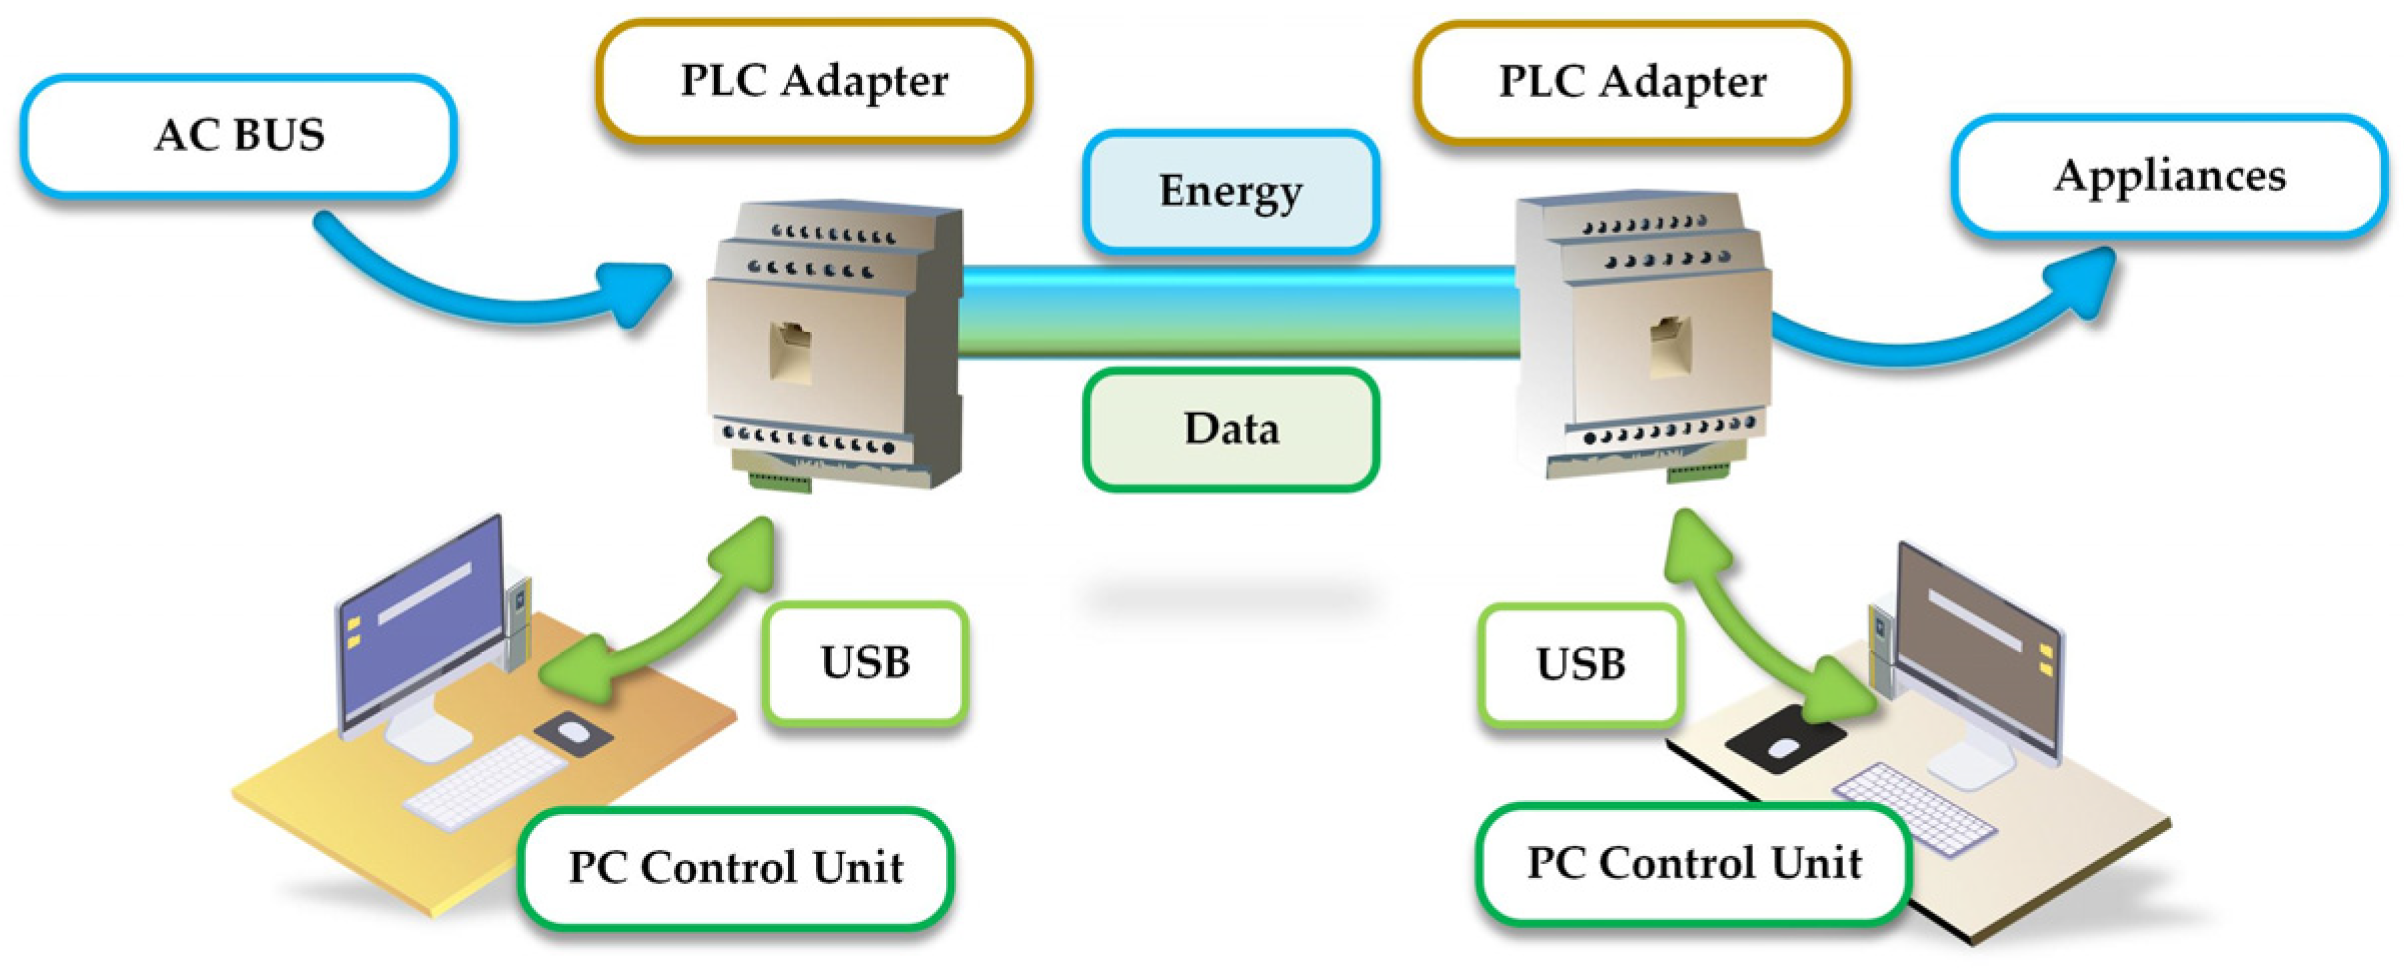
3. Description of the Measurement Platform
Description of Experiment
4. Results of the Research
5. Discussion
6. Conclusions
- Without a connected appliance, the FER value was 0. The communication was therefore error-free. It can be stated that the interference of the hybrid converter without load does not affect the communication;
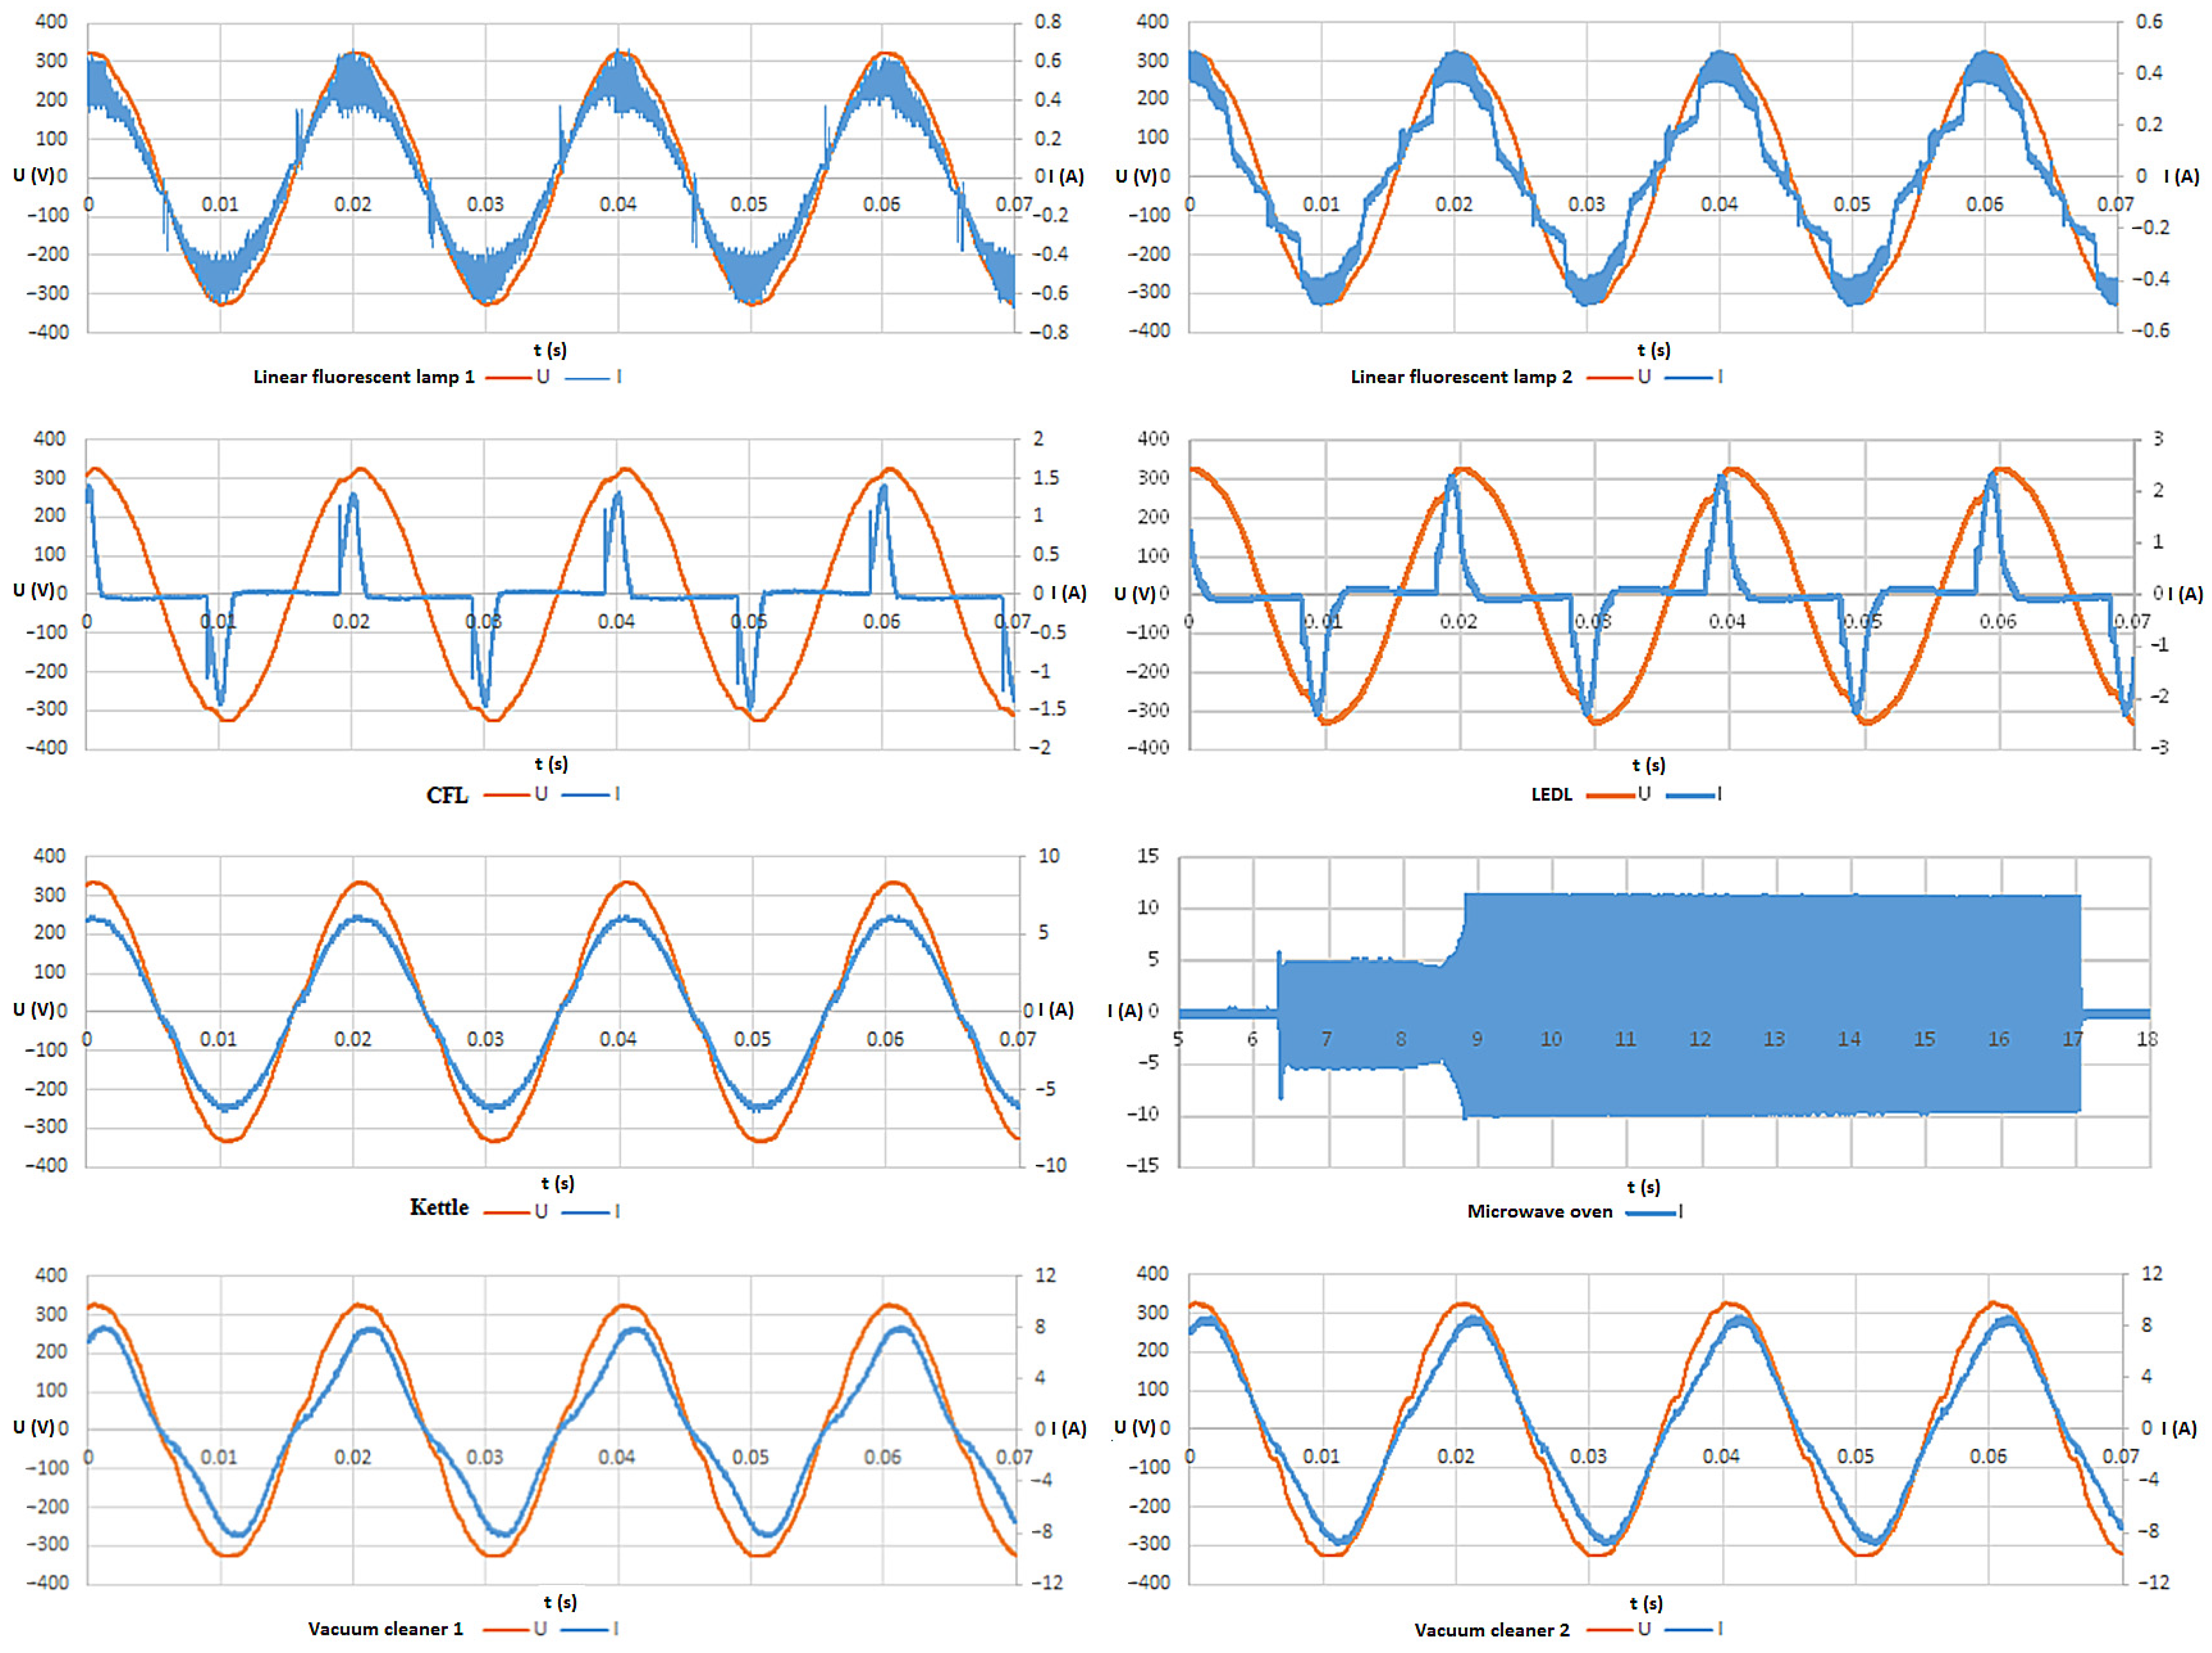
- The applied linear fluorescent lamp 1 has a major effect on the PLC communication, the FER value reached the level of 75.39%. While using linear fluorescent lamp 2 caused the FER value of 0. It can be stated that the selection of low-quality linear fluorescent lamps can cause potential communication problems;
- An older vacuum cleaner 1 has better FER values than a newer vacuum cleaner 2. This is due to the different electronic design of the vacuum cleaner;
- The microwave affects PLC communication. This is due to the cyclic switching of the inductive load;
- The combination of LEDL and linear fluorescent lamp 1 has a positive effect on PLC communication. From the experiment, it can be stated that some combinations of appliances have a positive effect on the durability of the PLC;
- Combinations of some appliances, on the other hand, have a negative effect on PLC communication. In the experiment, these combinations of linear fluorescent lamp 1 + vacuum cleaner 1, linear fluorescent lamp 1 + microwave oven were tested, and the worst combination appeared to be that of linear fluorescent lamp 1 + kettle;
- ROBO modulation has a major impact on improving the FER parameter and thus on the PLC communication. The difference is especially noticeable for the appliance combinations where the FER value is high;
- PLC communication with the Notch filter leads to an FER value of 0 for all appliance combinations. The correct setting of the notch filter leads to a robust communication solution with narrowband power-Line communication in the off-grid electrical system.
Author Contributions
Funding
Institutional Review Board Statement
Informed Consent Statement
Data Availability Statement
Conflicts of Interest
References
- Wu, N.E.; Sarailoo, M.; Salman, M. Transmission Fault Diagnosis with Sensor-Localized Filter Models for Complexity Reduction. IEEE Trans. Smart Grid 2018, 9, 6939–6950. [Google Scholar] [CrossRef]
- Lisowski, M.; Masnicki, R.; Mindykowski, J. PLC-Enabled Low Voltage Distribution Network Topology Monitoring. IEEE Trans. Smart Grid 2019, 10, 6436–6448. [Google Scholar] [CrossRef]
- Chen, C.; Chen, Y.; Ding, N.; Wang, Y.; Lin, J.-C.; Zeng, X.; Huang, D. Accurate Sampling Timing Acquisition for Baseband OFDM Power-Line Communication in Non-Gaussian Noise. IEEE Trans. Commun. 2013, 61, 1608–1620. [Google Scholar] [CrossRef] [Green Version]
- Shlezinger, N.; Dabora, R. Frequency-Shift Filtering for OFDM Signal Recovery in Narrowband Power Line Communications. IEEE Trans. Commun. 2014, 62, 1283–1295. [Google Scholar] [CrossRef] [Green Version]
- Shlezinger, N.; Dabora, R. On the Capacity of Narrowband PLC Channels. IEEE Trans. Commun. 2015, 63, 1191–1201. [Google Scholar] [CrossRef] [Green Version]
- Ahola, J. Applicability of Power-Line Communications to Data Transfer of Online Condition Monitoring of Electrical Drives. Ph.D. Thesis, Lappeenranta University of Technology, Lappeenranta, Finland, 2003. [Google Scholar]
- Windelspecht, M. Groundbreaking Scientific Experiments, Inventions, and Discoveries of the 19th Century, 1st ed.; Greenwood Press: Westport, CT, USA, 2003. [Google Scholar]
- Brown, P.A. Power Line Communications-Past, Present, and Future. In Proceedings of the International Symposium on Power-line Communications and its Applications (ISPLC ‘99), Lancaster, UK, 30 March–1 April 1999; pp. 1–8. [Google Scholar]
- Doster, K.M. Telecommunications over the Power Distribution Grid—Possibilities and Limitations. In Proceedings of the IEEE International Symposium on Power Line Communications and Its Applications, (ISPLC ‘97), Essen, Germany, 2–4 April 1997; pp. 1–9. [Google Scholar]
- Dzung, D.; von Hoff, T.; Stoupis, J.; Kranich, M. Connected, the Nervous System of the Smart Grid; ABB Corporate Management Services AG: Zürich, Switzerland, 2010. [Google Scholar]
- Dzung, D.; Berganza, I.; Sendin, A. Evolution of Powerline Communications for Smart Distribution: From Ripple Control to OFDM. In Proceedings of the 2011 IEEE International Symposium on Power Line Communications and Its Applications, Udine, Italy, 3–6 April 2011; IEEE: Piscataway, NJ, USA, 2011; pp. 474–478. [Google Scholar]
- Morgan, M.G.; Talukdar, S.N. Electric Power Load Management: Some Technical, Economic, Regulatory and Social Issues. Proc. IEEE 1979, 67, 241–312. [Google Scholar] [CrossRef]
- Rye Dave X10 Technology, Hometoys Inc. 1 October 1999. Available online: https://hometoys.com/dave-rye-x10/ (accessed on 20 February 2022).
- Fritz, R. Is X-10 an Obsolete Technology? There Are Better and Newer Technologies to Use. Lifewire. 2019. Available online: https://www.lifewire.com/is-x-10-obsolete-818408 (accessed on 20 February 2022).
- Telecommunication Standardization Sector of ITU. Narrowband Orthogonal Frequency Division Multiplexing Power Line Communication Transceivers for G3-PLC Networks; International Telecommunication Union: Geneva, Switzerland, 2014. [Google Scholar]
- Berganza, I.; Bois, S.; Brunschweiler, A.; PRIME Alliance Technical Working Group. PRIMEv1.4 White Paper. 2014. Available online: https://www.prime-alliance.org/wp-content/uploads/2020/04/whitePaperPrimeV1p4_final.pdf (accessed on 20 February 2022).
- Casella, I.R.; Anpalagan, A. (Eds.) Power Line Communication Systems for Smart Grids; Institution of Engineering and Technology: Stevenage, UK, 2018; ISBN 9781785615504. [Google Scholar]
- Hooijen, O.G. On the Channel Capacity of the Residential Power Circuit Used as a Digital Communications Medium. IEEE Commun. Lett. 1998, 2, 267–268. [Google Scholar] [CrossRef]
- Berger, L.T.; Schwager, A.; Escudero-Garzás, J.J. Power Line Communications for Smart Grid Applications. J. Electr. Comput. Eng. 2013, 2013, 712376. [Google Scholar] [CrossRef] [Green Version]
- Larsson, E.O.A.; Bollen, M.H.J. Measurement Result from 1 to 48 Fluorescent Lamps in the Frequency Range 2 to 150 KHz. In Proceedings of the 14th International Conference on Harmonics and Quality of Power—ICHQP 2010, Bergamo, Italy, 26–29 September 2010; IEEE: Piscataway, NJ, USA, 2010; pp. 1–8. [Google Scholar]
- Hoch, M. Comparison of PLC G3 and PRIME. In Proceedings of the 2011 IEEE International Symposium on Power Line Communications and Its Applications, Udine, Italy, 3–6 April 2011; IEEE: Piscataway, NJ, USA, 2011; pp. 165–169. [Google Scholar]
- Mlynek, P.; Koutny, M.; Misurec, J.; Kolka, Z. Measurements and Evaluation of PLC Modem with G3 and PRIME Standards for Street Lighting Control. In Proceedings of the 18th IEEE International Symposium on Power Line Communications and Its Applications, Glasgow, UK, 30 March–2 April 2014; IEEE: Piscataway, NJ, USA, 2014; pp. 238–243. [Google Scholar]
- Sadowski, Z. Comparison of PLC-PRIME and PLC-G3 Protocols. In Proceedings of the 2015 International School on Nonsinusoidal Currents and Compensation (ISNCC), Lagow, Poland, 15–18 June 2015; IEEE: Piscataway, NJ, USA, 2015; pp. 1–6. [Google Scholar]
- Cortés, J.A.; Sanz, A.; Estopiñán, P.; García, J.I. Analysis of Narrowband Power Line Communication Channels for Advanced Metering Infrastructure. EURASIP J. Adv. Signal Process. 2015, 2015, 27. [Google Scholar] [CrossRef] [Green Version]
- Kharraz, M.A.O.; Lavenu, C.; Jensen, P.; Picard, D.; Serhir, M. Characterization of the Input Impedance of Household Appliances in the FCC Frequency Band. In Proceedings of the 2017 IEEE International Symposium on Power Line Communications and its Applications (ISPLC), Madrid, Spain, 3–5 April 2017; IEEE: Piscataway, NJ, USA, 2017; pp. 1–6. [Google Scholar]
- Ronnberg, S.K.; Bollen, M.H.J.; Wahlberg, M. Interaction Between Narrowband Power-Line Communication and End-User Equipment. IEEE Trans. Power Deliv. 2011, 26, 2034–2039. [Google Scholar] [CrossRef]
- Ronnberg, S.K.; Wahlberg, M.; Larsson, E.O.A.; Bollen, M.H.J.; Lundmark, C.M. Interaction between Equipment and Power Line Communication: 9–95 KHz. In Proceedings of the 2009 IEEE Bucharest PowerTech, Bucharest, Romania, 28 June–2 July 2009; IEEE: Piscataway, NJ, USA, 2009; pp. 1–5. [Google Scholar]
- Zezulka, F.; Fiedler, P.; Bradáč, Z.; Šír, M. Trends in Automation—Investigation in Network Control Systems and Sensor Networks; Salezian University Gliwice: Gliwice, Poland, 2010. [Google Scholar]
- Zezulka, F.; Bradáč, Z.; Sajdl, O.; Šembera, J. Experimental Smart Grid. IFAC Proc. Vol. 2012, 45, 416–419. [Google Scholar] [CrossRef]
- Kaczmarczyk, V.; Bradac, Z.; Fiedler, P. A Heuristic Algorithm to Compute Multimodal Criterial Function Weights for Demand Management in Residential Areas. Energies 2017, 10, 1049. [Google Scholar] [CrossRef] [Green Version]
- Da Rocha Farias, L.; Monteiro, L.; Leme, M.; Stevan, S. Empirical Analysis of the Communication in Industrial Environment Based on G3-Power Line Communication and Influences from Electrical Grid. Electronics 2018, 7, 194. [Google Scholar] [CrossRef] [Green Version]
- Blazek, V.; Petruzela, M.; Vysocky, J.; Prokop, L.; Misak, S.; Seidl, D. Concept of Real-Time Communication in Off-Grid System with Vehicle-to-Home Technology. In Proceedings of the 2020 21st International Scientific Conference on Electric Power Engineering (EPE), Prague, Czech Republic, 19–21 October 2020; IEEE: Piscataway, NJ, USA, 2020; pp. 1–6. [Google Scholar]
- Blazek, V.; Petruzela, M.; Vantuch, T.; Slanina, Z.; Mišák, S.; Walendziuk, W. The Estimation of the Influence of Household Appliances on the Power Quality in a Microgrid System. Energies 2020, 13, 4323. [Google Scholar] [CrossRef]
- Mišák, S.; Stuchlý, J.; Platoš, J.; Krömer, P. A Heuristic Approach to Active Demand Side Management in Off-Grid Systems Operated in a Smart-Grid Environment. Energy Build. 2015, 96, 272–284. [Google Scholar] [CrossRef]
- Vantuch, T.; Misak, S.; Jezowicz, T.; Burianek, T.; Snasel, V. The Power Quality Forecasting Model for Off-Grid System Supported by Multiobjective Optimization. IEEE Trans. Ind. Electron. 2017, 64, 9507–9516. [Google Scholar] [CrossRef]
- Yu, D.; Li, K.; Yu, S.; Trinh, H.; Zhang, P.; Oo, A.M.T.; Hu, Y. A Novel Power and Signal Composite Modulation Approach to Powerline Data Communication for SRM in Distributed Power Grids. IEEE Trans. Power Electron. 2021, 36, 10436–10446. [Google Scholar] [CrossRef]
- Ikpehai, A.; Adebisi, B.; Rabie, K.; Haggar, R.; Baker, M. Experimental Study of 6LoPLC for Home Energy Management Systems. Energies 2016, 9, 1046. [Google Scholar] [CrossRef] [Green Version]
- Ali, K.; Liu, A.X.; Pefkianakis, I.; Kim, K.-H. Distributed Spectrum Sharing for Enterprise Powerline Communication Networks. In Proceedings of the 2018 IEEE 26th International Conference on Network Protocols (ICNP), Cambridge, UK, 25–27 September 2008; IEEE: Piscataway, NJ, USA, 2018; pp. 367–377. [Google Scholar]
- Wasowski, M.; Sikorski, T.; Wisniewski, G.; Kostyla, P.; Szymanda, J.; Habrych, M.; Gornicki, L.; Sokol, J.; Jurczyk, M. The Impact of Supply Voltage Waveform Distortion on Non-Intentional Emission in the Frequency Range 2–150 KHz: An Experimental Study with Power-Line Communication and Selected End-User Equipment. Energies 2021, 14, 777. [Google Scholar] [CrossRef]
- Sausen, P.S.; Sausen, A.; de Campos, M.; Sauthier, L.F.; Oliveira, A.C.; Emmel Junior, R.R. Power Line Communication Applied in a Typical Brazilian Urban Power Network. IEEE Access 2021, 9, 72844–72856. [Google Scholar] [CrossRef]
- Electricite Reseau Distribution France. G3-PLC Physical Layer Specificatio; Electricite Reseau Distribution France: Paris, France, 2009. [Google Scholar]


| Parameters | Type, Value |
|---|---|
| Modulation schemes | Coherent or differential |
| Modulation types | Robust BPSK, BPSK, QPSK, or 8PSK |
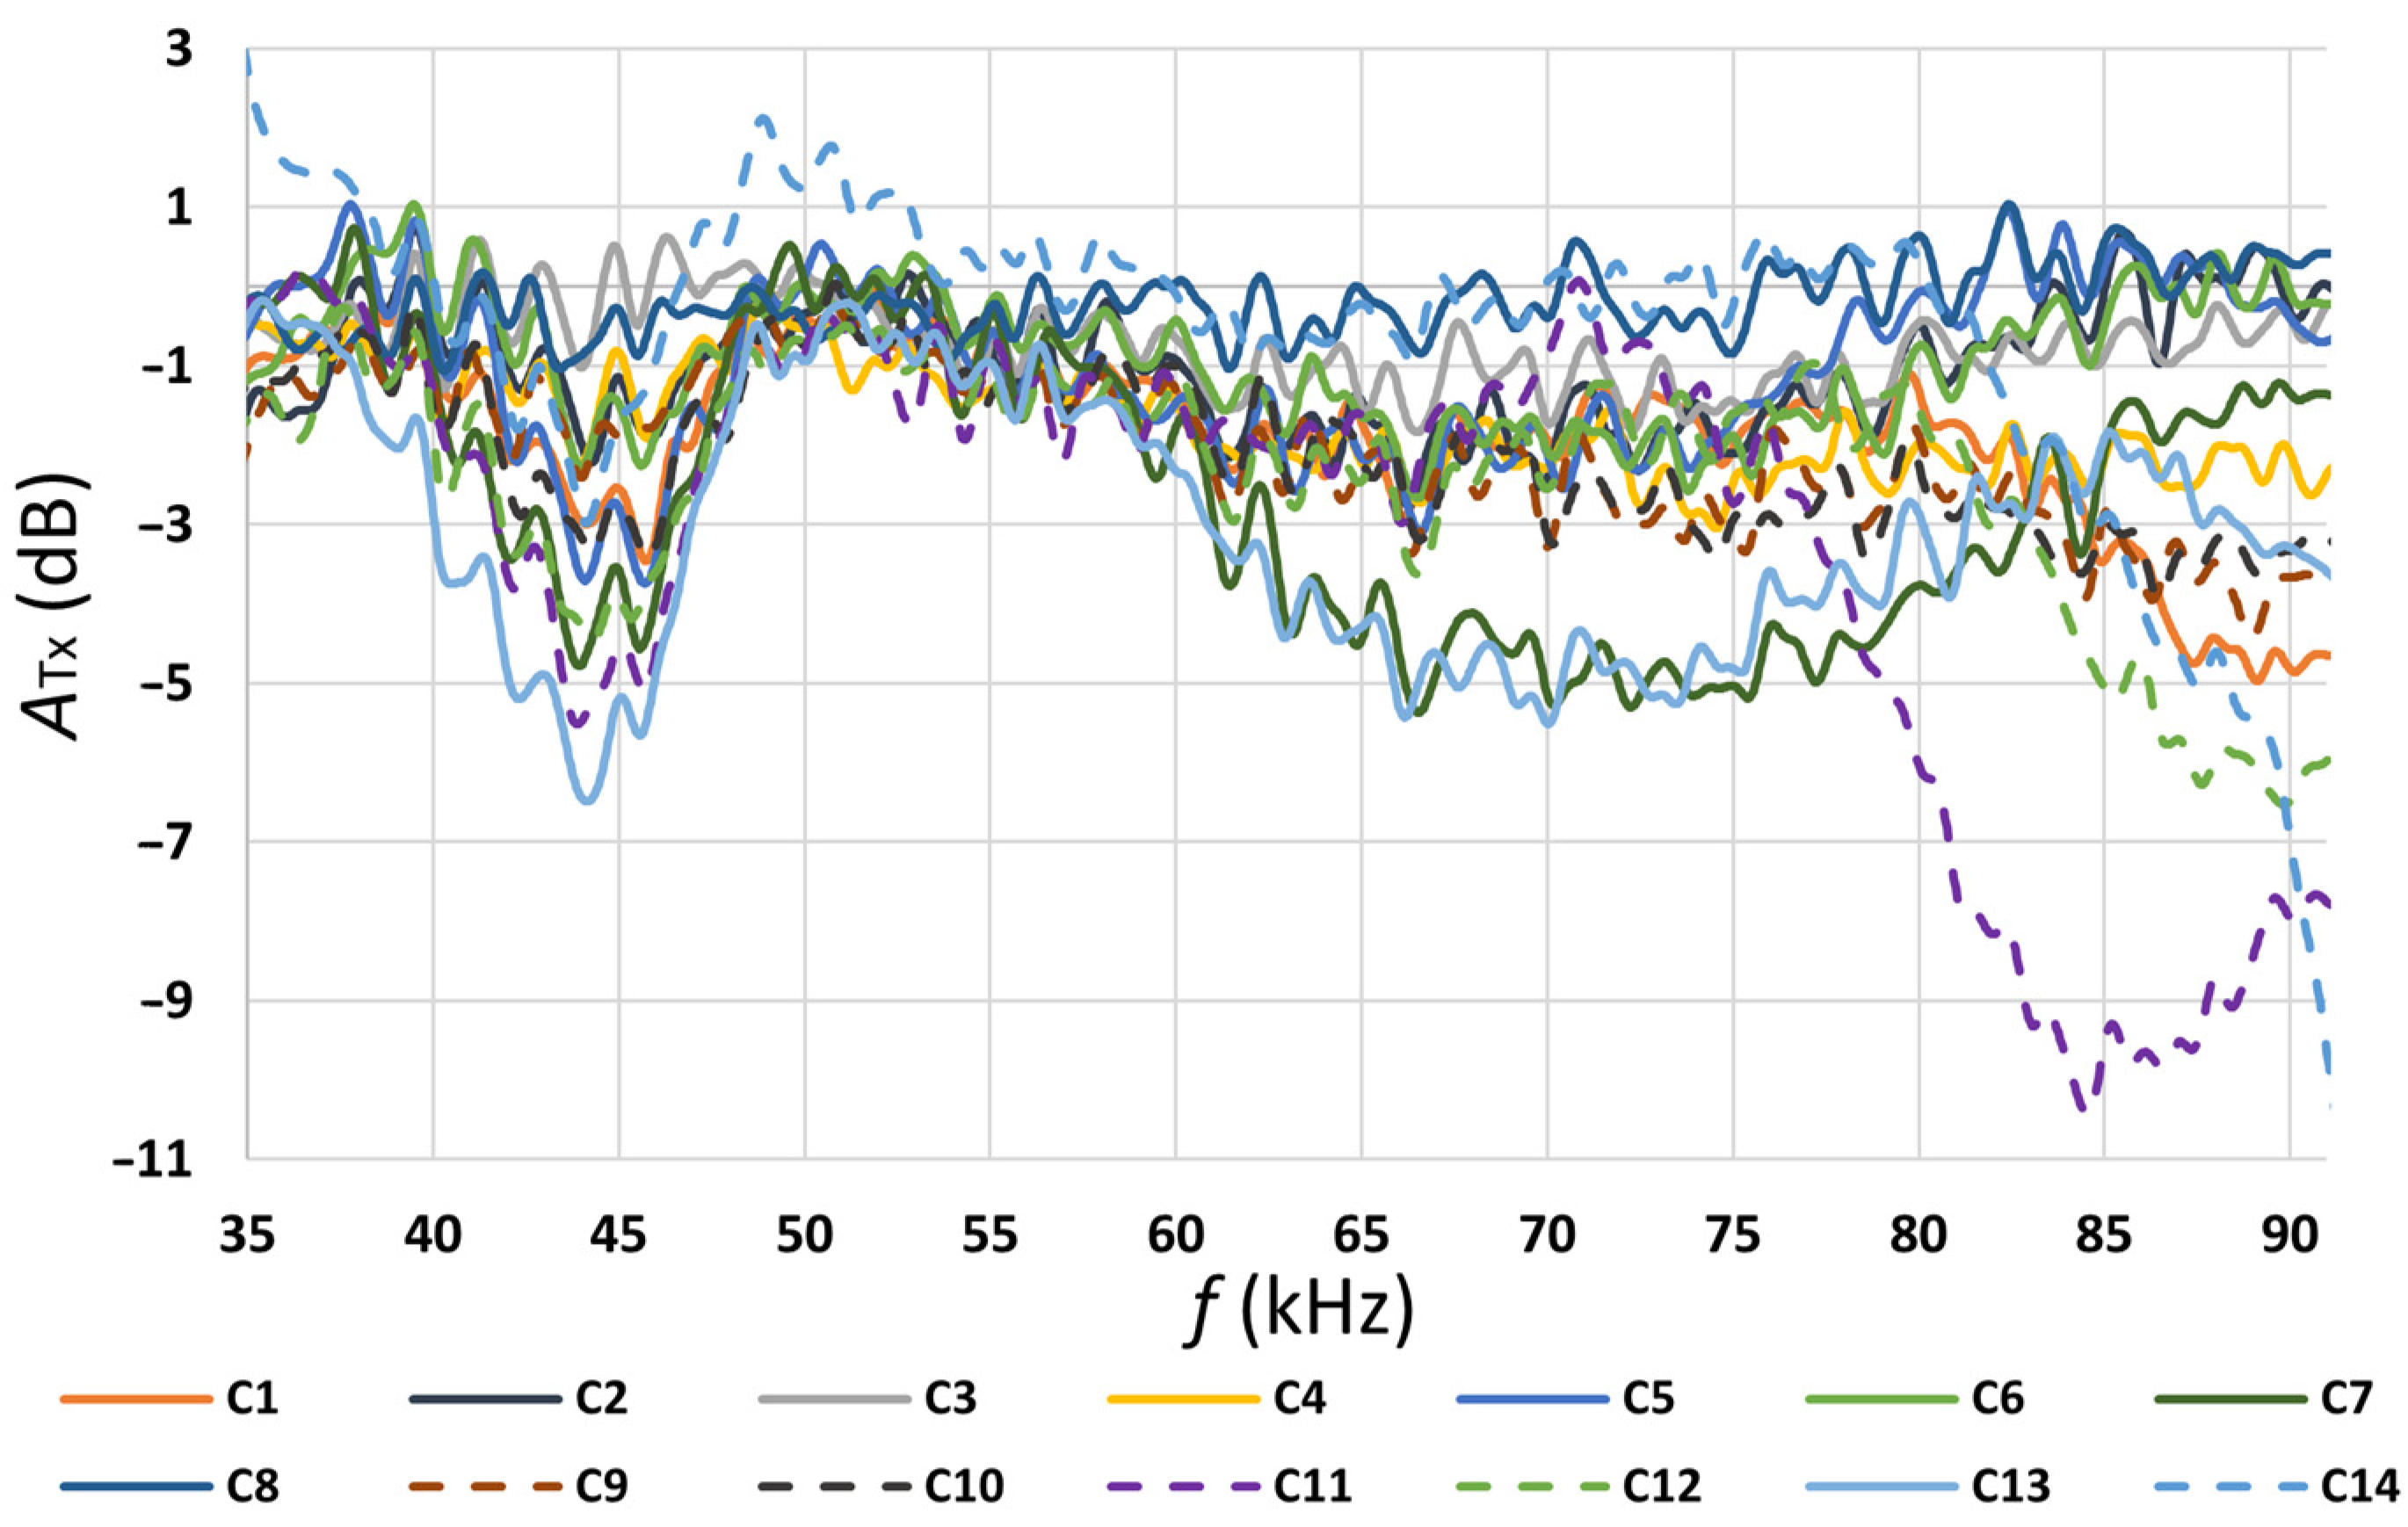
| 1st subcarrier | 35.9 kHz |
| Last subcarrier | 90.6 kHz |
| Subcarrier spacing | 1.562 kHz |
| Number of subcarriers | 36 |
| Sub-bands | 6 |
| Error encoding decoding | Viterbi, Reed Solomon, convolution, or CRC16 |
| Appliance | Load (VA) | Power Factor (-) | Appliance Type | EMC Filter | ||||
|---|---|---|---|---|---|---|---|---|
| Avg | Min | Max | Avg | Min | Max | |||
| Linear fluorescent lamp 1 | 67.1 | 63.4 | 70.3 | 0.992 | 0.991 | 0.993 | Load with electrical choke | Yes |
| Linear fluorescent lamp 2 | 65.5 | 64.9 | 65.9 | 0.969 | 0.967 | 0.970 | Load with electrical choke | Yes |
| LEDL (5 pieces) | 78.8 | 79.8 | 80.6 | 0.494 | 0.487 | 0.501 | Switched-mode-power-supply load | Yes |
| CFL (5 pieces) | 81.1 | 80.5 | 81.8 | 0.546 | 0.538 | 0.551 | Electronic-ballast load | Yes |
| Microwave oven | 692.7 | 42.7 | 1312.3 | 0.806 | 0.232 | 0.95 | Switched resistive load | Yes |
| Vacuum cleaner 1 (2015) | 993.0 | 973.5 | 1032.4 | 0.985 | 0.981 | 0.985 | Load with universal electrical motor | Yes |
| Vacuum cleaner 2 (2008) | 1183.3 | 1123.5 | 1201.5 | 0.991 | 0.985 | 0.992 | Load with universal electrical motor | Yes |
| Kettle | 1053 | 1048 | 1062 | 0.995 | 0.994 | 0.996 | Resistive load | No |
| Parameters | 1st (Normal) | 2nd (Robust) | 3rd (Notch Filter) |
|---|---|---|---|
| Modulation type | BPSK | ROBO | BPSK |
| Modulation scheme | Differential | Differential | Differential |
| Tone map | 0x3F | 0x3F | 0x3F |
| Transmission interval | 100 ms | 100 ms | 100 ms |
| Number of frames | 1000 | 1000 | 1000 |
| Number of frame characters | 65 | 65 | 65 |
| Effective baud rate (peak) | 15,296 kbps | 5181 kbps | 15,296 kbps |
| Effective baud rate (real) | 7810 kbps | 4690 kbps | 7810 kbps |
| Notch filter | No | No | Yes |
| Combination | Appliance | Group (Combo) | FER (%) | LQI Med (dB) | LQI SD (dB) | LQI IQR/LQI SD |
|---|---|---|---|---|---|---|
| C0 | No appliance (no-load state) | - | 0.00 | 10.75 | 3.78 | 0.595 |
| C1 | Linear fluorescent lamp 1 | 1 | 75.39 | 8.75 | 1.15 | 0.870 |
| C2 | Linear fluorescent lamp 2 | 3 | 0.00 | 6.75 | 0.89 | 1.124 |
| C3 | LEDL | 2 | 0.00 | 4.00 | 5.64 | 1.95 |
| C4 | CFL | 2 | 0.00 | 5.25 | 3.40 | 1.103 |
| C5 | Vacuum cleaner 1 | 1 | 73.00 | 11.25 | 1.67 | 1.048 |
| C6 | Vacuum cleaner 2 | 3 | 0.25 | 14.5 | 0.54 | 1.389 |
| C7 | Microwave oven | 1 | 8.88 | 9.25 | 2.23 | 2.018 |
| C8 | Kettle | 3 | 0.71 | 12.5 | 0.63 | 1.587 |
| C9 | Linear fluorescent lamp 1 + LEDL | 1 + 2 | 7.54 | 5.00 | 2.35 | 0.957 |
| C10 | Linear fluorescent lamp 1 + CFL | 1 + 2 | 0.00 | 6.75 | 1.20 | 1.042 |
| C11 | Linear fluorescent lamp 1 + vacuum cleaner 1 | 1 + 1 | 87.28 | 13.75 | 1.57 | 1.433 |
| C12 | Linear fluorescent lamp 1 + vacuum cleaner 2 | 1 + 3 | 0.00 | 14.51 | 0.74 | 0.676 |
| C13 | Linear fluorescent lamp 1 + microwave oven | 1 + 1 | 84.06 | 9.75 | 2.21 | 1.131 |
| C14 | Linear fluorescent lamp 1 + kettle | 1 + 3 | 88.52 | 13.5 | 1.78 | 1.404 |
| Combination | N of Frames Transmitted | N of Received Frames—OK | N of Corrected Frames | N of Received-Discarded Frames (dB) | FER (%) | |
|---|---|---|---|---|---|---|
| Bad FCH CRC | Bad Payload | |||||
| C0 | 13,977 | 13,977 | 0 | 0 | 0 | 0.00 |
| C1 | 19,356 | 4764 | 3 | 955 | 6 | 75.39 |
| C2 | 9994 | 9994 | 0 | 0 | 0 | 0.00 |
| C3 | 9987 | 9987 | 241 | 0 | 0 | 0.00 |
| C4 | 9985 | 9985 | 0 | 0 | 0 | 0.00 |
| C5 | 9992 | 2700 | 1 | 317 | 2 | 72.98 |
| C6 | 9938 | 9913 | 2 | 0 | 0 | 0.25 |
| C7 | 11,993 | 10,927 | 0 | 65 | 1 | 8.89 |
| C8 | 9981 | 9910 | 0 | 0 | 0 | 0.71 |
| C9 | 21,850 | 20,240 | 118 | 52 | 1 | 7.37 |
| C10 | 12,962 | 12,962 | 8 | 0 | 0 | 0.00 |
| C11 | 7657 | 973 | 2 | 465 | 5 | 87.29 |
| C12 | 9984 | 9984 | 0 | 0 | 0 | 0.00 |
| C13 | 8985 | 1434 | 1 | 1535 | 16 | 84.04 |
| C14 | 9779 | 1123 | 2 | 376 | 6 | 88.52 |
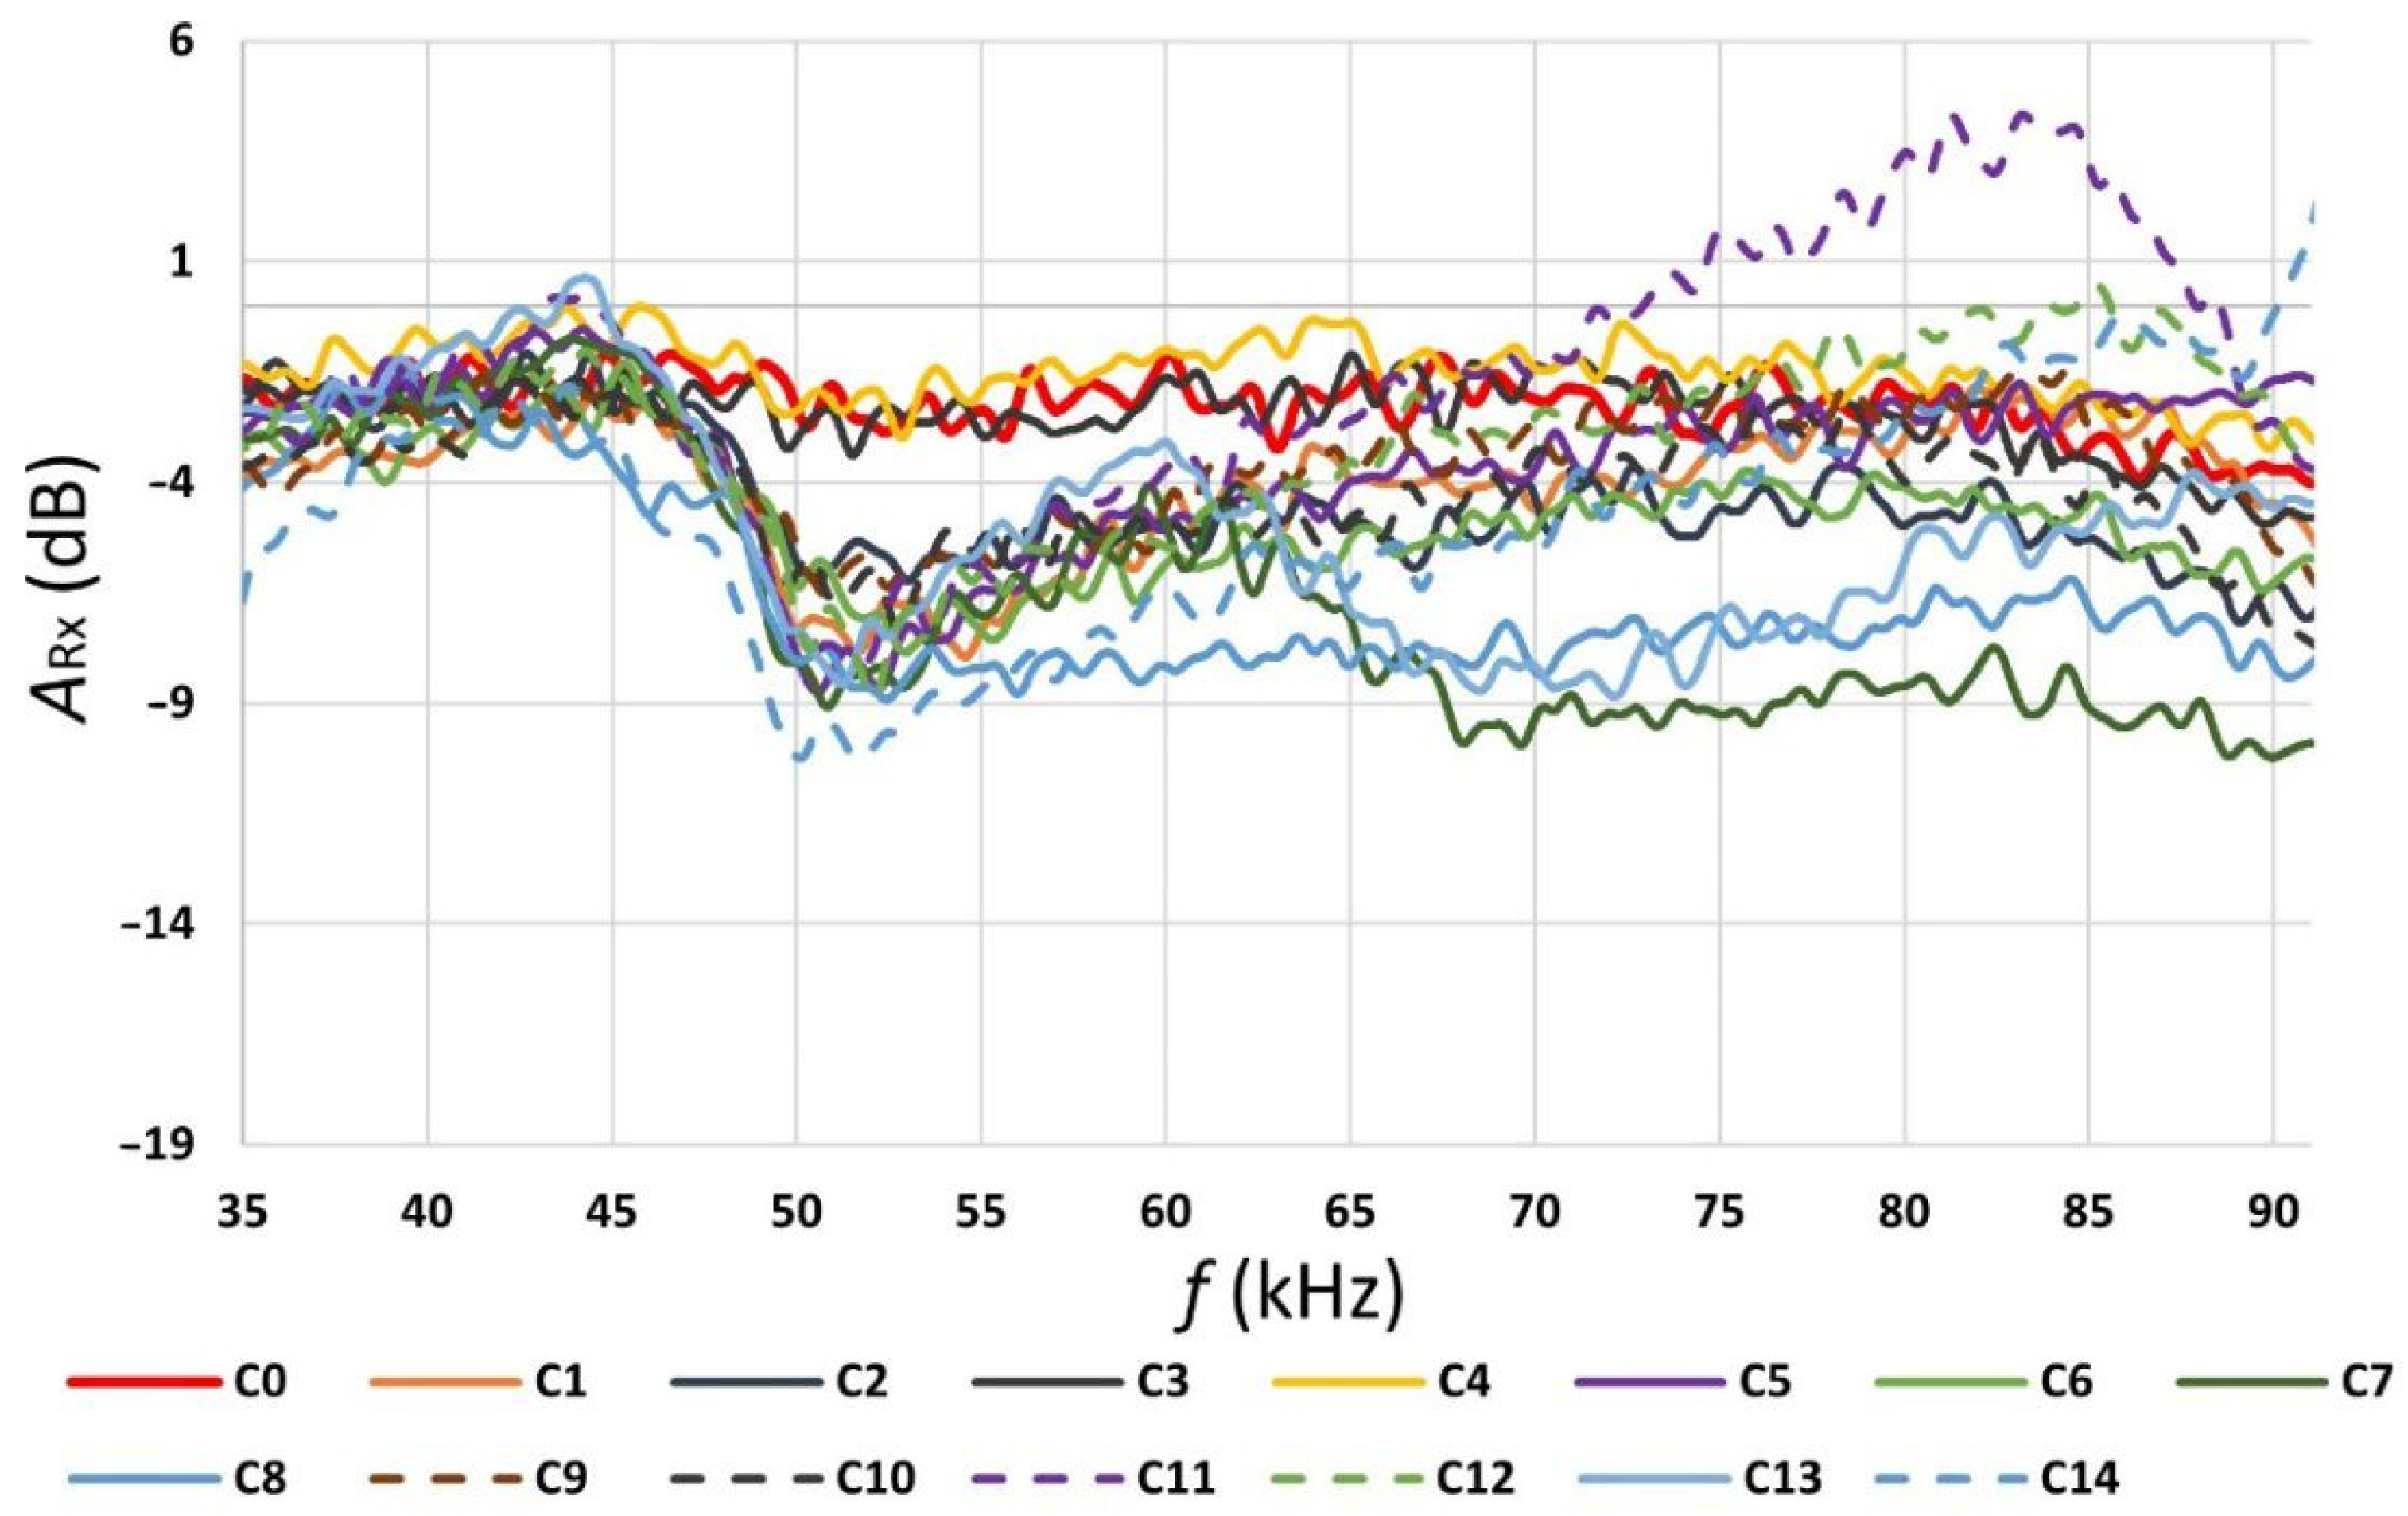
| Combination | Median | SD | Minimum | Maximum | Range | Spectral Flatness | Group | |
|---|---|---|---|---|---|---|---|---|
| Rx(dB) | Tx(dB) | |||||||
| C0 | −2.13 | 0.63 | −3.90 | −1.07 | 2.82 | −0.0068 | −0.0076 | |
| C1 | −5.64 | 1.40 | −9.45 | −3.12 | 6.33 | −0.0197 | −0.0081 | 1 |
| C2 | −5.89 | 1.49 | −8.34 | −1.05 | 7.29 | −0.0191 | −0.0109 | 3 |
| C3 | −3.11 | 0.81 | −5.33 | −1.59 | 3.74 | −0.007 | −0.0077 | 2 |
| C4 | −3.15 | 0.96 | −5.49 | −1.21 | 4.28 | −0.0073 | −0.0069 | 2 |
| C5 | −4.66 | 2.09 | −8.73 | −0.95 | 7.78 | −0.0367 | −0.0155 | 1 |
| C6 | −9.96 | 3.66 | −14.57 | −2.37 | 12.20 | −0.046 | −0.0143 | 3 |
| C7 | −6.09 | 1.47 | −8.22 | −2.08 | 6.15 | −0.0212 | −0.0107 | 1 |
| C8 | −7.56 | 1.96 | −9.14 | −1.45 | 7.69 | −0.0291 | −0.0091 | 3 |
| C9 | −5.44 | 1.22 | −9.31 | −2.91 | 6.40 | −0.0154 | −0.006 | 1 + 2 |
| C10 | −6.24 | 1.37 | −10.66 | −3.45 | 7.21 | −0.0146 | −0.006 | 1 + 2 |
| C11 | −4.94 | 2.51 | −11.14 | −0.54 | 10.60 | −0.0327 | −0.0184 | 1 + 1 |
| C12 | −9.28 | 4.07 | −15.92 | −1.86 | 14.06 | −0.0272 | −0.0092 | 1 + 3 |
| C13 | −5.36 | 1.76 | −9.47 | −2.47 | 7.01 | −0.0325 | −0.0113 | 1 + 1 |
| C14 | −5.27 | 1.97 | −9.38 | −1.95 | 7.43 | −0.0068 | −0.0076 | 1 + 3 |
| Spearman’s correlation | −0.024 | 0.409 | −0.314 | −0.089 | 0.251 | −0.515 | −0.452 | |
| Combination | Appliance | FERNormal (%) | FERROBO (%) | FERNotch (%) |
|---|---|---|---|---|
| C0 | No appliance (no-load state) | 0.00 | 0.00 | 0.00 |
| C1 | Linear fluorescent lamp 1 | 75.39 | 17.53 | 0.00 |
| C2 | Linear fluorescent lamp 2 | 0.00 | 0.00 | 0.00 |
| C3 | LEDL | 0.00 | 0.00 | 0.00 |
| C4 | CFL | 0.00 | 0.00 | 0.00 |
| C5 | Vacuum cleaner 1 | 72.98 | 13.15 | 0.00 |
| C6 | Vacuum cleaner 2 | 0.25 | 0.00 | 0.00 |
| C7 | Microwave oven | 8.89 | 0.25 | 0.00 |
| C8 | Kettle | 0.71 | 0.00 | 0.00 |
| C9 | Linear fluorescent lamp 1 + LEDL | 7.37 | 0.81 | 0.00 |
| C10 | Linear fluorescent lamp 1 + CFL | 0.00 | 0.00 | 0.00 |
| C11 | Linear fluorescent lamp 1 + vacuum cleaner 1 | 87.29 | 7.94 | 0.00 |
| C12 | Linear fluorescent lamp 1 + vacuum cleaner 2 | 0.00 | 0.00 | 0.00 |
| C13 | Linear fluorescent lamp 1 + microwave oven | 84.04 | 42.03 | 0.00 |
| C14 | Linear fluorescent lamp 1 + kettle | 88.52 | 5.19 | 0.00 |
Publisher’s Note: MDPI stays neutral with regard to jurisdictional claims in published maps and institutional affiliations. |
© 2022 by the authors. Licensee MDPI, Basel, Switzerland. This article is an open access article distributed under the terms and conditions of the Creative Commons Attribution (CC BY) license (https://creativecommons.org/licenses/by/4.0/).
Share and Cite
Blazek, V.; Slanina, Z.; Petruzela, M.; Hrbáč, R.; Vysocký, J.; Prokop, L.; Misak, S.; Walendziuk, W. Error Analysis of Narrowband Power-Line Communication in the Off-Grid Electrical System. Sensors 2022, 22, 2265. https://doi.org/10.3390/s22062265
Blazek V, Slanina Z, Petruzela M, Hrbáč R, Vysocký J, Prokop L, Misak S, Walendziuk W. Error Analysis of Narrowband Power-Line Communication in the Off-Grid Electrical System. Sensors. 2022; 22(6):2265. https://doi.org/10.3390/s22062265
Chicago/Turabian StyleBlazek, Vojtech, Zdenek Slanina, Michal Petruzela, Roman Hrbáč, Jan Vysocký, Lukas Prokop, Stanislav Misak, and Wojciech Walendziuk. 2022. "Error Analysis of Narrowband Power-Line Communication in the Off-Grid Electrical System" Sensors 22, no. 6: 2265. https://doi.org/10.3390/s22062265