
Optical Gas-Cell Dynamic Adsorption in a Photoacoustic Spectroscopy-Based SOF2 and SO2F2 Gas Sensor


Scientific Research Institute of Electric Power, Guizhou Power Grid Company Ltd., 251 Jiefang Road Nanming District, Guiyang 550002, China
*
Author to whom correspondence should be addressed.
Sensors 2022, 22(20), 7949; https://doi.org/10.3390/s22207949
Submission received: 30 September 2022
/
Revised: 11 October 2022
/
Accepted: 13 October 2022
/
Published: 18 October 2022
(This article belongs to the Special Issue Advanced Infocomm Technology including Selected Papers from 14th ICAIT 2022)
Abstract
:SO2F2 and SOF2 are the main components from the decomposition of insulation gas SF6. Photoacoustic spectroscopy (PAS) has been acknowledged as an accurate sensing technique. Polar material adsorption for SO2F2 and SOF2 in the photoacoustic gas cell of PAS may affect detection efficiency. In this paper, the optical gas-cell dynamic adsorptions of four different materials and the detection effects on SO2F2 and SOF2 are theoretically analyzed and experimentally demonstrated. The materials, including grade 304 stainless steel (SUS304), grade 6061 aluminum alloy (Al6061), polyvinylidene difluoride (PVDC), and polytetrafluoroethylene (PTFE), were applied inside the optical gas cell. The results show that, compared with metallic SUS304 and Al6061, plastic PVDC and PTFE would reduce the gas adsorption of SO2F2 and SOF2 by 10 to 20% and shorten the response time during gas exchange. The complete gas defusing period in the experiment was about 30 s. The maximum variations of the 90% rising time between the different adsorption materials were approximately 3 s for SO2F2 and 6 s for SOF2, while the generated photoacoustic magnitudes were identical. This paper explored the material selection for PAS-based gas sensing in practical applications.
1. Introduction
SF6 is widely used in gas-insulated switchgear (GIS), with excellent insulation and arc extinguishing properties. Due to partial discharge and overheating, SF6 will decompose and cause an insulation breakdown in GIS, leading to equipment failure [1]. Therefore, it is important to monitor the decomposition state of SF6 in GIS. SO2F2 and SOF2 are the main substances from the decomposition of SF6 [2]. Versatile sensing techniques for SO2F2 and SOF2 have been reported and improved. Infrared absorption spectroscopy is one of the popular approaches, with features of high accuracy, rapid response, selectivity, etc. In 1997, Heise et al. used Fourier transform infrared spectroscopy to monitor the decomposition of SF6 under discharge conditions and obtained the products of CF4, SOF2, SO2F2, and SO2 with ppm-level accuracy [3]. Tunable diode laser absorption spectroscopy (TDLAS) has also been investigated for ultra-sensitive gas detection [4]. An extended optical gas chamber could be realized by hollow-core optical fibers to achieve ppb-level sensitivity in TDLAS [5,6,7].
Recently, photoacoustic spectroscopy (PAS) has also become a hot topic, due to its high selectivity and sensitivity, as well as its fast response [8,9]. It has been used to detect H2S, SO2, CO, and other substances from SF6 decompositions with sub-ppm detection limits [10,11,12]. Nevertheless, few works of literature have reported on the PAS-based detection of SO2F2 and SOF2. Both SO2F2 and SOF2 are typical polar molecules that exhibit substance solubility and diffusion in polar solvents. Hence, in practical PAS implementations, it is necessary to analyze the adsorption between gas molecules and photoacoustic cells (PACs), which may influence the sensing performance.
In this paper, we analyzed and experimentally demonstrated the optical gas-cell dynamic adsorption with different materials in the PAS-based SOF2 and SO2F2 gas sensors. An H-type resonant PAC was designed and fabricated in this experiment. Adsorption mechanisms between gas molecules and four materials, i.e., grade 304 stainless steel (SUS304), grade 6061 aluminum alloy (Al6061), polyvinylidene difluoride (PVDC), and polytetrafluoroethylene (PTFE), were analyzed and discussed. Dynamic gas flow and concentration diffusing inside the four PACs were simulated and compared. The PAS-based gas sensor was established, and four PACs of different surface materials were fabricated. Compared with the metallic SUS304 and Al6061, the plastic PVDF and PTFE could reduce the gas adsorption behavior and shorten the response time. The complete gas-diffusing period was approximately 30 s in the experiment. The maximum variations of the 90% rising time between the different adsorption materials were approximately 3 s for SO2F2 and 6 s for SOF2, while the generated photoacoustic magnitudes were identical. The exchange variances of the gas concentrations between the metals (SUS304 and Al6061) and the plastics (PVDF and PTFE) were about 10% for SO2F2 and 20% for SOF2 in the employed PAS system.
This work provides guidance for the material selection of the optical gas cell in practical PAS sensing applications for polar gases.
2. Photoacoustic Spectroscopy Principle
The basic principle of PAS contains Beer–Lambert’s law and the photoacoustic effect. Beer–Lambert’s law describes the absorption of light by gas molecules. When light passes through gas, if the absorption spectrum of the gas overlaps with the optical wavelength, the output light intensity will decrease after the gas absorption. The decrescent is related to the gas absorption coefficient, the gas concentration, and the absorption optical path [13]:
where λ is the wavelength of the light, I(λ) is the output light intensity, I0(λ) is the input light intensity, α(λ) is the absorption coefficient of the gas, C is the concentration of the target gas, and L is the absorption optical path.
In the photoacoustic effect, when the intensity of the incident light is regularly modulated, the gas pressure changes regularly, forming a photo-generated acoustic pressure signal. The intensity, SPA, of the photoacoustic signal can be simply expressed as [14,15]:
where Kcell is the cell constant of the PAC, determined by the quality factor and volume of the PAC, as well as by the modulation frequency. P0 is the optical power of the incident light. This indicates that when the gas cell, the light source, and the gas molecules are fixed, the intensity of the photoacoustic signal is proportional to the gas concentration.
3. Analysis and Simulation
3.1. Gas-Cell Design and Simulation
The amplitude of the acoustic signal is proportional to the absorption coefficient of the target gas. Figure 1 shows the absorption spectrum lines of SO2F2 and SF6 at the temperature of 25 °C and pressure of 1 atm, obtained from the acknowledged HITRAN database. The selected absorption line of SO2F2 is located at 6648 nm and has little cross interference with SF6. As found in the literature, the absorption line of SOF2 is located at approximately 7463 nm [16].
In the PAC, the photoacoustic effect occurs and the acoustic signal is excited. In this work, an H-type longitudinal resonant PAC was designed, with an acoustic resonator of 90 mm in length and 5 mm in radius, as well as symmetrical buffer volumes of 45 mm in length and 25 mm in radius. Figure 2a shows the simulated acoustic field distribution inside the gas cell, exhibiting its maximum point located at the center of the acoustic resonator. The simulation is based on the finite element method and realized using the COMSOL Multiphysics software package. In particular, the thermoviscous acoustics model and the pressure acoustics model were employed for the photoacoustic simulation [17].
To analyze the adsorption effect and the gas exchange during the entire ventilation process, the dynamic airflow inside the PAC was further simulated, as shown in Figure 2b. It was found that the airflow inside the PAC was not homogenously distributed during ventilation, while the airflow inside the central cylindrical resonator was rather uniform.
3.2. Gas Molecule and Adsorption Material
The target gases, SO2F2 and SOF2, are both strongly polar substances [18,19]. Figure 3 shows their molecular structures. The tetrahedral structure and high electronegativity make SOF2 molecules extremely stable. SO2F2 has physicochemical properties that are similar to those of SOF2. However, the greater number of oxygen atoms in SO2F2 makes it extra-active. The molecular structures of SO2F2 and SOF2 determine the capability to transfer charge and adsorption energy with metallic media [20].
Considering the adsorption of SO2F2 and SOF2, metallic SUS304 and Al6061 are solid solutions filled with atoms between crystals. The adjacent atoms are in a fixed position, due to the existence of electrostatic attraction. Atoms on the inner surfaces of gas cells are in direct contact with the polar gas and have fewer adjacent atoms than those around the inner-layer atoms. To compensate for the imbalance of electrostatic attraction, it may adsorb the surrounding SOF2 or SO2F2 gas molecules.
For PVDF and PTFE, the adsorption effect is varied, due to their molecule structures. For example, in PVDF, the columnar structure forms a 3D network skeleton with a multi-microporous structure through the connection of fluorine atom substituents. The microporous structure provides PVDF with a higher specific surface area and stronger porosity than the metals, which indicates that PVDF would adsorb the SOF2 or SO2F2 polar molecules mainly through the Van der Waals force.
3.3. Gas Adsorption and Diffusing
By using the finite element method, a model of gas flow and adsorption in the gas cell was established. The simulation of gas adsorption and diffusion was based on the Transport of Diluted Species Interface model and the General Form Boundary Partial Differential Equations Interfaces in the software package. The effect of adsorption at the inner layer of the PAC on the gas concentration was studied and is shown in Figure 4. The inner surface of the central acoustic resonator was set as the adsorption place, for simplicity.
Figure 4 shows the temporal dynamic gas concentration inside the PAC, up to 100 s. After ventilating for 40 s, the gas concentration in the central acoustic resonator basically becomes saturated. Normally, the microphone for acoustic detection is located at the central position of the PAC, which means that the detected gas concentration would be constant after 40 s ventilation.
A concentration probe was set in the center of the acoustic resonator of each PAC to monitor the change of the concentration during the gas ventilation, as shown in Figure 5. The gas concentration distribution at the inner surfaces when ventilating for 40 s is also illustrated. With the same ventilation time, the gas concentration in the PAC will decrease, due to the increased material adsorption effect. Higher adsorption leads to extended ventilation time for the gas exchange balance in the PAC.
4. Experiment and Discussion
4.1. Experimental PAS System
In the PAS experiment, the designed PAC was generally made by a metal-casting process. The metallic SUS304-PAC and Al6061-PAC were directly cast and assembled, as schematically shown in Figure 6a. The plastic materials, i.e., PVDF and PTFE, were sprayed and deposited on the inner walls of the metallic PACs, with an estimated thickness of about 300 microns, PVDC-PAC and PTFE-PAC, as shown in Figure 6b. The fabricated four PACs were all tested and compared in the experiments.
The gas sensing experiment is schematically shown in Figure 7a. There were two distributed feedback quantum cascade lasers (DFB-QCL): 6648 nm (Alpes Lasers, model BG-6-7, power 250 mW) and 7463 nm (AdTech, model 7.43 μm DFB QCL, power 250 mW) for detecting SO2F2 and SOF2, respectively. The laser driver module included a current controller (ILX Lightwave, model LDX-3525) and a TEC temperature controller (Alpes Lasers, model TC-3), which were used to control the output wavelength of the laser. The signal generator (FLUKE, model FLUKE284) was used to generate a swept modulation signal to modulate the laser output. The microphone (BSWA TECH, model MPA201) detected the acoustic signal and converted it into a voltage signal. The voltage signal was then processed by a lock-in amplifier (Stanford, model SR830) to extract the second harmonics. The PD (VIGO, model PVI-4TE-4) was used to monitor the background light power to compensate for laser power fluctuations. Figure 7b shows the key modules of the PAS experimental system, where the four PACs used in the experiment are labeled by the dashed red box.
SO2F2 and SOF2 gases were tested separately using the system. The concentrations of the used gases, which were mixed and diluted with standard concentration gases, were both 80 ppm. As acknowledged in the literature, the targets gases, i.e., SO2F2 and SOF2, have tens of ppm concentrations [21]. Figure 8 presents the measured second harmonic signals using the SUS304-PAC for both gases. The maximum value of this harmonic waveform in Figure 8 was used to derive the gas concentration.
4.2. Adsorption Analysis for SO2F2
Based on the second harmonic detection technique, the gas adsorption in the PAC is represented by the amplitude of the concentration-related harmonic signal. The adsorption effect of SO2F2 on the PACs made of different materials was tested and is shown in Figure 9.
The measured results were fitted with a first-order exponential function and the coefficients of determination (COD) were above 0.99. The calculated maximum value of the second harmonic amplitude, according to fitting equations and the response time to reach 90%, are presented in Table 1. Data show that the stable maximum values of PVDF-PAC, PTFE-PAC, Al6061-PAC, and SUS304-PAC were 0.9055, 0.9068, 0.9063, and 0.9065, respectively. The 90% response time was 24 s, 25 s, 27 s, and 27 s, respectively. There were slight differences (approximately 10%) in adsorption-related response times between the four PACs, while the amplitudes were basically identical.
For SO2F2 detection, PVDF and PTFE could indeed reduce the adsorption effect and shorten the response time. The maximum temporal difference between the metals and plastics was about 3 s and 10%, while the achieved magnitude was similar for these PACs.
4.3. Adsorption Analysis for SOF2
For SOF2, the temporal change of the second harmonic amplitude is shown in Figure 10. The measured results were fitted with a first-order exponential function with a COD above 0.99. The calculated data are included in Table 2. The results show that the maximum values were 0.47076, 0.47092, 0.47112, and 0.47116, and the response times to reach 90% were 28 s, 28 s, 34 s, and 35 s, respectively. The temporal response difference between the metals and plastics was about 6s and 20%.
It is to be noted that metals usually behave with advanced casting capability, thermal conductivity, and external noise isolation, which are also essential for practical PAS-based gas sensors. By using the SUS304 photoacoustic gas cell, the detailed determination of the concentration of adsorbed substances could also be found in our recent publication [22].
5. Conclusion
In this paper, optical gas-cell dynamic adsorption with different materials in the PAS-based gas sensor for SOF2 and SO2F2 were studied. The adsorption characteristics and photoacoustic excitation effects of SUS304, Al6061, PVDF, and PTFE were theoretically analyzed and experimentally tested. Inner coating with PVDF or PTFE could reduce the polar adsorption effects of SO2F2 and SOF2, compared with those of Al6061 and SUS304. It could shorten the response time required for the stabilized concentration by about 10% and 20%, respectively. The achieved signal amplitudes were identical for the different PACs, which indicated constant sensing accuracy. In practical applications, in addition to the material adsorption of SO2F2 and SOF2, the gas ventilation, thermal conduction, and fabrication capability should be comprehensively considered. This work provides guidance for optical gas-cell material selection for PAS gas sensing in practical applications.
Author Contributions
Y.Z., M.W. and P.Y. designed the research study, analyzed the data. Y.Z. wrote the paper. M.W. conducted the measurement, P.Y. and Z.L. gave a substantial contribute to the acquisition of data. All authors have read and agreed to the published version of the manuscript.
Funding
China Southern Power Grid Co., Ltd. Grant Project (GZKJXM20210348); Science and Technology Support Program of Guizhou Province (QianKeHeZhiCheng [2021] General 365).
Institutional Review Board Statement
Not applicable.
Informed Consent Statement
Not applicable.
Data Availability Statement
The datasets generated during the current study are available from the corresponding author on reasonable request.
Acknowledgments
The authors acknowledge partial support of China Southern Power Grid Co., Ltd. Grant Project (GZKJXM20210348) and Science and Technology Support Program of Guizhou Province (QianKeHeZhiCheng [2021] General 365).
Conflicts of Interest
The authors declare that they have no conflicts of interest.
References
- Zhang, Y.G.; Lu, Z.; Liu, H.T.; Gao, Q.; Li, B.; Wu, X.J. Emission spectrum characteristics of SF6 plasma based on femtosecond laser-guided high-voltage discharge. Appl. Phys. B 2022, 128, 1–7. [Google Scholar] [CrossRef]
- Tang, J.; Zeng, F.P.; Pan, J.Y.; Zhang, X.X.; Yao, Q.; He, J.J.; Hou, X.Z. Correlation Analysis between Formation Process of SF6 Decomposed Components and Partial Discharge Qualities. IEEE Trans. Dielectr. Electr. Insulation. 2013, 20, 864–875. [Google Scholar] [CrossRef]
- Heise, H.M.; Kurte, R.; Fischer, P.; Klockow, D.; Janissek, P.R. Gas analysis by infrared spectroscopy as a tool for electrical fault diagnostics in SF6 insulated equipment. Fresenius’ J. Anal. Chemistry. 1997, 358, 793–799. [Google Scholar] [CrossRef]
- Deng, B.T.; Sima, C.; Xiao, Y.F.; Wang, X.F.; Ai, Y.; Li, T.L.; Lu, P.; Liu, D.M. Modified laser scanning technique in wavelength modulation spectroscopy for advanced TDLAS gas sensing. Opt. Lasers Eng. 2022, 151, 106906. [Google Scholar] [CrossRef]
- Jaworski, P. A Review of Antiresonant Hollow-Core Fiber-Assisted Spectroscopy of Gases. Sensors 2021, 21, 5640. [Google Scholar] [CrossRef] [PubMed]
- Deng, B.T.; Sima, C.T.; Tan, H.Y.; Zhang, X.H.; Lian, Z.G.; Chen, G.Q.; Yu, Q.Q.; Xu, J.H.; Liu, D.M. Design of hollow core step-index antiresonant fiber with stepped refractive indices cladding. Front. Optoelectron. 2021, 14, 407–413. [Google Scholar] [CrossRef]
- Tan, H.Y.; Sima, C.T.; Deng, B.T.; Zhang, X.H.; Chen, G.Q.; Yu, Q.Q.; Xu, J.H.; Lian, Z.G.; Liu, D.M. Design and Analysis of Ultra-Wideband Highly-Birefringent Bragg Layered Photonic Bandgap Fiber With Concave-Index Cladding. IEEE Photonics J. 2021, 13, 1–10. [Google Scholar] [CrossRef]
- Xiao, H.; Zhao, J.; Sima, C.; Lu, P.; Long, Y.; Ai, Y.; Zhang, W.; Pan, Y.; Zhang, J.; Liu, D. Ultra-sensitive ppb-level methane detection based on NIR all-optical photoacoustic spectroscopy by using differential fiber-optic microphones with gold-chromium composite nanomembrane. Photoacoustics 2022, 26, 100353. [Google Scholar] [CrossRef] [PubMed]
- Fu, L.; Lu, P.; Sima, C.; Zhao, J.; Pan, Y.; Li, T.; Zhang, X.; Liu, D. Small-volume highly-sensitive all-optical gas sensor using non-resonant photoacoustic spectroscopy with dual silicon cantilever optical microphones. Photoacoustics 2022, 27, 100382. [Google Scholar] [CrossRef] [PubMed]
- Chen, D.; Liu, W.; Zhang, Y.; Liu, J.; Kan, R.; Wang, M.; Chen, J.; Cui, Y. H2S detection by tunable diode laser absorption spectroscopy. Proceedings of 2006 IEEE International Conference on Information Acquisition, Weihai, China; 2006; pp. 754–758. [Google Scholar]
- Chen, T.A.; Ma, F.X.; Zhao, Y.; Liao, Z.H.; Qiu, Z.J.; Zhang, G.Q. Cantilever enhanced based photoacoustic detection of SF6 decomposition component SO2 using UV LED. Sens. Rev. 2022, 42, 70–75. [Google Scholar] [CrossRef]
- He, Y.; Ma, Y.F.; Tong, Y.; Yu, X.; Tittel, F.K. A portable gas sensor for sensitive CO detection based on quartz-enhanced photoacoustic spectroscopy. Opt. Laser Technol. 2019, 115, 129–133. [Google Scholar] [CrossRef]
- Ilke, M.; Bauer, R.; Lengden, M. A Calibration-Free Methodology for Resonantly Enhanced Photoacoustic Spectroscopy Using Quantum Cascade Lasers. IEEE Sens. J. 2020, 20, 10530–10538. [Google Scholar] [CrossRef] [Green Version]
- Tanaka, Y.; Tajima, T.; Seyama, M.; Waki, K. Differential Continuous Wave Photoacoustic Spectroscopy for Non-Invasive Glucose Monitoring. IEEE Sens. J. 2020, 20, 4453–4458. [Google Scholar] [CrossRef]
- Lassen, M.; Harder, D.B.; Brusch, A.; Nielsen, O.S.; Heikens, D.; Persijn, S.; Petersen, J.C. Photo-acoustic sensor for detection of oil contamination in compressed air systems. Opt. Express. 2017, 25, 1806–1814. [Google Scholar] [CrossRef] [PubMed] [Green Version]
- Bian, C.; Dai, F.; Cheng, J.; Gan, Q.; Zhang, Z.; Cui, G.; Tan, T.; Li, D.; Xie, J. Analysis of Infrared Characteristics of SO2F2 and SOF2 of SF6 Decomposition Components. Proceedings of 2021 International Conference on Electrical Materials and Power Equipment (ICEMPE), Chongqing, China; 2021; pp. 1–4. [Google Scholar]
- Photoacoustic Resonator. Available online: https://cn.comsol.com/model/photoacoustic-resonator-12435 (accessed on 20 March 2022).
- National Library of Medicine. CID 17607. PubChem Compound Summary for CID 17607, Sulfuryl fluoride. Available online: https://pubchem.ncbi.nlm.nih.gov/compound/Sulfuryl-fluoride (accessed on 6 June 2022).
- National Library of Medicine. CID 24548. PubChem Compound Summary for CID 24548, Thionyl fluoride. Available online: https://pubchem.ncbi.nlm.nih.gov/compound/Thionyl-fluoride (accessed on 6 June 2022).
- Qian, H.; Deng, J.; Xie, Z.C.; Pan, Z.C.; Zhang, J.Y.; Zhou, H.B. Adsorption and Gas Sensing Properties of the Pt-3-MoSe2 Monolayer to SOF2 and SO2F2. ACS Omega 2020, 5, 7722–7728. [Google Scholar] [CrossRef] [PubMed] [Green Version]
- Zeng, F.; Lei, Z.; Yang, X.; Tang, J.; Yao, Q.; Miao, Y. Evaluating DC Partial Discharge with SF6 Decomposition Characteristics. IEEE Trans. Power Delivery. 2019, 34, 1383–1392. [Google Scholar] [CrossRef]
- Zhang, Y.; Wang, M.; Yu, P.; Liu, Z. Optical gas sensing of sub-ppm SO2F2 and SOF2from SF6 decomposition based on photoacoustic spectroscopy. IET Optoelectron. 2022, 1–6. [Google Scholar] [CrossRef]
Figure 1.
Absorption spectra of SO2F2 and SF6. The selected absorption line of SO2F2 is labeled at 6648 nm.
Figure 1.
Absorption spectra of SO2F2 and SF6. The selected absorption line of SO2F2 is labeled at 6648 nm.

Figure 2.
(a) The acoustic field and (b) the airflow distribution inside the PAC.


Figure 4.
Temporal dynamic airflow and concentration distribution inside the gas cell.
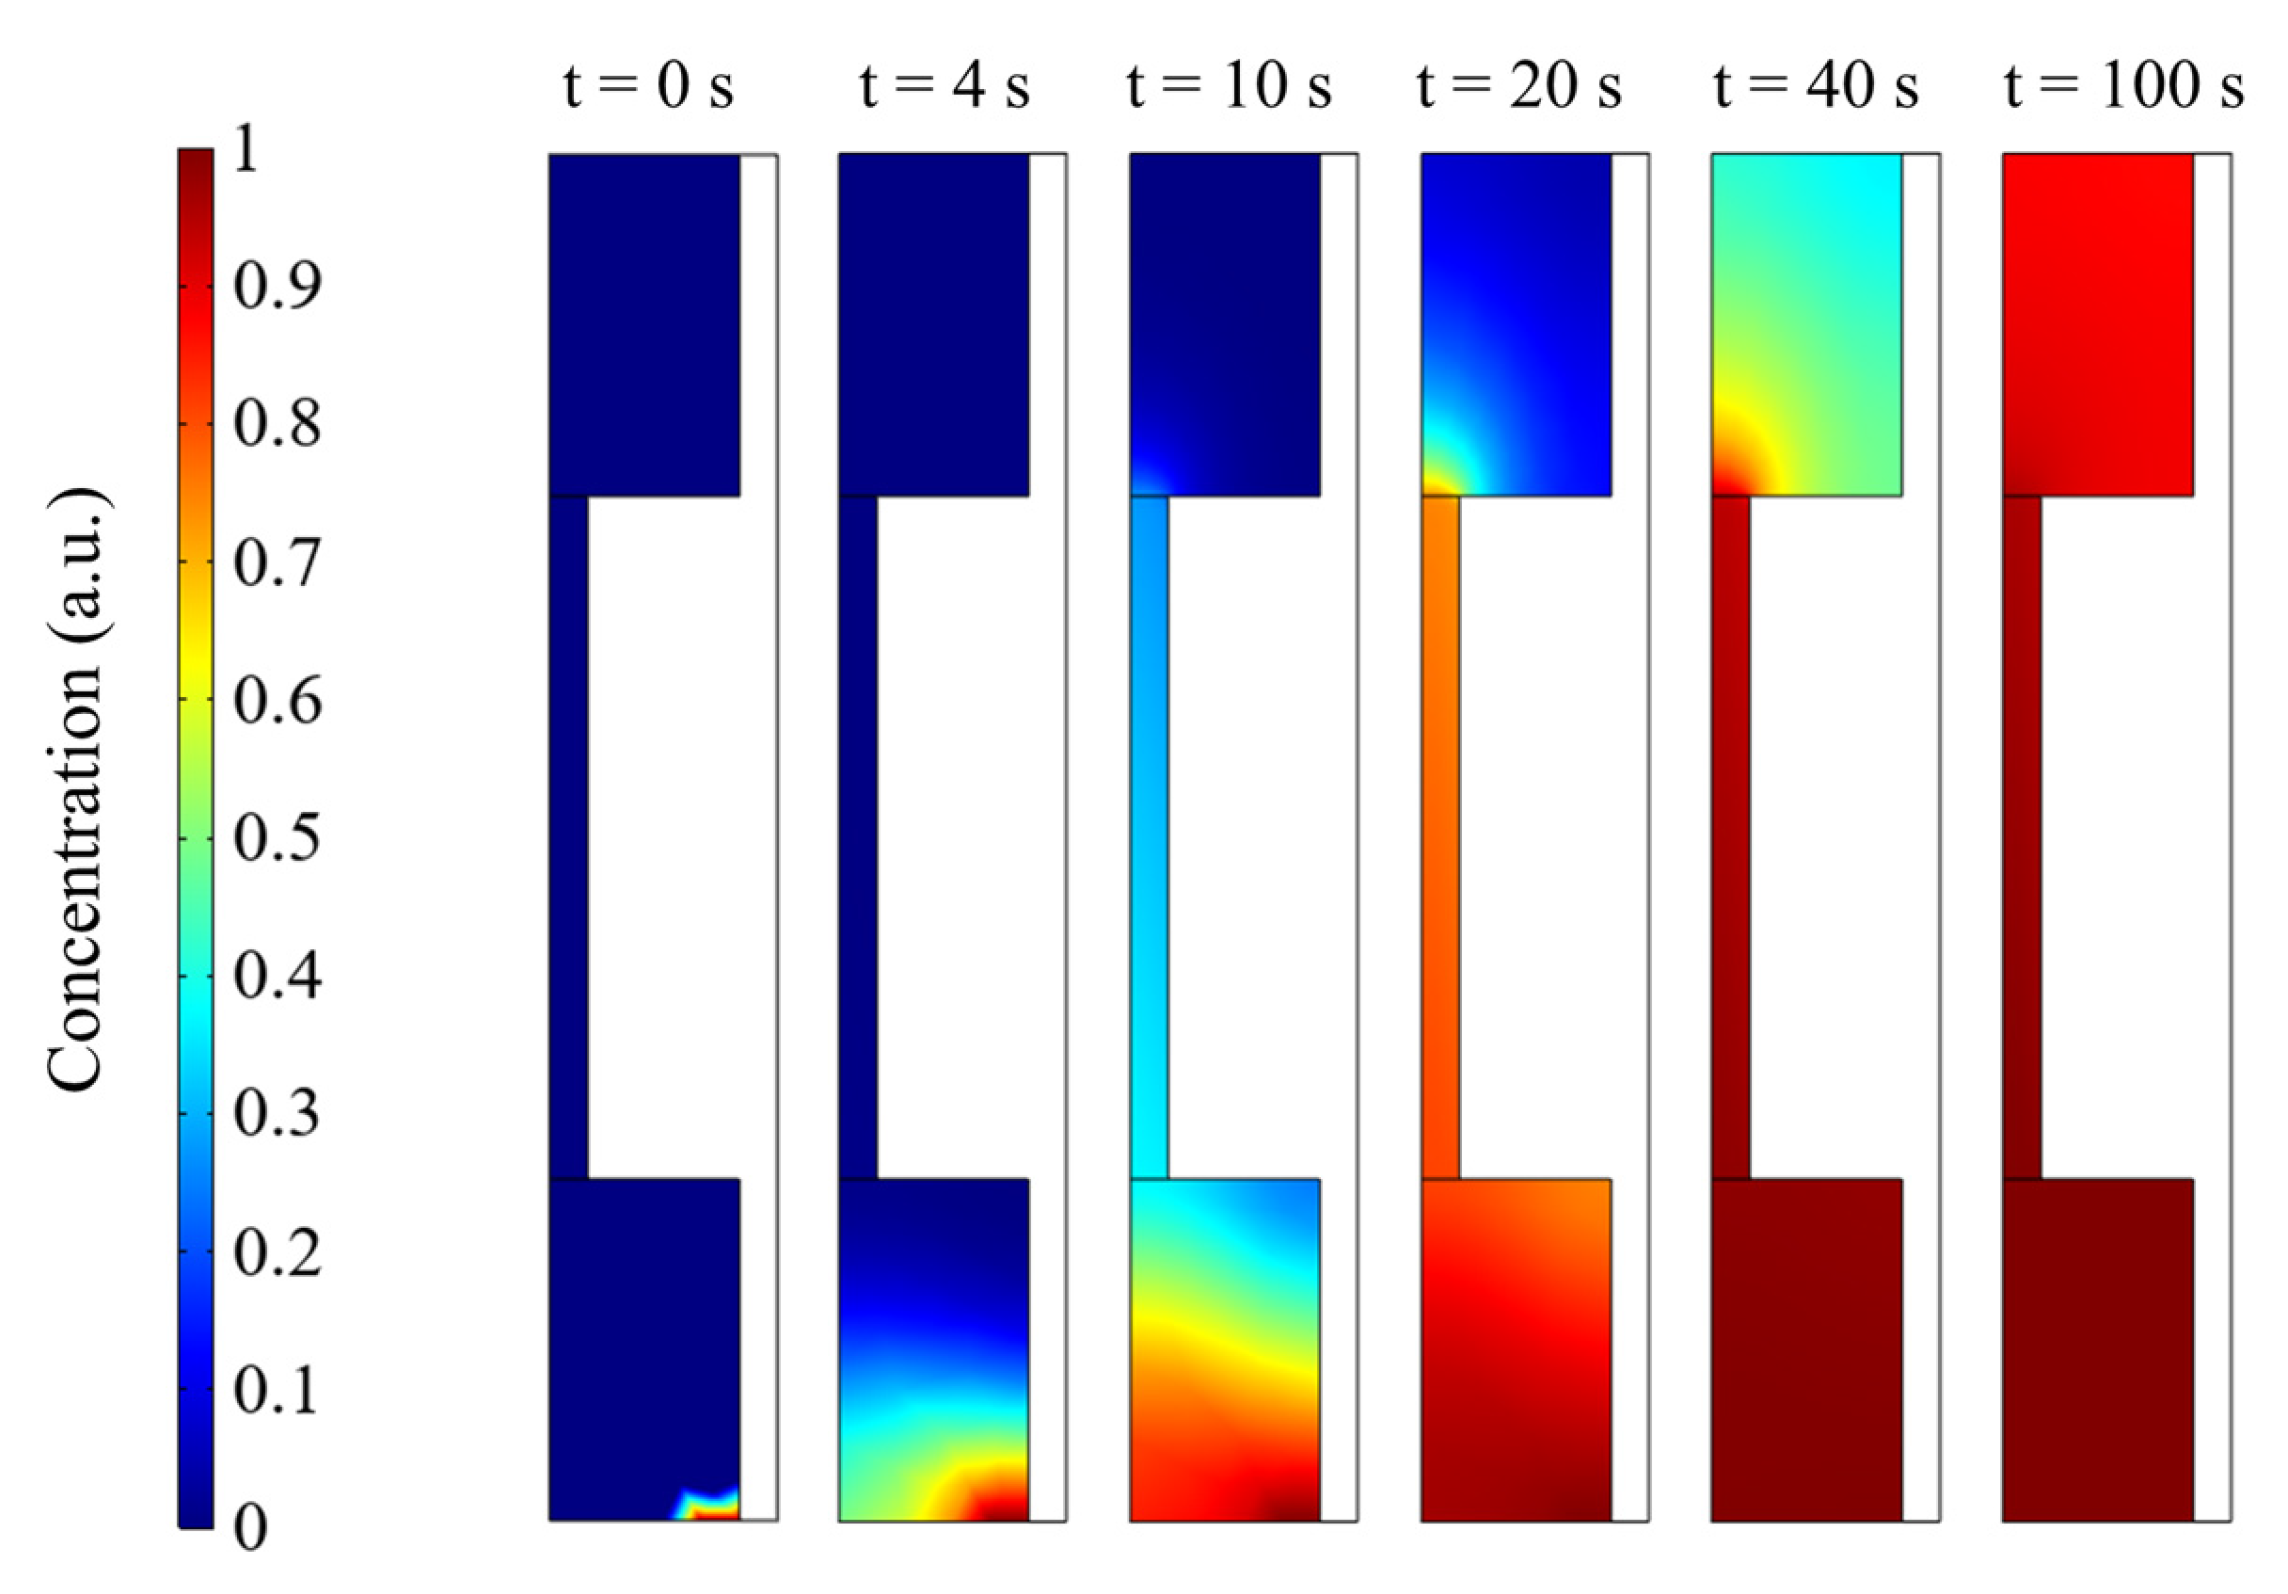
Figure 5.
Temporal gas concentration at the center of PACs with varied absorptions.
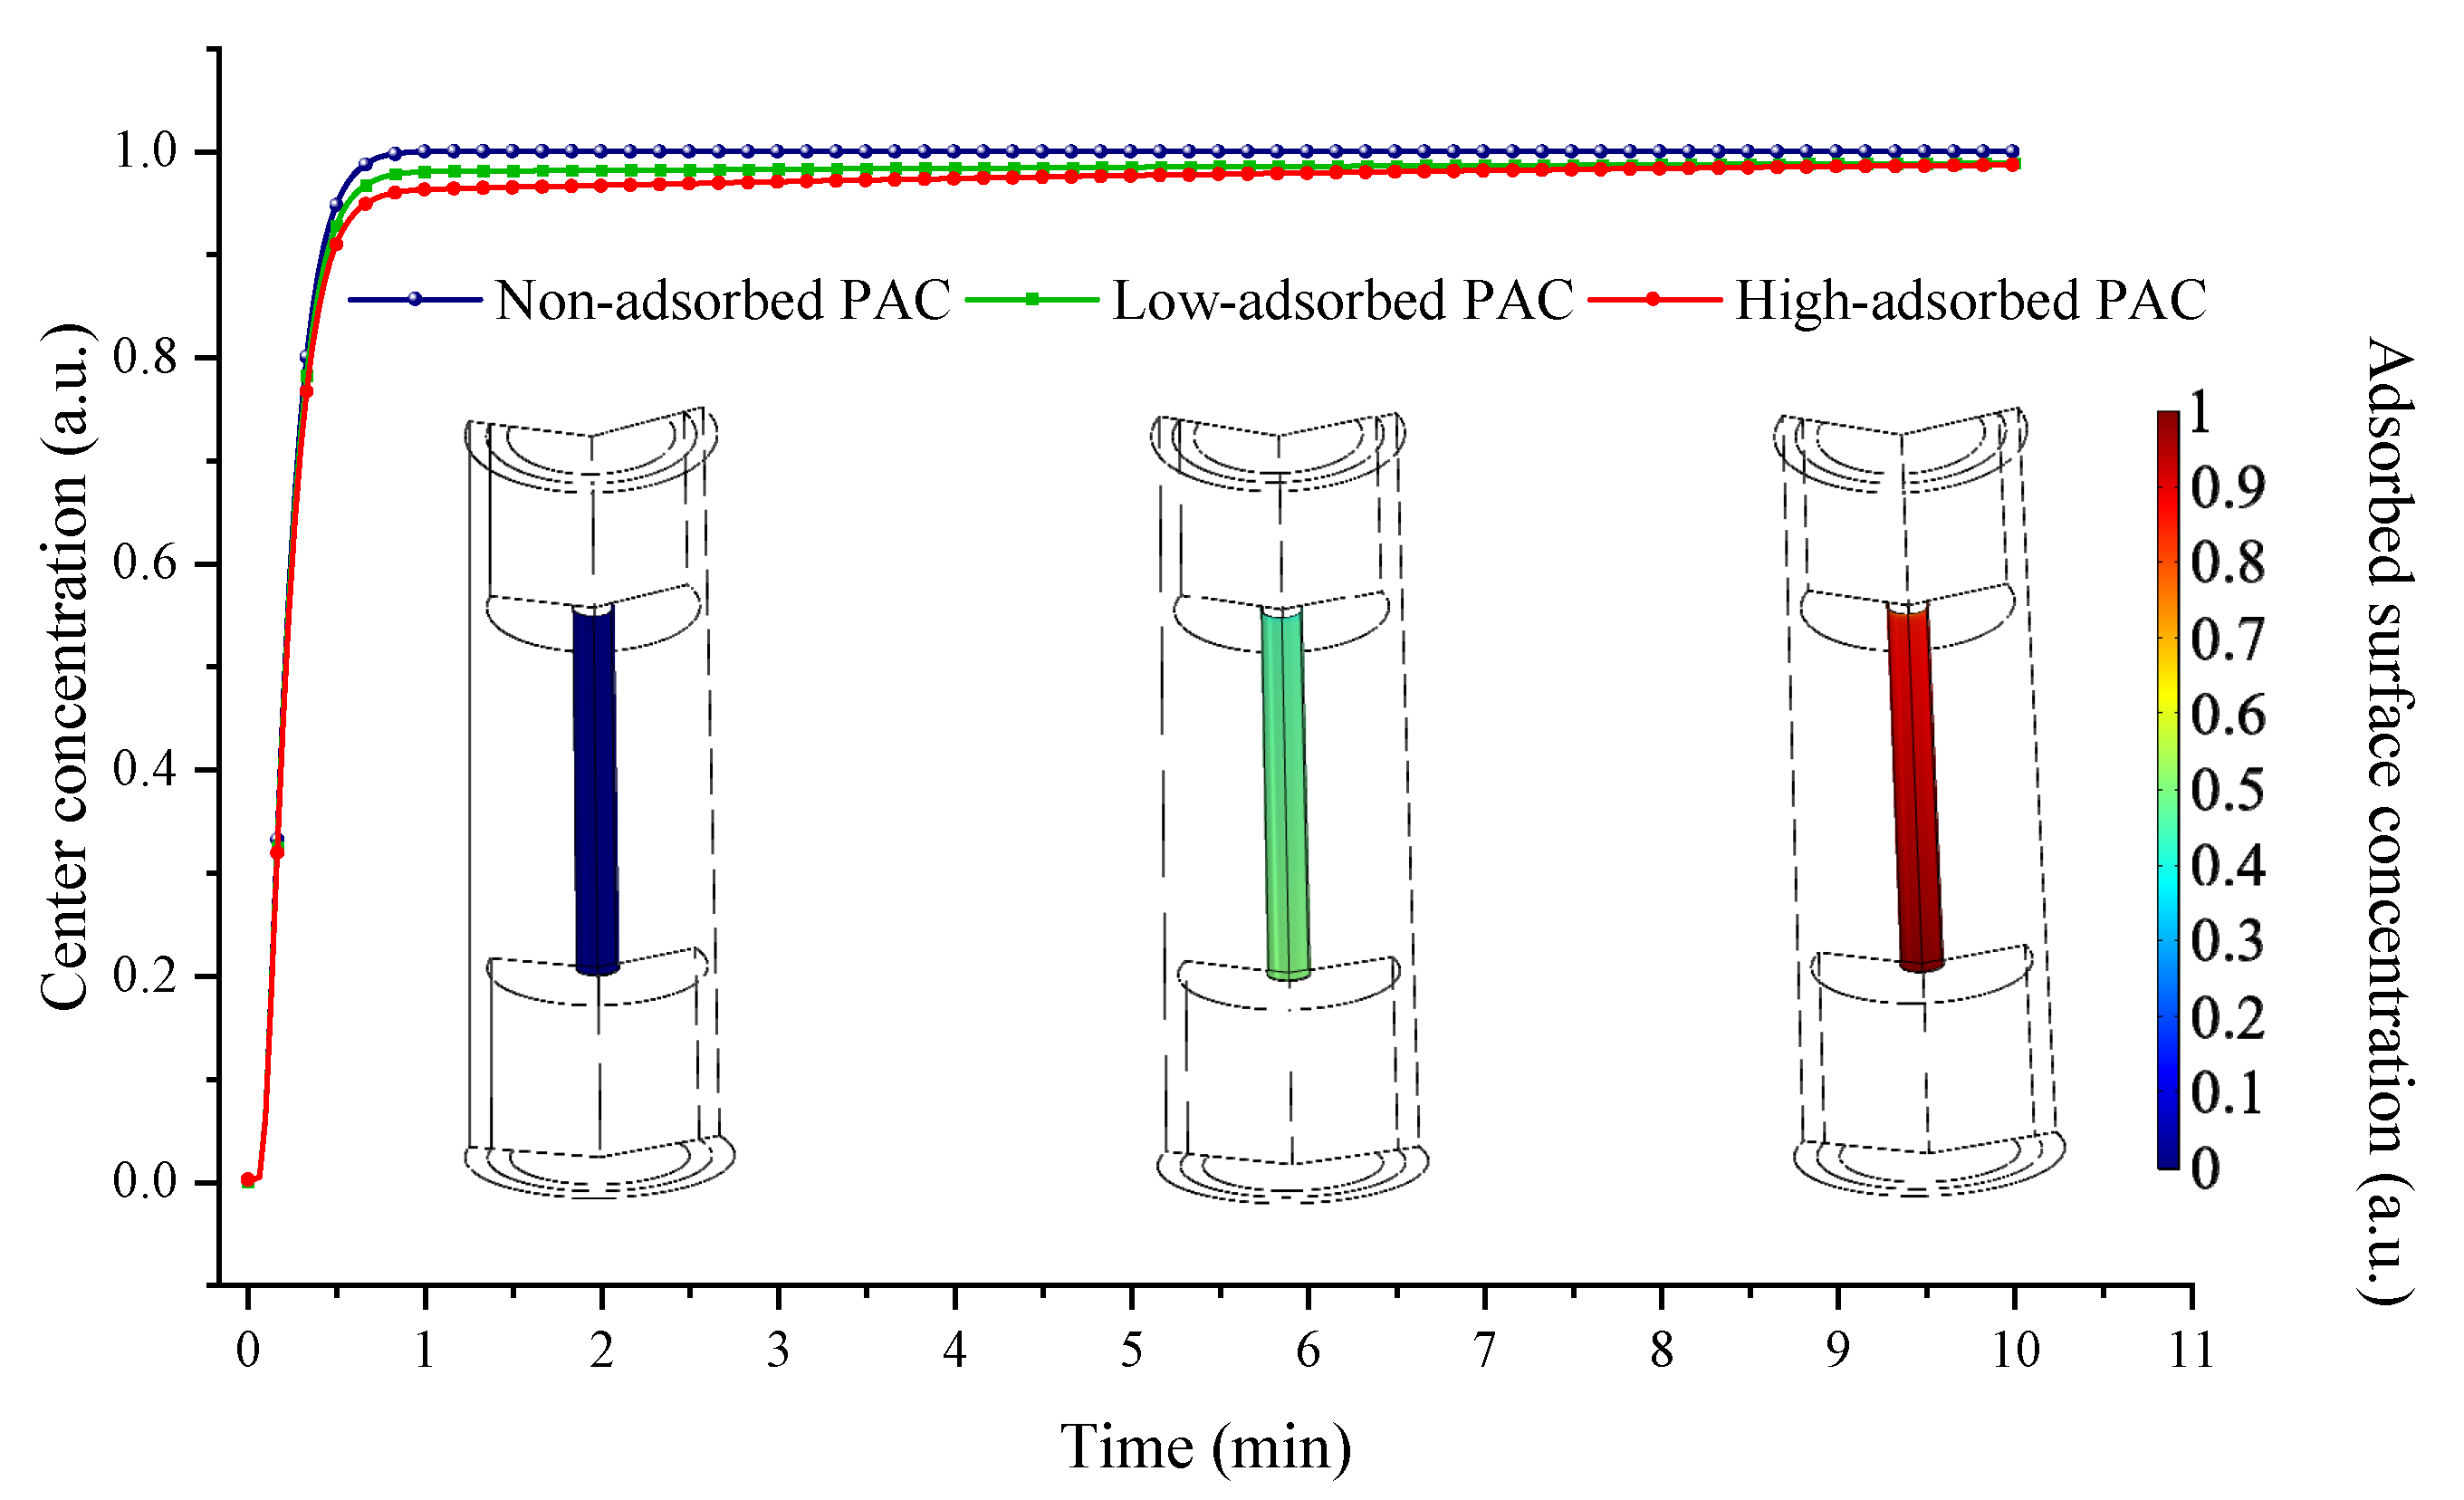
Figure 6.
Schematic structures of PACs made of (a) metal or (b) with inner-coated plastic.

Figure 7.
(a) Schematic of the PAS experimental system; (b) core modules including the four PACs.

Figure 8.
Measured second harmonics for the two gases.
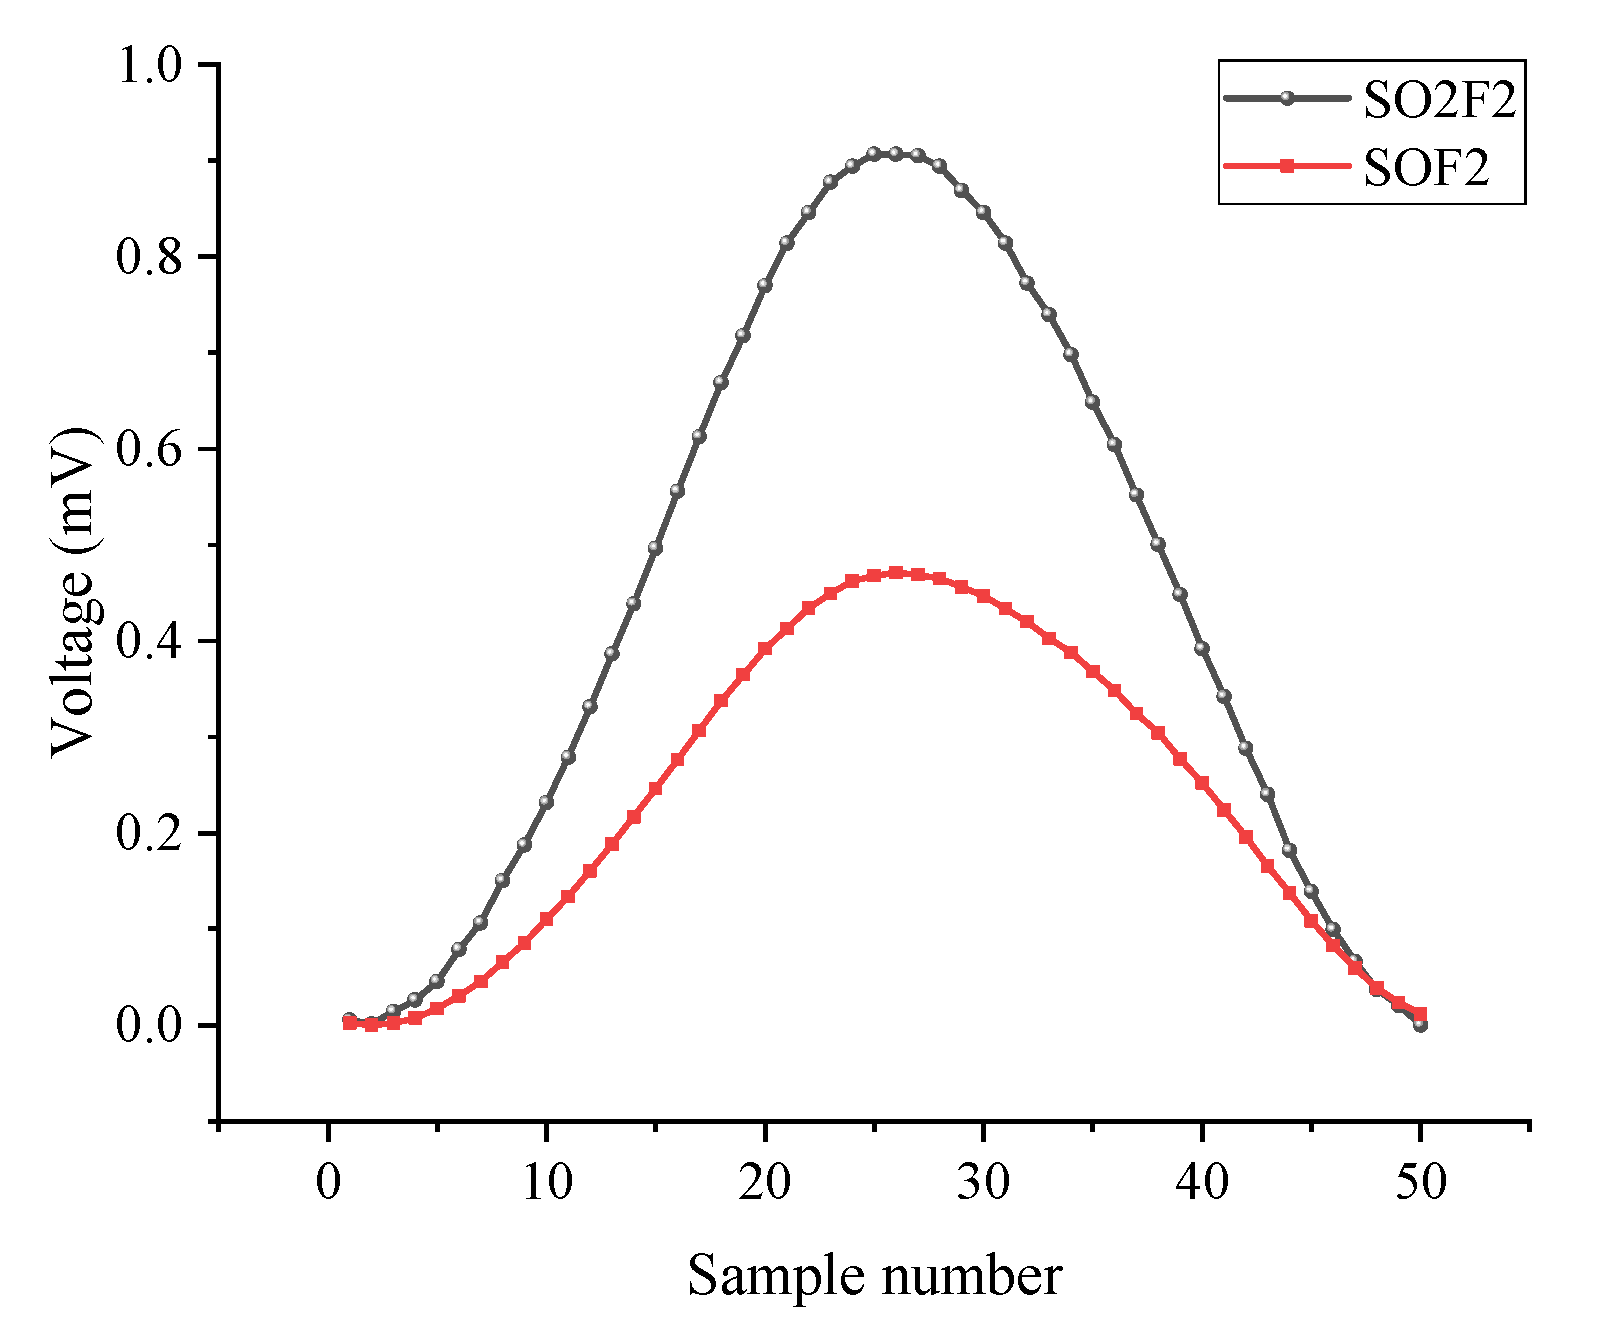
Figure 9.
Amplitude response of four PACs for SO2F2.
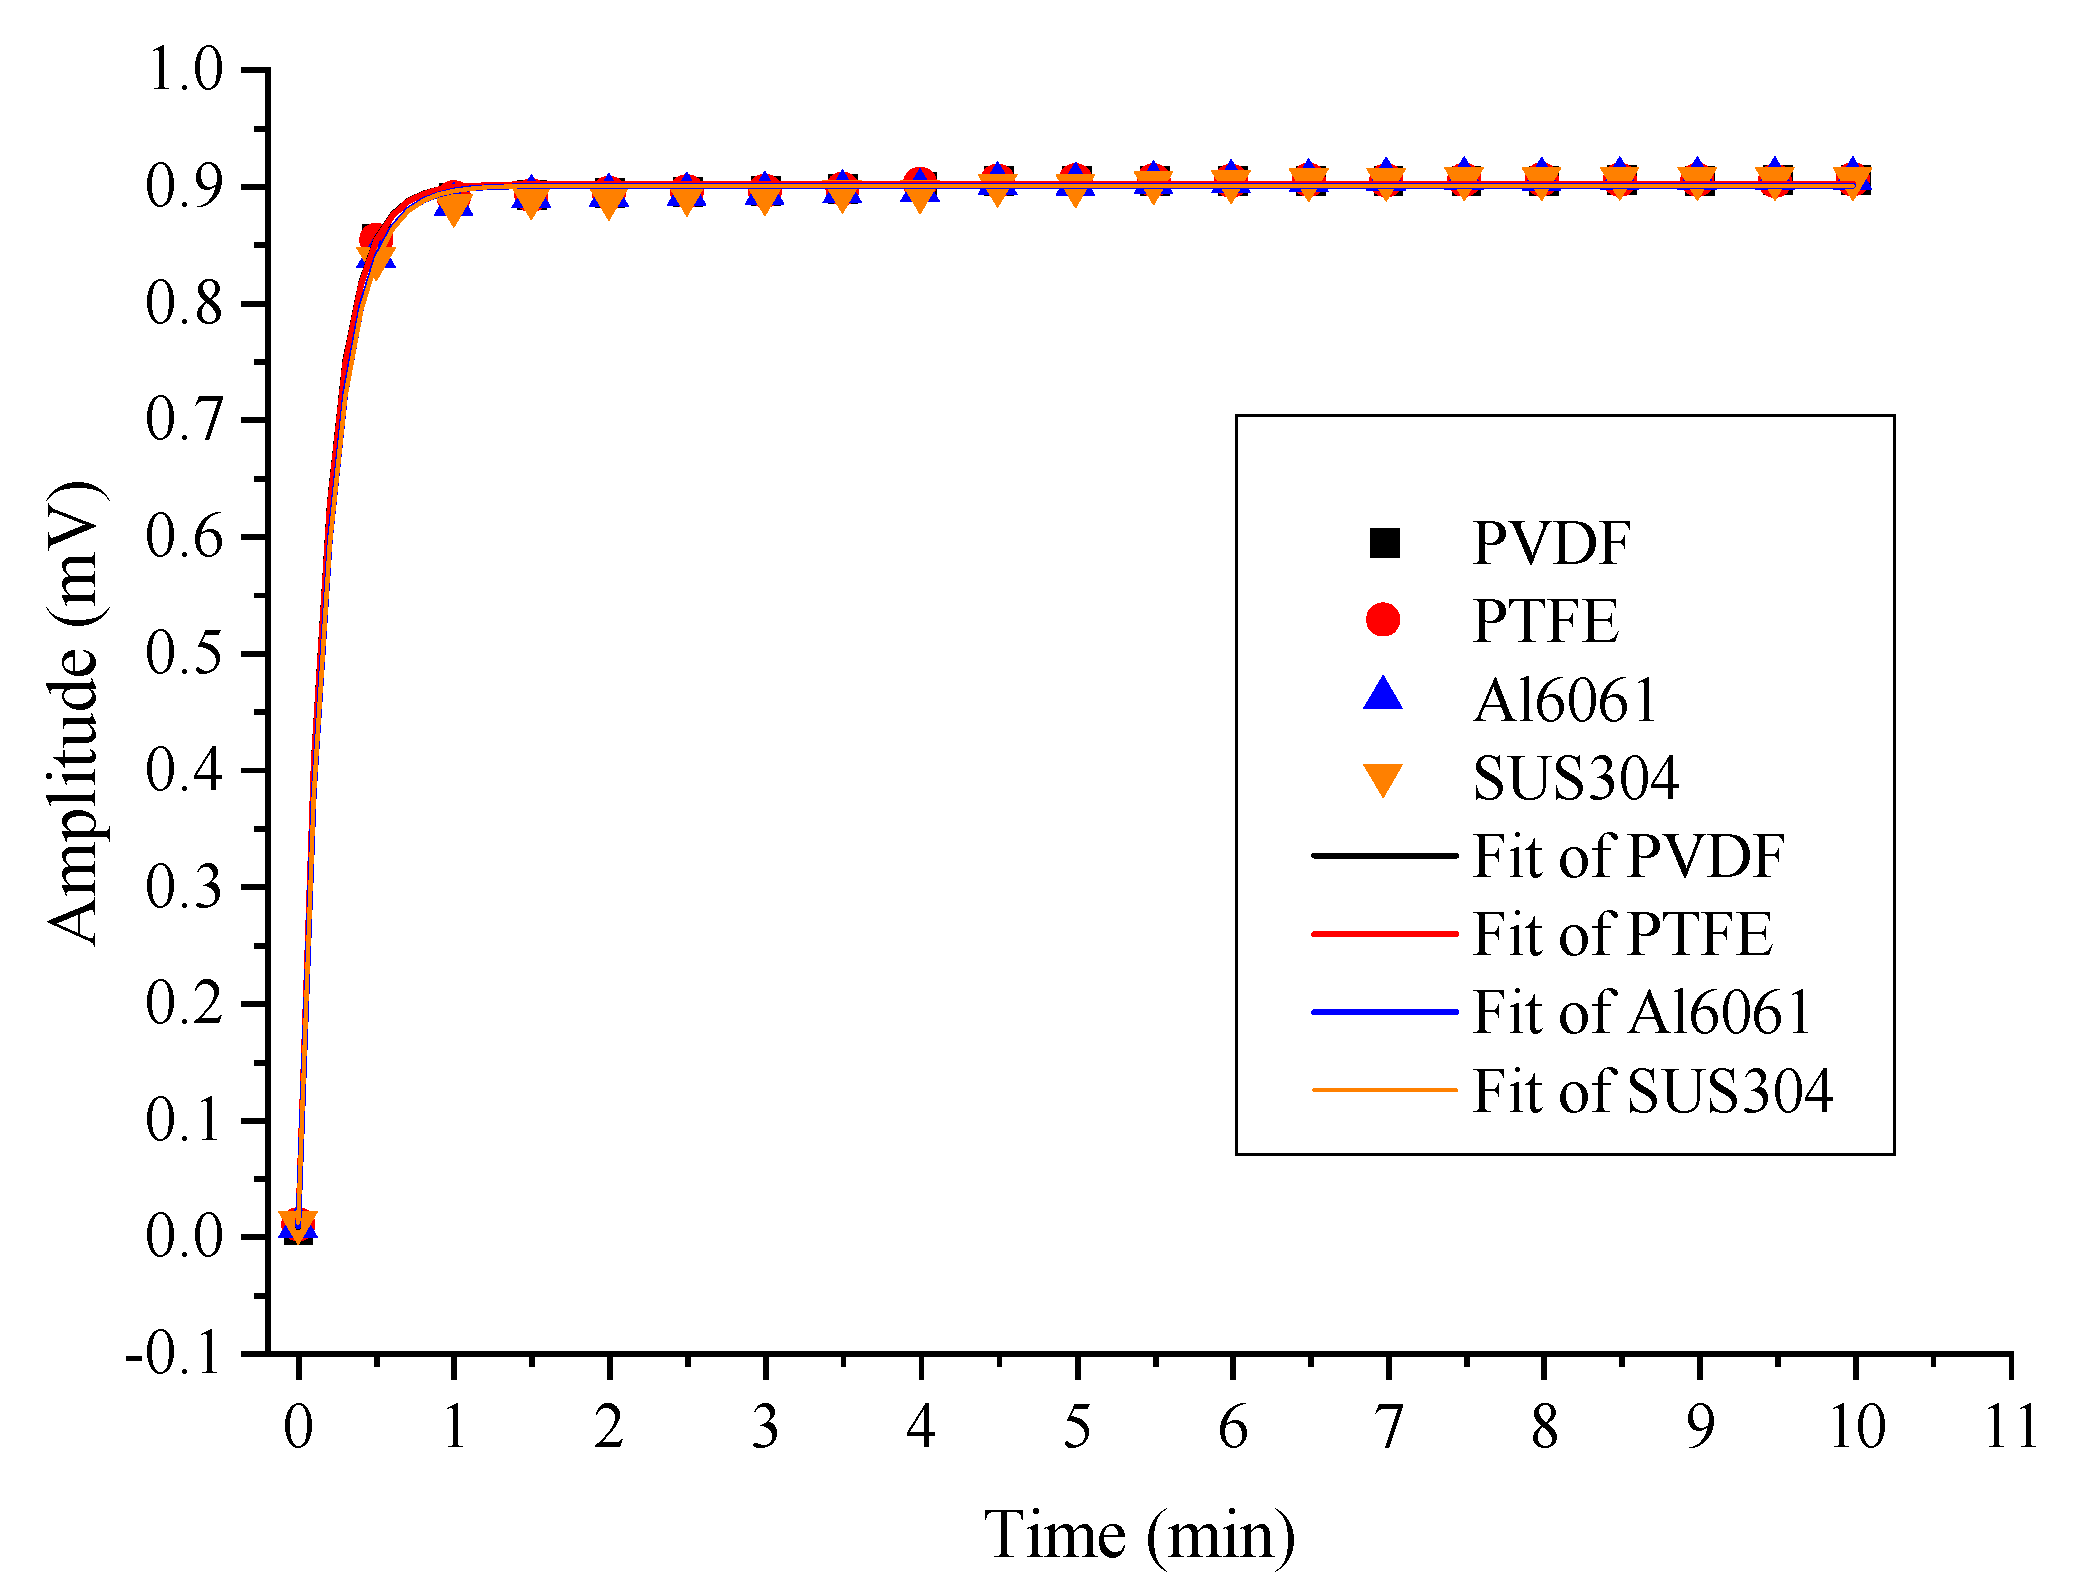
Figure 10.
Amplitude response of four PACs for SOF2.


Table 1.
Measured response of four PACs for SO2F2.
| Materials | Max Value | 90% Max | 90% Response Time |
|---|---|---|---|
| PVDF | 0.9055 | 0.81495 | 24 |
| PTFE | 0.9058 | 0.81522 | 25 |
| Al6061 | 0.9063 | 0.81567 | 27 |
| SUS304 | 0.9065 | 0.81585 | 27 |
Table 2.
Measured response of four PACs for SOF2.
| Materials | Max Value | 90% Max | 90% Response Time |
|---|---|---|---|
| PVDF | 0.47076 | 0.42368 | 28 |
| PTFE | 0.47092 | 0.42383 | 28 |
| Al6061 | 0.47112 | 0.42347 | 34 |
| SUS304 | 0.47116 | 0.42404 | 35 |
Publisher’s Note: MDPI stays neutral with regard to jurisdictional claims in published maps and institutional affiliations. |
© 2022 by the authors. Licensee MDPI, Basel, Switzerland. This article is an open access article distributed under the terms and conditions of the Creative Commons Attribution (CC BY) license (https://creativecommons.org/licenses/by/4.0/).
Share and Cite
MDPI and ACS Style
Zhang, Y.; Wang, M.; Yu, P.; Liu, Z. Optical Gas-Cell Dynamic Adsorption in a Photoacoustic Spectroscopy-Based SOF2 and SO2F2 Gas Sensor. Sensors 2022, 22, 7949. https://doi.org/10.3390/s22207949
AMA Style
Zhang Y, Wang M, Yu P, Liu Z. Optical Gas-Cell Dynamic Adsorption in a Photoacoustic Spectroscopy-Based SOF2 and SO2F2 Gas Sensor. Sensors. 2022; 22(20):7949. https://doi.org/10.3390/s22207949
Chicago/Turabian StyleZhang, Ying, Mingwei Wang, Pengcheng Yu, and Zhe Liu. 2022. "Optical Gas-Cell Dynamic Adsorption in a Photoacoustic Spectroscopy-Based SOF2 and SO2F2 Gas Sensor" Sensors 22, no. 20: 7949. https://doi.org/10.3390/s22207949
Note that from the first issue of 2016, this journal uses article numbers instead of page numbers. See further details here.