
Evaluation of Different Models for Non-Destructive Detection of Tomato Pesticide Residues Based on Near-Infrared Spectroscopy

 ,
,  ,
,  ,
,  and
and 
Abstract
:1. Introduction
2. Materials and Methods
2.1. Sample Preparation
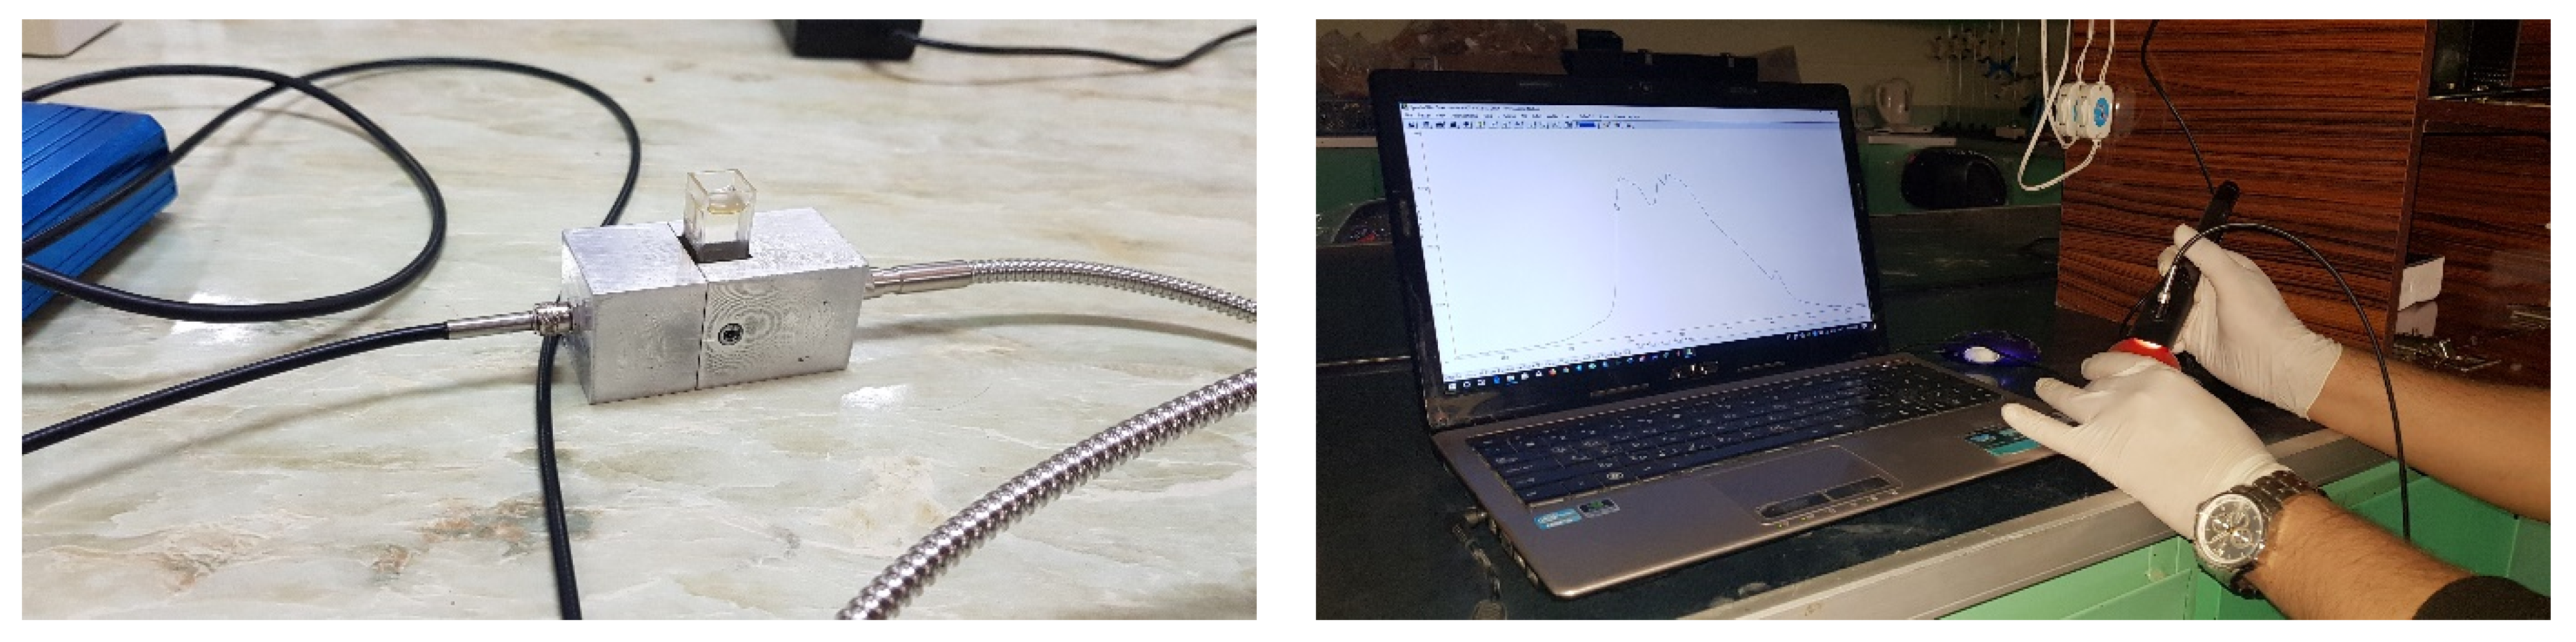
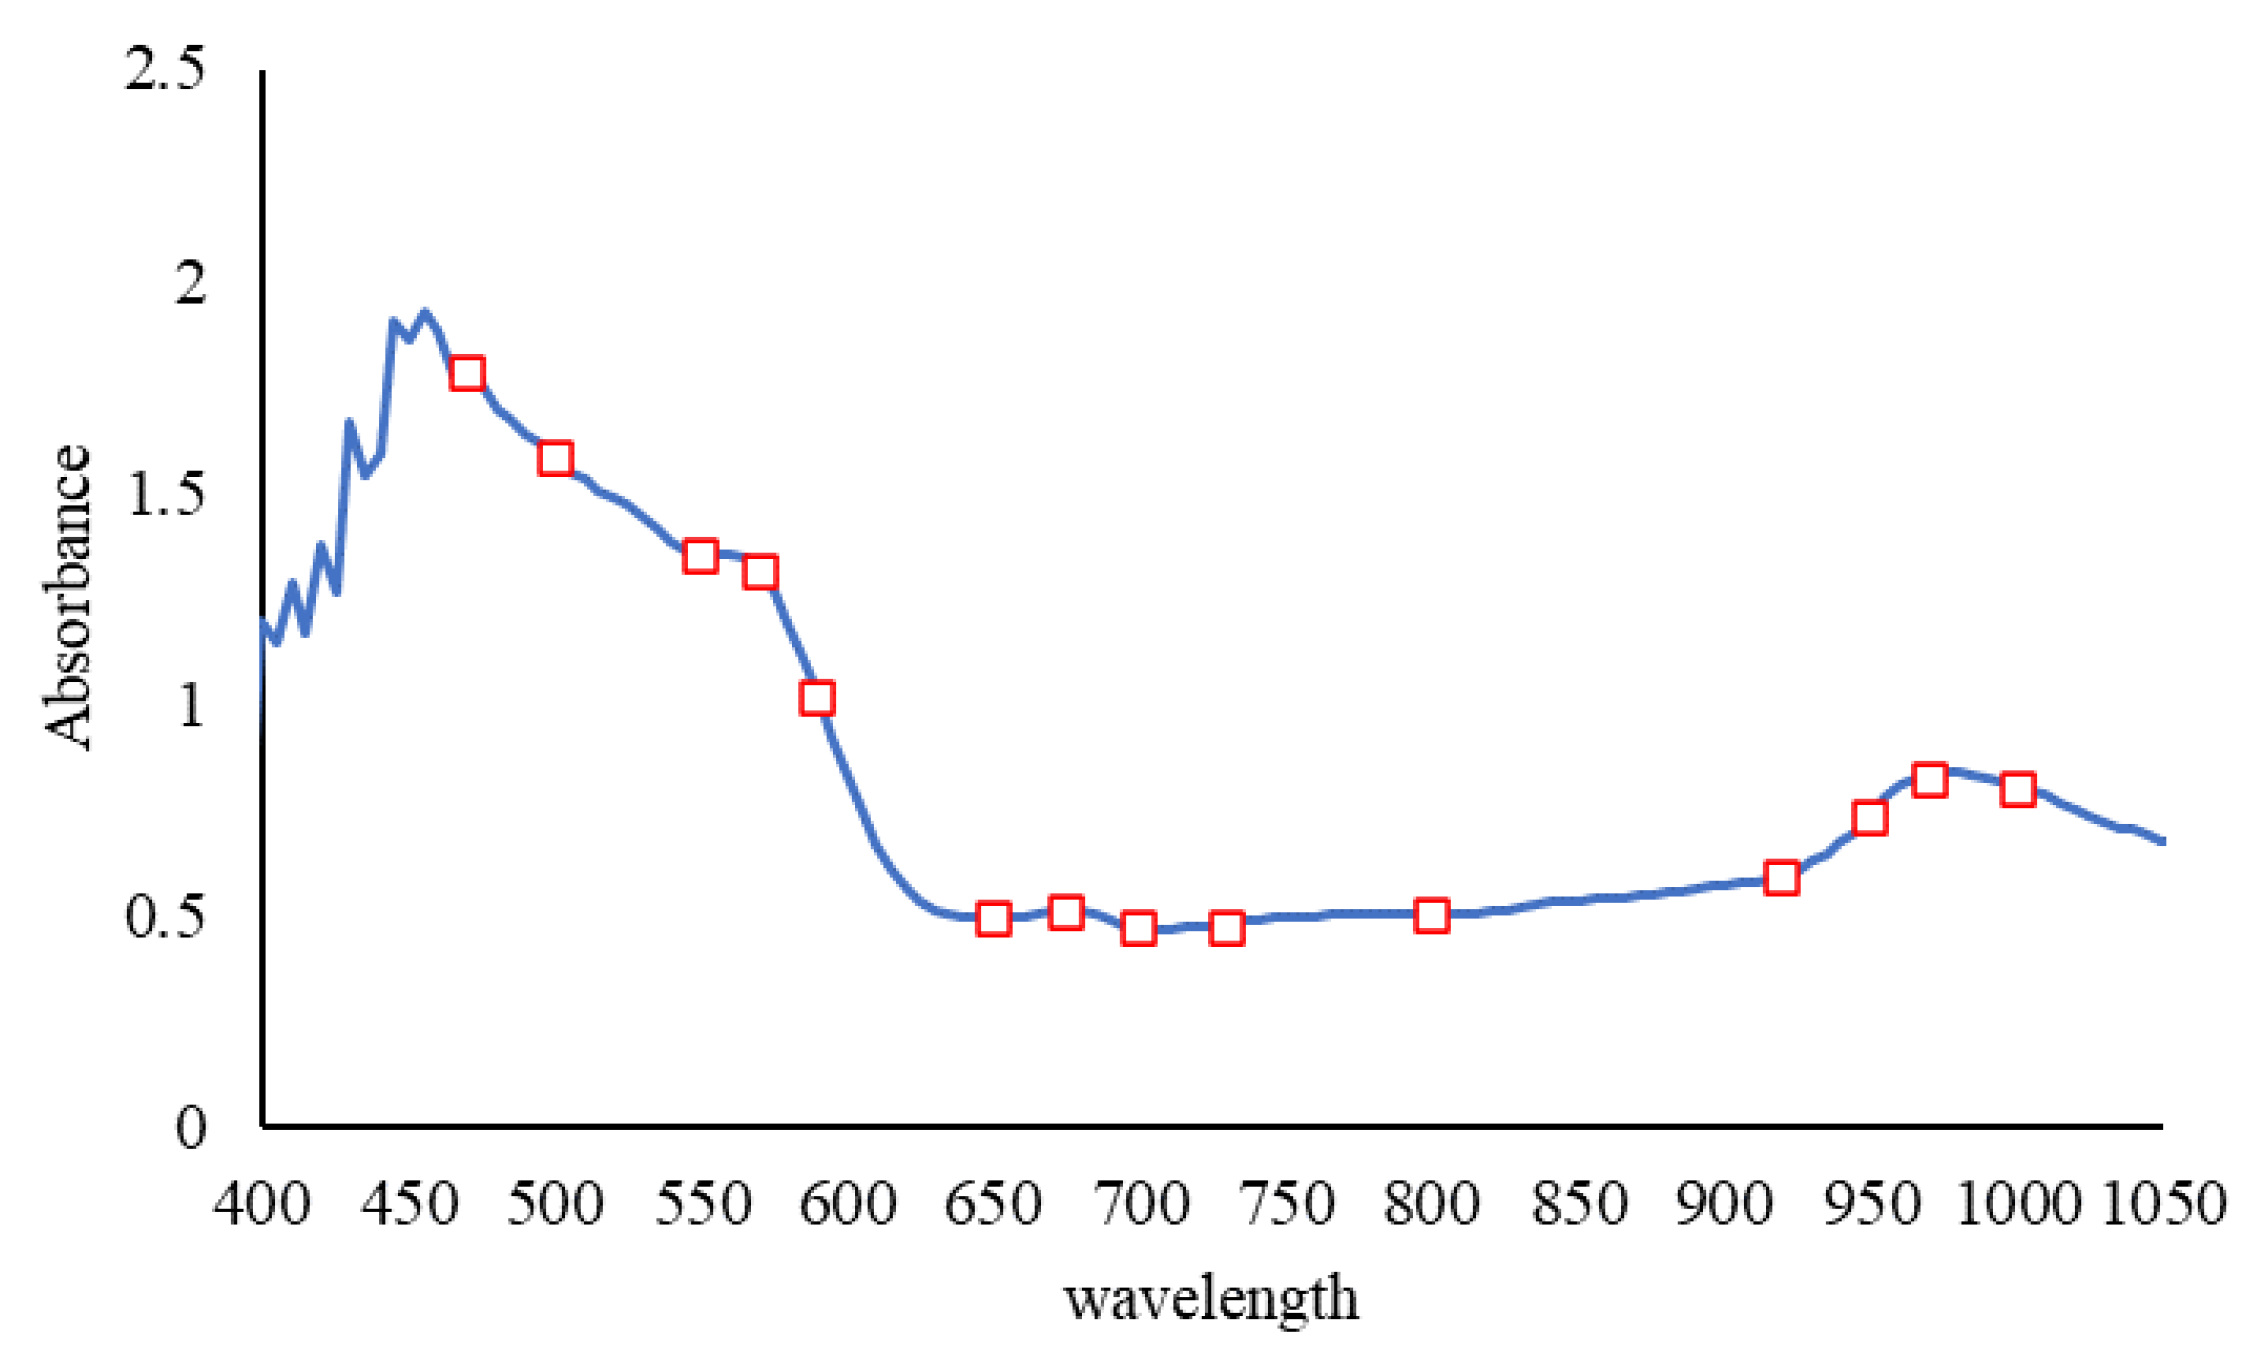
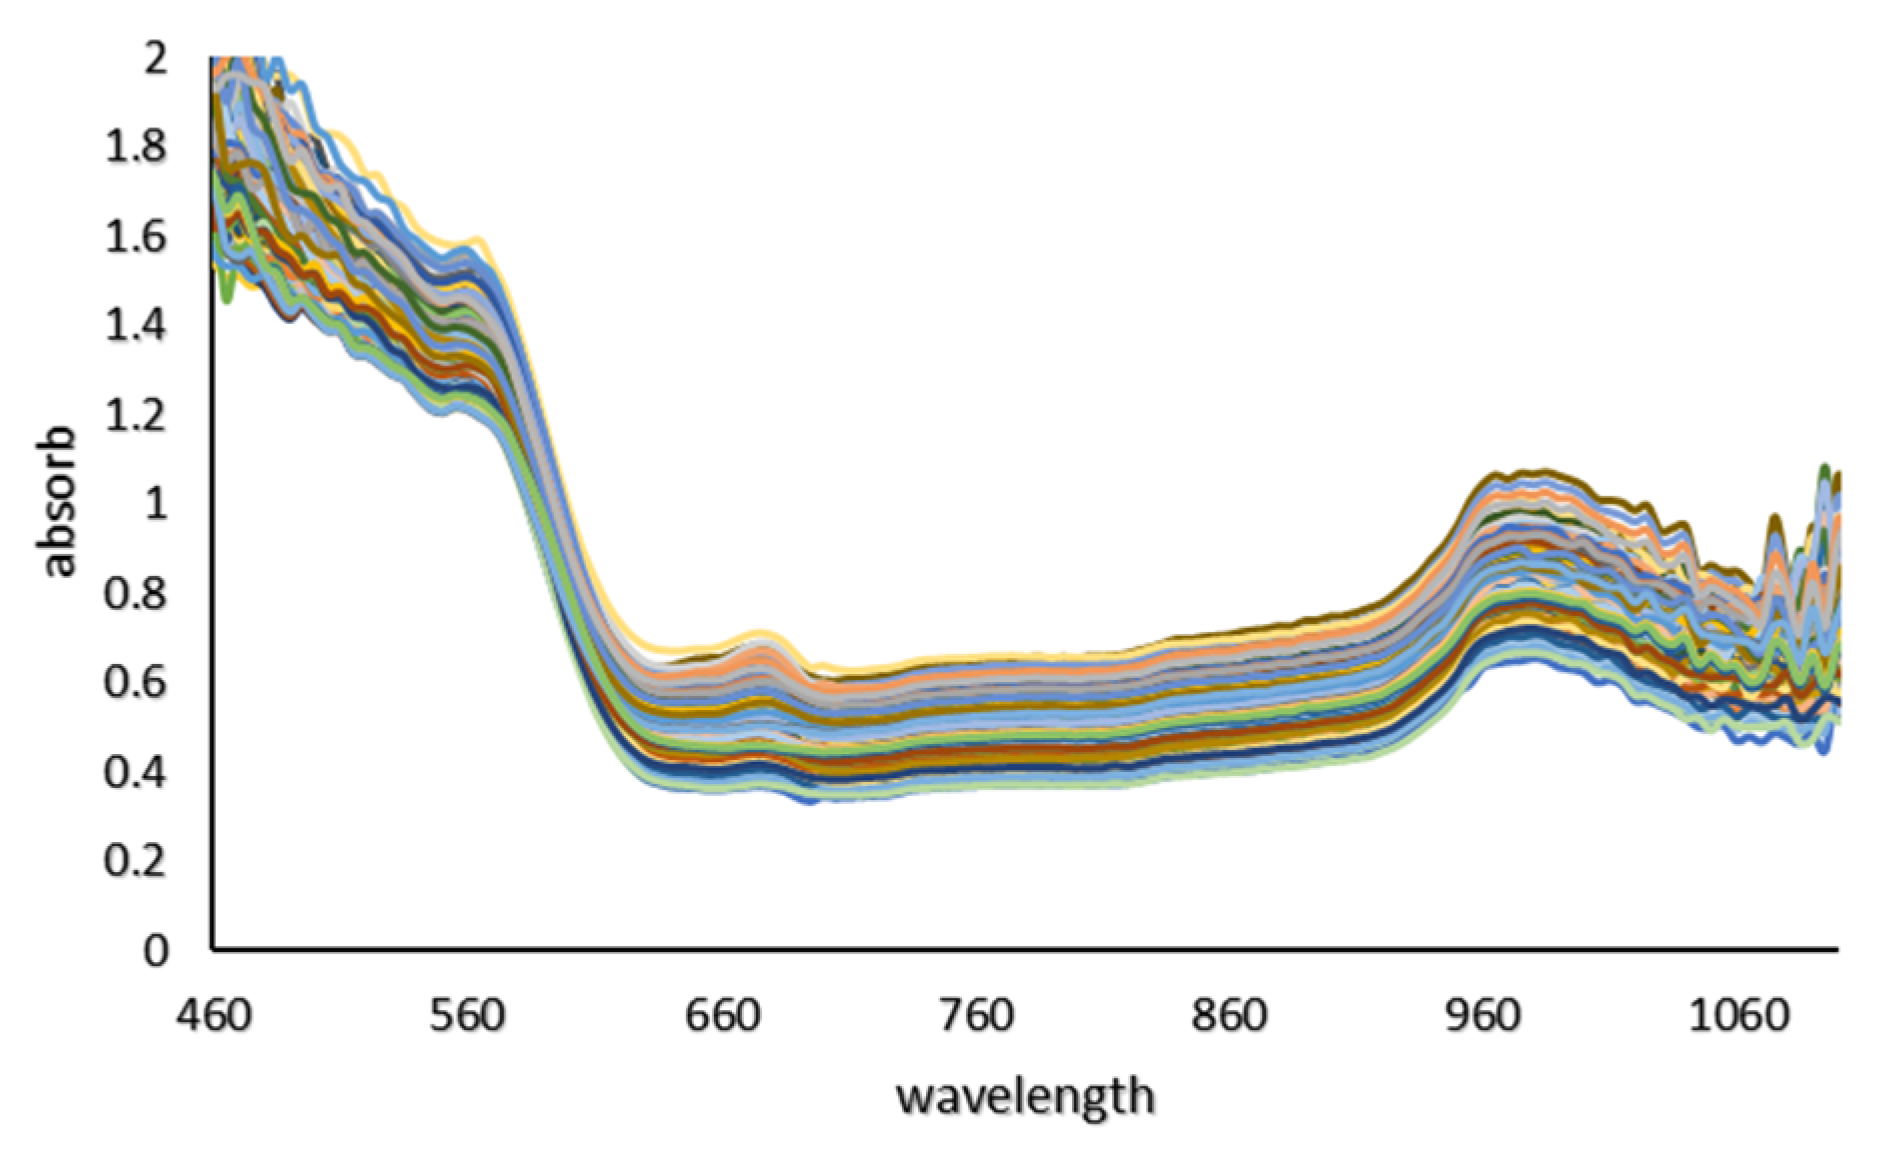
2.2. Vis/NIR Spectroscopy
2.3. Reference Measurements
2.4. Remove the Outlier Data
2.5. Variable Selection Method
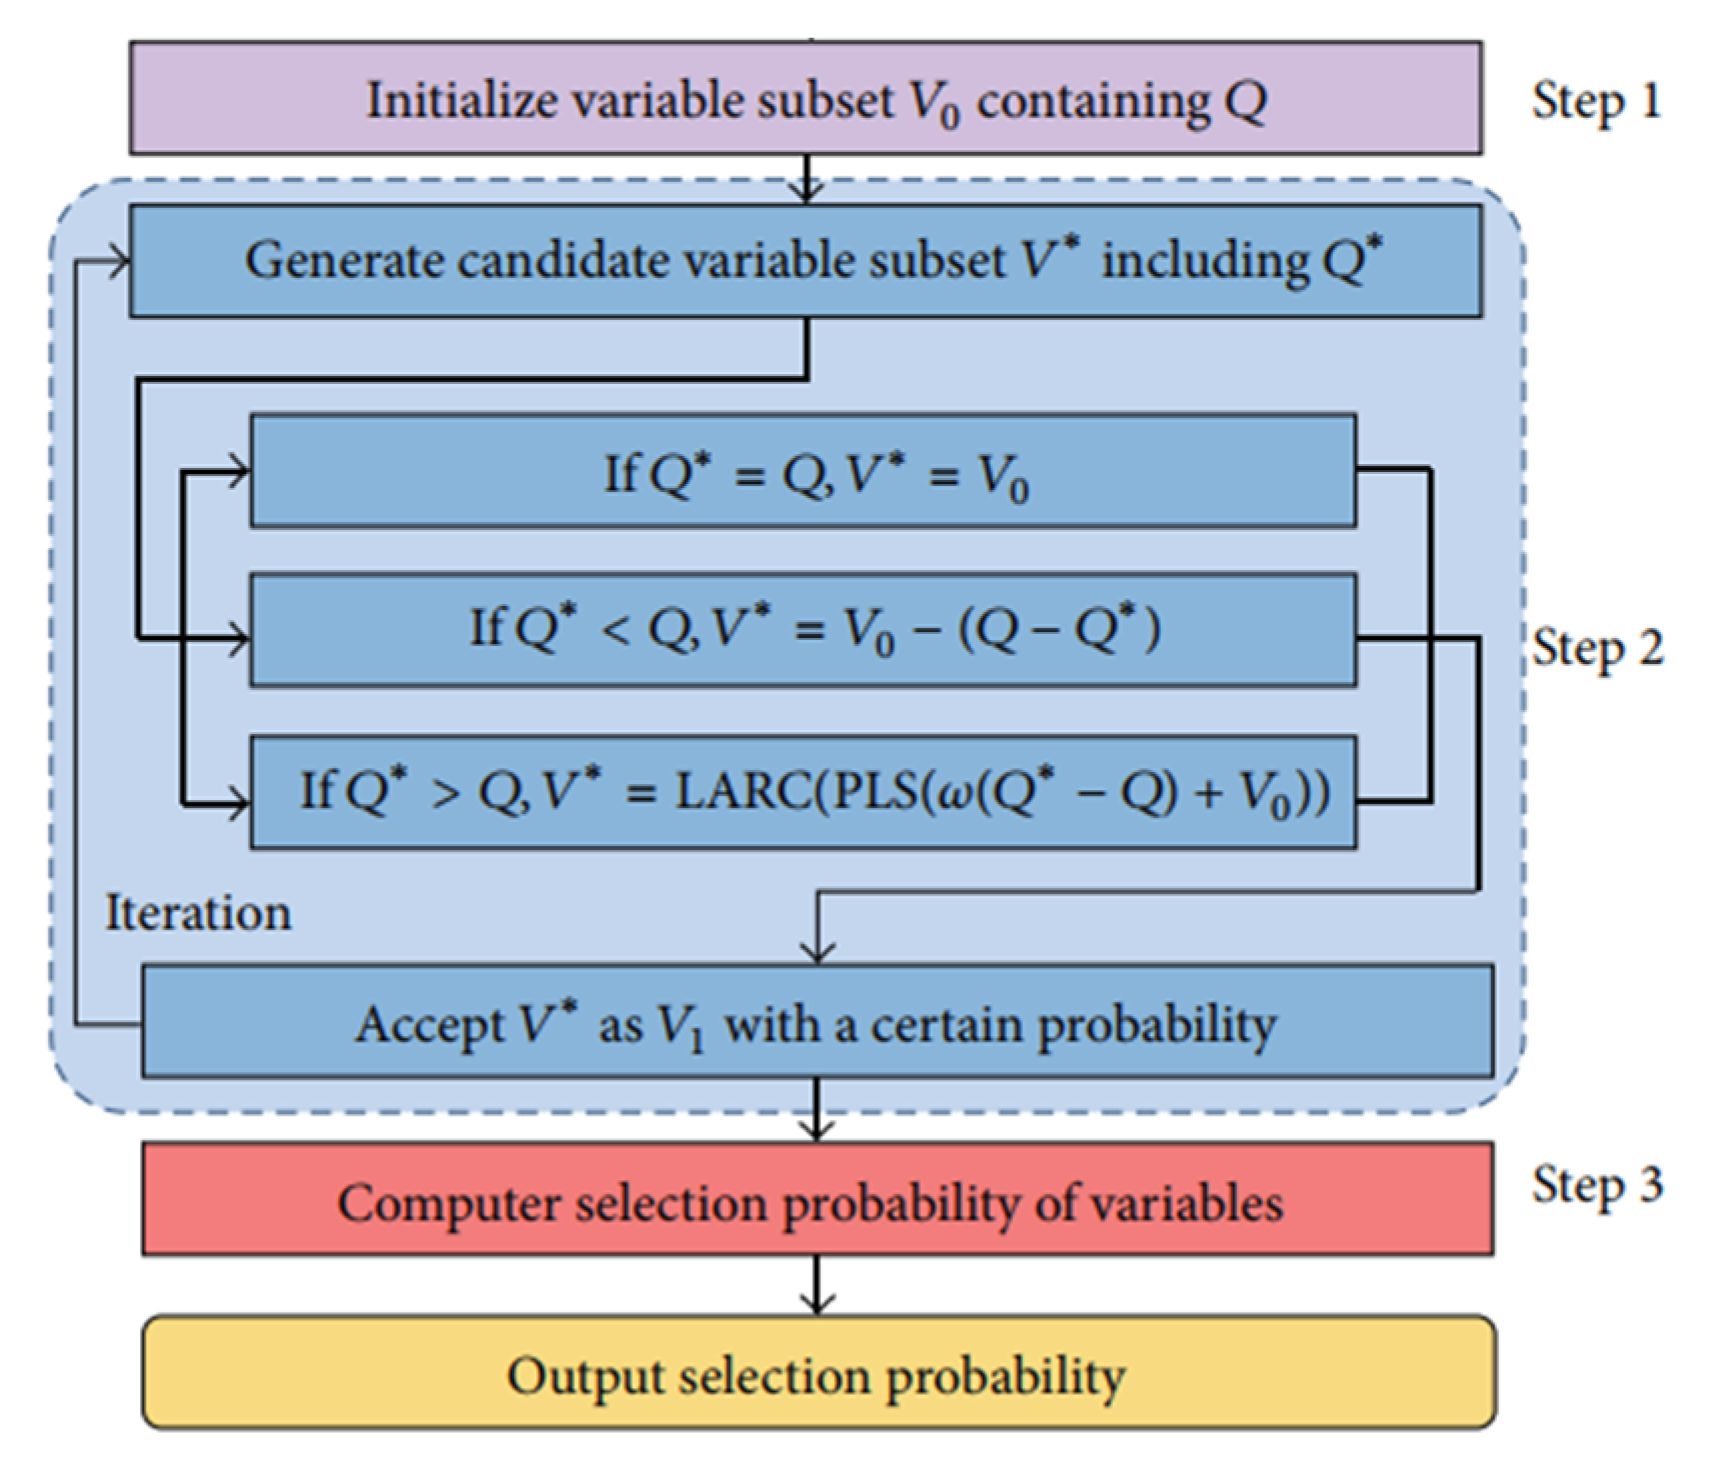
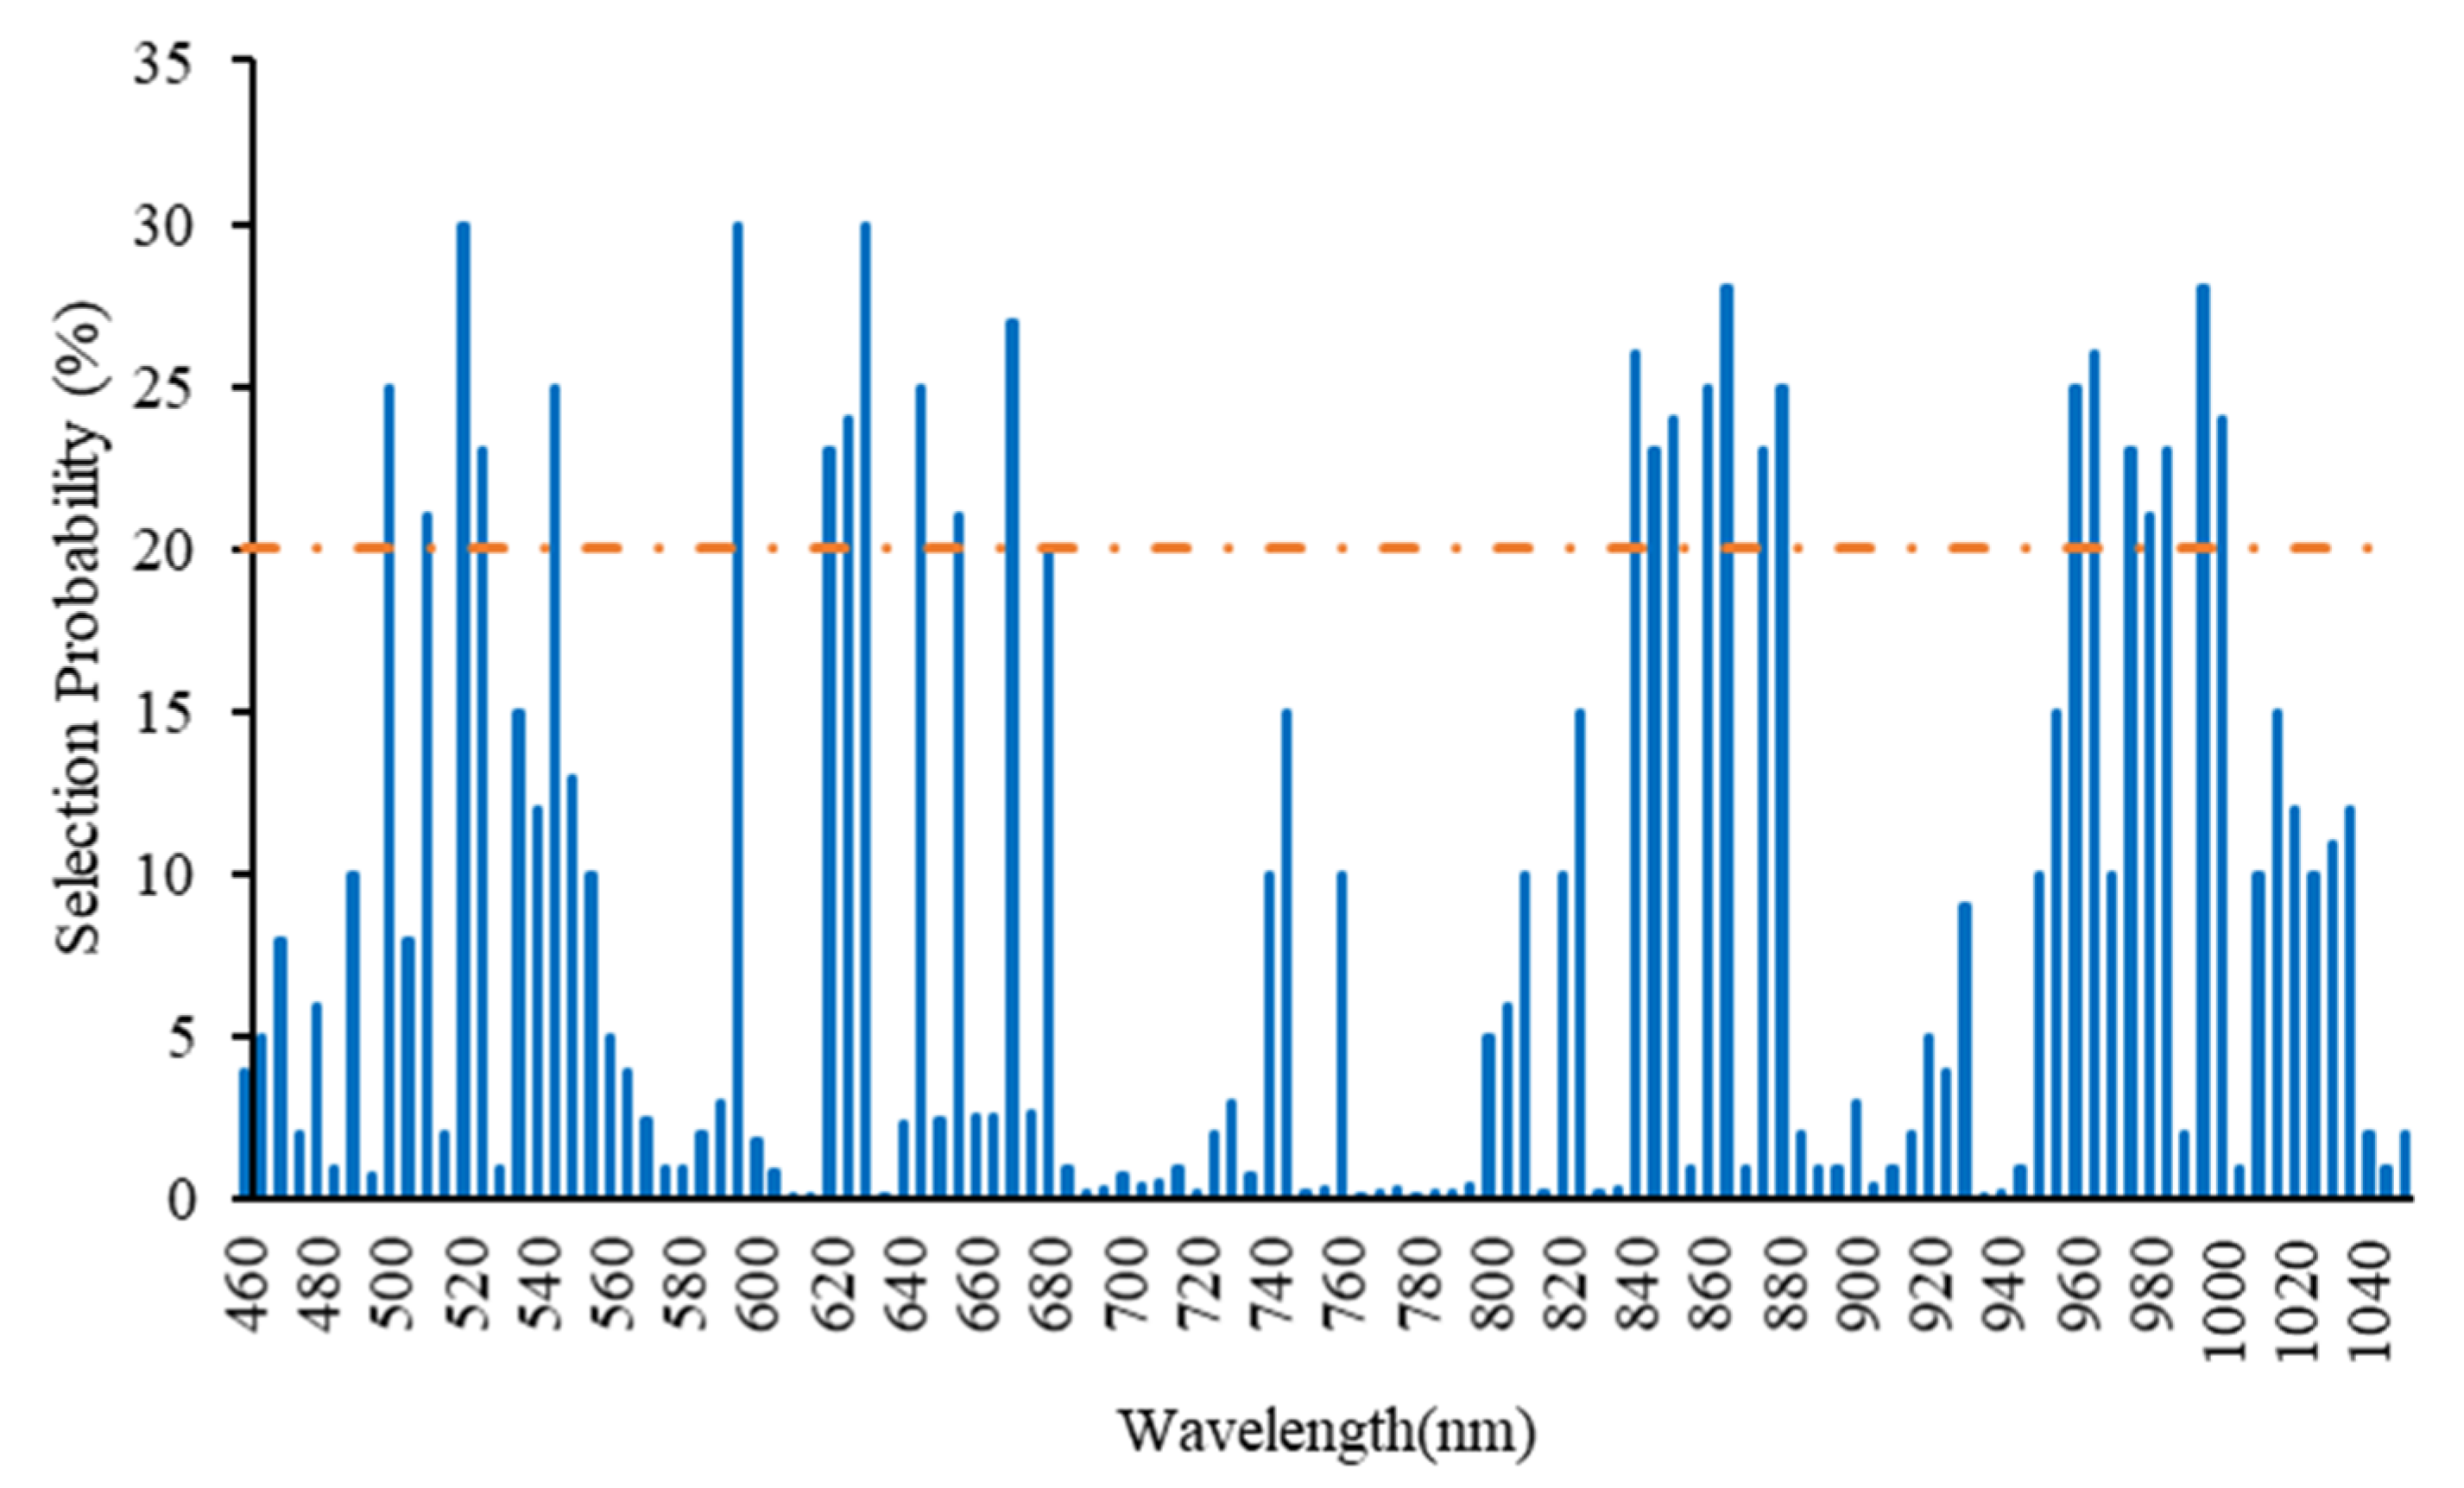
2.5.1. Random frog (RF) Algorithm
2.5.2. SPA
2.5.3. PCA
2.6. Prediction Models
2.6.1. PLSR
2.6.2. BP-ANN
2.7. Model Validation
3. Results and Discussion
Pre-Processing Spectra
4. Conclusions
Author Contributions
Funding
Institutional Review Board Statement
Informed Consent Statement
Data Availability Statement
Conflicts of Interest
Abbreviations
| MRL | Maximum Residue Limit |
| EU | European Union |
| VIS/NIRS | Visible/Near InfraRed Spectroscopy |
| PCA | Principal Component Analysis |
| PLSR | Partial Least Squares Regression |
| ANN | Artificial Neural Network |
| R | Regression Coefficient |
| RMSE | Root Mean Square Error |
| GC | Gas Chromatography |
| HPLC | High-Performance Liquid Chromatography |
| WT | Wavelet Transform |
| LSSVR | Least-Square Support Vector Machine Regression |
| PSO | Particle Swarm Optimization |
| RPD | Residual Prediction Deviation |
| PLS-DA | Partial Least Squares-Discriminant Analysis |
| PHI | Pre-Harvest Interval |
| LOD | Limit of detection |
References
- Zhang, L.; Chen, F.; Zhang, P.; Lai, S.; Yang, H. Influence of rice bran wax coating on the physicochemical properties and pectin nanostructure of cherry tomatoes. Food Bioprocess Technol. 2017, 10, 349–357. [Google Scholar] [CrossRef]
- Sánchez-Moreno, C.; Cano, M.P.; De Ancos, B.; Plaza, L.; Olmedilla, B.; Granado, F.; Martín, A. Effect of orange juice intake on vitamin C concentrations and biomarkers of antioxidant status in humans. Am. J. Clin. Nutr. 2003, 78, 454–460. [Google Scholar] [CrossRef] [PubMed] [Green Version]
- Odriozola-Serrano, I.; Soliva-Fortuny, R.; Martín-Belloso, O. Effect of minimal processing on bioactive compounds and color attributes of fresh-cut tomatoes. LWT Food Sci. Technol. 2008, 41, 217–226. [Google Scholar] [CrossRef]
- Agnihotri, N. Pesticide Safety Evaluation and Monitoring, Published All India Co-Ordinated Research Project on Pesticide Residues Division of Agricultural Chemicals; Indian Agricultural Research Institute: New Delhi, India, 1999. [Google Scholar]
- Chung, S.W.; Chen, B.L. Determination of organochlorine pesticide residues in fatty foods: A critical review on the analytical methods and their testing capabilities. J. Chromatogr. A 2011, 1218, 5555–5567. [Google Scholar] [CrossRef]
- Kabir, K.H.; Rahman, M.A.; Ahmed, M.S.; Prodhan, M.D.H.; Akon, M.W. Pesticide analytical research at BARI related to quality, residue, and maximum residue limit. In Proceedings of the Workshop on Maximum Residue Limits of Pesticides in Agricultural Commodities and Food in Bangladesh, Dhaka, Bangladesh, 1 April 2007. [Google Scholar]
- Cho, T.; Kim, B.; Jo, S.; Kang, H.; Choi, B.; Kim, M. Pesticide residue monitoring in Korean agricultural products, 2003–2005. Food Addit. Contam. B 2009, 2, 27–37. [Google Scholar] [CrossRef]
- Barnat, S.; Boisset, M.; Casse, F.; Catteau, M.; Lecerf, J.-M.; Veschambre, D.; Périquet, A. Pesticide residues intake of French adults under increased consumption of fresh fruits and vegetables—A theoretical study. J. Environ. Sci. Heal. B 2010, 45, 102–107. [Google Scholar] [CrossRef]
- Knežević, Z.; Serdar, M. Screening of fresh fruit and vegetables for pesticide residues on Croatian market. Food Control 2009, 20, 419–422. [Google Scholar] [CrossRef]
- Claeys, W.L.; Schmit, J.-F.; Bragard, C.; Maghuin-Rogister, G.; Pussemier, L.; Schiffers, B. Exposure of several Belgian consumer groups to pesticide residues through fresh fruit and vegetable consumption. Food Control 2011, 22, 508–516. [Google Scholar] [CrossRef] [Green Version]
- Omirou, M.; Vryzas, Z.; Papadopoulou-Mourkidou, E.; Economou, A. Dissipation rates of iprodione and thiacloprid during tomato production in greenhouse. Food Chem. 2009, 116, 499–504. [Google Scholar] [CrossRef]
- Gambacorta, G.; Faccia, M.; Lamacchia, C.; Di Luccia, A.; La Notte, E. Pesticide residues in tomato grown in open field. Food Control. 2005, 16, 629–632. [Google Scholar] [CrossRef]
- Luypaert, J.; Zhang, M.; Massart, D. Feasibility study for the use of near infrared spectroscopy in the qualitative and quantitative analysis of green tea, Camellia sinensis (L.). Anal. Chim. Acta 2003, 478, 303–312. [Google Scholar] [CrossRef]
- Peng, Y.; Lu, R. Analysis of spatially resolved hyperspectral scattering images for assessing apple fruit firmness and soluble solids content. Postharvest Biol. Technol. 2008, 48, 52–62. [Google Scholar] [CrossRef]
- Peng, Y.; Zhang, J.; Wu, J.; Hang, H. Hyperspectral scattering profiles for prediction of the microbial spoilage of beef. In Sensing for Agriculture and Food Quality and Safety; International Society for Optics and Photonics: Bellingham, WA, USA, 2009. [Google Scholar]
- Sharabiani, V.R.; Nazarloo, A.S.; Taghinezhad, E. Prediction of Protein Content of Winter Wheat by Canopy of Near Infrared Spectroscopy (NIRS), using Partial Least Squares Regression (PLSR) and Artificial Neural Network (ANN) models. Yüzüncü Yıl Üniversitesi Tarım Bilimleri Derg. 2019, 29, 43–51. [Google Scholar] [CrossRef]
- Soltani, A.; Noguchi, N. Multivariate analyzing and artificial neural networks for prediction of protein content in winter wheat using spectral characteristics. Sci. Bus. Soc. 2018, 3, 153–157. [Google Scholar]
- Nazarloo, A.S.; Sharabiani, V.R.; Gilandeh, Y.A.; Taghinezhad, E.; Szymanek, M.; Sprawka, M. Feasibility of using VIS/NIR spectroscopy and multivariate analysis for pesticide residue detection in tomatoes. Processes 2021, 9, 196. [Google Scholar] [CrossRef]
- Jamshidi, B.; Mohajerani, E.; Jamshidi, J.; Minaei, S.; Sharifi, A.; Malvajerdi, A.S. Non-destructive detection of pesticide residues in cucumber using visible/near-infrared spectroscopy. Food Addit. Contam. A 2015, 32, 857–863. [Google Scholar] [CrossRef]
- Sánchez, M.-T.; Flores-Rojas, K.; Guerrero, J.E.; Garrido-Varo, A.; Pérez-Marín, D. Measurement of pesticide residues in peppers by near-infrared reflectance spectroscopy. Pest Manag. Sci. 2010, 66, 580–586. [Google Scholar] [CrossRef]
- Jamshidi, B. Non-destructive safety assessment of agricultural products using Vis/NIR spectroscopy. NIR News 2017, 28, 4–8. [Google Scholar] [CrossRef]
- Yazici, A.; Tiryaki, G.Y.; Ayvaz, H. Determination of pesticide residual levels in strawberry (Fragaria) by near-infrared spectroscopy. J. Sci. Food Agric. 2020, 100, 1980–1989. [Google Scholar] [CrossRef] [PubMed]
- Hu, L.; Yin, C.; Ma, S.; Liu, Z. Vis-NIR spectroscopy combined with wavelengths selection by PSO optimization algorithm for simultaneous determination of four quality parameters and classification of soy sauce. Food Anal. Methods 2019, 12, 633–643. [Google Scholar] [CrossRef]
- Quiñones, M.d.C.S.; M artínez, L.A.O.; Herrera, S.M.G.; Quiñones, O.M.R.; Lared, R.F.G. Near-Infrared Spectroscopy (NIRS) applied to legume analysis: A Review. Spectroscopy 2018, 8. [Google Scholar]
- Williams, P. Near Infrared Technology: Getting the Best Out of Light; African Sun Media: Stellenbosch, South Africa, 2019. [Google Scholar]
- Saranwong, I.; Kawano, S. Rapid determination of fungicide contaminated on tomato surfaces using the DESIR-NIR: A system for ppm-order concentration. J. Near Infrared Spectrosc. 2005, 13, 169–175. [Google Scholar] [CrossRef]
- Teye, E.; Huang, X.-Y.; Afoakwa, N. Review on the potential use of near infrared spectroscopy (NIRS) for the measurement of chemical residues in food. Am. J. Food Sci. Technol. 2013, 1, 1–8. [Google Scholar]
- Watanabe, E.; Kobara, Y.; Baba, K.; Eun, H. Determination of seven neonicotinoid insecticides in cucumber and eggplant by water-based extraction and high-performance liquid chromatography. Anal. Lett. 2015, 48, 213–220. [Google Scholar] [CrossRef]
- Jun, S.; Xin, Z.; Xiaohong, W.; Bing, L.; Chunxia, D.; Jifeng, S. Research and analysis of cadmium residue in tomato leaves based on WT-LSSVR and Vis-NIR hyper-spectral imaging. Spectrochimica Acta A Mol. Biomol. Spectrosc. 2019, 212, 215–221. [Google Scholar] [CrossRef]
- Chen, J.; Peng, Y.; Li, Y.; Wang, W.; Wu, J. A method for determining organophosphorus pesticide concentration based on near-infrared spectroscopy. Trans. ASABE 2011, 54, 1025–1030. [Google Scholar] [CrossRef]
- Fen, D.; Tiansheng, H.; Kun, Z.; Ya, H. Nondestructive detection of pesticide residue on longan surface based on near infrared spectroscopy. In Proceedings of the 2010 International Conference on Intelligent Computation Technology and Automation, Institute of Electrical and Electronics Engineers (IEEE), Changsha, China, 11–12 May 2010; Volume 2, pp. 781–783. [Google Scholar]
- Jiang, B.; He, J.; Yang, S.; Fu, H.; Li, T.; Song, H.; He, D. Fusion of machine vision technology and AlexNet-CNNs deep learning network for the detection of postharvest apple pesticide residues. Artif. Intell. Agric. 2019, 1, 1–8. [Google Scholar] [CrossRef]
- Wei, Z. Determination of organophosphorus pesticides in cider by GC-MS coupled with cloud point extraction. Sci. Technol. Food Ind. 2017, 23, 225–231. [Google Scholar]
- Xue, L.; Cai, J.; Li, J.; Liu, M. Application of Particle Swarm Optimization (PSO) algorithm to determine dichlorvos residue on the surface of navel orange with Vis-NIR spectroscopy. Procedia Eng. 2012, 29, 4124–4128. [Google Scholar] [CrossRef] [Green Version]
- González-Martín, M.; Revilla, I.; Vivar-Quintana, A.; Salcedo, E.B. Pesticide residues in propolis from Spain and Chile. An approach using near infrared spectroscopy. Talanta 2017, 165, 533–539. [Google Scholar] [CrossRef] [PubMed]
- Anastassiades, M.; Lehotay, S.J.; Štajnbaher, D.; Schenck, F.J. Fast, and easy multiresidue method employing acetonitrile extraction/partitioning and “dispersive solid-phase extraction” for the determination of pesticide residues in produce. J. AOAC Int. 2003, 86, 412–431. [Google Scholar] [CrossRef] [PubMed] [Green Version]
- Ciscato, C.; Barbosa, C.; Gebara, A. Analysis of Pesticide Residues in Mango by GC/MS/MS with Bond Elut QuEChERS EN Kits. Available online: https://www.agilent.com/cs/library/applications/5991-6054EN.pdf (accessed on 26 April 2021).
- Xiao-yu, Y.; Gui-shan, L.; Jia-xing, D.; Ya-bin, C.; Meng-meng, F.; Chao, M.; Jian-guo, H. A rapid evaluation of vc content on lingwu long jujube using hyperspectral technique. Spectrosc. Spectr. Anal. 2019, 39, 230–234. [Google Scholar]
- Liu, Z.; Cai, W.; Shao, X. Outlier detection in near-infrared spectroscopic analysis by using Monte Carlo cross-validation. Sci. China Ser. B Chem. 2008, 51, 751–759. [Google Scholar] [CrossRef]
- Gao, Q.; Wang, M.; Guo, Y.; Zhao, X.; He, D. Comparative analysis of non-destructive prediction model of soluble solids content for malus micro malus makino based on near-infrared spectroscopy. IEEE Access 2019, 7, 128064–128075. [Google Scholar] [CrossRef]
- Maldonado, A.I.L.; Rodriguez-Fuentes, H.; Contreras, J.A.V. Hyperspectral Imaging in Agriculture, Food and Environment; BoD–Books on Demand: Norderstedt, Germany, 2018. [Google Scholar]
- Zhao, Y.-R.; Yu, K.-Q.; He, Y. Hyperspectral imaging coupled with random frog and calibration models for assessment of total soluble solids in mulberries. J. Anal. Methods Chem. 2015, 2015. [Google Scholar] [CrossRef] [PubMed] [Green Version]
- Luo, W.; Du, Y.-Z.; Zhang, H.-L. Discrimination of varieties of cabbage with near infrared spectra based on principal component analysis and successive projections algorithm. Guang Pu Xue Yu Guang Pu Fen Xi = Guang Pu 2016, 36, 3536–3541. [Google Scholar] [PubMed]
- Wang, Y.; Sun, F.; Li, X. Compound dimensionality reduction based multi-dynamic kernel principal component analysis monitoring method for batch process with large-scale data sets. J. Intell. Fuzzy Syst. 2020, 38, 471–480. [Google Scholar] [CrossRef]
- Brereton, R. Principal component analysis: The method. In Chemometrics. Data Analysis for the Laboratory and Chemical Plant; R.G. Brereton, Ed.; John Wiley and Sons, Ltd.: Chichester, UK, 2003; pp. 191–223. [Google Scholar]
- Miller, J.; Miller, J.C. Statistics and Chemometrics for Analytical Chemistry; Pearson Education: London, UK, 2018. [Google Scholar]
- Wold, S.; Sjöström, M.; Eriksson, L. PLS-regression: A basic tool of chemometrics. Chemom. Intell. Lab. Syst. 2001, 58, 109–130. [Google Scholar] [CrossRef]
- Nturambirwe, J.F.I.; Nieuwoudt, H.H.; Perold, W.J.; Opara, U.L. Non-destructive measurement of internal quality of apple fruit by a contactless NIR spectrometer with genetic algorithm model optimization. Sci. Afr. 2019, 3, e00051. [Google Scholar] [CrossRef]
- Khoshnoudi-Nia, S.; Moosavi-Nasab, M. Comparison of various chemometric analysis for rapid prediction of thiobarbituric acid reactive substances in rainbow trout fillets by hyperspectral imaging technique. Food Sci. Nutr. 2019, 7, 1875–1883. [Google Scholar] [CrossRef] [PubMed]
- Wang, H.; Peng, J.; Xie, C.; Bao, Y.; He, Y. Fruit quality evaluation using spectroscopy technology: A review. Sensors 2015, 15, 11889–11927. [Google Scholar] [CrossRef] [PubMed] [Green Version]
- Lin, S.; Huang, X. Advances in computer science, environment, ecoinformatics, and education, Part III. In Proceedings of the International Conference, CSEE 2011, Wuhan, China, 21–22 August 2011. [Google Scholar]
- Shao, Y.; He, Y. Visible/Near infrared spectroscopy and chemometrics for the prediction of trace element (Fe and Zn) levels in rice leaf. Sensors 2013, 13, 1872–1883. [Google Scholar] [CrossRef] [PubMed] [Green Version]
- Shan, R.; Chen, Y.; Meng, L.; Li, H.; Zhao, Z.; Gao, M.; Sun, X. Rapid prediction of atrazine sorption in soil using visible near-infrared spectroscopy. Spectrochim. Acta A Mol. Biomol. Spectrosc. 2020, 224, 117455. [Google Scholar] [CrossRef]
- Yi, S.; Deng, L.; He, S.; Zheng, Y.; Zhang, X. Research on nitrogen content of leaf of Jincheng orange cultivar using visible near infrared spectroscopy model. J. Fruit Sci. 2010, 27, 13–17. [Google Scholar]
- Sun, J.; Yang, W.; Feng, M.; Liu, Q.; Kubar, M.S. An efficient variable selection method based on random frog for the multivariate calibration of NIR spectra. RSC Adv. 2020, 10, 16245–16253. [Google Scholar] [CrossRef] [Green Version]


| Analytical Column | HP-5 ms Ultra Inert 30 m × 250 μm, 0.25 μm (p/n 19091S-433UI) |
|---|---|
| Injection volume | 1 μL |
| Injection mode | Spitless |
| Inlet temperature | 280 °C |
| Liner | UI, split less, single taper, glass wool (p/n 5190-2293) |
| Plated seal kit | Gold Seal, Ultra Inert, with washer (p/n 5190-6144) |
| Carrier gas | Helium, constant flow, 1 mL/min |
| Oven program | 60 °C for 1 min |
| then 40 °C/min to 170 °C | |
| then 10 °C/min to 310 °C | |
| then hold for 2 min | |
| Transfer line temperature | 280 °C |
| Profenofos (mg/kg) | ||||
|---|---|---|---|---|
| Number | Range | Mean | Standard Deviation | |
| calibration | 112 | n.d. *–42.9 | 14.0 | 10.1 |
| validation | 48 | n.d.–34.0 | 13.7 | 8.9 |
| Pre-Processing | RMSECV | RCV | LV |
|---|---|---|---|
| No preprocessing | 5.7129 | 0.8609 | 15 |
| Smoothing-moving average | 4.2562 | 0.9254 | 13 |
| Smoothing-gaussian filter | 4.2680 | 0.9251 | 14 |
| Smoothing-median filter | 5.2481 | 0.8847 | 13 |
| Smoothing | 4.1379 | 0.9295 | 15 |
| Maximum normalize | 5.5788 | 0.8679 | 11 |
| 1derivative (S-Golay) | 7.6328 | 0.7522 | 15 |
| SNV | 6.8656 | 0.7978 | 13 |
| MSC | 7.1441 | 0.7828 | 15 |
| (Smoothing-Gaussian) + (smoothing median) | 7.0276 | 0.7778 | 11 |
| Normalize + Gaussian | 5.9218 | 0.8490 | 10 |
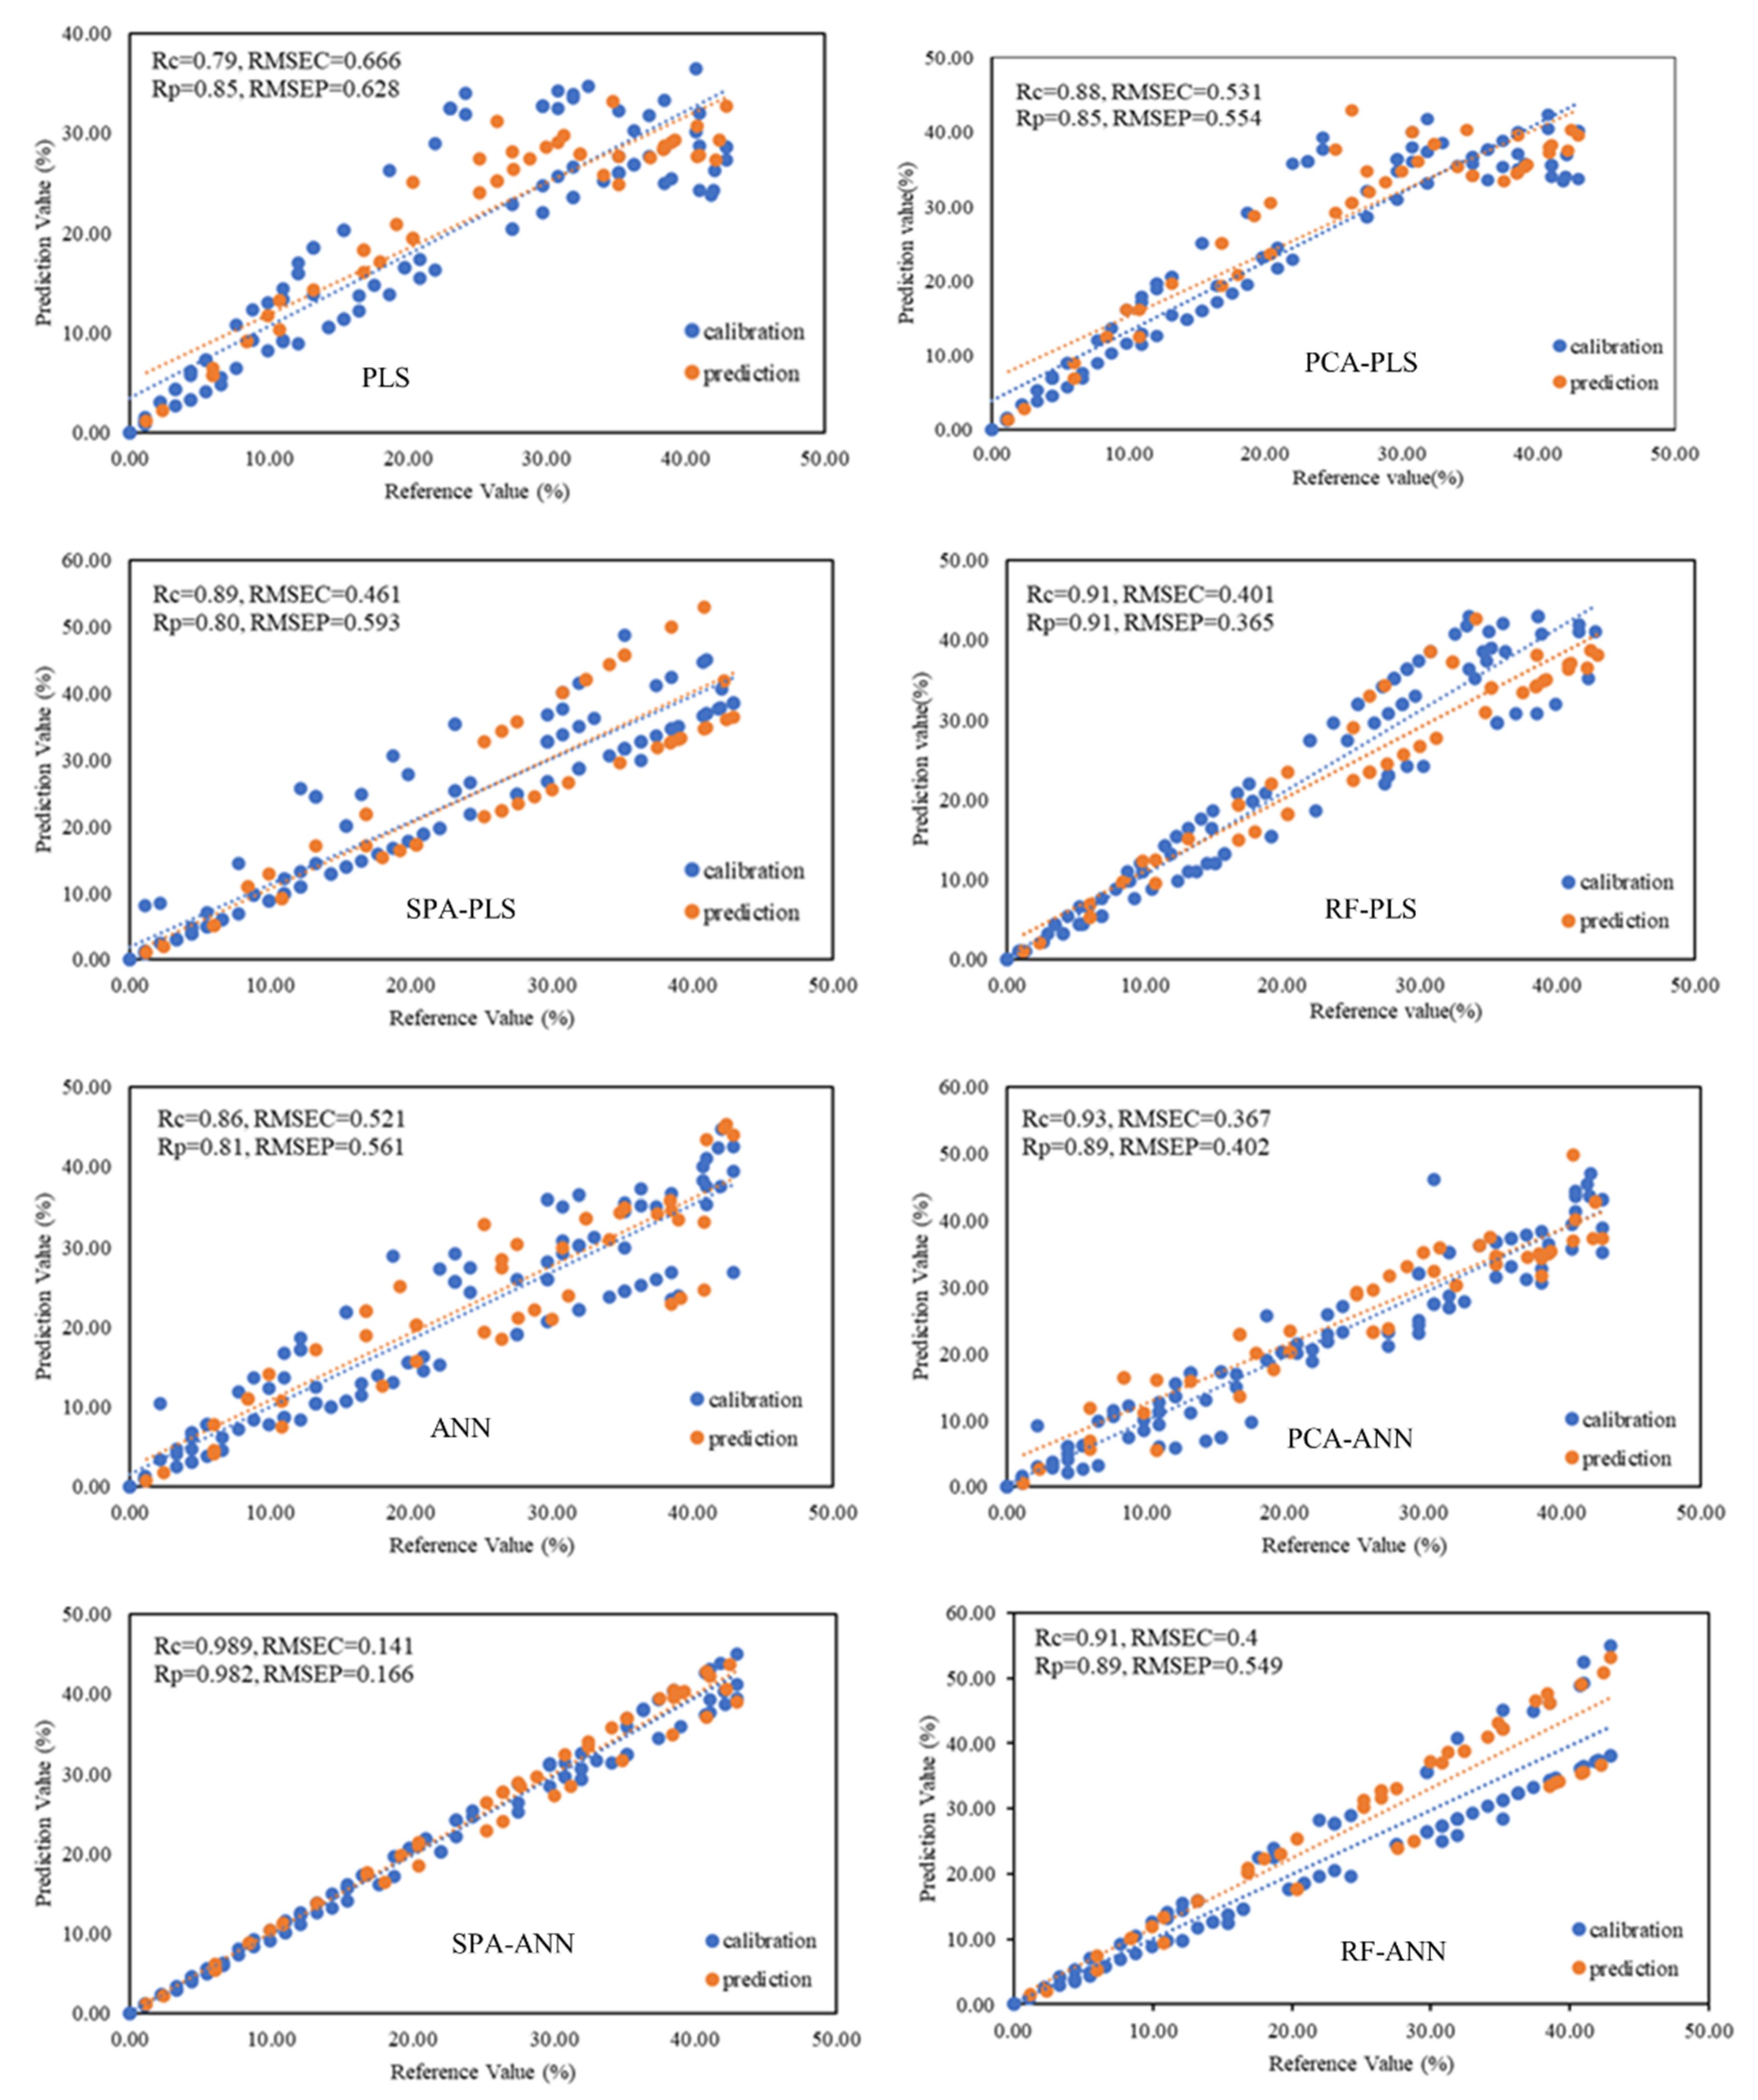
| Combined Models | Validation Parameters | |||
|---|---|---|---|---|
| Rc | Rp | RMSEC | RMSEP | |
| PLS | 0.79 | 0.85 | 0.66 | 0.62 |
| PCA-PLS | 0.88 | 0.85 | 0.53 | 0.55 |
| SPA-PLS | 0.89 | 0.80 | 0.46 | 0.59 |
| RF-PLS | 0.91 | 0.91 | 0.40 | 0.36 |
| ANN | 0.86 | 0.81 | 0.52 | 0.56 |
| PCA-ANN | 0.93 | 0.89 | 0.36 | 0.40 |
| SPA-ANN | 0.98 | 0.98 | 0.14 | 0.16 |
| RF-ANN | 0.91 | 0.89 | 0.40 | 0.54 |
Publisher’s Note: MDPI stays neutral with regard to jurisdictional claims in published maps and institutional affiliations. |
© 2021 by the authors. Licensee MDPI, Basel, Switzerland. This article is an open access article distributed under the terms and conditions of the Creative Commons Attribution (CC BY) license (https://creativecommons.org/licenses/by/4.0/).
Share and Cite
Nazarloo, A.S.; Sharabiani, V.R.; Gilandeh, Y.A.; Taghinezhad, E.; Szymanek, M. Evaluation of Different Models for Non-Destructive Detection of Tomato Pesticide Residues Based on Near-Infrared Spectroscopy. Sensors 2021, 21, 3032. https://doi.org/10.3390/s21093032
Nazarloo AS, Sharabiani VR, Gilandeh YA, Taghinezhad E, Szymanek M. Evaluation of Different Models for Non-Destructive Detection of Tomato Pesticide Residues Based on Near-Infrared Spectroscopy. Sensors. 2021; 21(9):3032. https://doi.org/10.3390/s21093032
Chicago/Turabian StyleNazarloo, Araz Soltani, Vali Rasooli Sharabiani, Yousef Abbaspour Gilandeh, Ebrahim Taghinezhad, and Mariusz Szymanek. 2021. "Evaluation of Different Models for Non-Destructive Detection of Tomato Pesticide Residues Based on Near-Infrared Spectroscopy" Sensors 21, no. 9: 3032. https://doi.org/10.3390/s21093032