
An EEG-Based Transfer Learning Method for Cross-Subject Fatigue Mental State Prediction

 ,
,  , , ,
, , ,  ,
,  and
and
Abstract
:1. Introduction
2. Experiments
2.1. Subjects
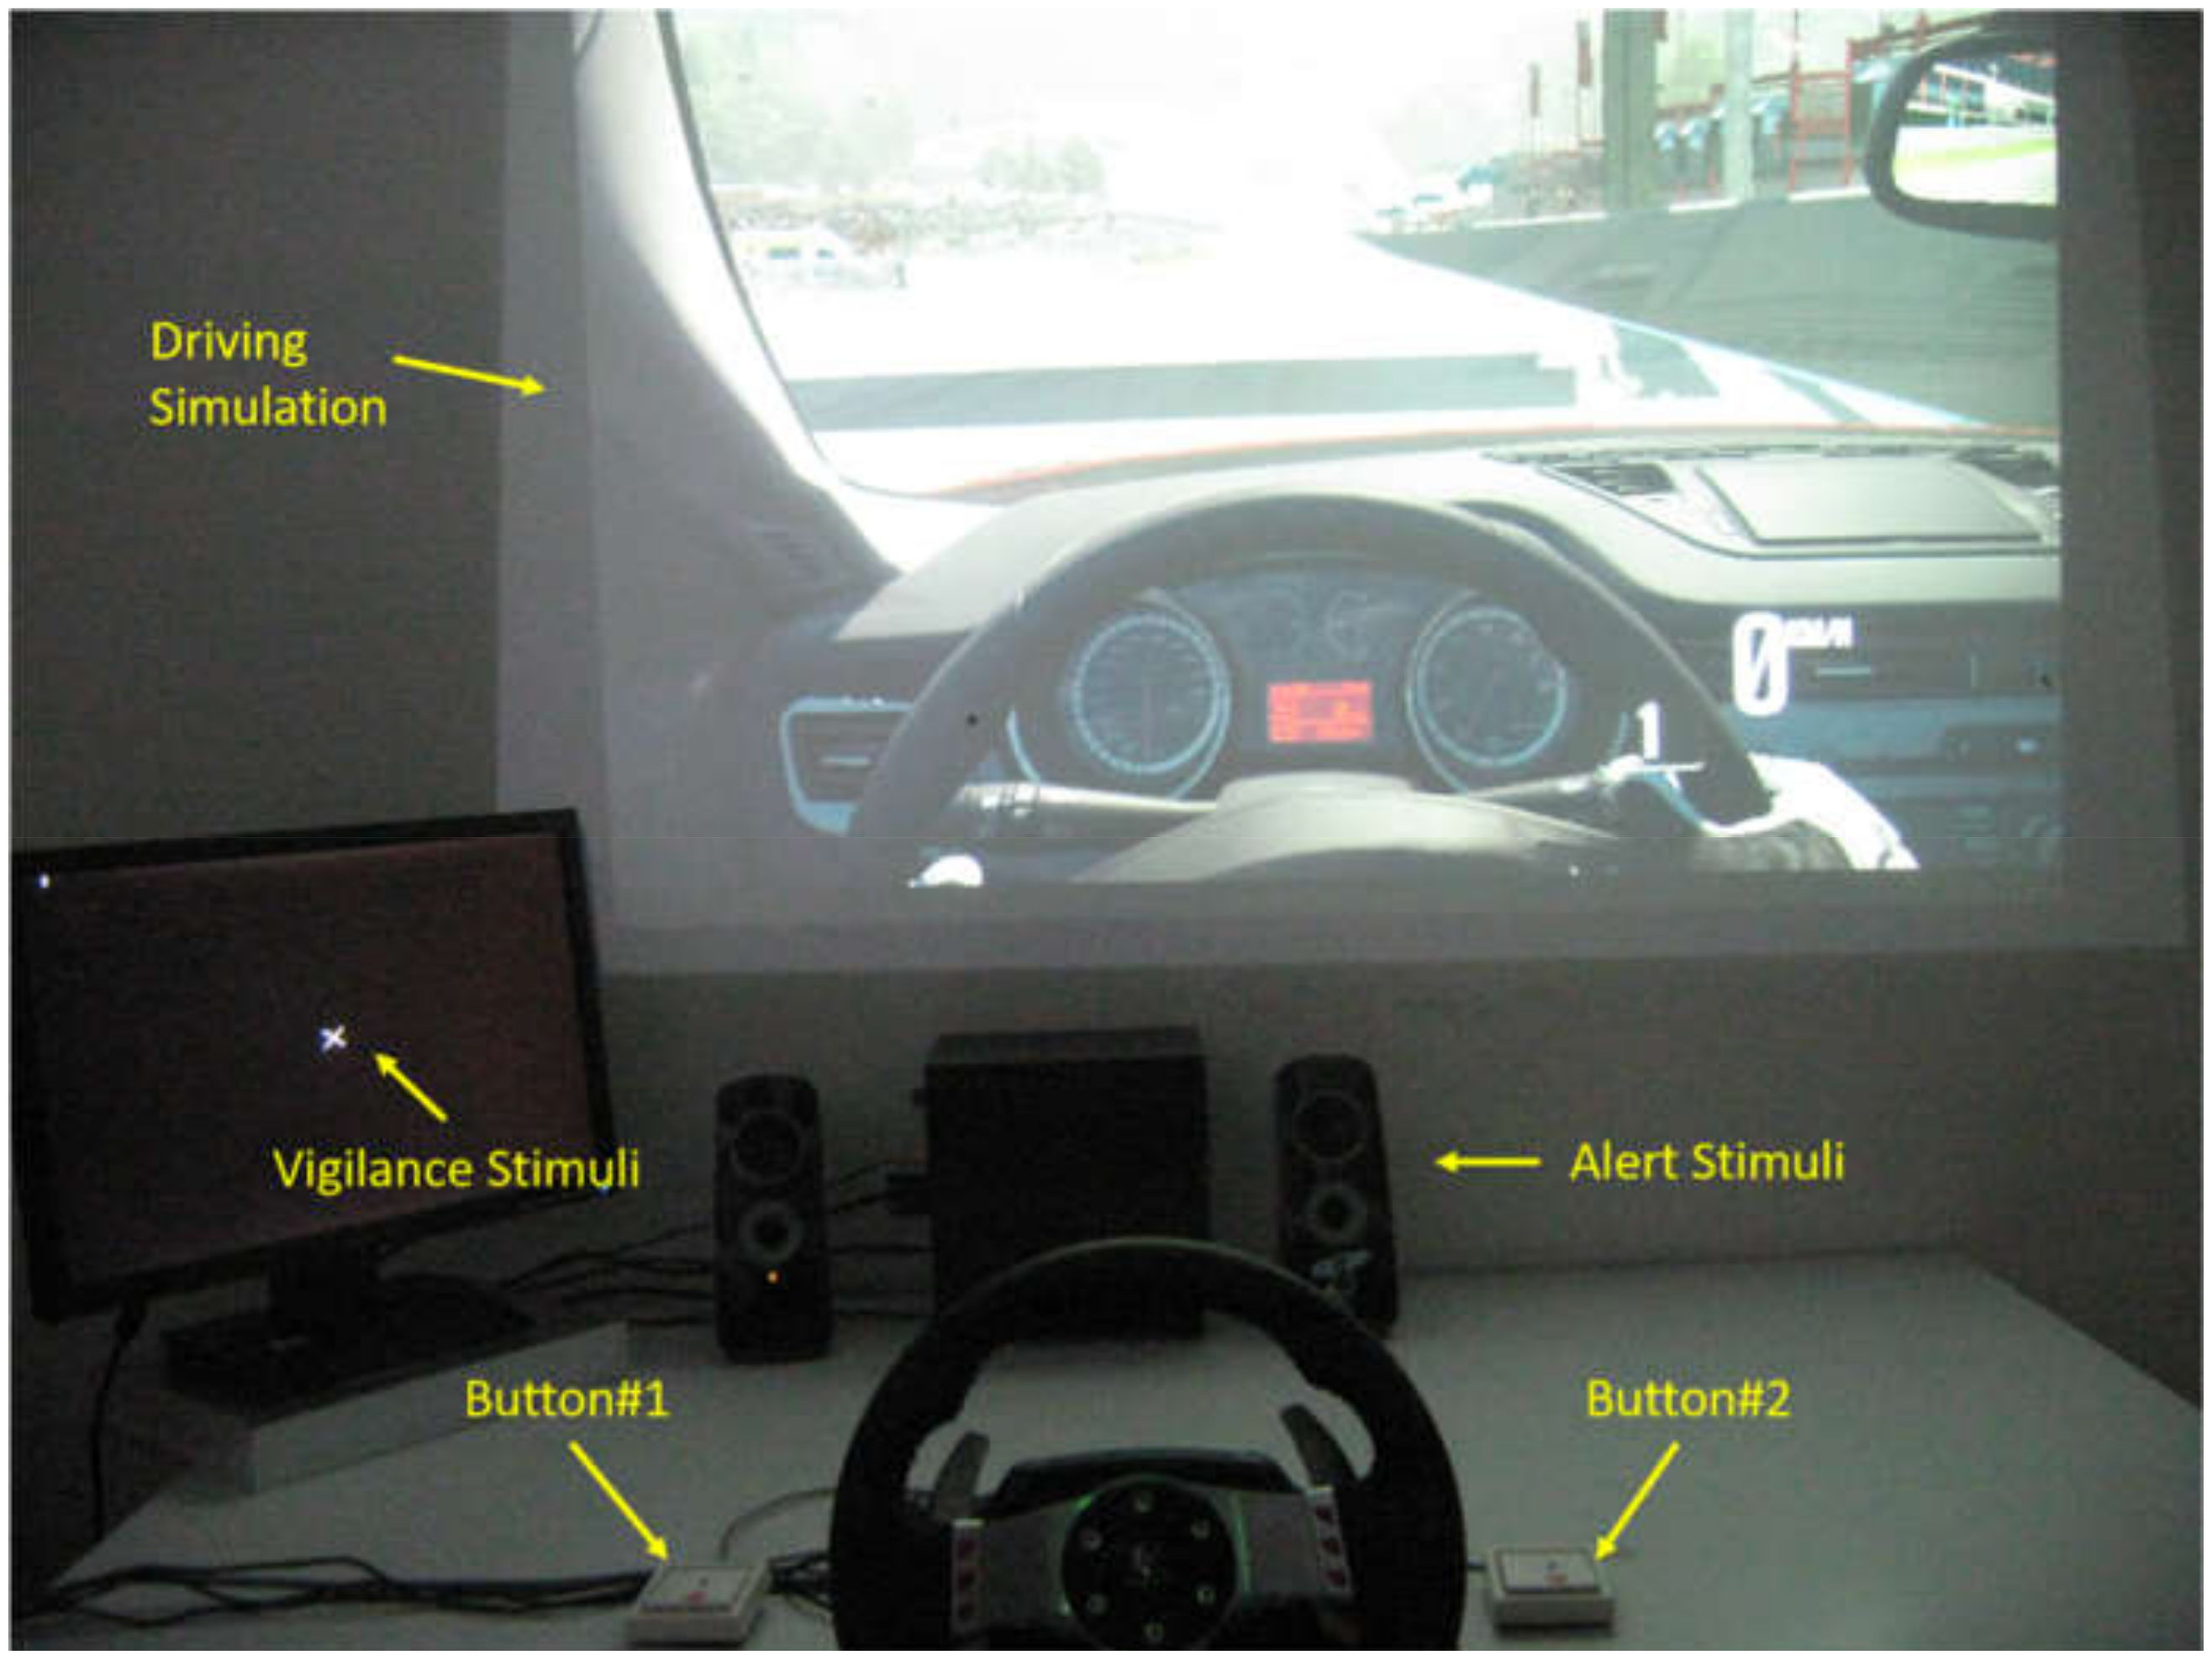
2.2. Experimental Protocol
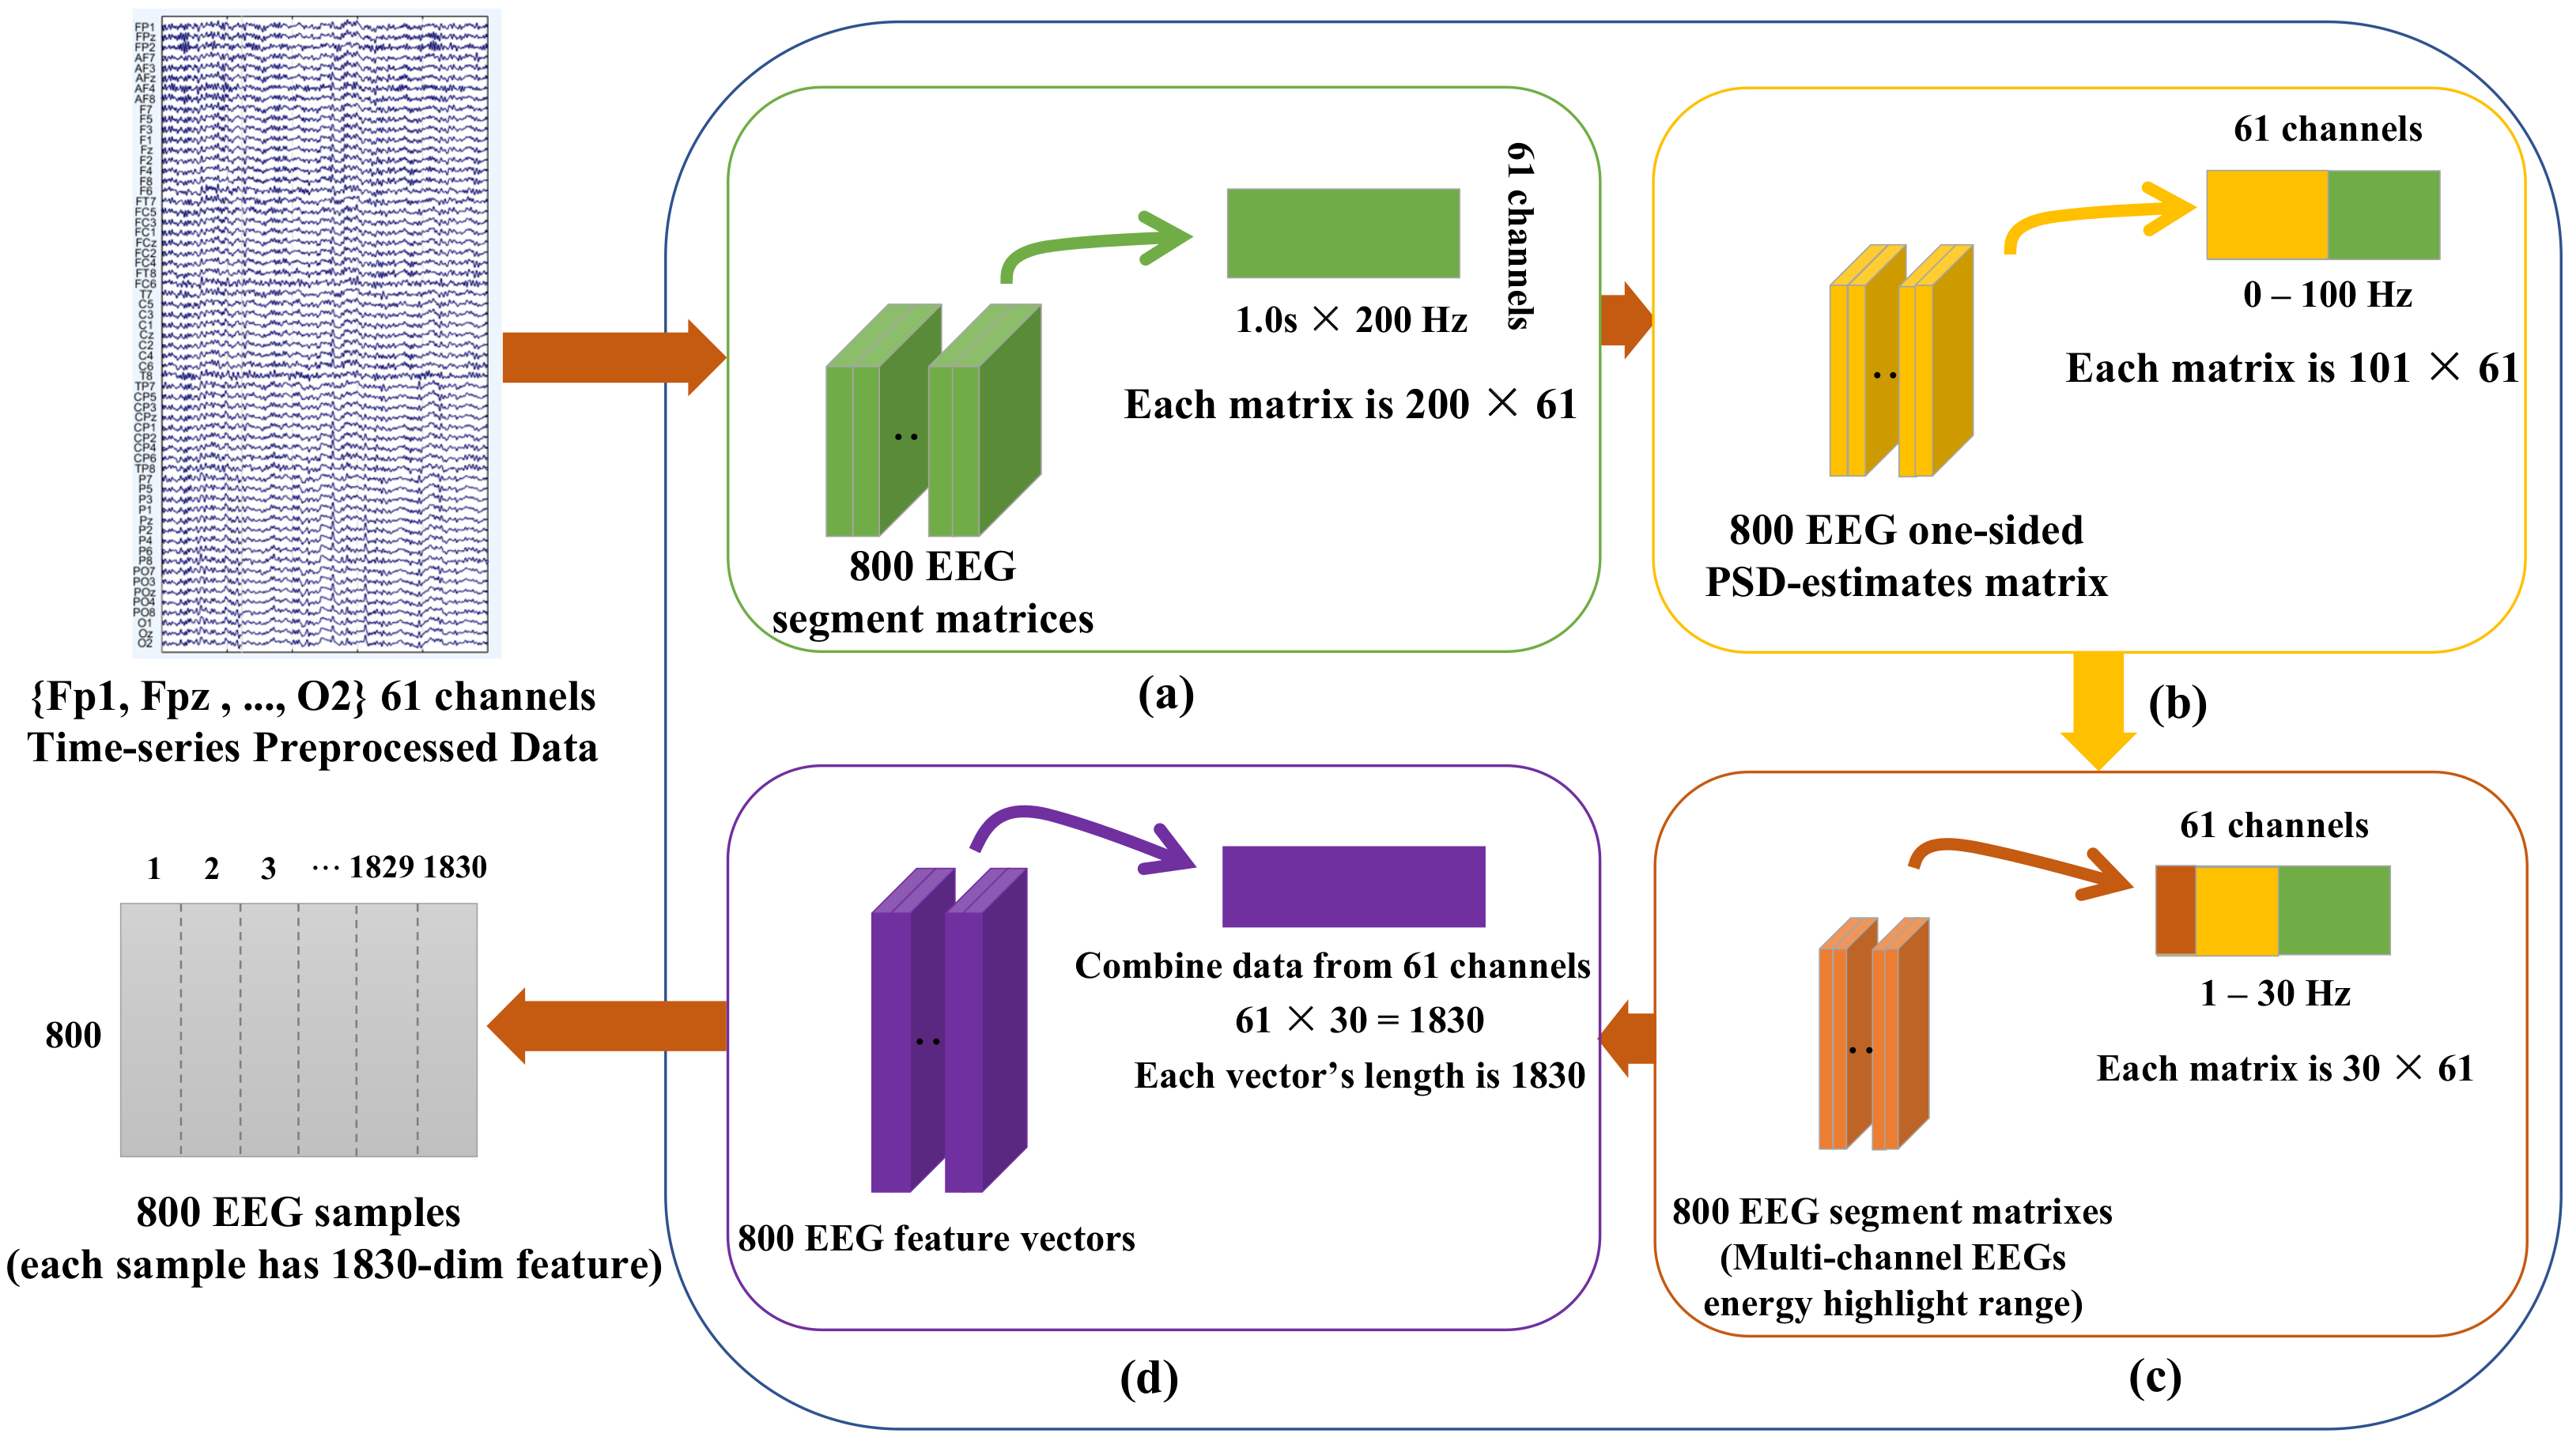
2.3. EEG Recording and Preprocessing
2.4. Domain Adaptation Learning
2.5. Cross-Subject Cross-Validation and Evaluation Index
3. Method
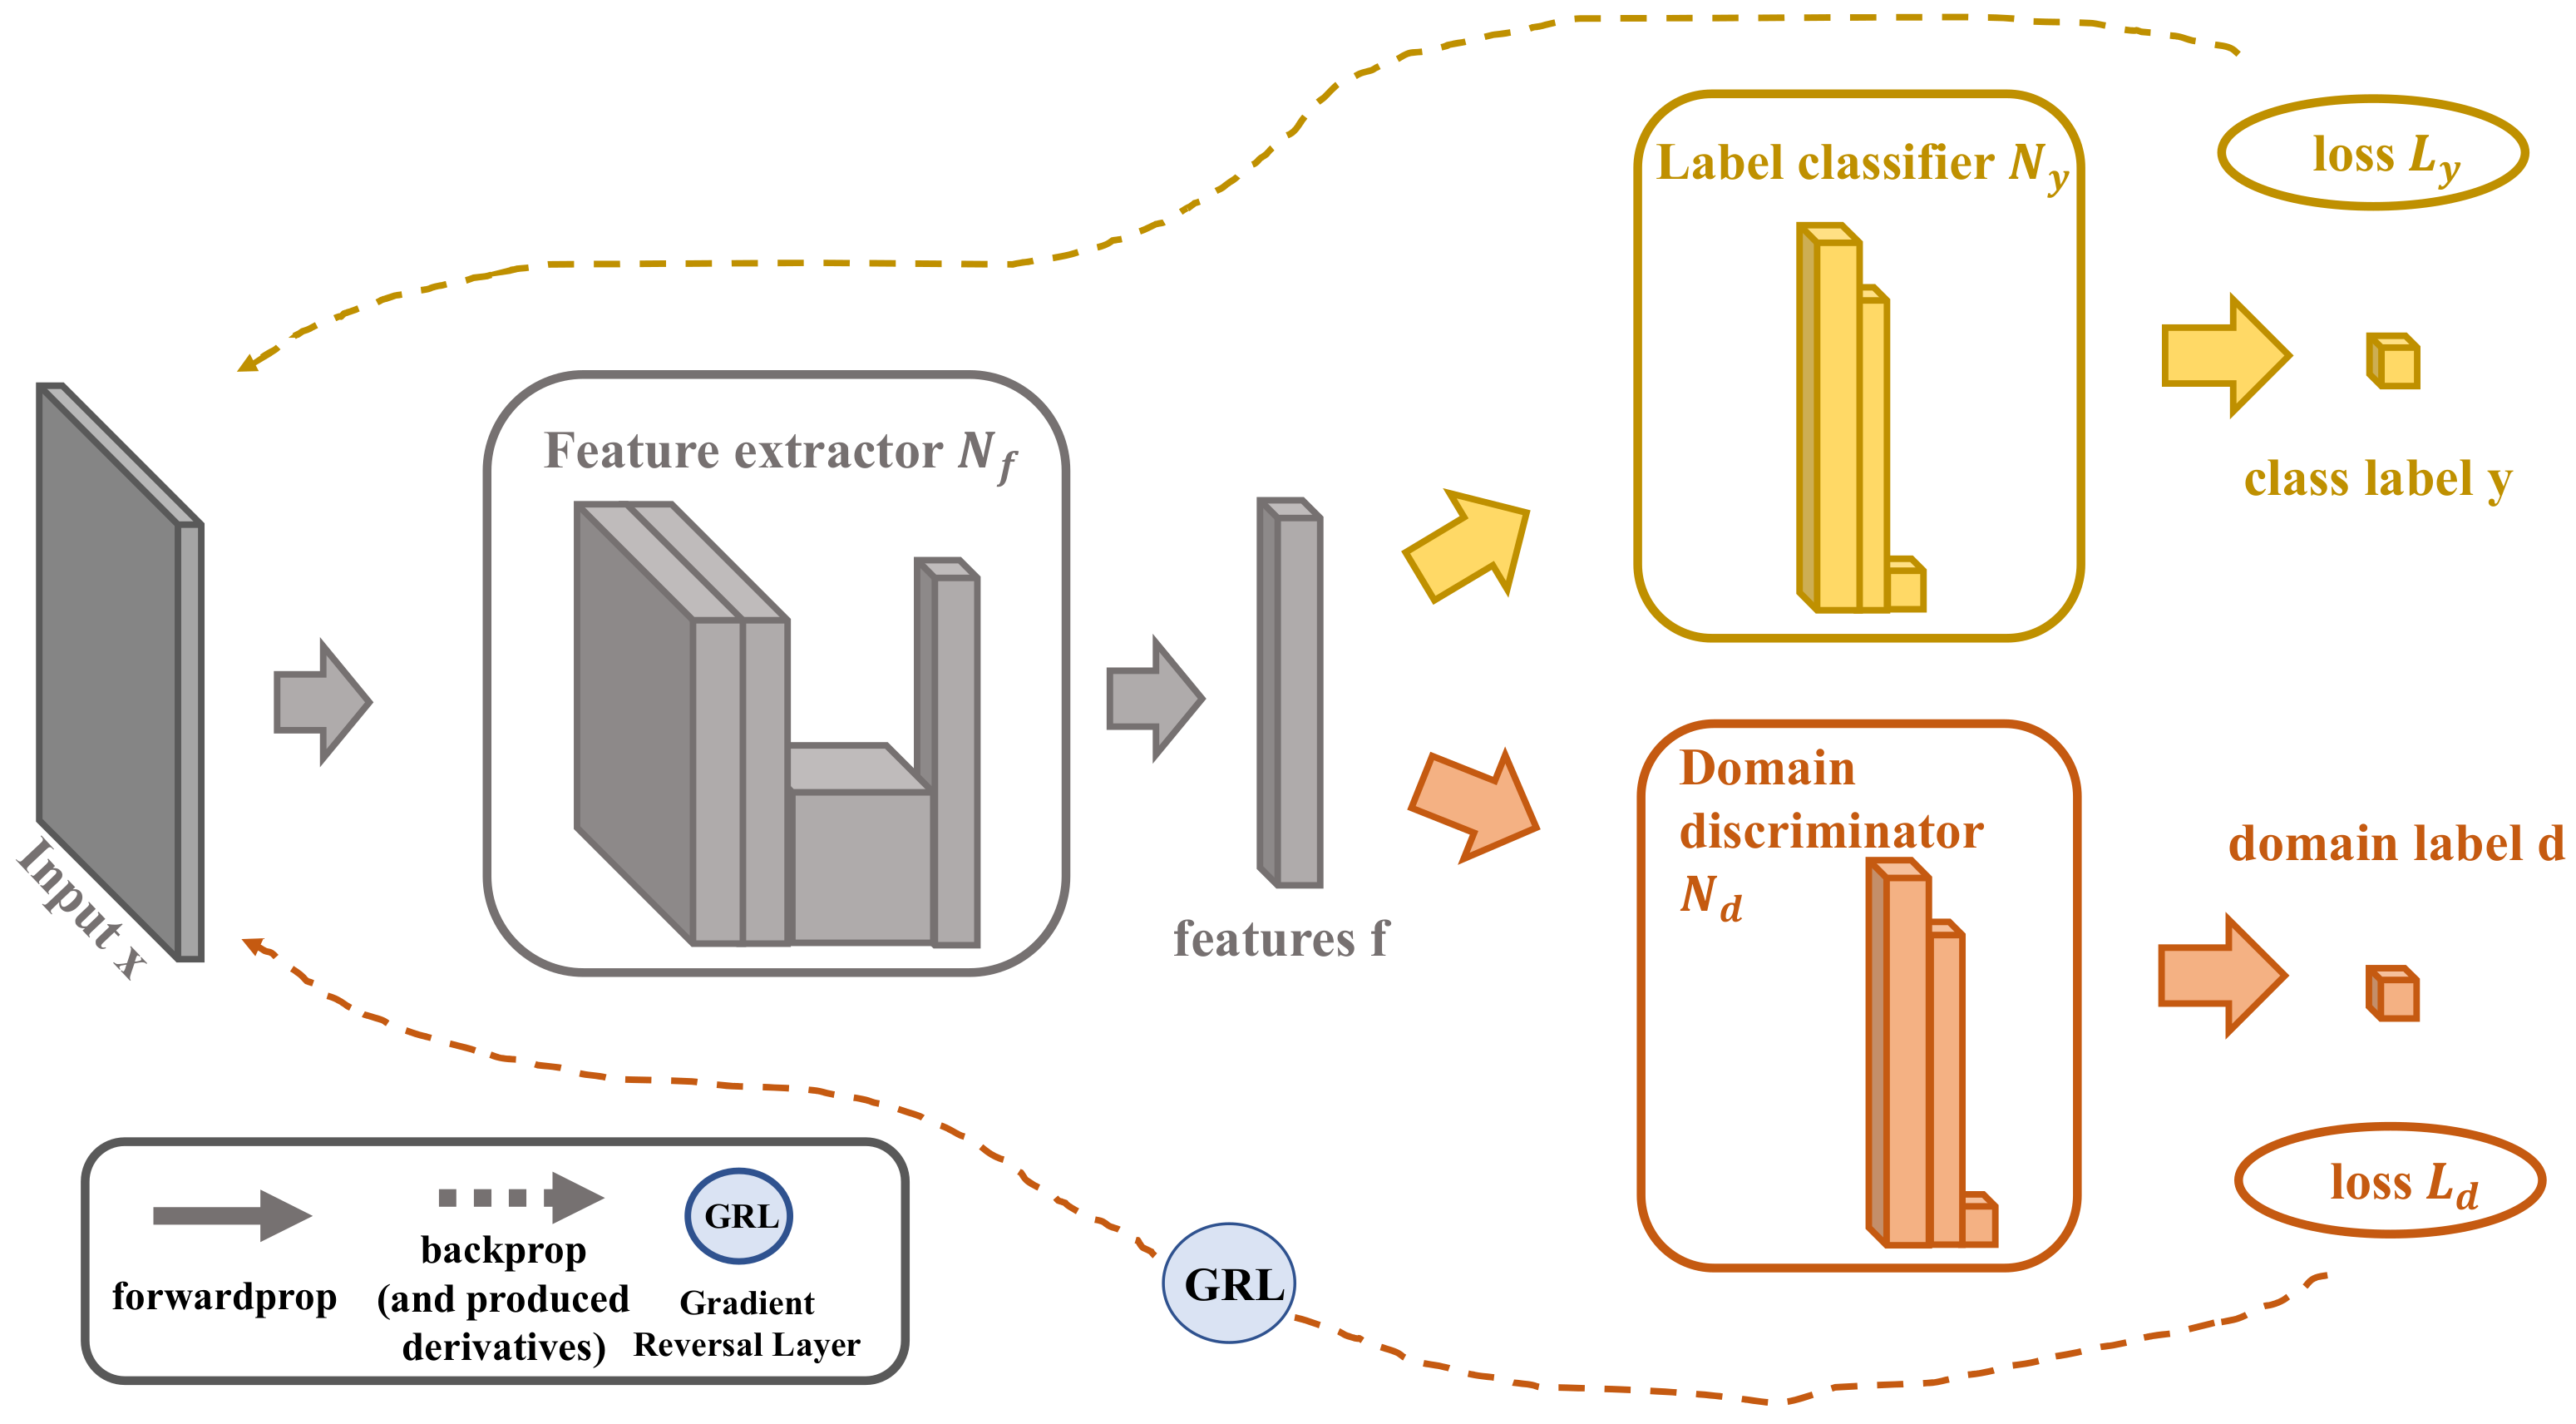
3.1. The Existing DANN
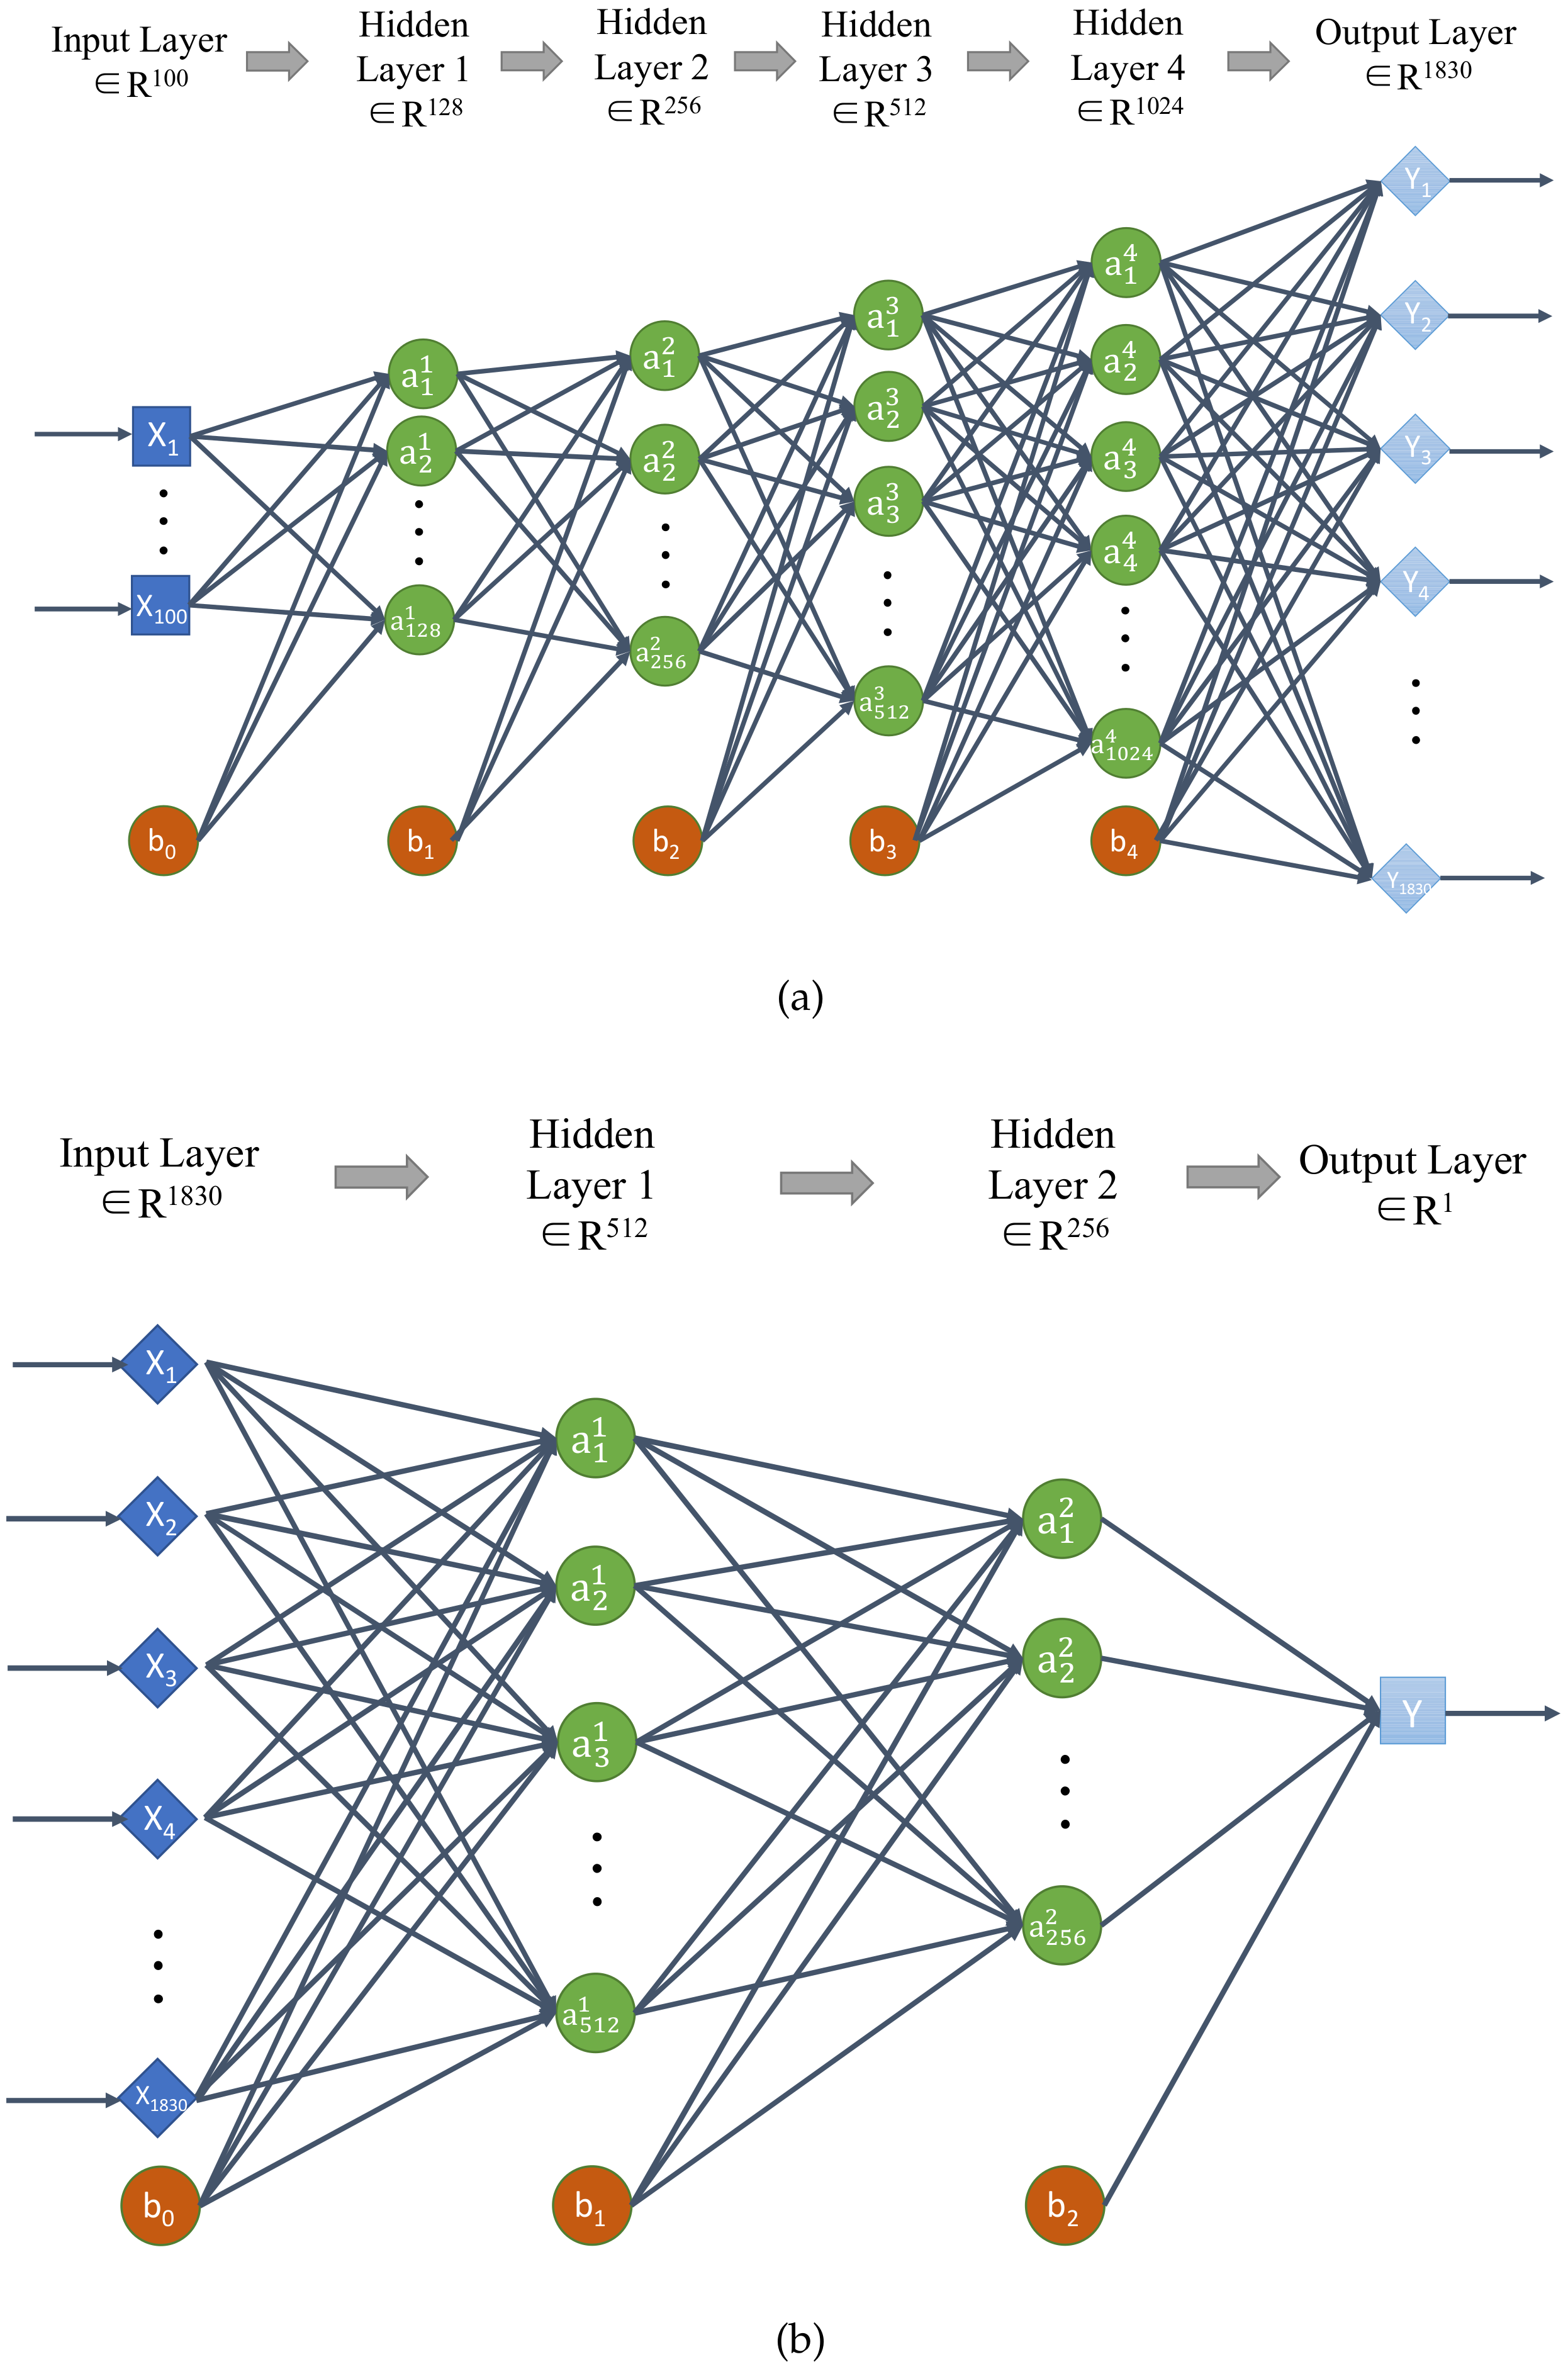
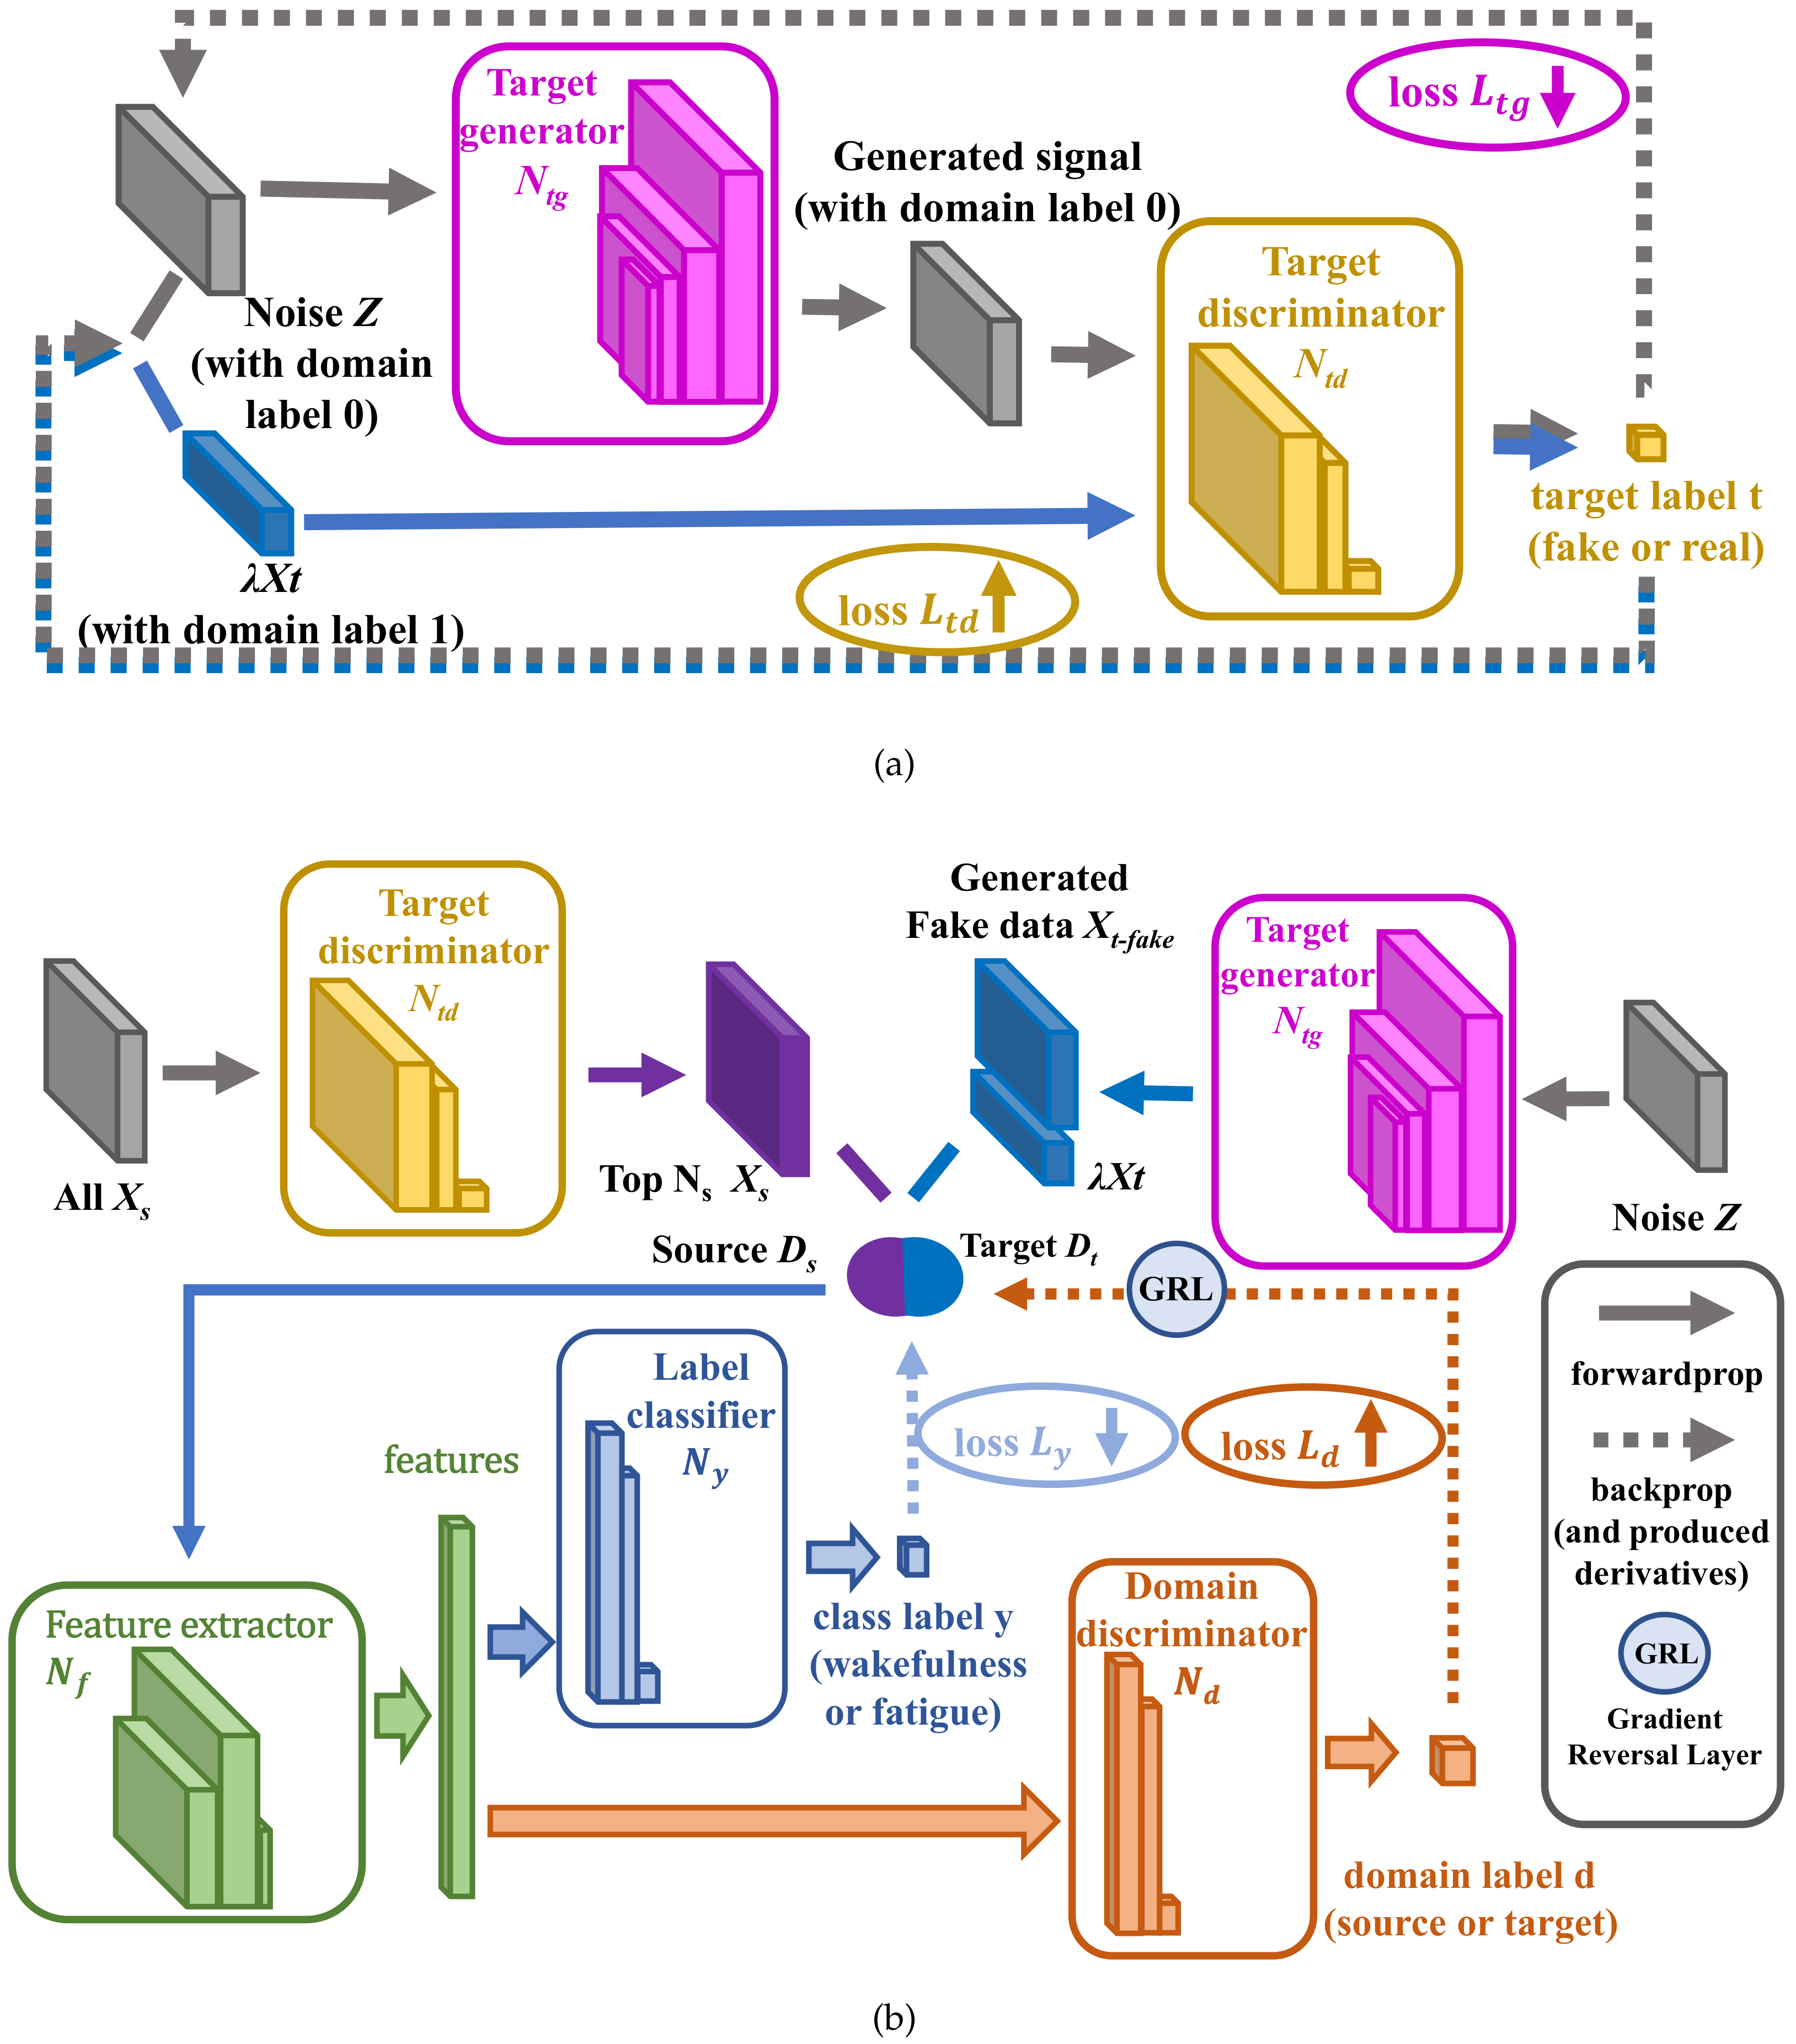
3.2. The Architecture of GDANN
3.3. The Training Process of GDANN
4. Results
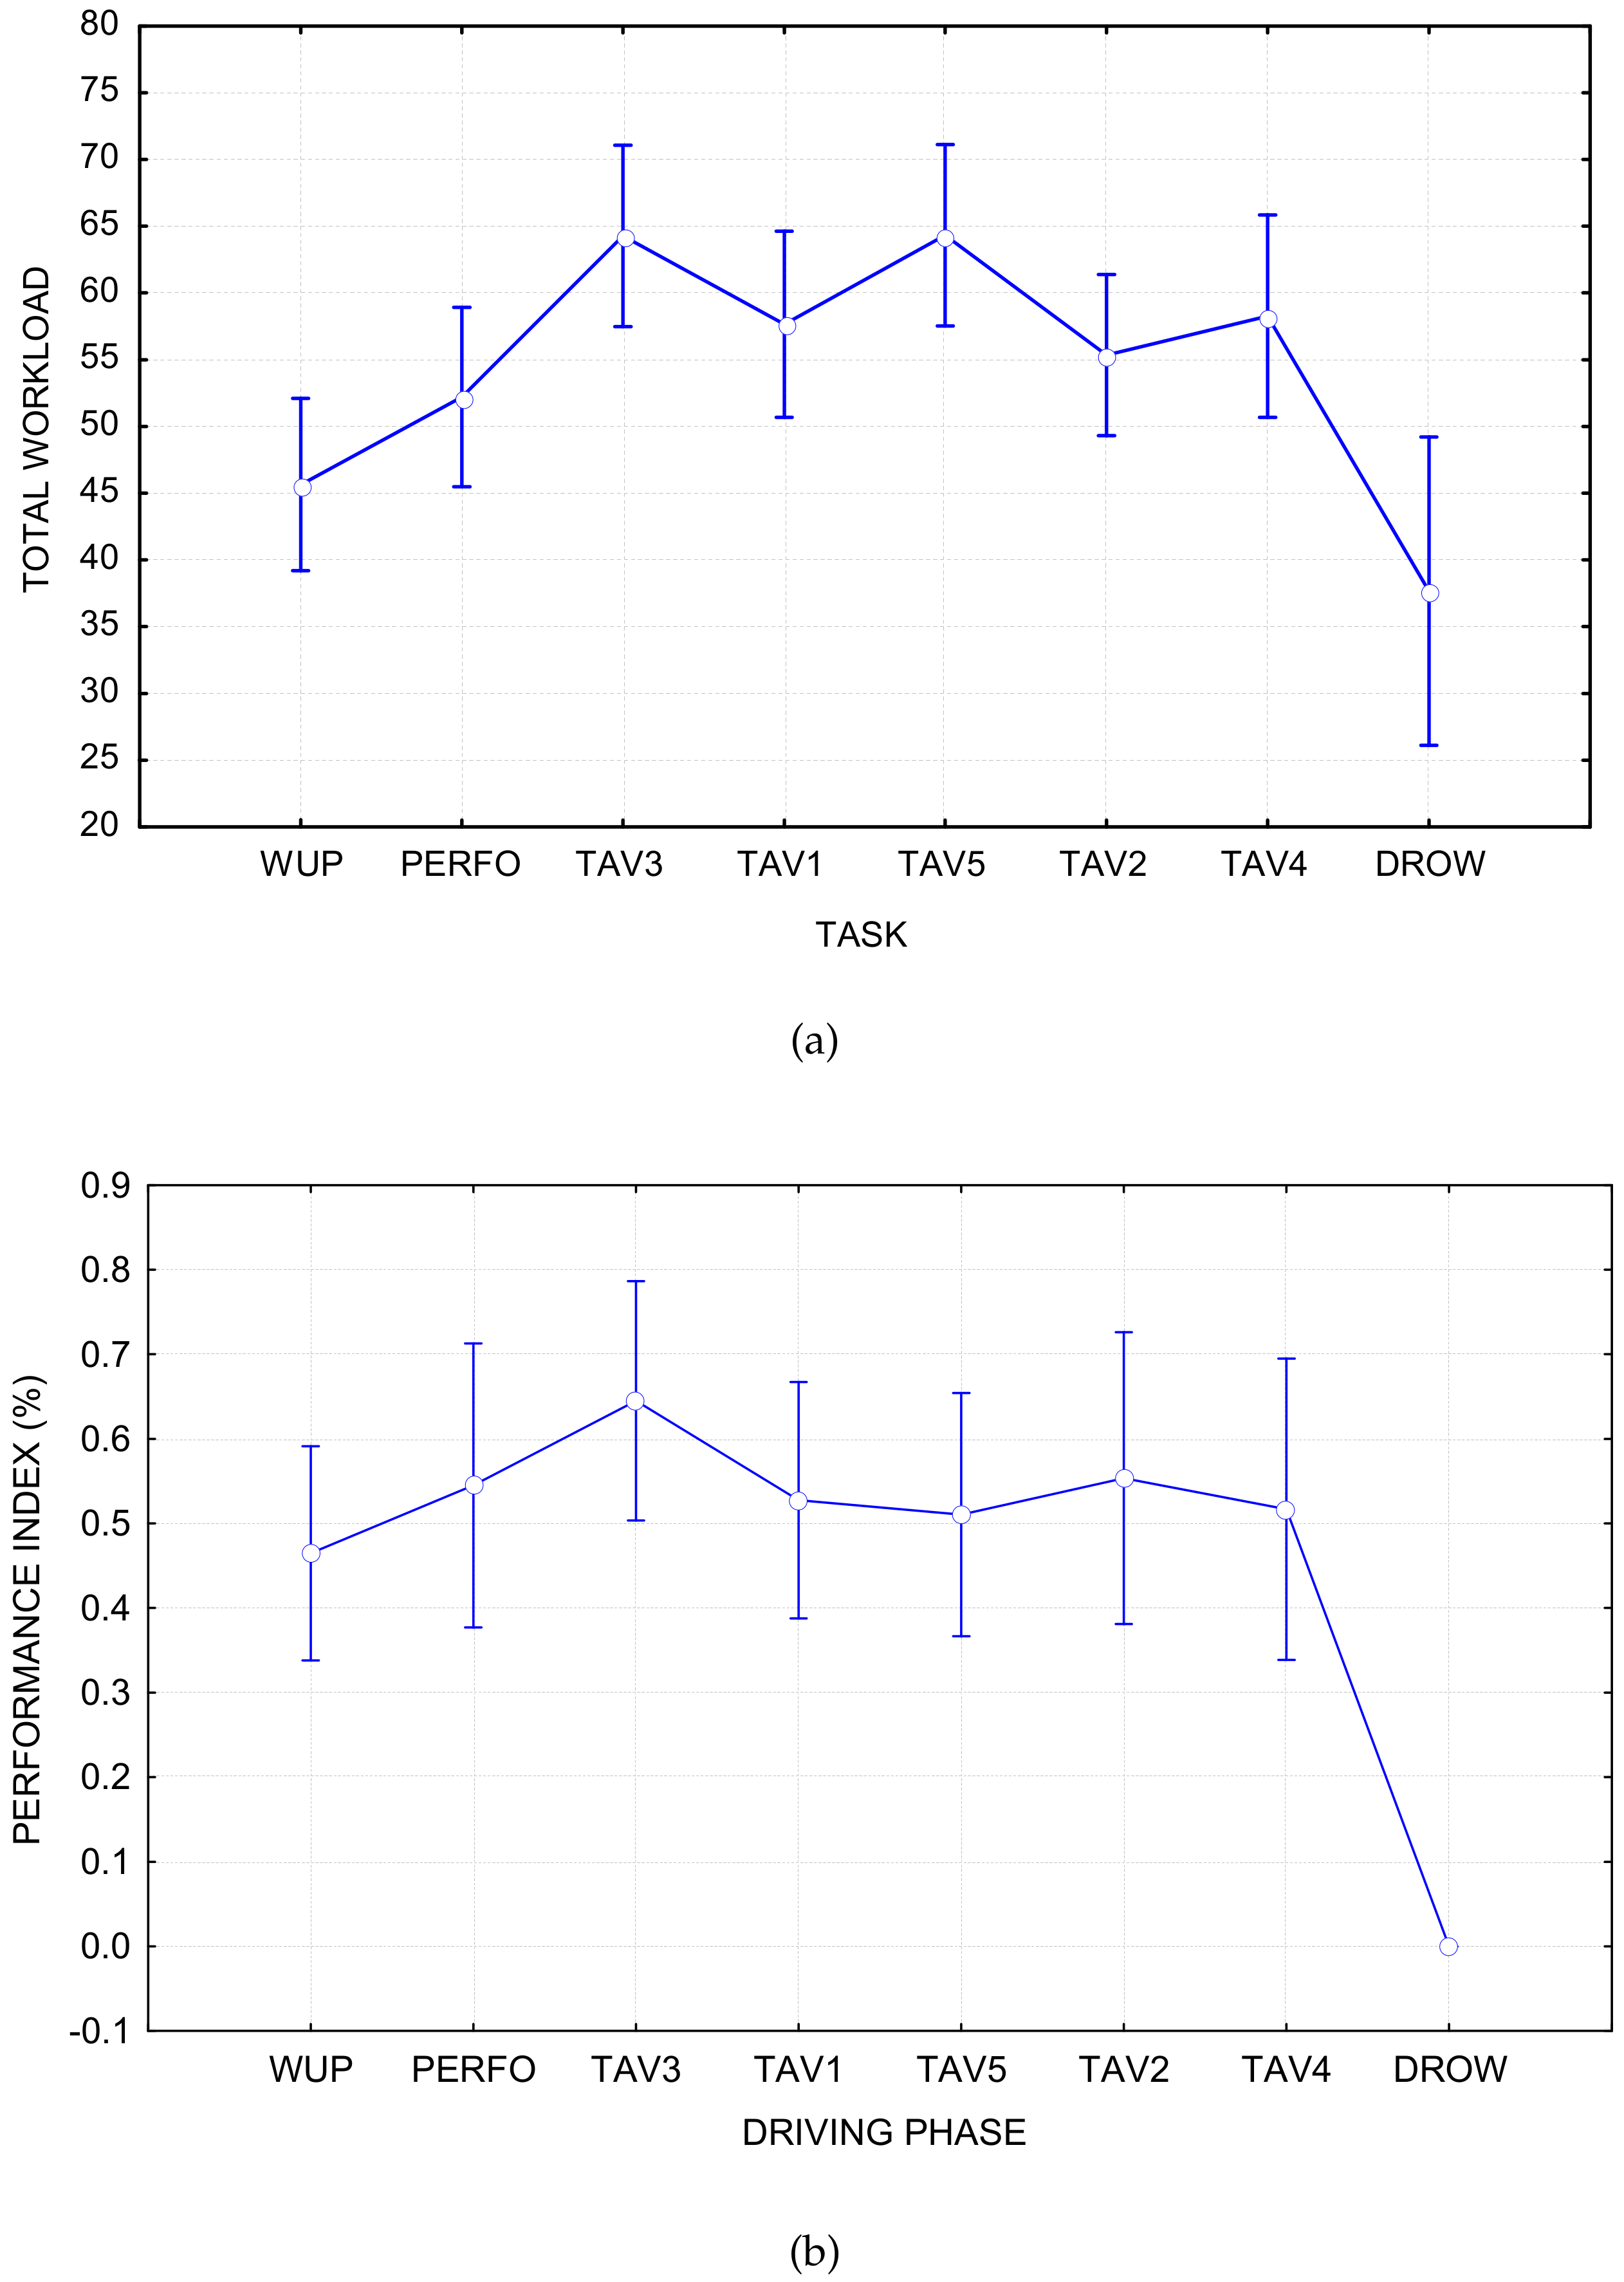
4.1. Selection of Regression Labels
4.2. Parameter Sensitivity
- (a)
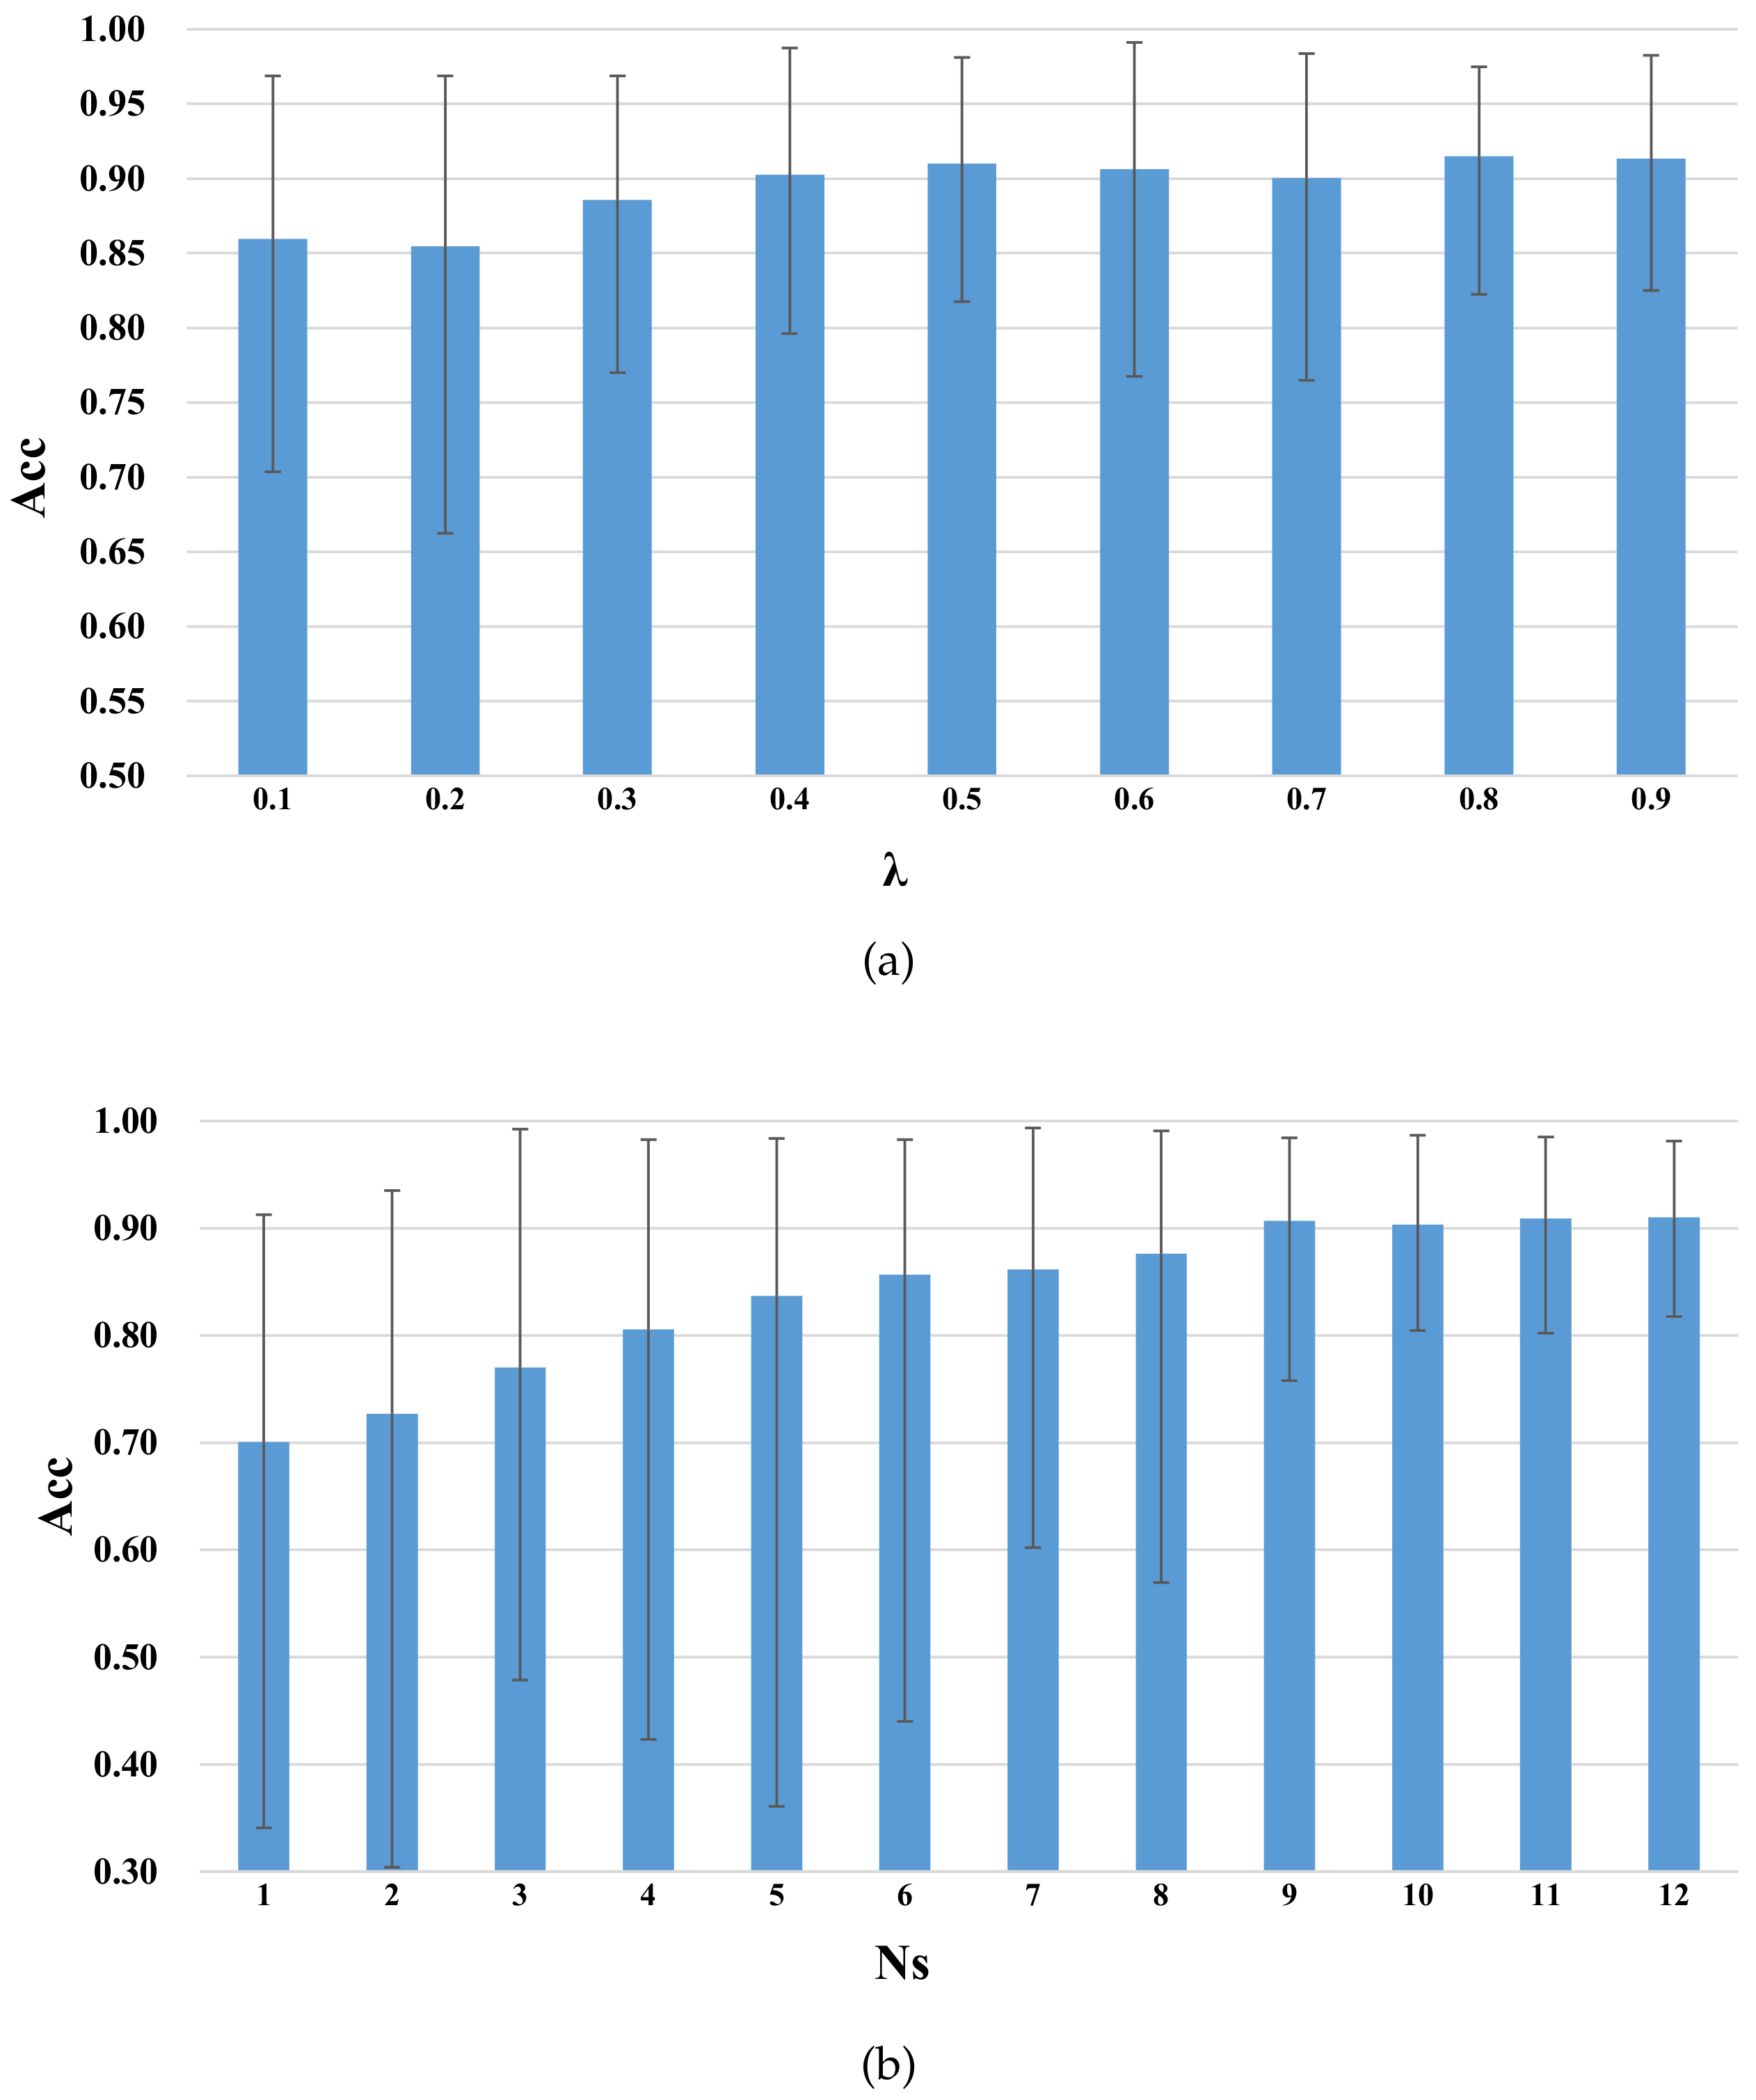
- In Figure 7a, as increases, the average accuracy of GDANN tends to increase slowly. To better reflect the robustness of the model, was selected.
- (b)
- In Figure 7b, as the number of source subjects increases from 1 to 9, the accuracy increases sharply. When the number reaches 9, the accuracy remains stable, and the accuracy curve may fluctuate slightly. Thus, we set in the following experiments.
4.3. High-Dimensional Feature Visualization
4.4. Performance Comparison between GDANN and DANN
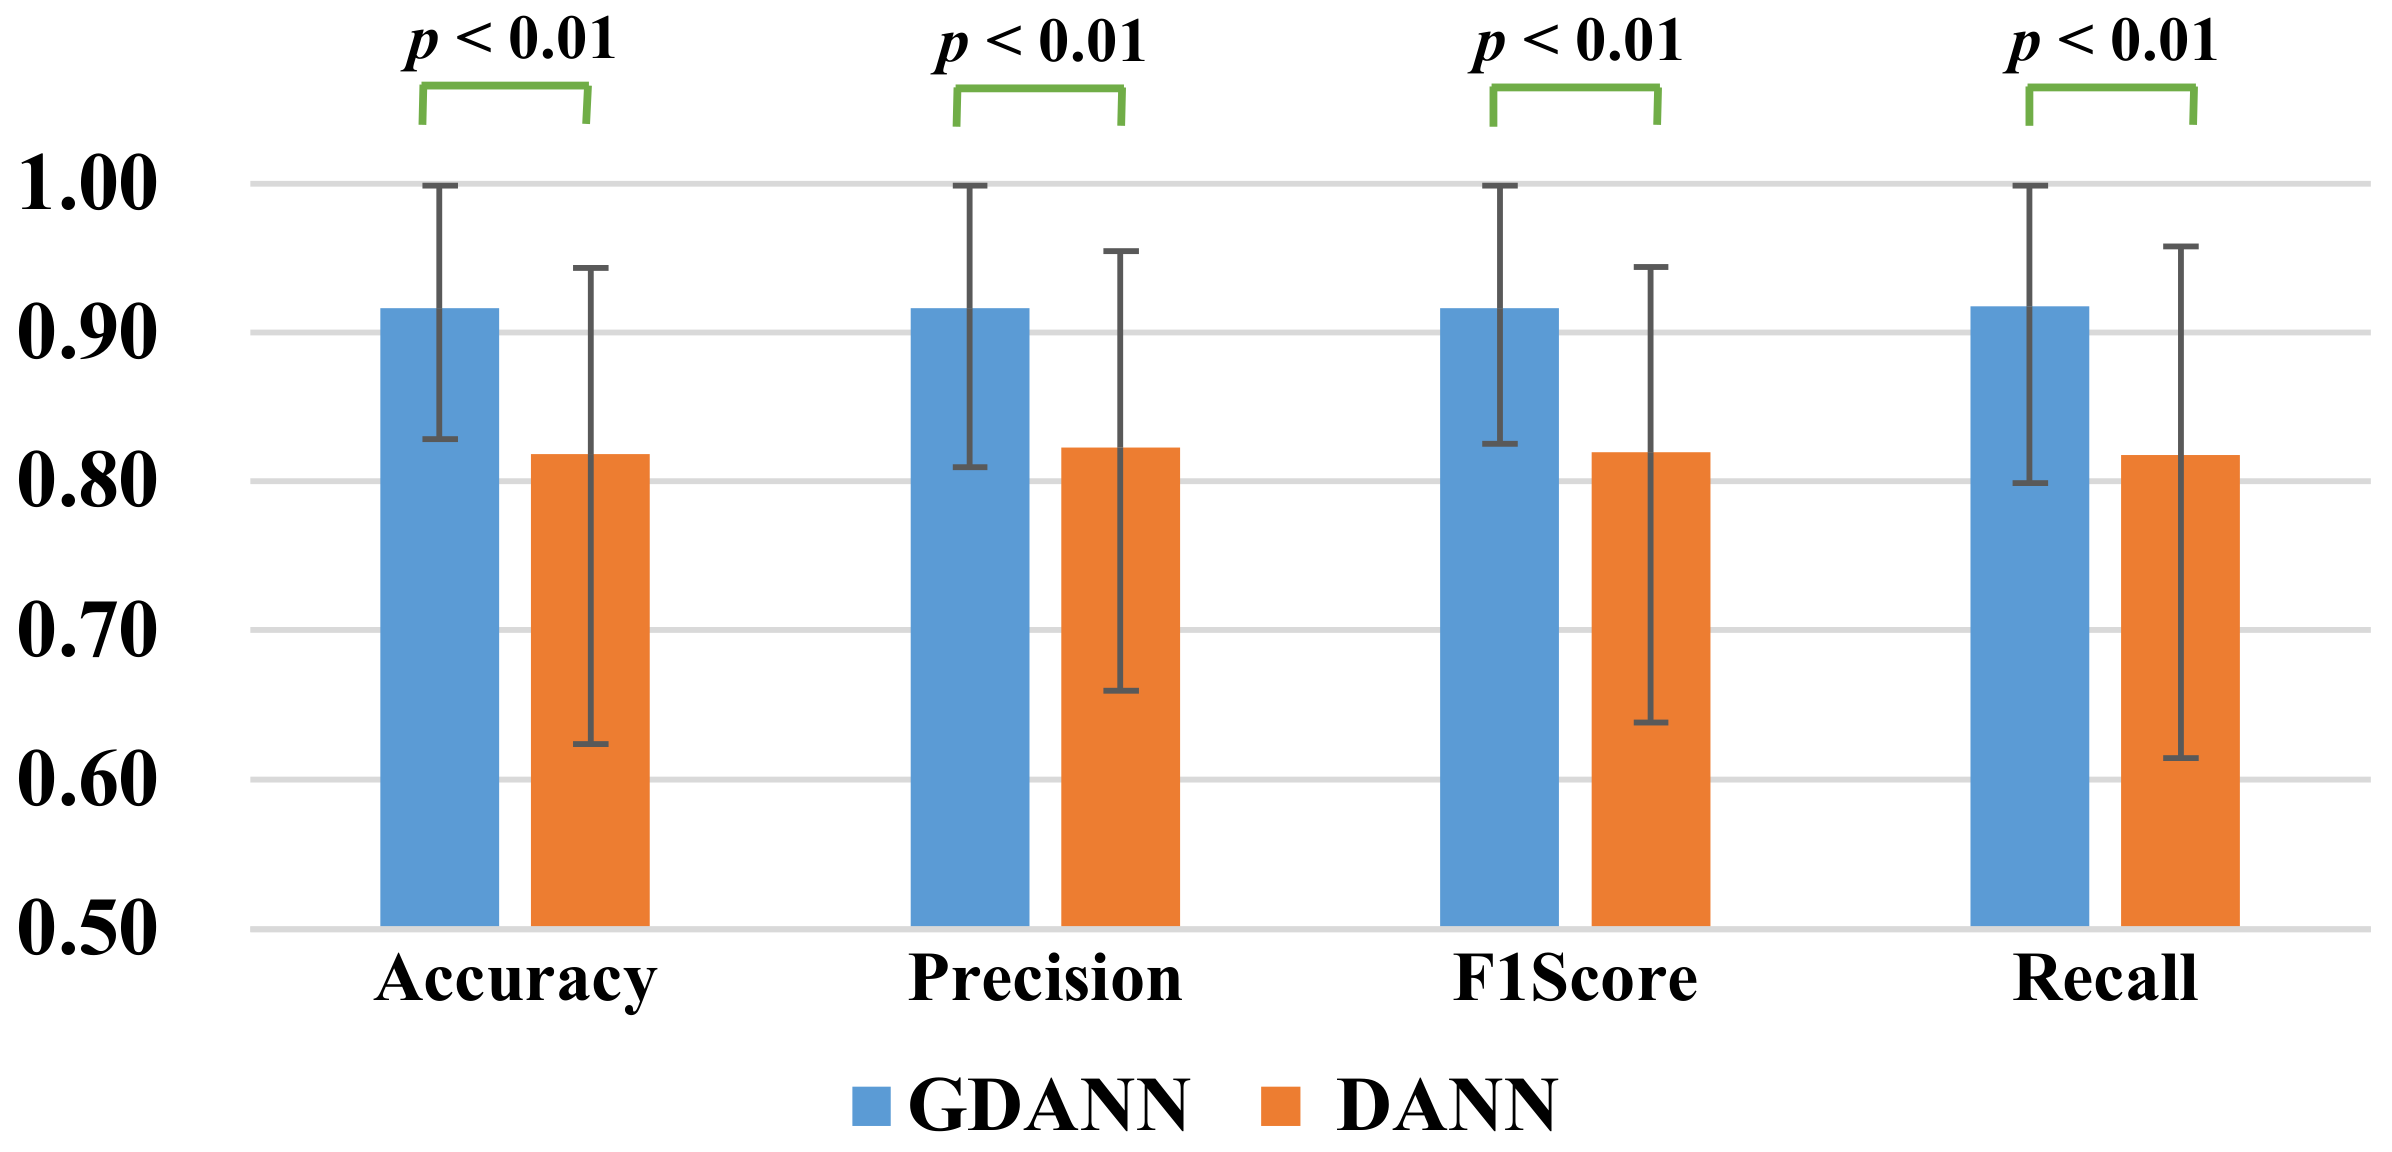
4.4.1. Statistical Analysis
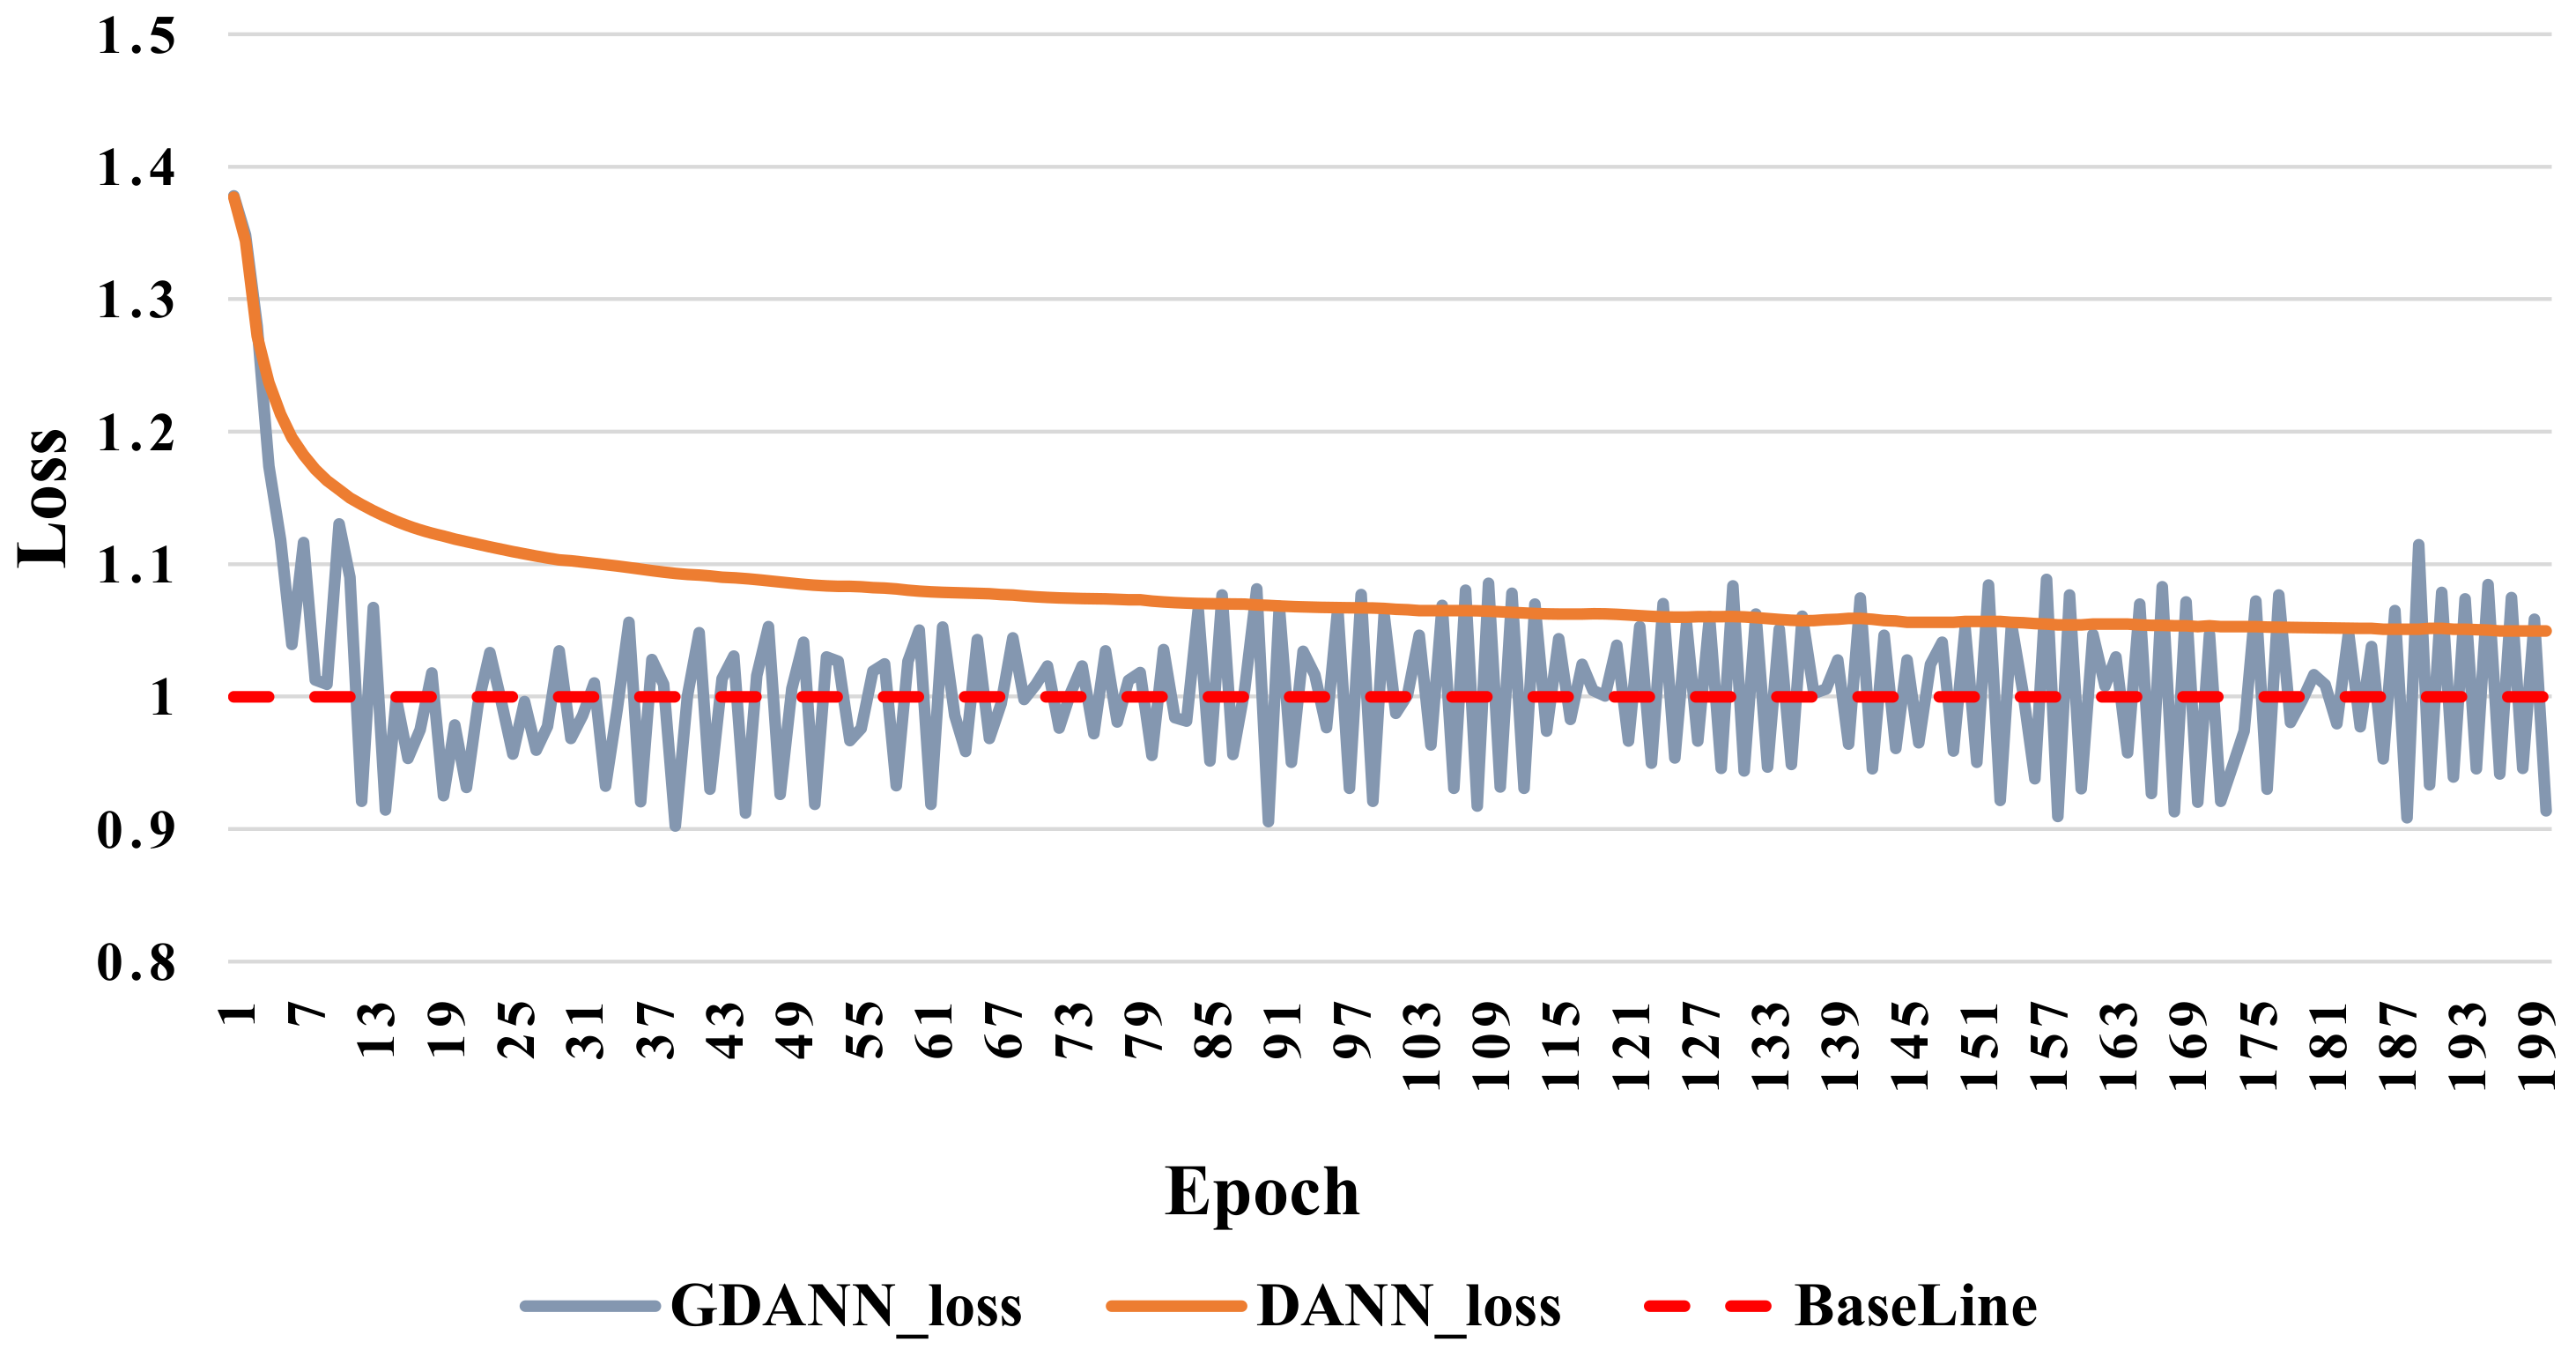
4.4.2. Convergency Analysis
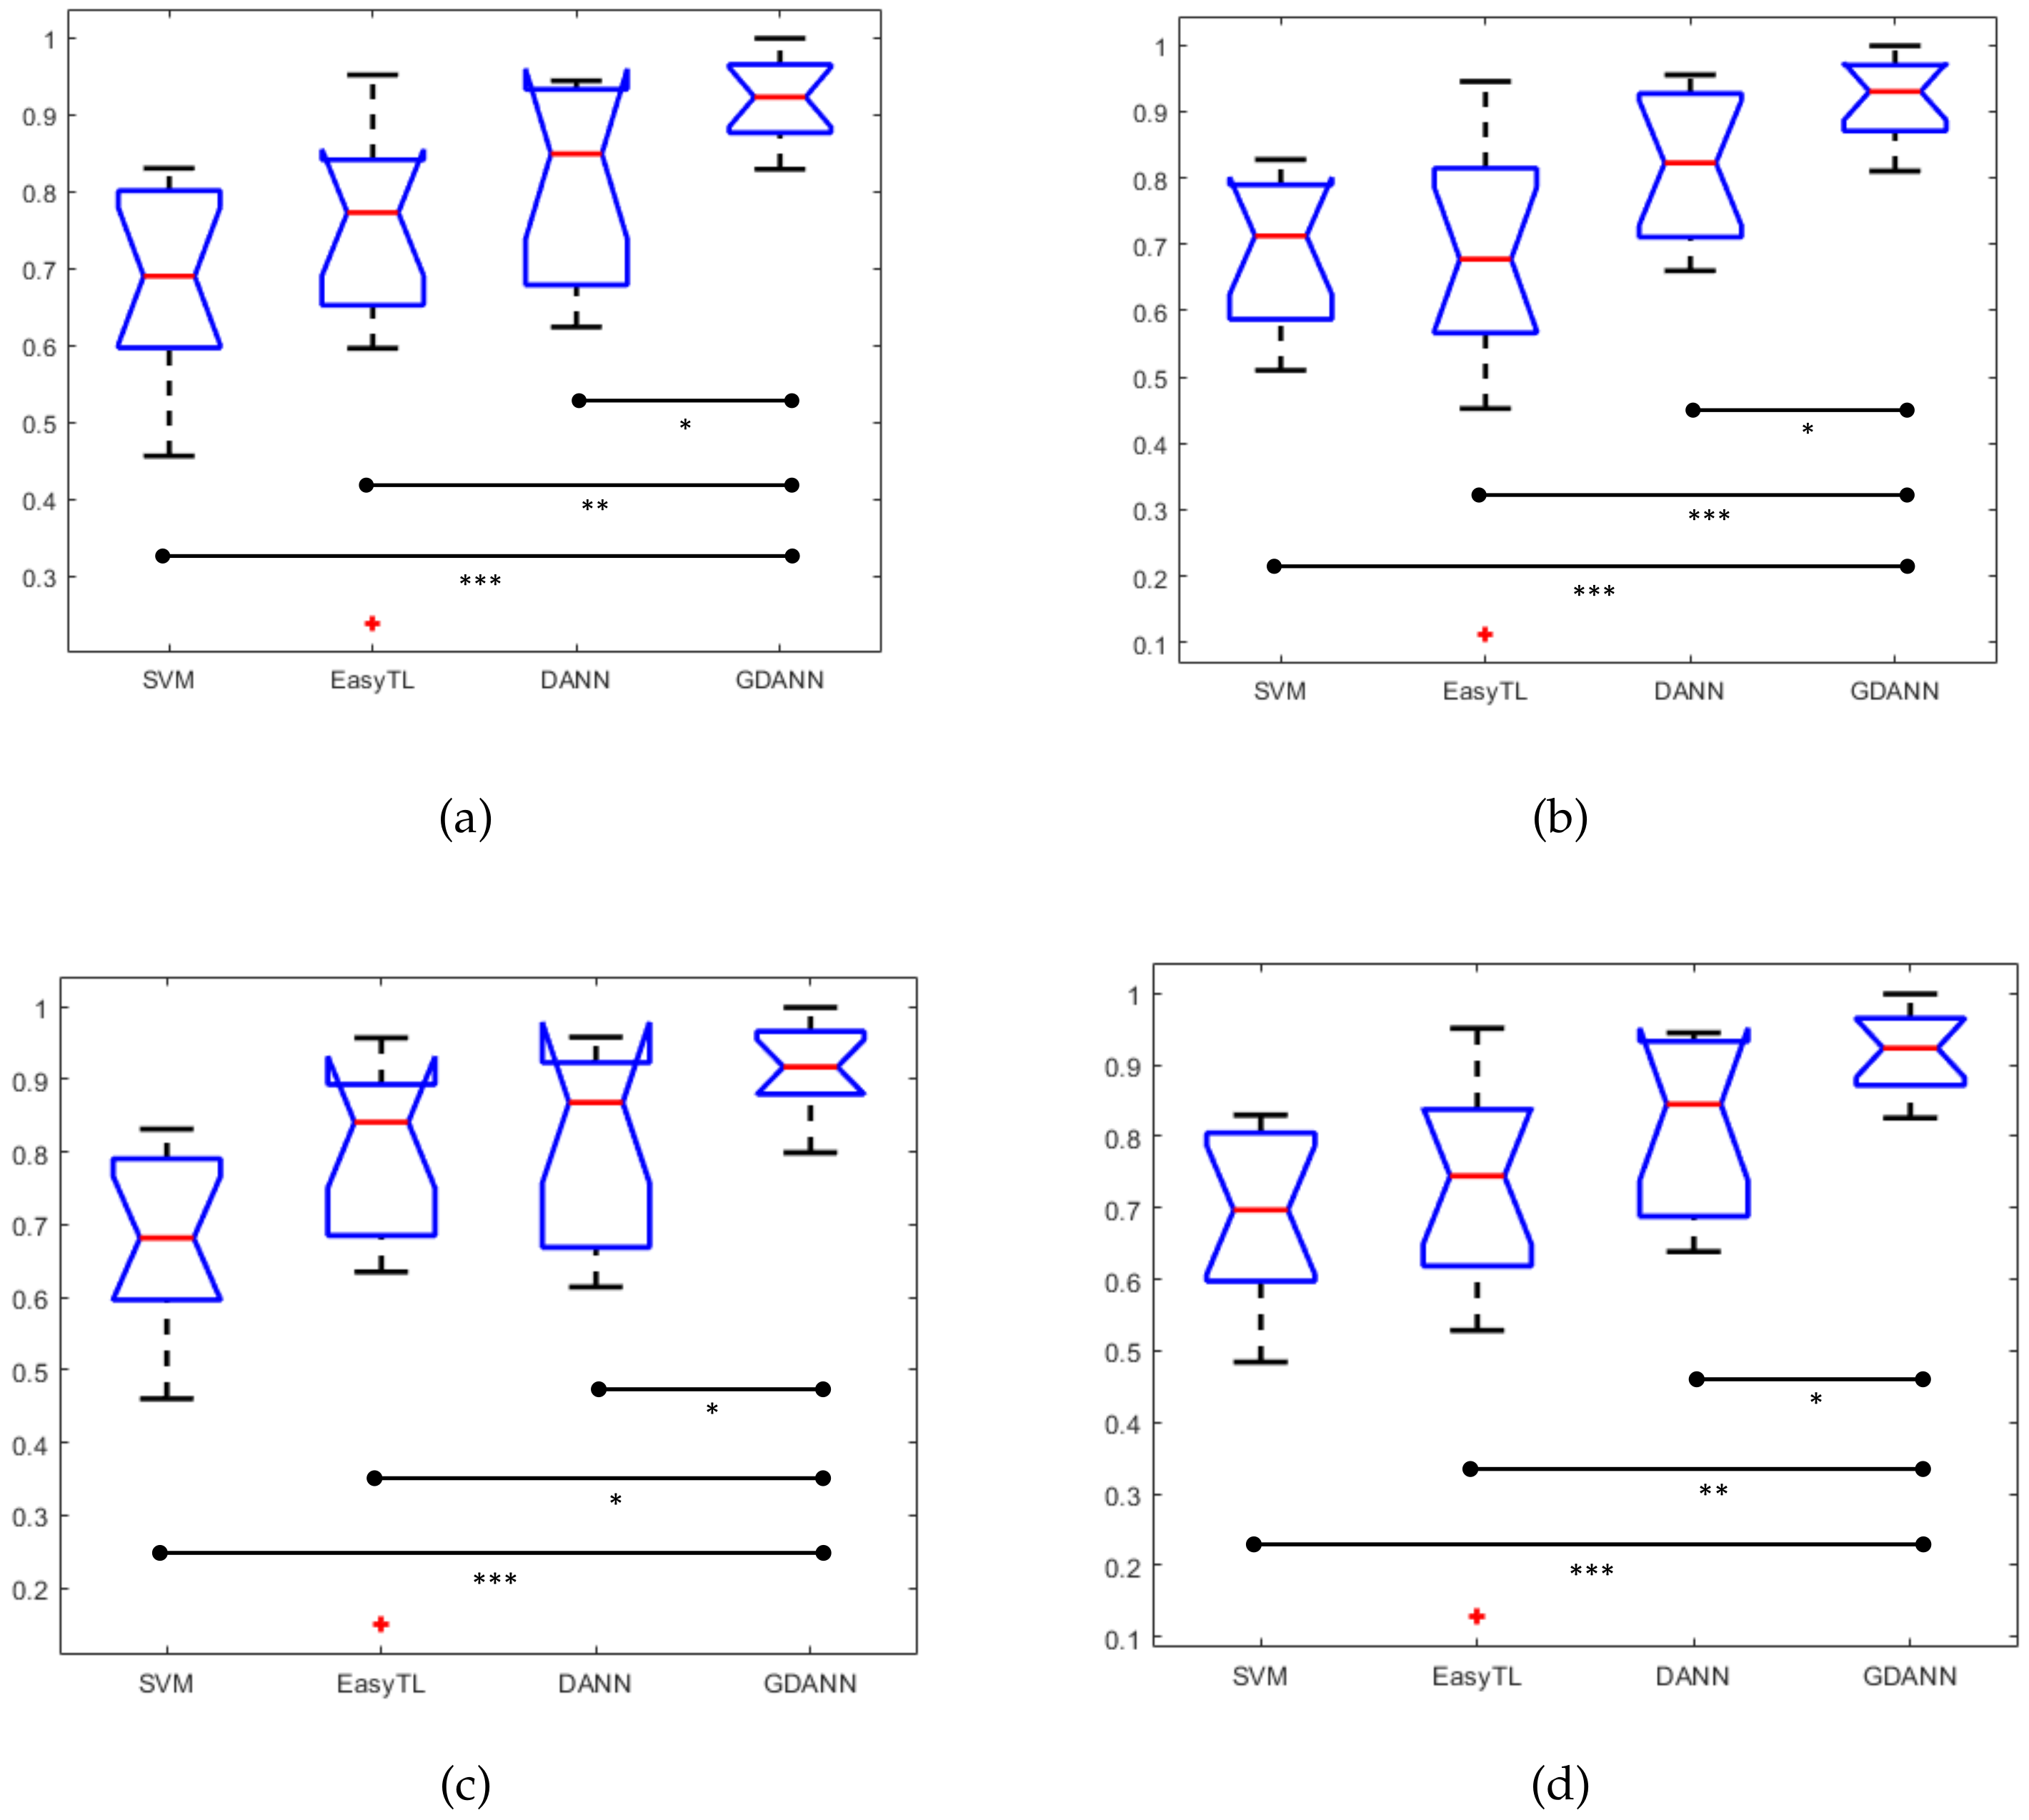
4.5. Performance Comparison between GDANN and Other Existing Models
5. Discussion
- (a)
- Analysis of the number of subjects in the source domain: As analyzed in Section 4.2, in multi-source transfer learning, the source number is an important factor. More sources mean that we will integrate more data to predict fatigued driving. However, in view of the weak correlation between certain subjects, blindly increasing the number of sources may not improve accuracy and result in negative transfer and a calculation burden.
- (b)
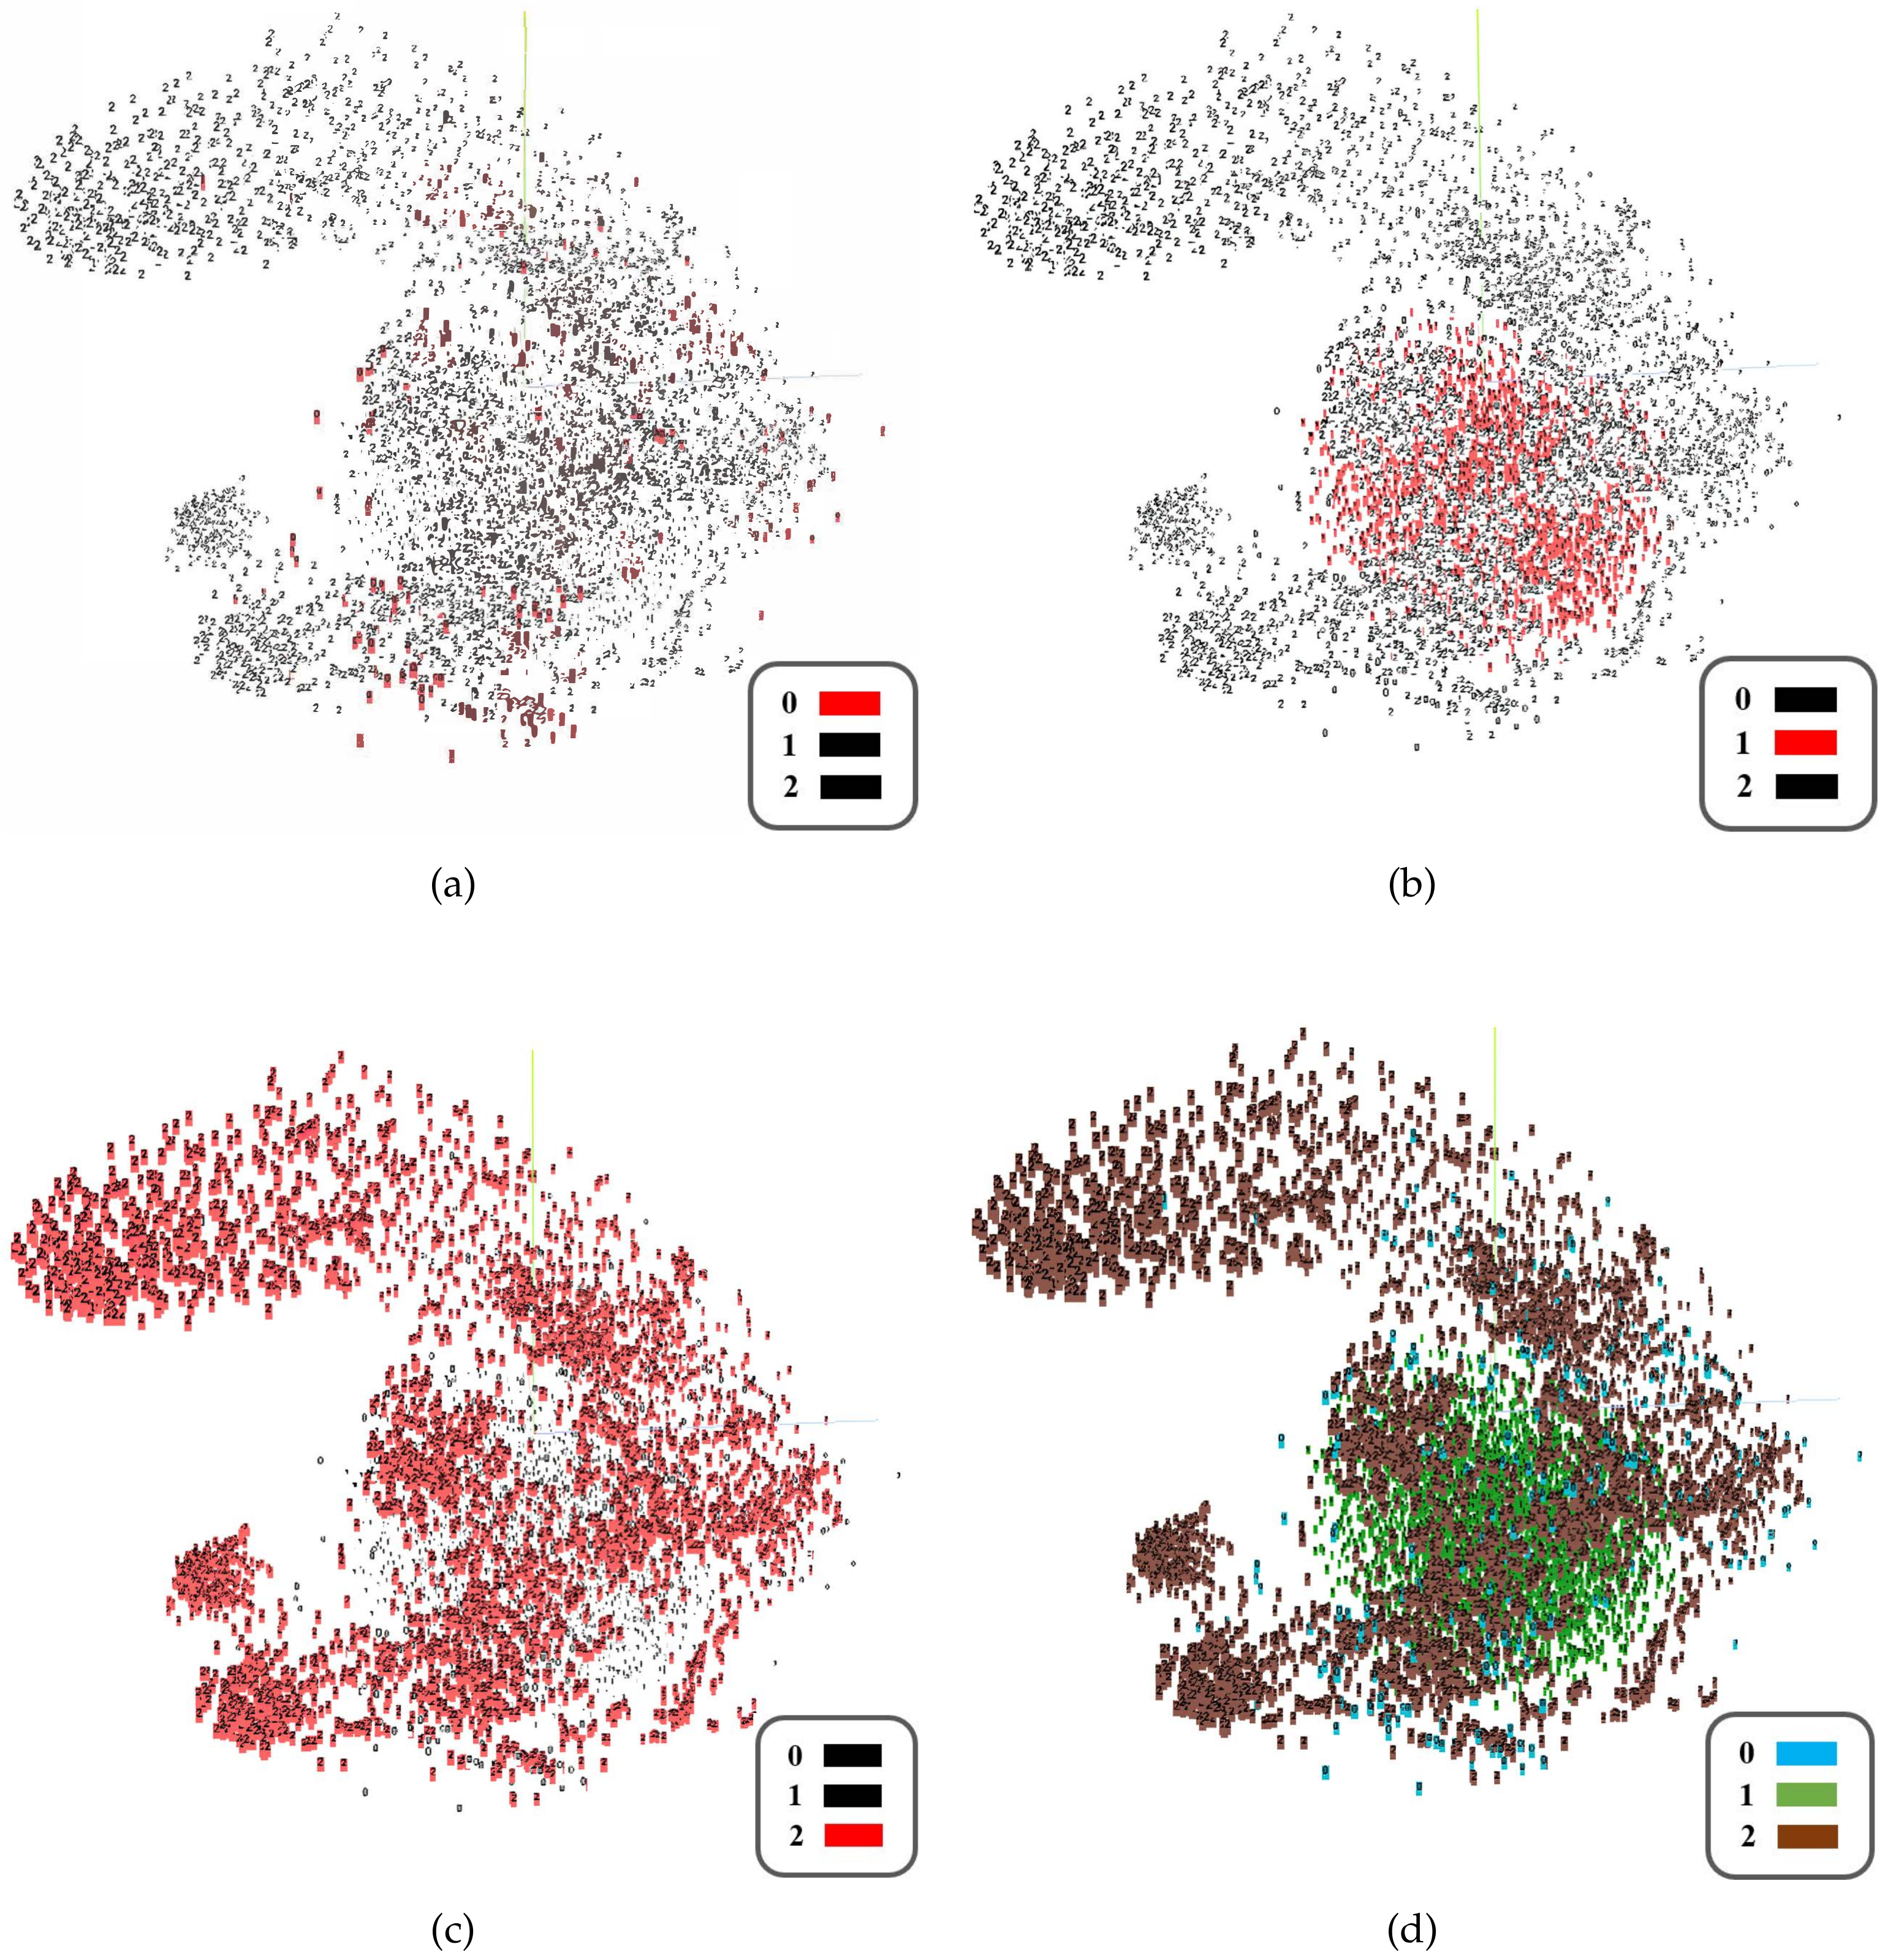
- Analysis of the generated target domain data: As analyzed in Section 4.3, the generated fake data roughly conform to the distribution of the target domain data, effectively making up for the shortcomings of insufficient training data.
- (c)
- Comparison of the classification performance with the original model DANN: Due to the differences in the subjects, the classification performance of GDANN is also different. For those subjects who have good classification results in DANN, GDANN can give a slight improvement, while for those who do not perform well using the DANN method, GDANN will give a significant improvement. Since these accuracy values are not accidental (statistically verified), it can be said that a method for effectively performing EEG classification across subjects with multi-source training has been successfully proposed.
- (d)
- Swiftly approaching convergence of baseline: In the convergence comparison, GDANN quickly reaches the baseline of loss training (i.e., 1) before DANN, and fluctuates on this line. Furthermore, DANN can only converge to 1.05 and cannot go down, which is also a manifestation of its insufficient performance.
- (e)
- Comparison of classification accuracy with the state-of-the-art approaches: When comparing with some excellent related methods, such as supervised machine learning method SVM and transfer learning method EasyTL, as analyzed by Section 4.5, GDANN is seen to have better performance in terms of cross-subject EEG data prediction.
- (f)
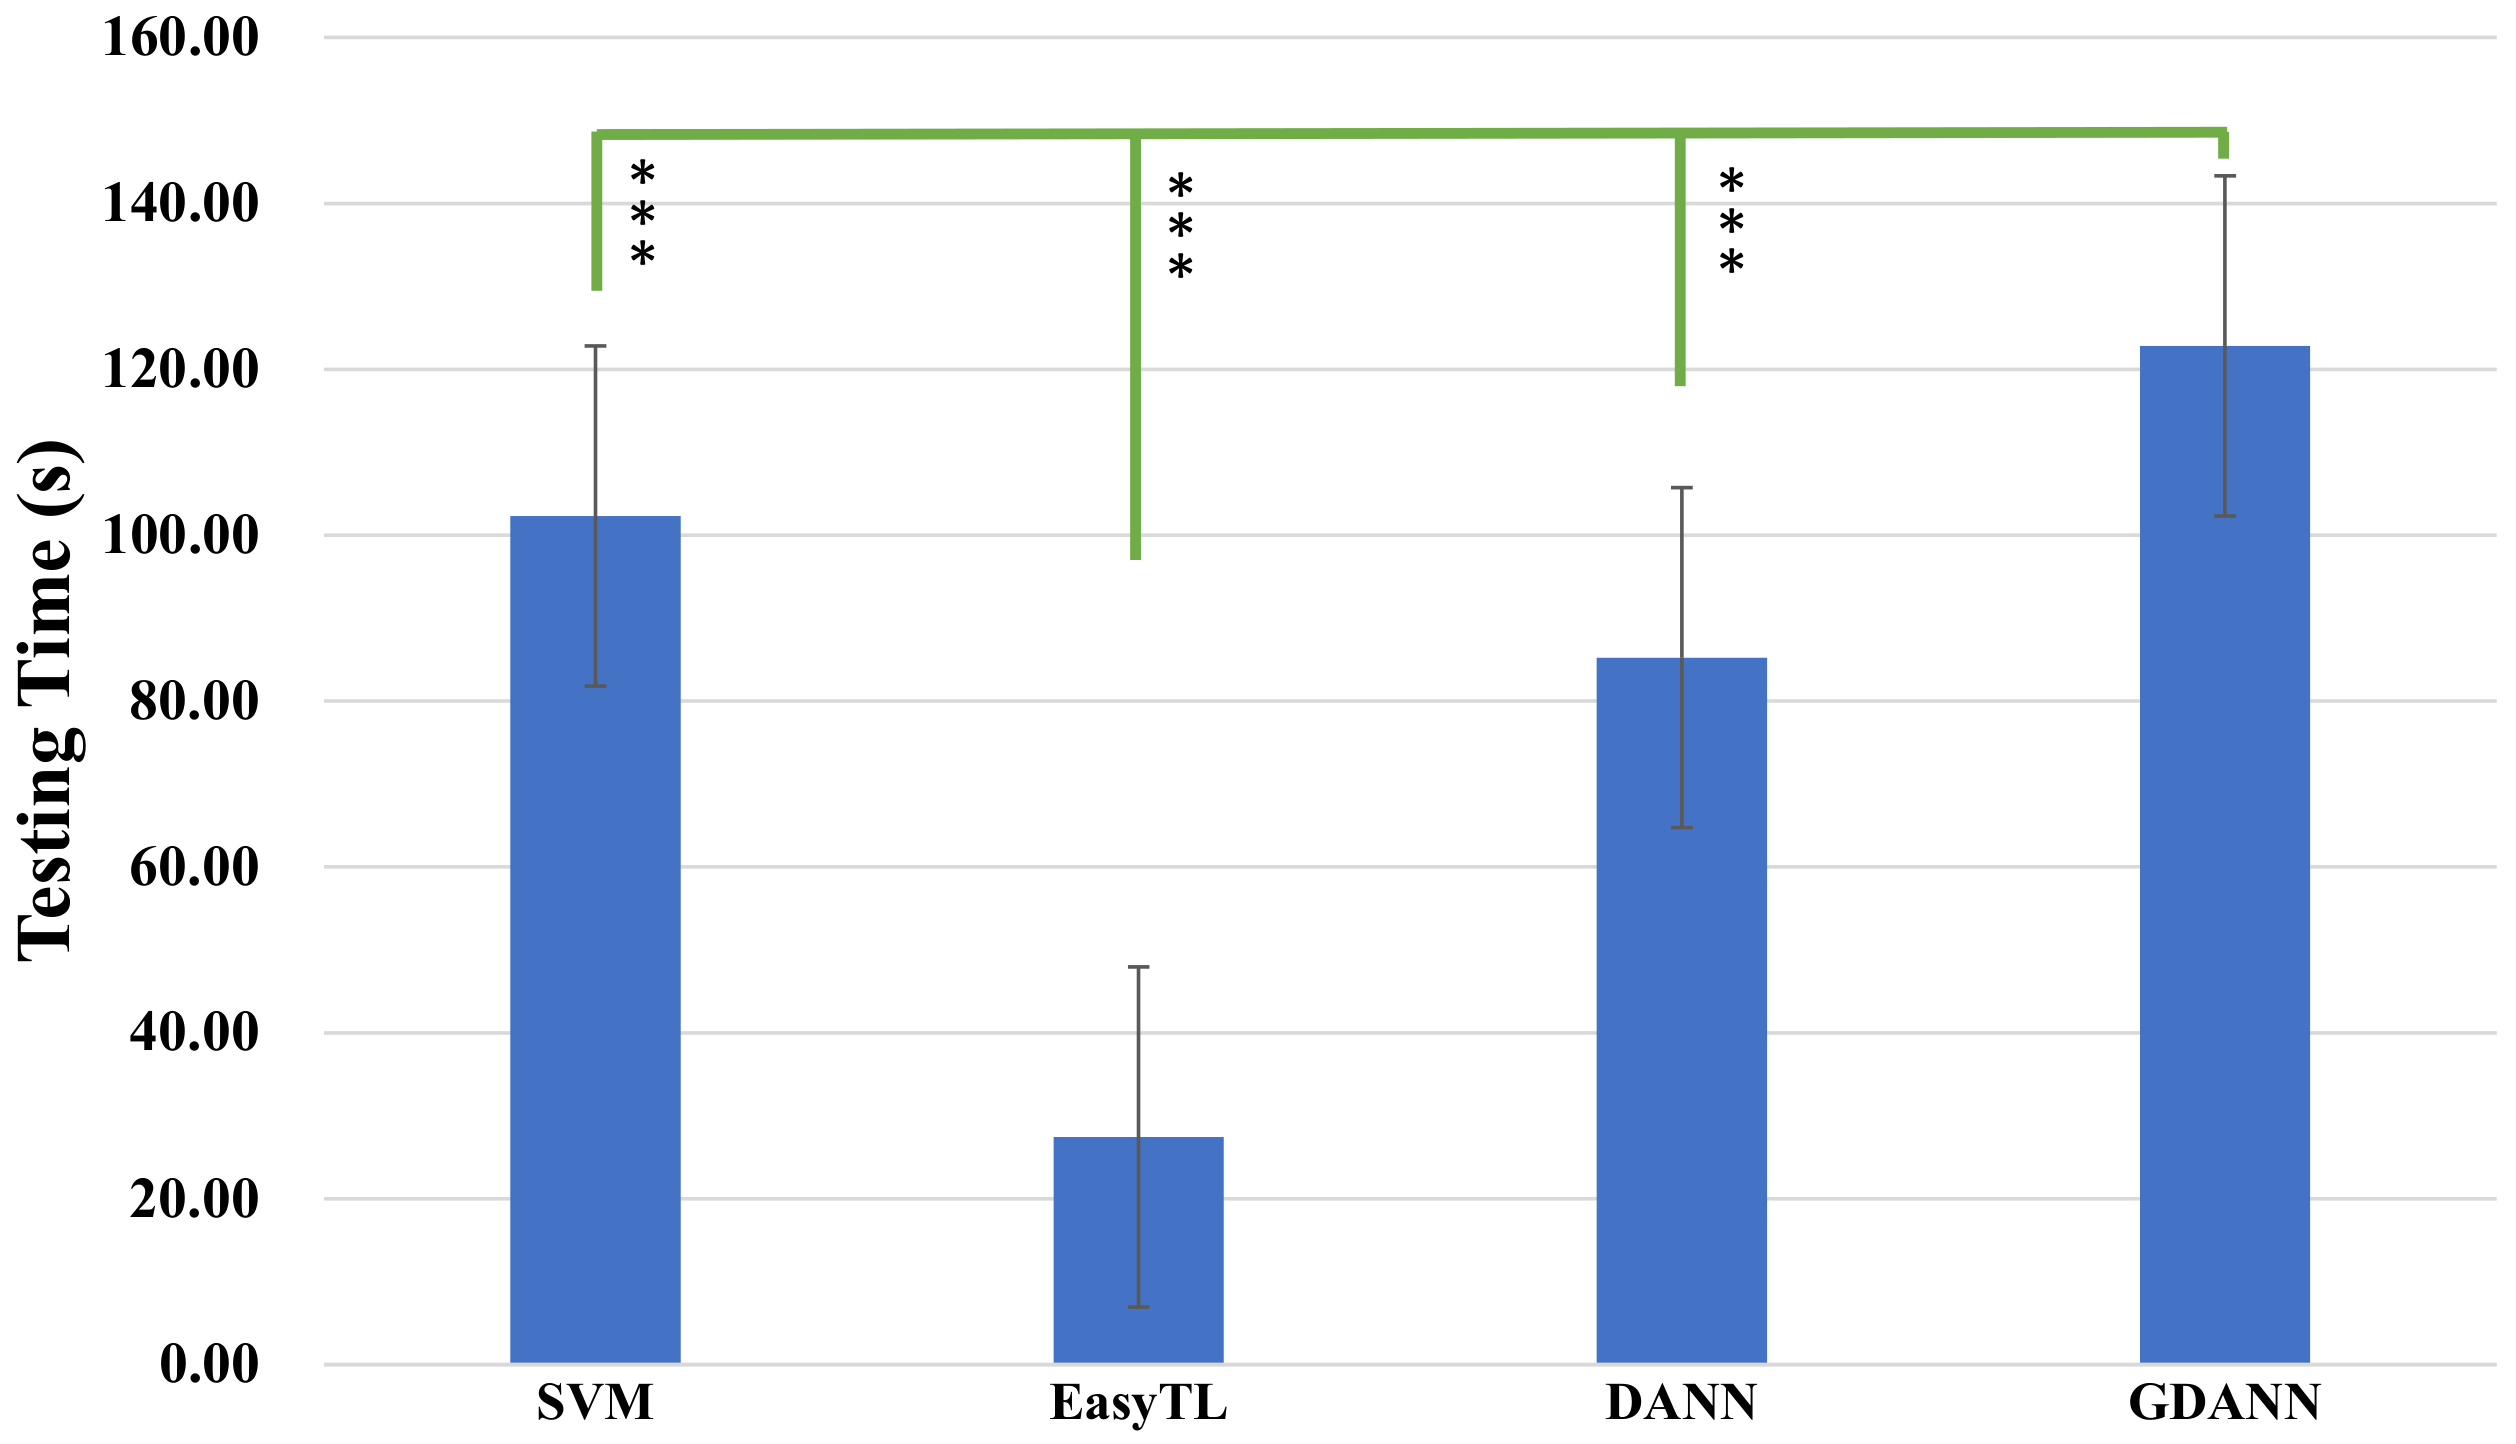
- Comparison of the testing time: In terms of testing time, the proposed work takes more time than other methods. It should be noted that compared to DANN, it has an additional process to adapt to generate auxiliary fake data. In practical use, the training epoch can be appropriately reduced to reduce the time. Most of the time is spent on training the model, and when the model training is completed, its high-efficiency performance can always be used.
6. Conclusions
Author Contributions
Funding
Institutional Review Board Statement
Informed Consent Statement
Data Availability Statement
Conflicts of Interest
Abbreviations
| EEG | Electroencephalogram |
| DANN | Domain-Adversarial Neural Network |
| GDANN | Generative-DANN |
| GAN | Generative Adversarial Networks |
| SVM | Support Vector Machine |
| EasyTL | Easy Transfer Learning |
| BCI | Brain-computer Interaction |
| PSD | Power Spectral Density |
| TAV | the Attentional and Vigilance task |
| WUP | warm up |
| DROW | drowsy |
| ICA | Independent Component Analysis |
| NASA-TLX | National Aeronautics and Space Administration–Task Load Index |
| t-SNE | t-distributed Stochastic Neighbor Embedding |
References
- Lal, S.K.; Craig, A. A critical review of the psychophysiology of driver fatigue. Biol. Psychol. 2001, 55, 173–194. [Google Scholar] [CrossRef]
- World Health Organization. Global Status Report on Road Safety: Time for Action; World Health Organization: Geneva, Switzerland, 2009. [Google Scholar]
- Borghini, G.; Astolfi, L.; Vecchiato, G.; Mattia, D.; Babiloni, F. Measuring neurophysiological signals in aircraft pilots and car drivers for the assessment of mental workload, fatigue and drowsiness. Neurosci. Biobehav. Rev. 2014, 44, 58–75. [Google Scholar] [CrossRef]
- Chaudhuri, A.; Routray, A. Driver Fatigue Detection Through Chaotic Entropy Analysis of Cortical Sources Obtained From Scalp EEG Signals. IEEE Trans. Intell. Transp. Syst. 2020, 21, 185–198. [Google Scholar] [CrossRef]
- Zhang, F.; Su, J.; Geng, L.; Xiao, Z. Driver fatigue detection based on eye state recognition. In Proceedings of the IEEE 2017 International Conference on Machine Vision and Information Technology (CMVIT), Singapore, 17–19 February 2017; pp. 105–110. [Google Scholar]
- Åkerstedt, T.; Gillberg, M. Subjective and objective sleepiness in the active individual. Int. J. Neurosci. 1990, 52, 29–37. [Google Scholar] [CrossRef]
- Beurskens, A.J.; Bültmann, U.; Kant, I.; Vercoulen, J.H.; Bleijenberg, G.; Swaen, G.M. Fatigue among working people: Validity of a questionnaire measure. Occup. Environ. Med. 2000, 57, 353–357. [Google Scholar] [CrossRef] [Green Version]
- Liu, W.; Qian, J.; Yao, Z.; Jiao, X.; Pan, J. Convolutional Two-Stream Network Using Multi-Facial Feature Fusion for Driver Fatigue Detection. Future Internet 2019, 11, 115. [Google Scholar] [CrossRef] [Green Version]
- Smith, M.R.; Coutts, A.J.; Merlini, M.; Deprez, D.; Lenoir, M.; Marcora, S.M. Mental fatigue impairs soccer-specific physical and technical performance. Med. Sci. Sports Exerc. 2016, 48, 267–276. [Google Scholar] [CrossRef]
- Zeng, H.; Yang, C.; Dai, G.; Qin, F.; Zhang, J.; Kong, W. EEG classification of driver mental states by deep learning. Cogn. Neurodyn. 2018, 12, 597–606. [Google Scholar] [CrossRef]
- Nguyen, T.; Ahn, S.; Jang, H.; Jun, S.C.; Kim, J.G. Utilization of a combined EEG/NIRS system to predict driver drowsiness. Sci. Rep. 2017, 7, 43933. [Google Scholar] [CrossRef] [PubMed] [Green Version]
- Di Flumeri, G.; Borghini, G.; Aricò, P.; Sciaraffa, N.; Lanzi, P.; Pozzi, S.; Vignali, V.; Lantieri, C.; Bichicchi, A.; Simone, A.; et al. EEG-based mental workload neurometric to evaluate the impact of different traffic and road conditions in real driving settings. Front. Hum. Neurosci. 2018, 12, 509. [Google Scholar] [CrossRef] [Green Version]
- Zeng, H.; Yang, C.; Zhang, H.; Wu, Z.; Zhang, J.; Dai, G.; Babiloni, F.; Kong, W. A lightGBM-based EEG analysis method for driver mental states classification. Comput. Intel. Neurosci. 2019, 2019, 3761203. [Google Scholar] [CrossRef] [PubMed]
- Chai, R.; Tran, Y.; Naik, G.R.; Nguyen, T.N.; Ling, S.H.; Craig, A.; Nguyen, H.T. Classification of EEG based-mental fatigue using principal component analysis and Bayesian neural network. In Proceedings of the IEEE 2016 38th Annual International Conference of the IEEE Engineering in Medicine and Biology Society (EMBC), Orlando, FL, USA, 16–20 August 2016; pp. 4654–4657. [Google Scholar]
- Rahma, O.N.; Rahmatillah, A. Drowsiness analysis using common spatial pattern and extreme learning machine based on electroencephalogram signal. J. Med. Signals Sens. 2019, 9, 130. [Google Scholar] [CrossRef] [PubMed]
- Huo, X.Q.; Zheng, W.L.; Lu, B.L. Driving fatigue detection with fusion of EEG and forehead EOG. In Proceedings of the IEEE 2016 International Joint Conference on Neural Networks (IJCNN), Vancouver, BC, Canada, 24–29 July 2016; pp. 897–904. [Google Scholar]
- San, P.P.; Ling, S.H.; Chai, R.; Tran, Y.; Craig, A.; Nguyen, H. EEG-based driver fatigue detection using hybrid deep generic model. In Proceedings of the IEEE 2016 38th Annual International Conference of the IEEE Engineering in Medicine and Biology Society (EMBC), Orlando, FL, USA, 16–20 August 2016; pp. 800–803. [Google Scholar]
- Ganin, Y.; Ustinova, E.; Ajakan, H.; Germain, P.; Larochelle, H.; Laviolette, F.; Marchand, M.; Lempitsky, V. Domain-adversarial training of neural networks. J. Mach. Learn. Res. 2016, 17, 1–35. [Google Scholar]
- Yao, Y.; Doretto, G. Boosting for transfer learning with multiple sources. In Proceedings of the 2010 IEEE Computer Society Conference on Computer Vision and Pattern Recognition, San Francisco, CA, USA, 13–18 June 2010; pp. 1855–1862. [Google Scholar]
- Pan, S.J.; Yang, Q. A Survey on Transfer Learning. IEEE Trans. Knowl. Data Eng. 2010, 22, 1345–1359. [Google Scholar] [CrossRef]
- Goodfellow, I.J.; Pouget-Abadie, J.; Mirza, M.; Xu, B.; Warde-Farley, D.; Ozair, S.; Courville, A.; Bengio, Y. Generative Adversarial Networks. arXiv 2014, arXiv:1406.2661. [Google Scholar] [CrossRef]
- Fairclough, S.H.; Venables, L.; Tattersall, A. The influence of task demand and learning on the psychophysiological response. Int. J. Psychophysiol. 2005, 56, 171–184. [Google Scholar] [CrossRef]
- Vecchiato, G.; Borghini, G.; Aricò, P.; Graziani, I.; Maglione, A.G.; Cherubino, P.; Babiloni, F. Investigation of the effect of EEG-BCI on the simultaneous execution of flight simulation and attentional tasks. Med. Biol. Eng. Comput. 2016, 54, 1503–1513. [Google Scholar] [CrossRef]
- Lal, S.K.; Craig, A. Driver fatigue: Electroencephalography and psychological assessment. Psychophysiology 2002, 39, 313–321. [Google Scholar] [CrossRef]
- Maglione, A.; Borghini, G.; Aricò, P.; Borgia, F.; Graziani, I.; Colosimo, A.; Kong, W.; Vecchiato, G.; Babiloni, F. Evaluation of the workload and drowsiness during car driving by using high resolution EEG activity and neurophysiologic indices. In Proceedings of the IEEE 2014 36th Annual International Conference of the IEEE Engineering in Medicine and Biology Society, Chicago, IL, USA, 26–30 August 2014; pp. 6238–6241. [Google Scholar]
- Hart, S.G.; Staveland, L.E. Development of NASA-TLX (Task Load Index): Results of empirical and theoretical research. In Advances in Psychology; Elsevier: Amsterdam, The Netherlands, 1988; Volume 52, pp. 139–183. [Google Scholar]
- Jung, T.P.; Makeig, S.; Humphries, C.; Lee, T.W.; Mckeown, M.J.; Iragui, V.; Sejnowski, T.J. Removing electroencephalographic artifacts by blind source separation. Psychophysiology 2000, 37, 163–178. [Google Scholar] [CrossRef]
- Pfurtscheller, G.; Da Silva, F.L. Event-related EEG/MEG synchronization and desynchronization: Basic principles. Clin. Neurophysiol. 1999, 110, 1842–1857. [Google Scholar] [CrossRef]
- Pal, M.; Bandyopadhyay, S.; Bhattacharyya, S. A Many Objective Optimization Approach for Transfer Learning in EEG Classification. arXiv 2019, arXiv:1904.04156. [Google Scholar]
- Tzeng, E.; Hoffman, J.; Saenko, K.; Darrell, T. Adversarial discriminative domain adaptation. In Proceedings of the IEEE Conference on Computer Vision and Pattern Recognition, Honolulu, HI, USA, 21–26 July 2017; pp. 7167–7176. [Google Scholar]
- Sasaki, Y. The Truth of the f-Measure. 2007. Available online: https://www.cs.odu.edu/~mukka/cs795sum10dm/Lecturenotes/Day3/F-measure-YS-26Oct07.pdf (accessed on 30 July 2018).
- Sokolova, M.; Lapalme, G. A systematic analysis of performance measures for classification tasks. Inf. Process. Manag. 2009, 45, 427–437. [Google Scholar] [CrossRef]
- Zhang, H.; Weng, T.W.; Chen, P.Y.; Hsieh, C.J.; Daniel, L. Efficient neural network robustness certification with general activation functions. In Proceedings of the Thirty-Second Conference on Neural Information Processing Systems, Montreal, QC, Canada, 2–8 December 2018. [Google Scholar]
- Kingma, D.P.; Ba, J. Adam: A method for stochastic optimization. arXiv 2014, arXiv:1412.6980. [Google Scholar]
- Burges, C.J. A tutorial on support vector machines for pattern recognition. Data Min. Knowl. Discov. 1998, 2, 121–167. [Google Scholar] [CrossRef]
- Wang, J.; Chen, Y.; Yu, H.; Huang, M.; Yang, Q. Easy transfer learning by exploiting intra-domain structures. In Proceedings of the IEEE 2019 International Conference on Multimedia and Expo (ICME), Shanghai, China, 8–12 July 2019; pp. 1210–1215. [Google Scholar]
- Kong, W.; Zhou, Z.; Jiang, B.; Babiloni, F.; Borghini, G. Assessment of driving fatigue based on intra/inter-region phase synchronization. Neurocomputing 2017, 219, 474–482. [Google Scholar] [CrossRef]
- Zeng, H.; Zhang, J.; Zakaria, W.; Babiloni, F.; Gianluca, B.; Li, X.; Kong, W. InstanceEasyTL: An Improved Transfer-Learning Method for EEG-Based Cross-Subject Fatigue Detection. Sensors 2020, 20, 7251. [Google Scholar] [CrossRef]
- Wattenberg, M.; Viégas, F.; Johnson, I. How to Use t-SNE Effectively. Distill 2016. [Google Scholar] [CrossRef]
- Wilcoxon, F. Individual comparisons by ranking methods. In Breakthroughs in Statistics; Springer: Berlin/Heidelberg, Germany, 1992; pp. 196–202. [Google Scholar]

| Predicted = 1 | Predicted = 0 | |
|---|---|---|
| Label = 1 | TP (True Positive) | FP (False Positive) |
| Label = 0 | FN (False Negative) | TN (True Negative) |
| 1. Recall = TP/(TP + FN) 2. Precision = TP/(TP + FP) 3. Accuracy = (TP + TN)/(TP + TN + FN + TN) 4. F1Score = (2 × Precision × Recall)/(Precisioon + Recall) | ||
| Others_Target Subject ID | Accuracy | Precision | F1Score | Recall | ||||
|---|---|---|---|---|---|---|---|---|
| DANN | GDANN | DANN | GDANN | DANN | GDANN | DANN | GDANN | |
| Others_Subject #1 | 0.6238 | 0.8294 | 0.6650 | 0.8800 | 0.6387 | 0.8376 | 0.6143 | 0.7991 |
| Others_Subject #2 | 0.8838 | 0.9531 | 0.8900 | 0.9413 | 0.8845 | 0.9525 | 0.8790 | 0.9643 |
| Others_Subject #3 | 0.6638 | 0.8831 | 0.6750 | 0.8425 | 0.6675 | 0.8782 | 0.6601 | 0.9171 |
| Others_Subject #4 | 0.9363 | 0.9988 | 0.9550 | 0.9988 | 0.9374 | 0.9988 | 0.9205 | 0.9988 |
| Others_Subject #5 | 0.8113 | 0.9019 | 0.7875 | 0.9150 | 0.8067 | 0.9032 | 0.8268 | 0.8916 |
| Others_Subject #6 | 0.9313 | 0.9625 | 0.9325 | 0.9688 | 0.9313 | 0.9627 | 0.9302 | 0.9568 |
| Others_Subject #7 | 0.6825 | 0.8831 | 0.7225 | 0.9038 | 0.6947 | 0.8840 | 0.6690 | 0.8695 |
| Others_Subject #8 | 0.6663 | 0.8288 | 0.6600 | 0.8100 | 0.6642 | 0.8255 | 0.6684 | 0.8416 |
| Others_Subject #9 | 0.9438 | 0.9719 | 0.9550 | 0.9725 | 0.9444 | 0.9719 | 0.9340 | 0.9713 |
| Others_Subject #10 | 0.9375 | 0.9863 | 0.9150 | 0.9763 | 0.9361 | 0.9861 | 0.9581 | 0.9962 |
| Others_Subject #11 | 0.7963 | 0.8556 | 0.7900 | 0.8200 | 0.7950 | 0.8503 | 0.8000 | 0.8831 |
| Others_Subject #12 | 0.8488 | 0.9225 | 0.8225 | 0.9300 | 0.8447 | 0.9231 | 0.8681 | 0.9163 |
| Others_Subject #13 | 0.9113 | 0.9356 | 0.9250 | 0.9500 | 0.9125 | 0.9365 | 0.9002 | 0.9235 |
| Average | 0.8182 | 0.9163 | 0.8227 | 0.9161 | 0.8198 | 0.9162 | 0.8176 | 0.9176 |
Publisher’s Note: MDPI stays neutral with regard to jurisdictional claims in published maps and institutional affiliations. |
© 2021 by the authors. Licensee MDPI, Basel, Switzerland. This article is an open access article distributed under the terms and conditions of the Creative Commons Attribution (CC BY) license (http://creativecommons.org/licenses/by/4.0/).
Share and Cite
Zeng, H.; Li, X.; Borghini, G.; Zhao, Y.; Aricò, P.; Di Flumeri, G.; Sciaraffa, N.; Zakaria, W.; Kong, W.; Babiloni, F. An EEG-Based Transfer Learning Method for Cross-Subject Fatigue Mental State Prediction. Sensors 2021, 21, 2369. https://doi.org/10.3390/s21072369
Zeng H, Li X, Borghini G, Zhao Y, Aricò P, Di Flumeri G, Sciaraffa N, Zakaria W, Kong W, Babiloni F. An EEG-Based Transfer Learning Method for Cross-Subject Fatigue Mental State Prediction. Sensors. 2021; 21(7):2369. https://doi.org/10.3390/s21072369
Chicago/Turabian StyleZeng, Hong, Xiufeng Li, Gianluca Borghini, Yue Zhao, Pietro Aricò, Gianluca Di Flumeri, Nicolina Sciaraffa, Wael Zakaria, Wanzeng Kong, and Fabio Babiloni. 2021. "An EEG-Based Transfer Learning Method for Cross-Subject Fatigue Mental State Prediction" Sensors 21, no. 7: 2369. https://doi.org/10.3390/s21072369