
Secured Perimeter with Electromagnetic Detection and Tracking with Drone Embedded and Static Cameras

 , ,
, ,
Abstract
:1. Introduction
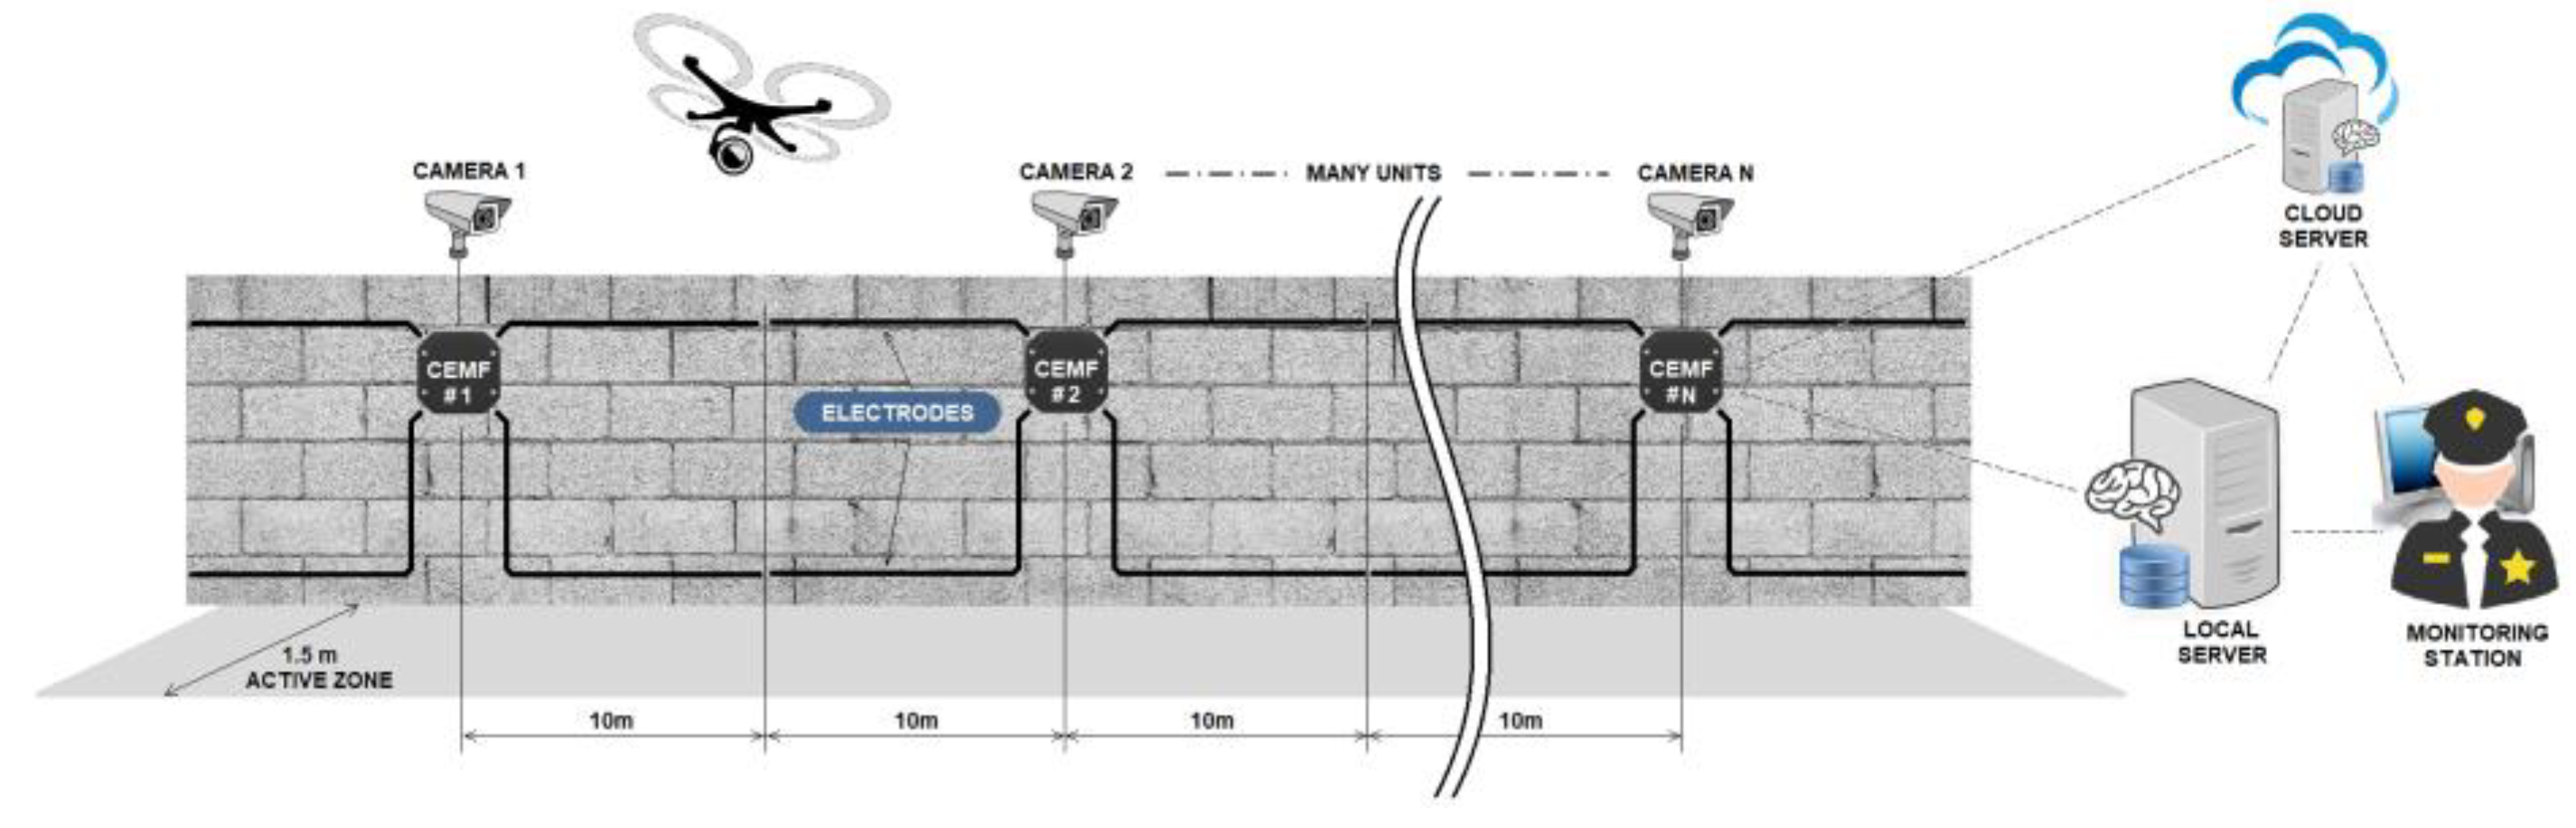
2. System Overview
3. CEMF Secured Perimeter
- (a)
- Invisibility: The electromagnetic field generated crosses objects and walls (the frequency of operation is in the range of kHz), allowing the sensor to be hidden behind or even inside a wall, which is not possible with the conventional IR or microwave sensors.
- (b)
- Long Range: The sensor can detect an object up to 10−20 m along the length of a wall and 1.5 m beyond the breadth of it.
- (c)
- Discriminative: The technology can detect the perturbation corresponding to a person’s disruption in the electromagnetic field, different from an object or even an animal perturbation. As a result, the sensor can distinguish between a person and any other type of intruder, thus reducing false alarms from 40% (other technologies) to 10%.
- (d)
- Preventive detection: Threats are detected even before any harmful actions occur, responding with different alarm levels. The grade of the threat can be measured by distinguishing between loitering, touching, or climbing the fence without the need of cameras.
- (e)
- Tracking and identifying the intruders: As an intruder moves along the wall, the units track its route along the perimeter.
- (f)
- Personal data protection law-friendly: The cameras can remain switched off most of the time and switch back on in the event of an alarm.
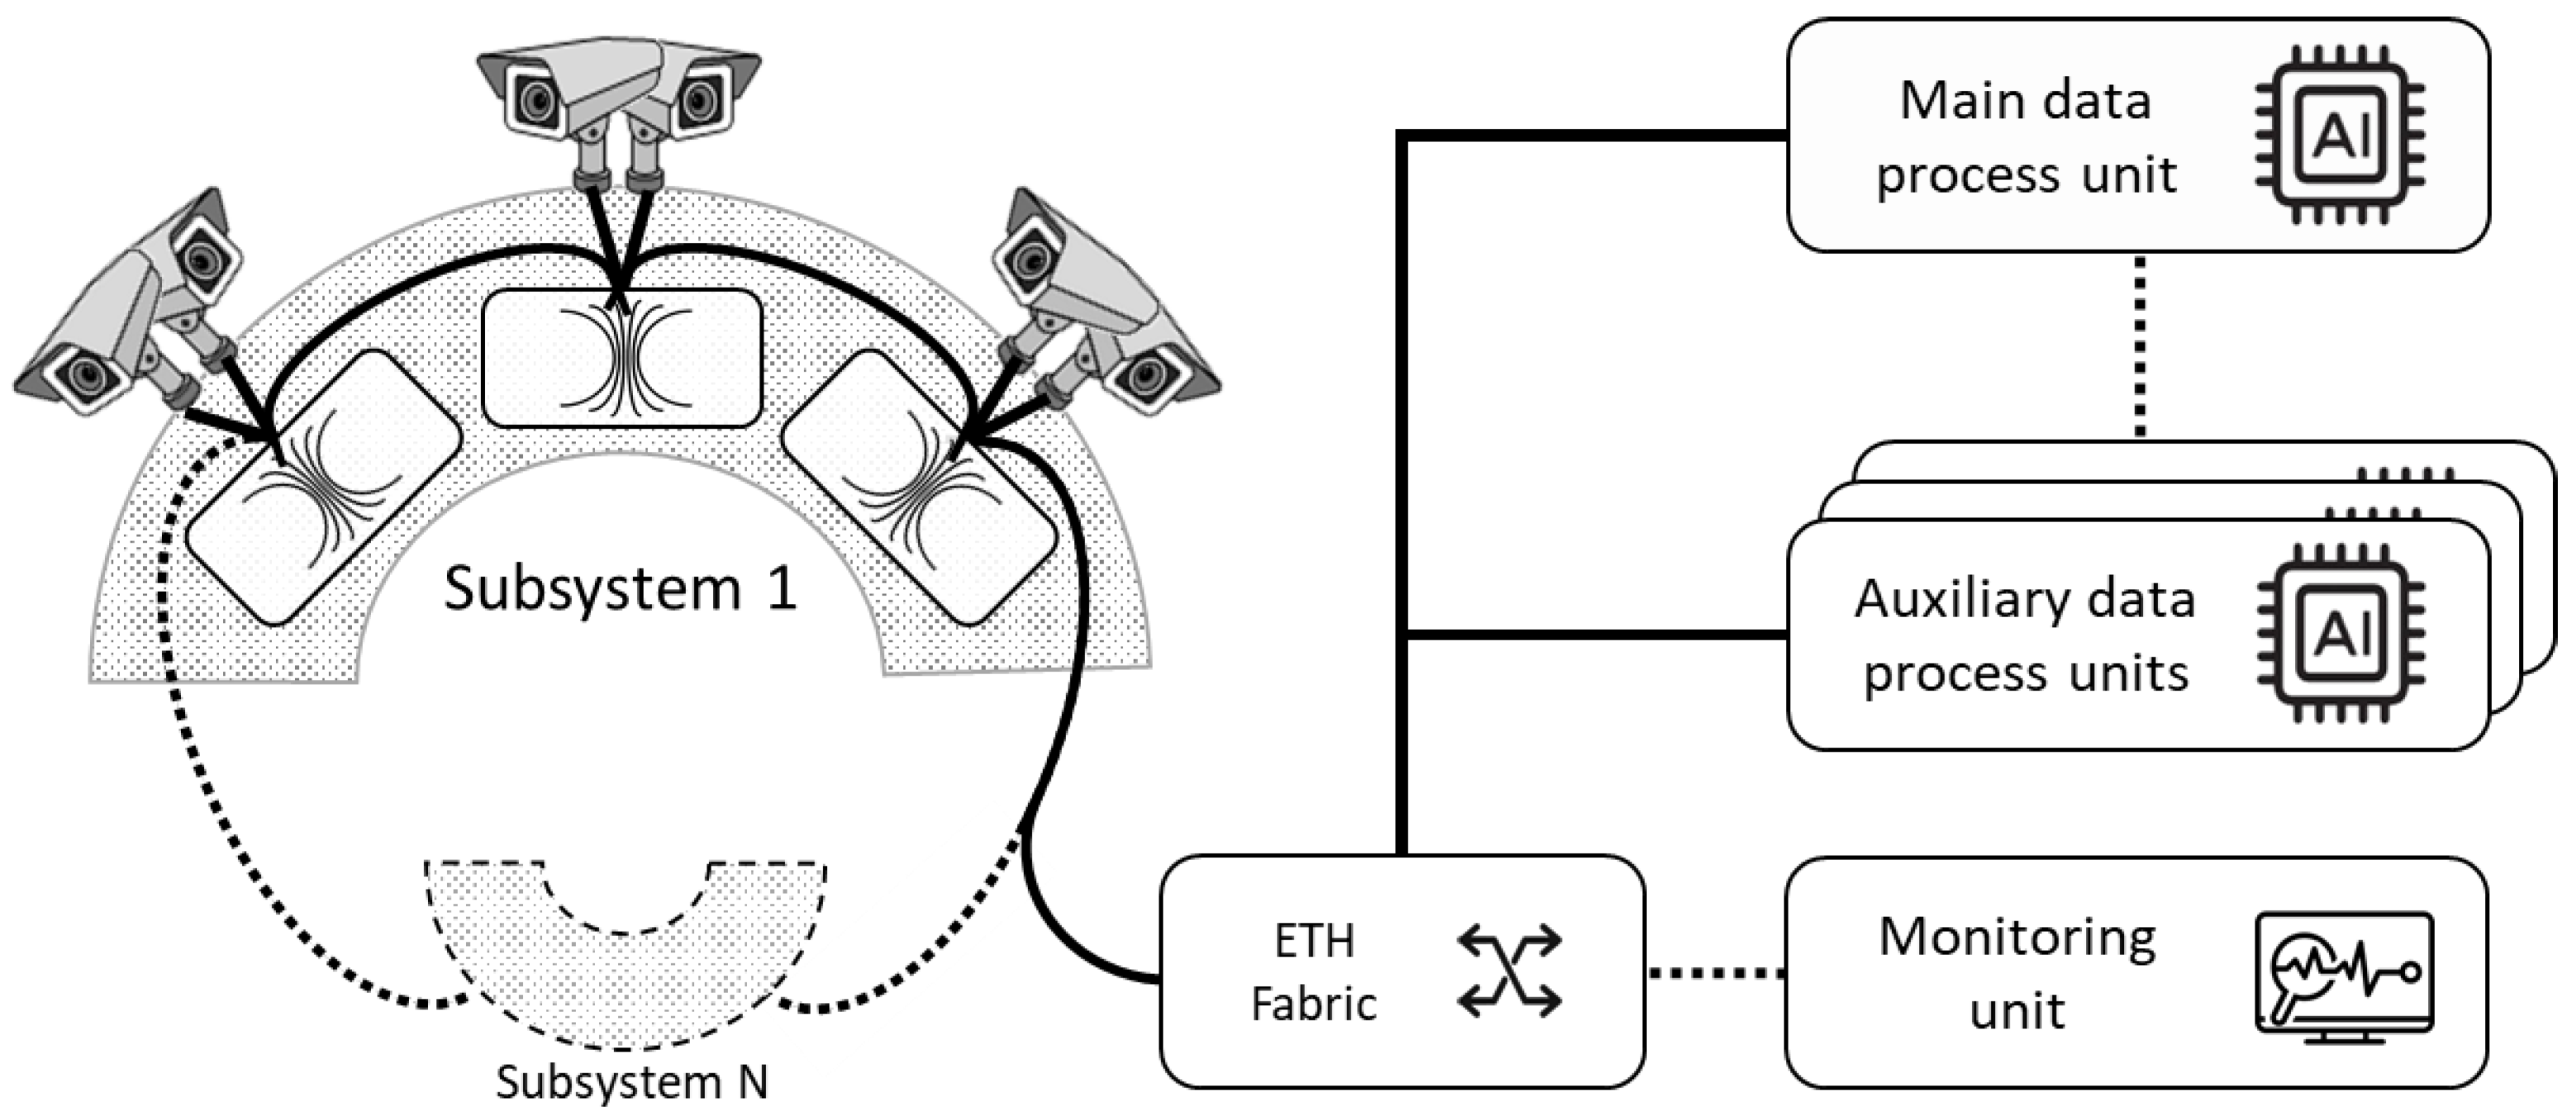
3.1. Architecture
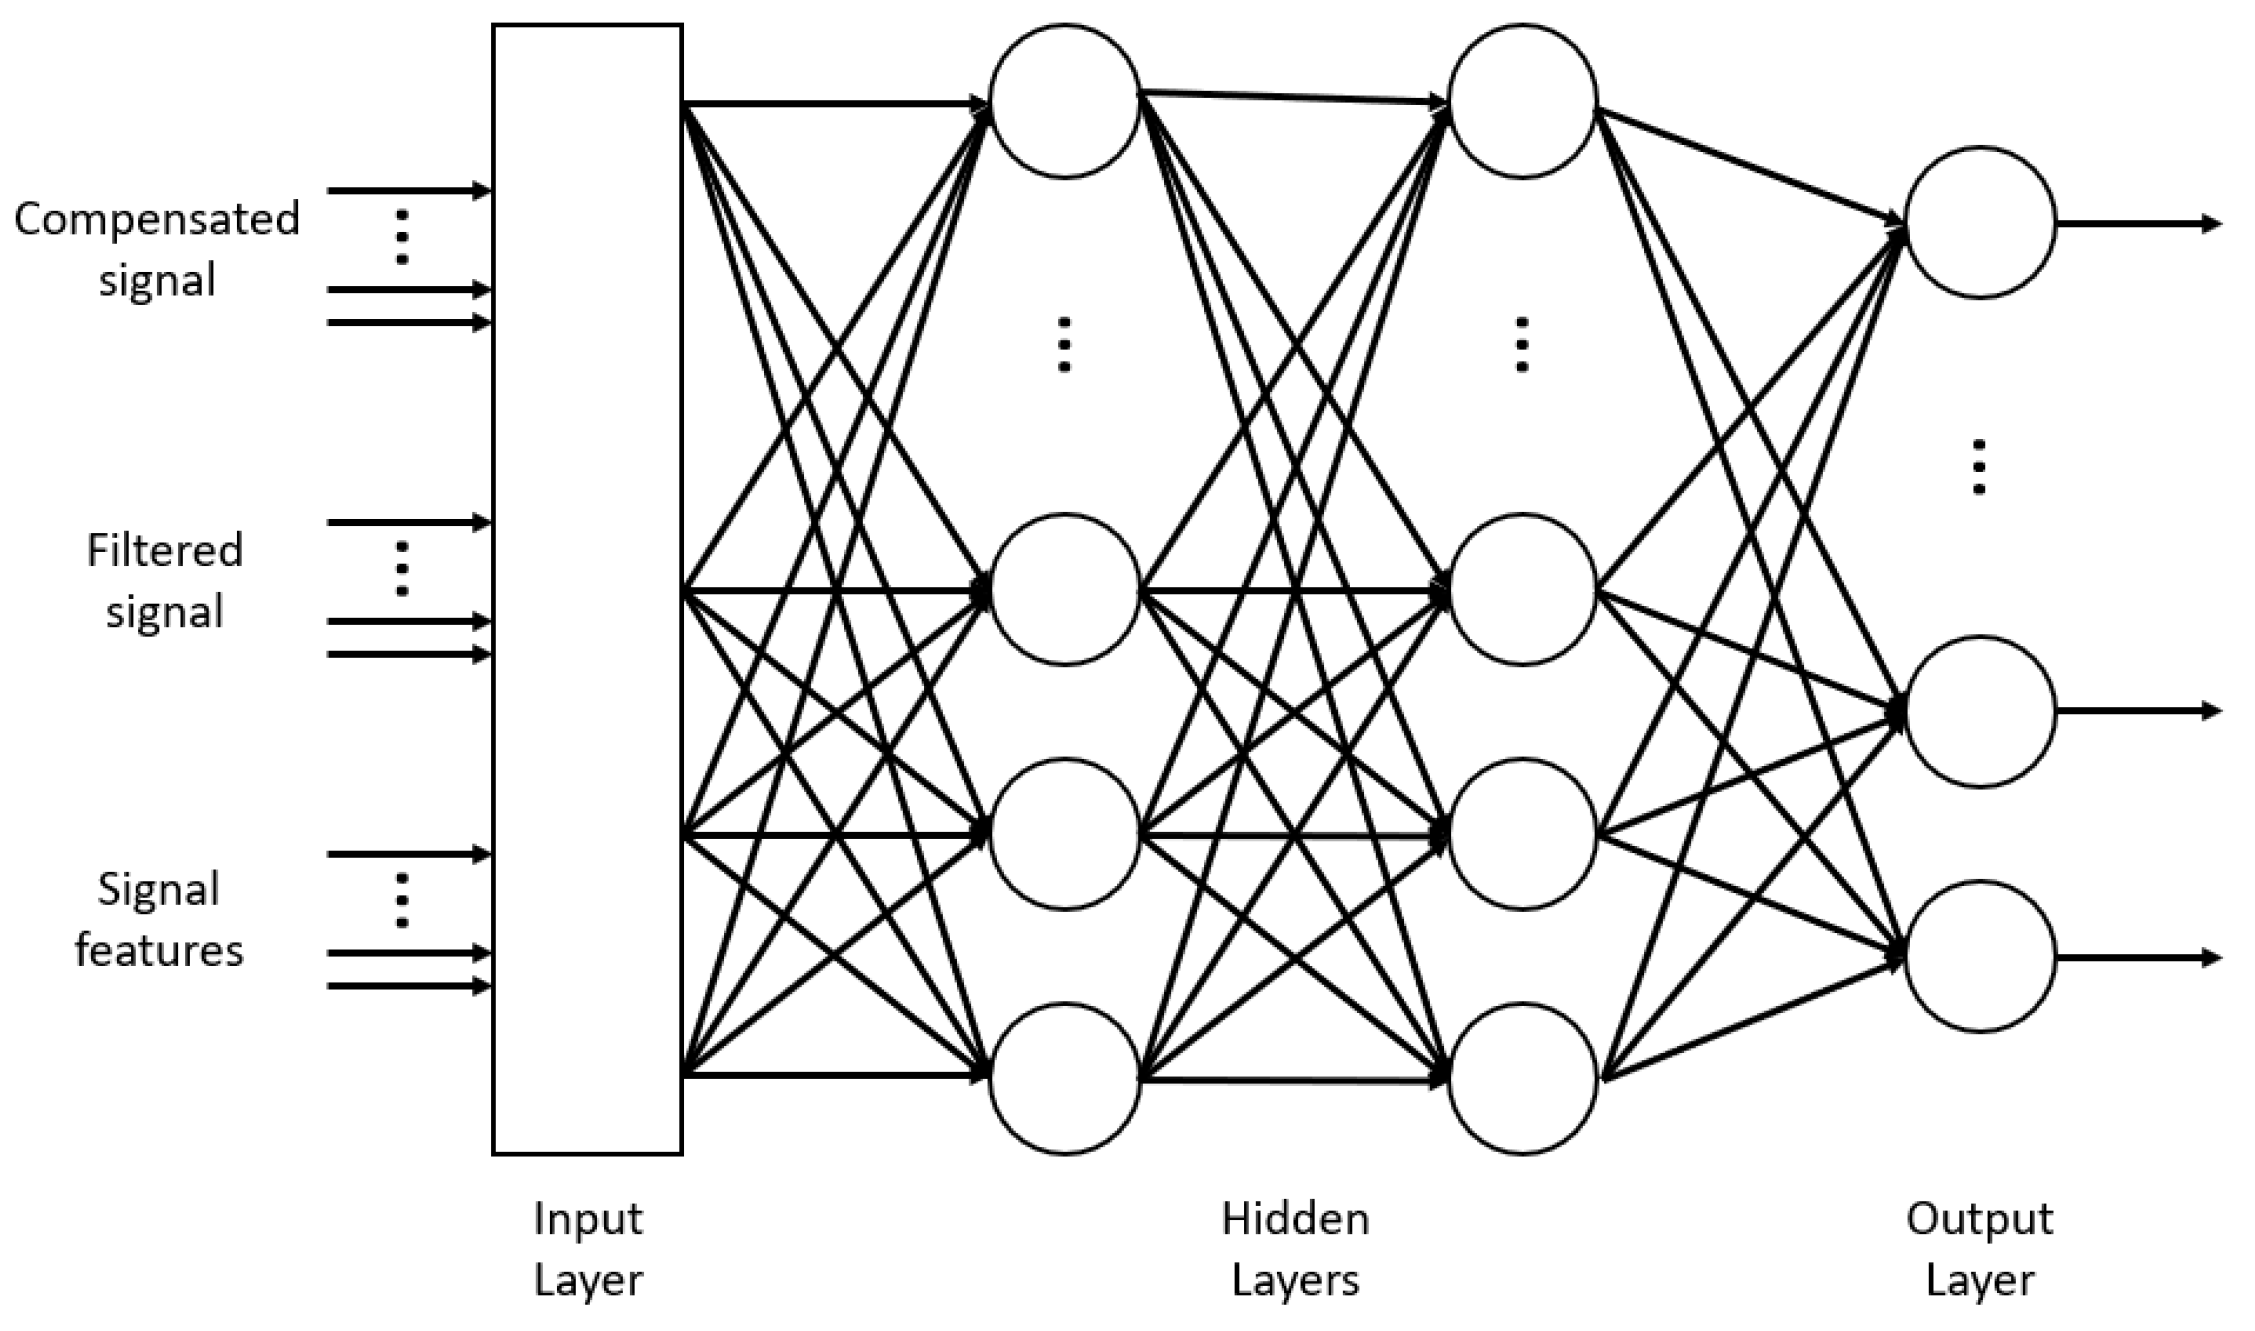
3.2. Algorithms
- Correlation for left−left, right−right, top−top, bottom−bottom and all channels;
- Maximum and minimum for all channels;
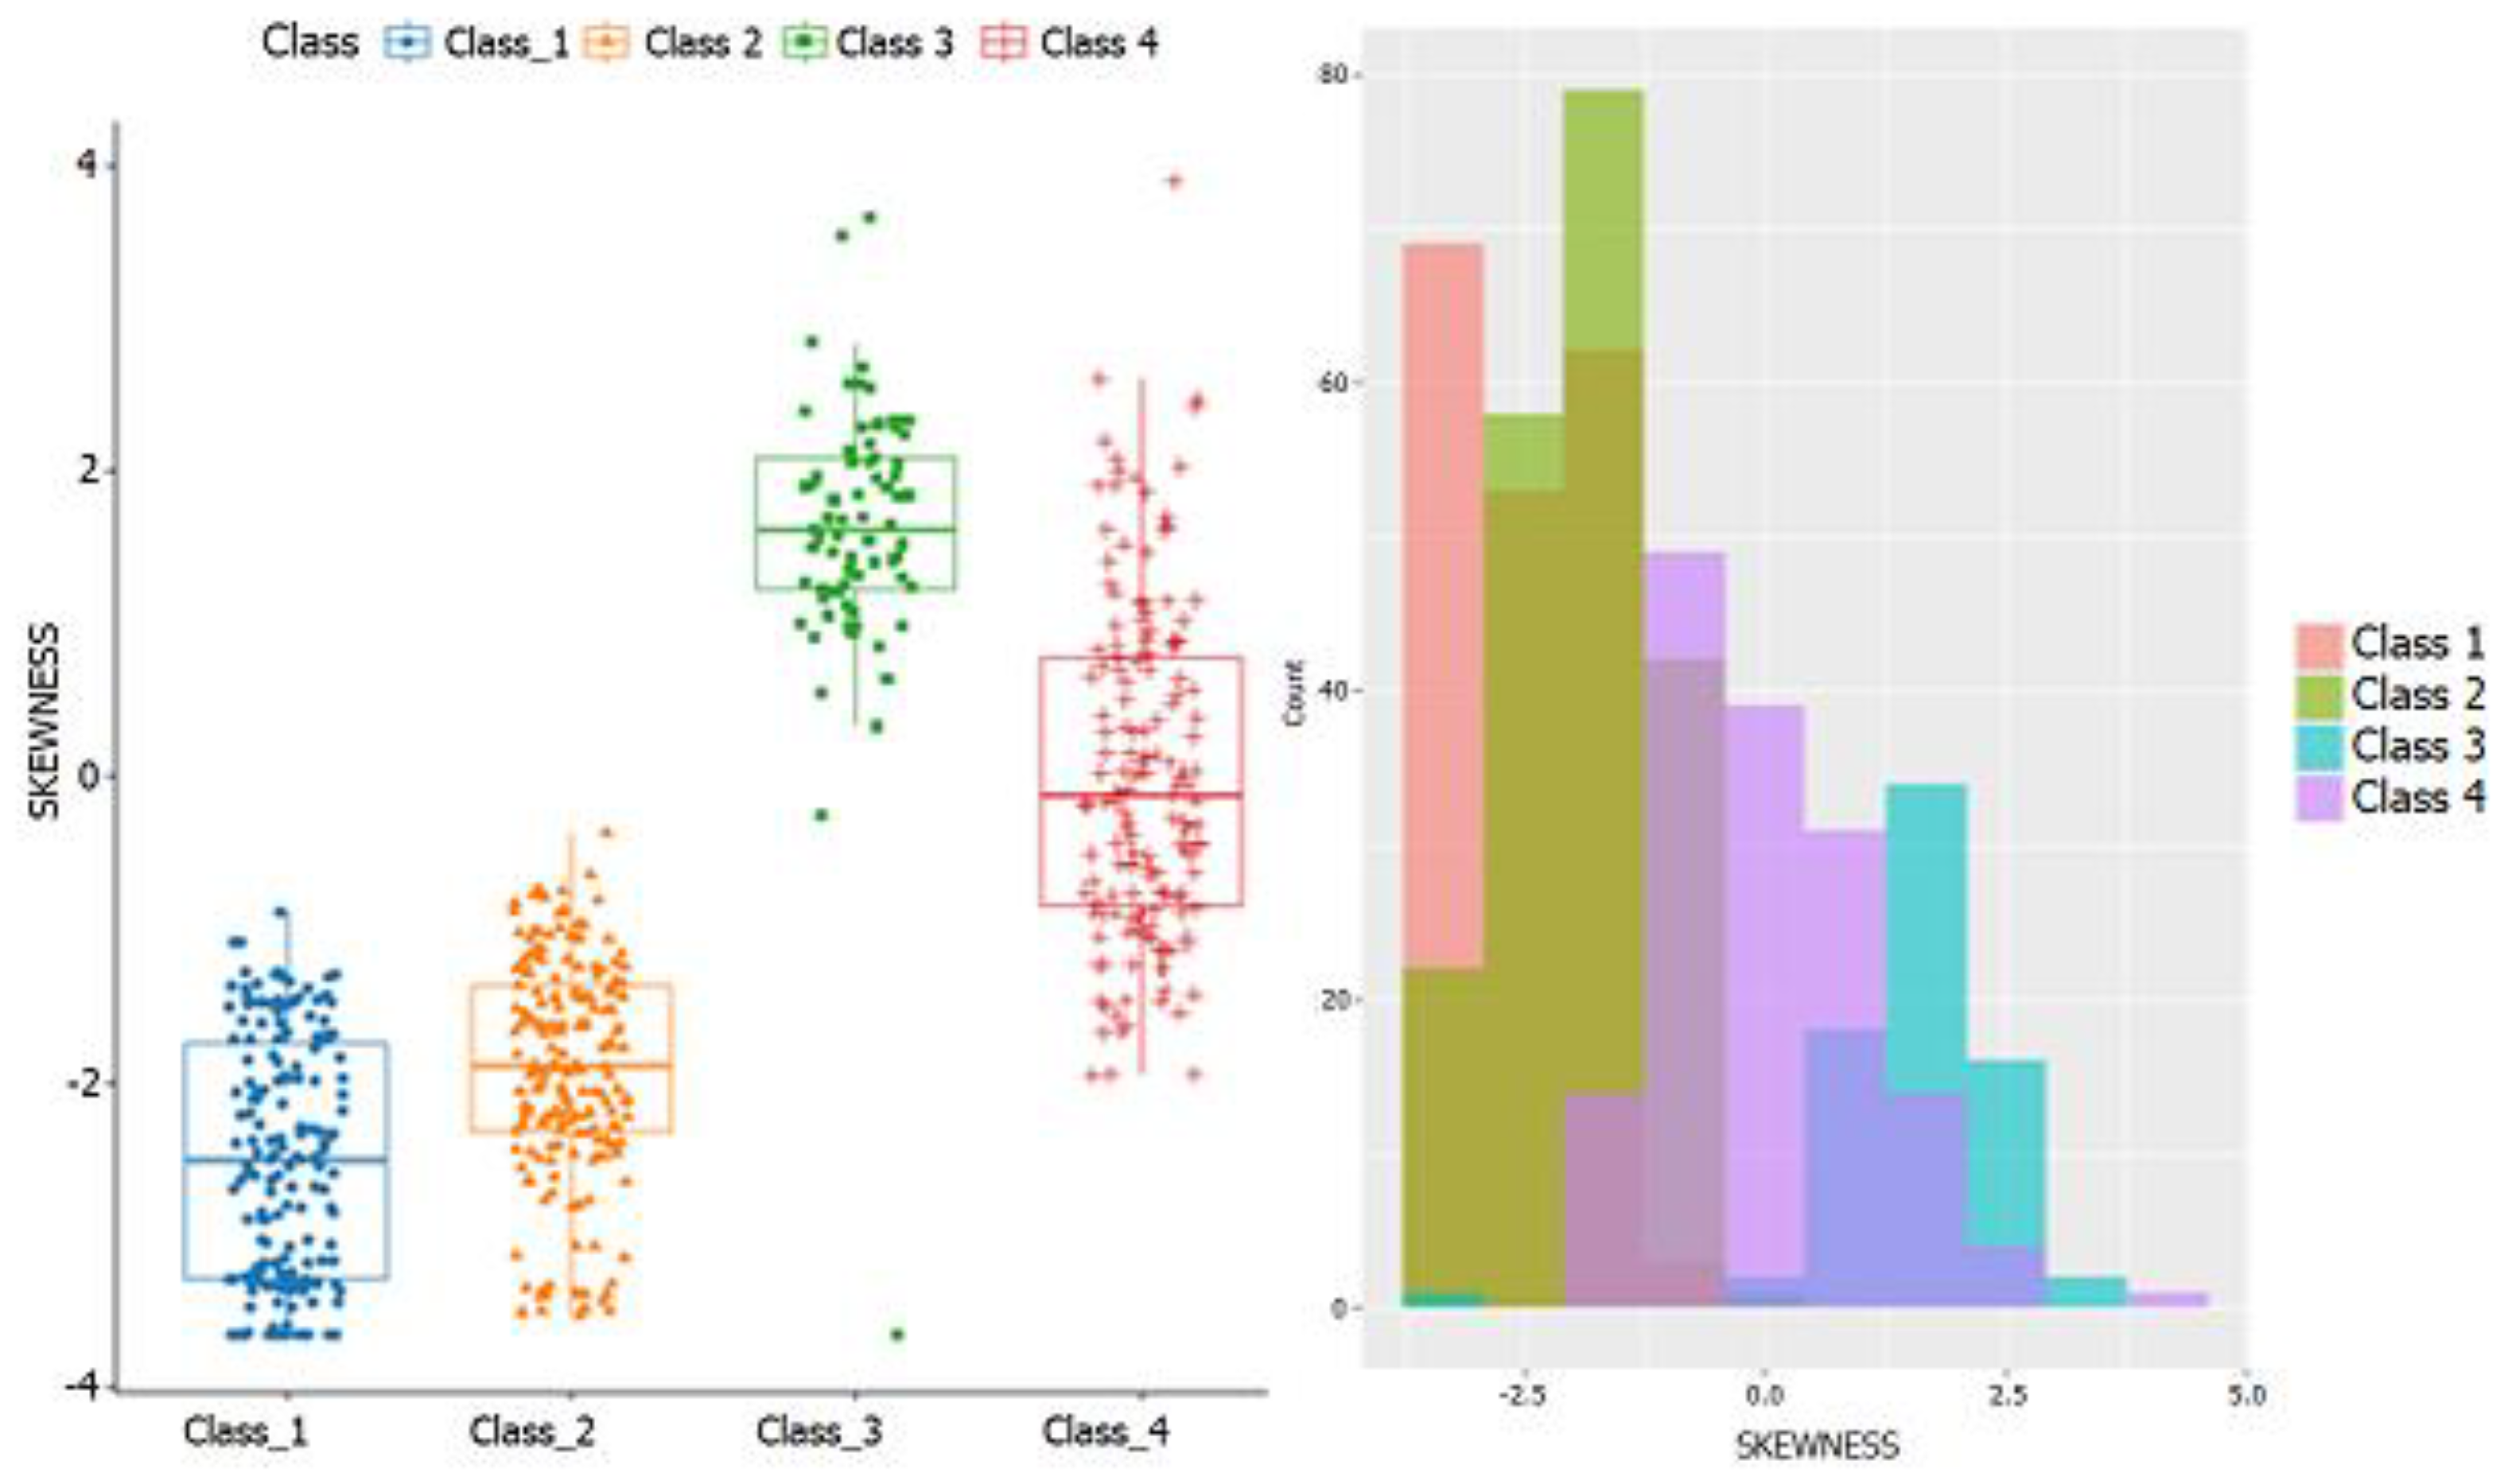
- Skewness for all channels;
- Standard deviation envelope for all channels;
- Variance for all channels;
- Derivative signal for all channels (differentiation).
4. Camera Network System
4.1. Architecture
- Cameras: IP cameras were selected since they are a very extended surveillance solution (almost a standard) and also for the characteristics that they may offer. Specifically, the chosen camera is the HIKVISION Network Cam Model DS-2CD2055FWD. Among all its features, it is important to highlight its capacity of changing resolution and other characteristics such as the wide range of supported protocols (HTTP, RTSP…). It is waterproof, making it compatible with an outdoor system. It has a graphical web interface via HTTP where all the parameters can be set. For this work, a resolution of 640p has been set. The frame rate was set to 12 fps to reduce the network load and the required processing. Regarding the installation position, it is advisable to place them at a minimum height of 3 m and point them slightly downwards to help the computer vision algorithm perform its task.
- Data processing unit: The data processing unit is where all the information is processed. Due to the high computing needs required by computer vision algorithms, an Intel NUC was used. Of course, just one Intel NUC does not have enough computing power to process the video stream of many cameras simultaneously. Because of this, the system is scalable with extra processing units to distribute the load. Currently, each Intel NUC can simultaneously handle the load of five cameras.
- External monitoring unit: Basically, it is a PC connected to the network to receive the output video broadcast by the data processing units. This device must be configured in the same IP domain range and have some generic software (such as a web browser…) that can reproduce HTTP streams.
4.2. Algorithms
4.2.1. Camera Subsystem
- a.
- IP Stream Converter. This node is responsible for establishing a connection with its associated IP camera. The camera sends the frames to this node through the RTSP protocol, converting them to a format suitable for processing by the rest of the nodes. If the connection between the camera and the node is interrupted or cannot be established, the process keeps trying to establish the connection.
- b.
- Image Detection. It receives frames from the IP Stream Converter and processes them to extract the detections. This process with the heaviest load is performed by a pipeline with the algorithm stages shown in Figure 14.
- c.
- Tracker. This process is in charge of processing the events generated by the image detection node and establish a relationship between them. This node has to make decisions based on different characteristics such as the lifetime, size and position of the detections or their speed. When a detection vanishes (e.g., such as the intruder walking behind a column), a Kalman filter is used to estimate the current position of the intruder and maintain a tracking until the Image Detection can locate the intruder again. Another important point is the activation of nearby cameras when an intruder leaves the field of view of an active camera towards that of an inactive camera.
- d.
- Data Synchronizer. This node merges the images and detections, creating an output video stream with the processed information of the detections. This video is sent to the HTTP Video Converter.
4.2.2. System Manager
- a.
- Comms. Communicates with the CEMF sensors. It creates a virtual map that is kept updated with each message. This information is then served to the manager handler.
- b.
- Manager Handler. This is the first node to boot. It reads the configuration file that includes IP addresses and ports of the cameras and processing units and the information about how everything is related. All that data starts the communications node and all the required data processing units and boots the camera subsystems.
- c.
- HTTP Video Converter. This node converts the output video and executes an HTTP server where connections can be made, and the video can be viewed in a standard web browser.
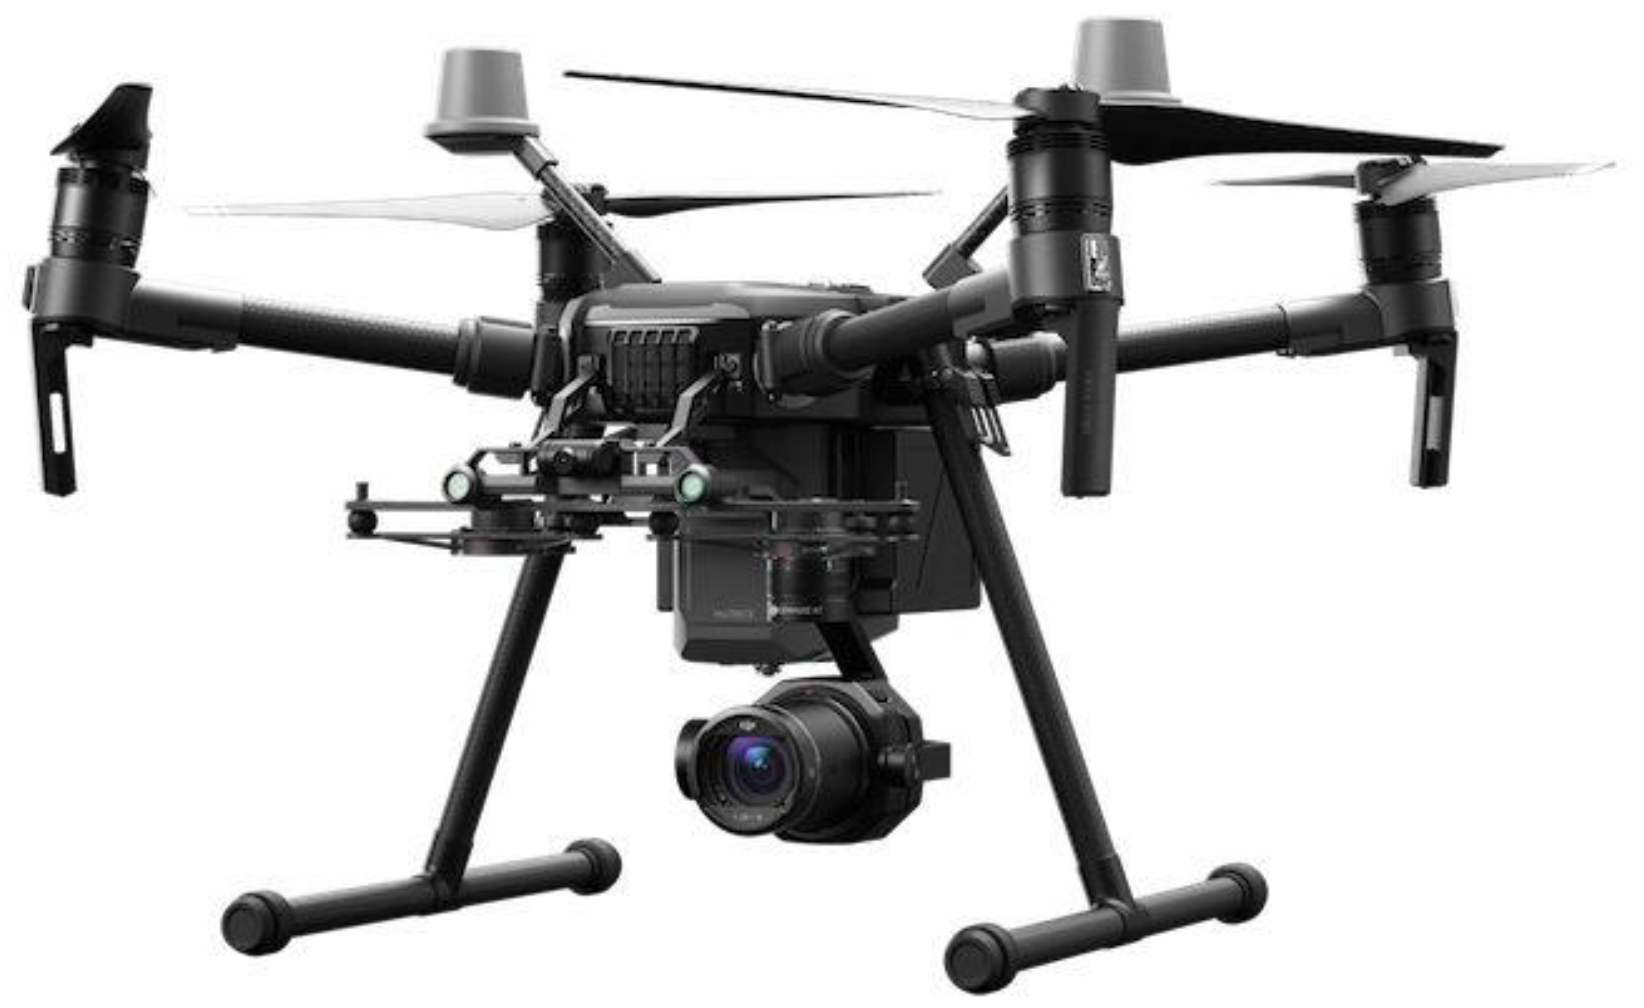
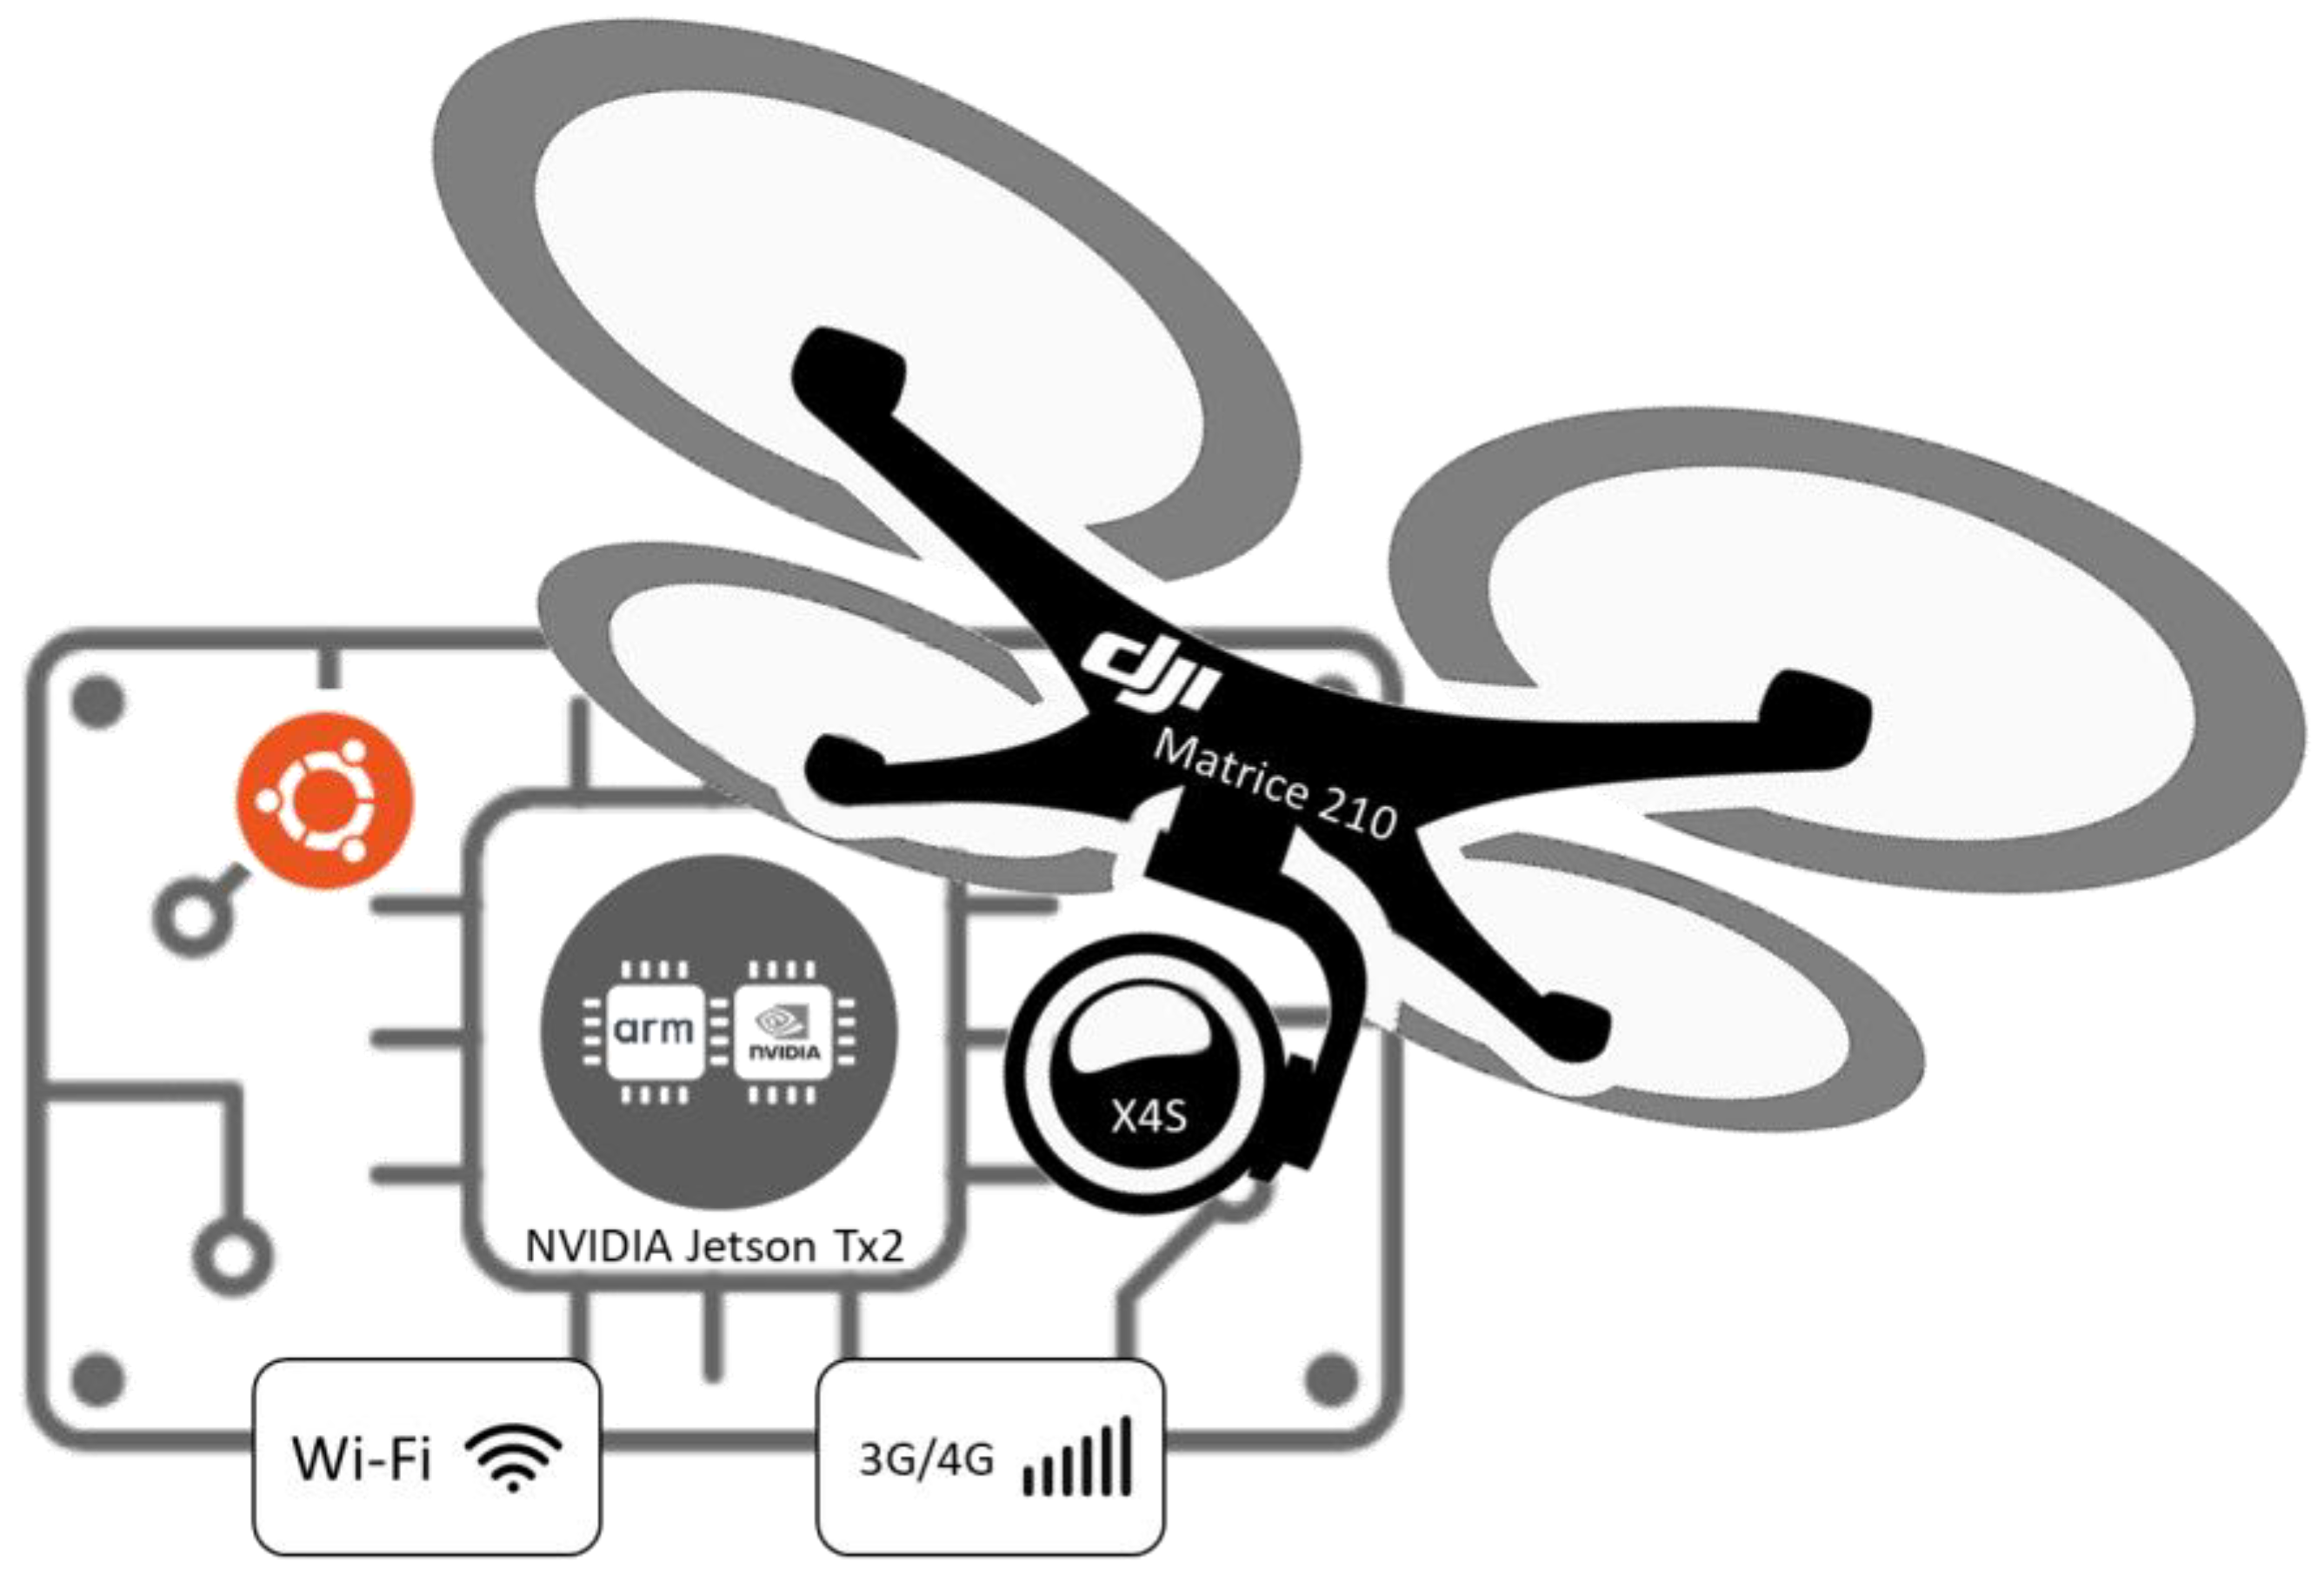
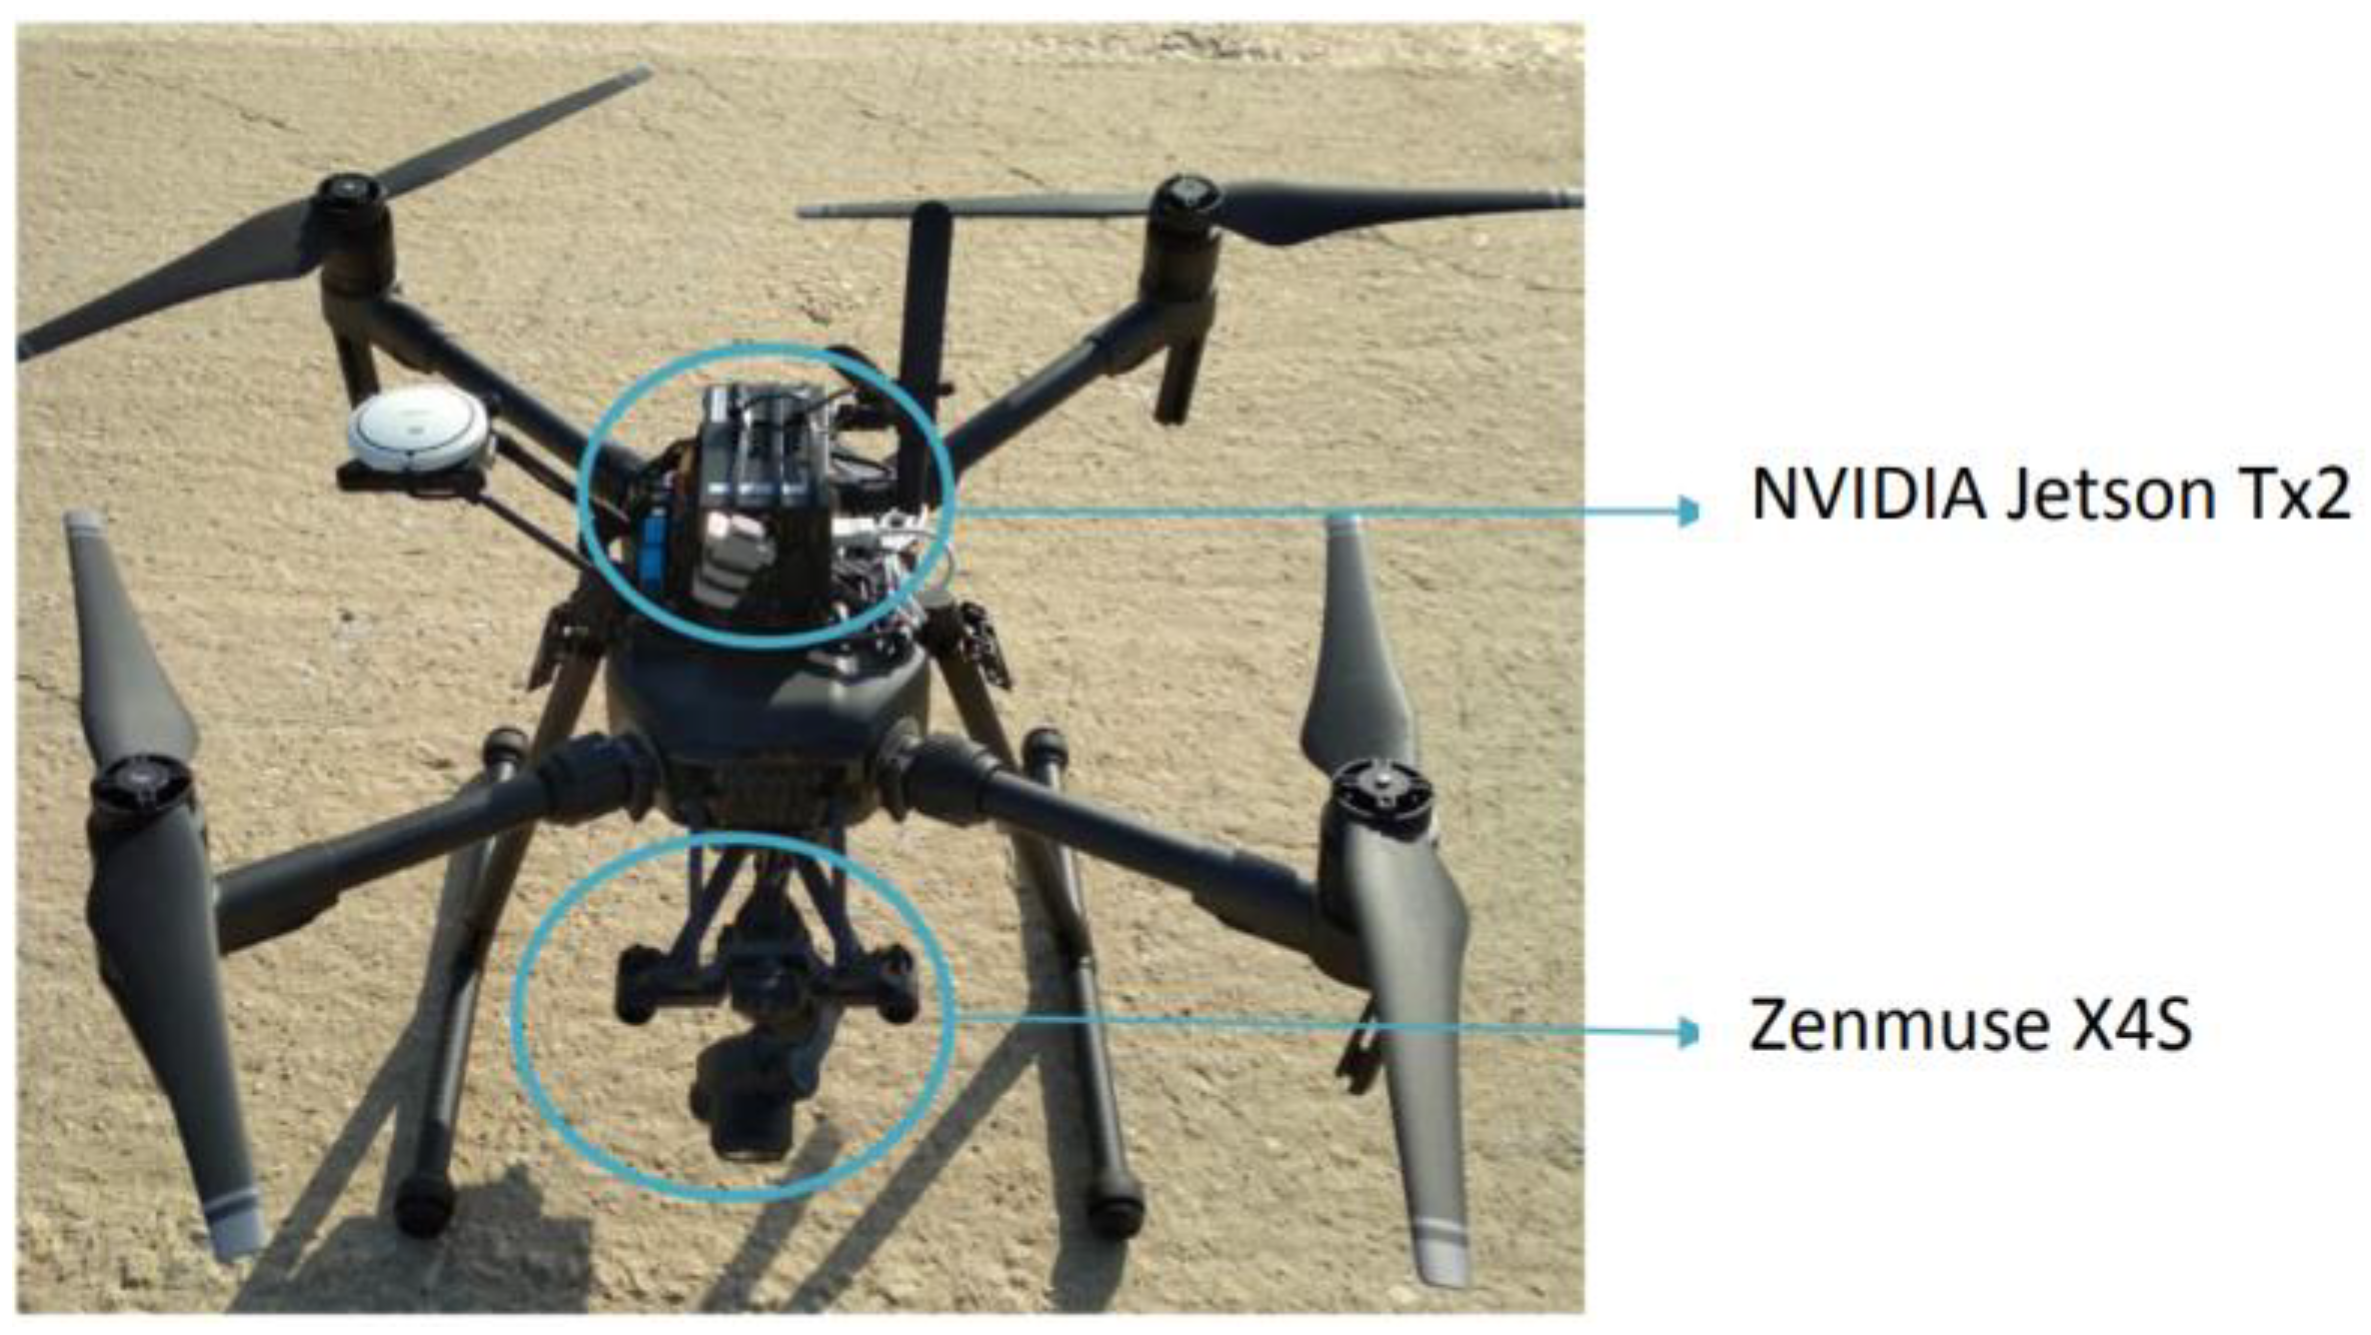
5. Autonomous Drone System
5.1. Architecture
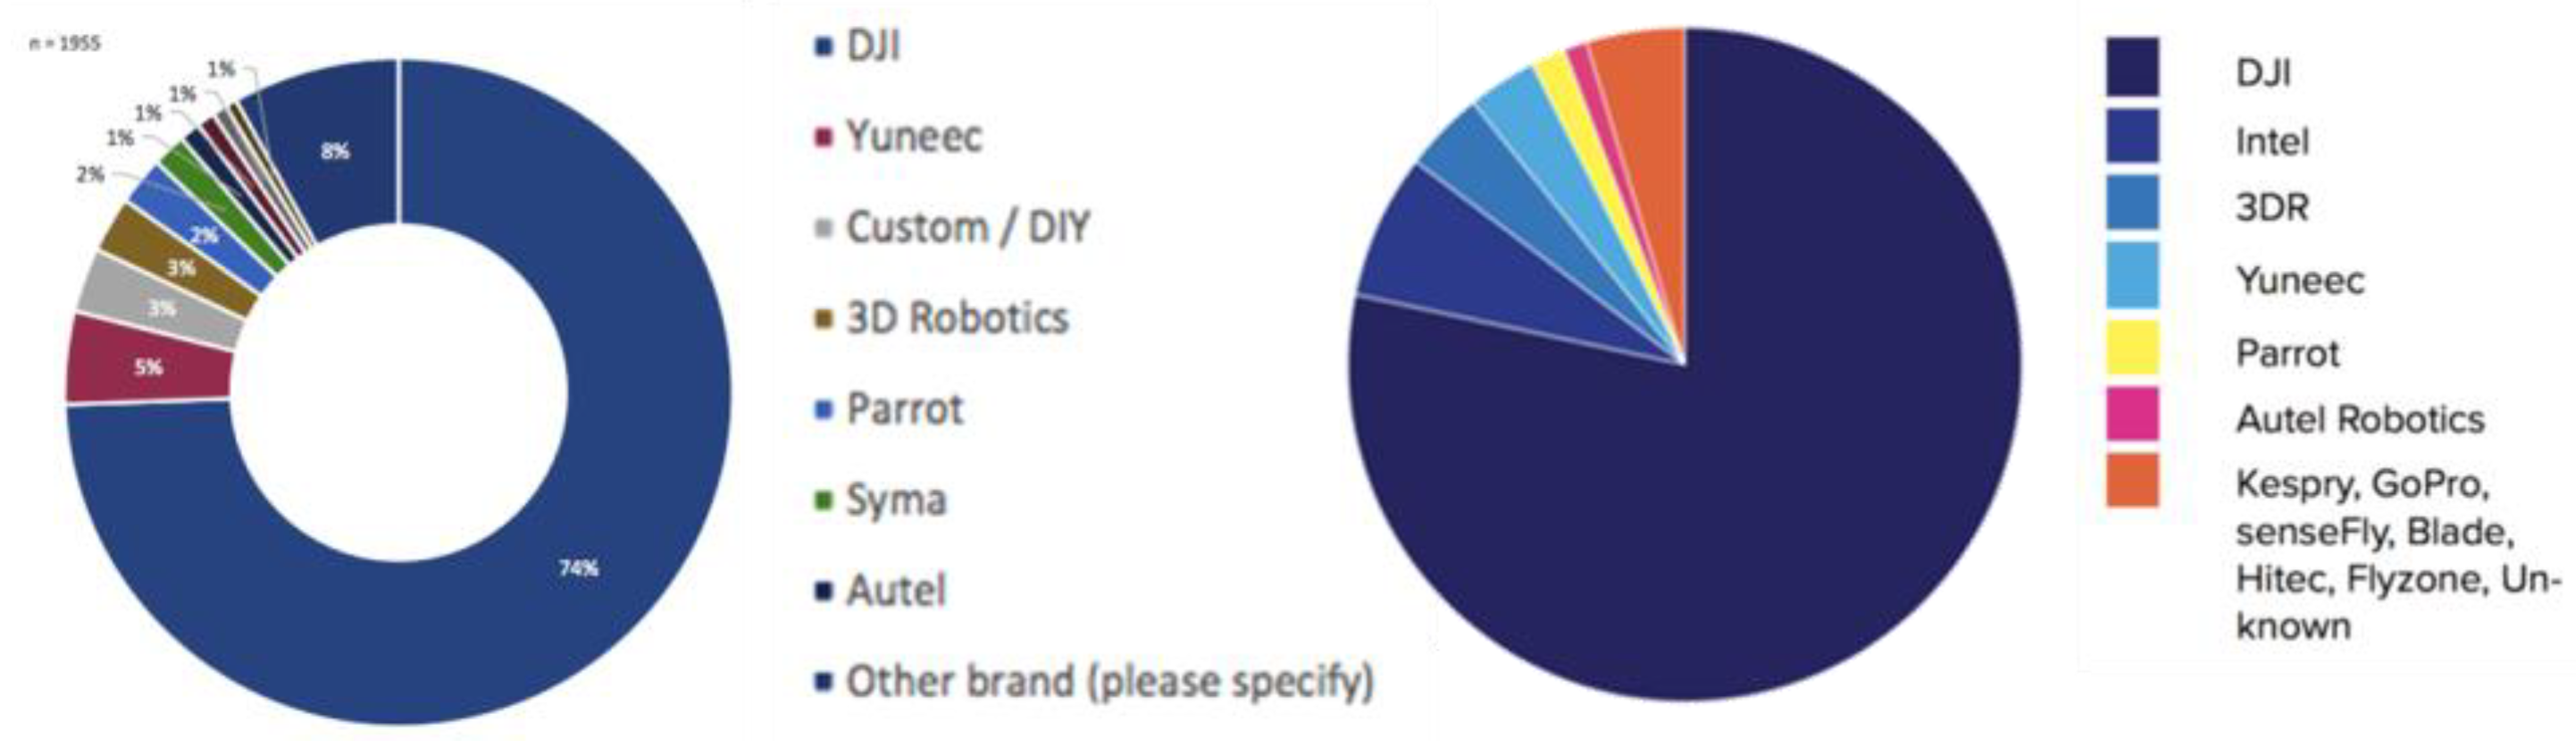
- DJI;
- Parrot;
- Yuneec;
- Others: 3dRobotics, senseFly, Intel…
- -
- Power cable is a standard power cord running from the external power connector provided by the drone to the power supply connector of the computer.
- -
- Video cable is a standard USB cable running from the USB provided by the drone to one of the USB host ports of the computer.
- -
- Control cable is a USB to UART TTL cable used to control the drone through DJI’s SDK, and it runs from the TTL port of the drone to any USB host port of the computer.
5.2. Algorithm
- -
- CUDA—This library provides access to the parallel execution capabilities of the NVIDIA GPU of the onboard computer.
- -
- ROS Kinetic—This library provides an easy framework and executes concurrent processes in a coordinated and synchronous way.
- -
- OpenCV—Library for image processing (works with CUDA).
- -
- DJI SDK—Library to stable communications with the autopilot of the drone.
- -
- DJI SDK. This node works as a communication bridge, deserializing the autopilot messages (flight data, images, drone status), converting them into a format manageable by the rest of the blocks. It also sends the action commands from the onboard system to the autopilot.
- -
- Vision. This block receives all the images and flight data, processes them and detects the intruder. It also reports to the mission manager.
- -
- Mission manager. It implements the high-level state machine previously shown in Figure 19, controlling the operation of the mission at all times and taking the appropriate actions in case a pilot is required to take over and manually control the aircraft.
- -
- Movement control. This node is in charge of the control, calculating the action commands that must be sent to the autopilot depending on the state of the mission in which the system is at a specific moment.
- -
- Communications. It establishes and maintains communications with the ground station. It processes external alarm signals and activates the entire system when required. In parallel, it encodes the images and flight data to send it to the ground to monitor accordingly.
- -
- Preprocessing: It receives the images from the autopilot. These images are way too large to be processed by the onboard computer at the frame rate provided. Therefore, the preprocessing performs downscaling to 416 × 416 pixels and provides one image each 50 ms approximately. It also applies the image correction required, with the parameters obtained with the calibration tool, to make sure all image distortion goes away.
- -
- Detection: Unlike the video from the static camera network, the drone camera remains in constant motion during the intruder detection and tracking process, so the algorithm based on background subtraction cannot be applied. Given the recent developments in object recognition, which are outperforming classic approaches, such as [26,27], the use of a deep neural network that analyzes each video frame has been chosen. Specifically, the YOLO V3-Tiny [28] architecture was implemented and the retraining of the network from the initial weights provided by the author was done. To work with this network, we used Darknet, which is an environment created by the original authors of YOLO. It is implemented in C language and uses the CUDA library, which uses graphics card resources to operate quickly and efficiently.YOLO V3-Tiny is made up of a total of 23 layers, 13 of them being convolutional. As input, it receives an image of size 416 × 416 × 3, which is a color image with three channels. In the output layer, a vector is generated indicating the regions of interest where the people detected are located and the probability associated with each one.
- -
- Tracking: In this stage, images are synchronized with the flight data so that each frame can be associated with its flight height and position. Once the intruder has been detected and the image pixels where it is located are known, a tracking stage is performed so that the drone continuously keeps the intruder in the center of the acquired image. A proportional controller is used, which continuously calculates the distance in pixels between the intruder and image center. The output of that controller is converted into speed commands for the drone, which is moved accordingly. A hysteresis cycle was implemented to avoid continuous drone movements when the intruder is very close to the center of the image.
6. Experimental Results
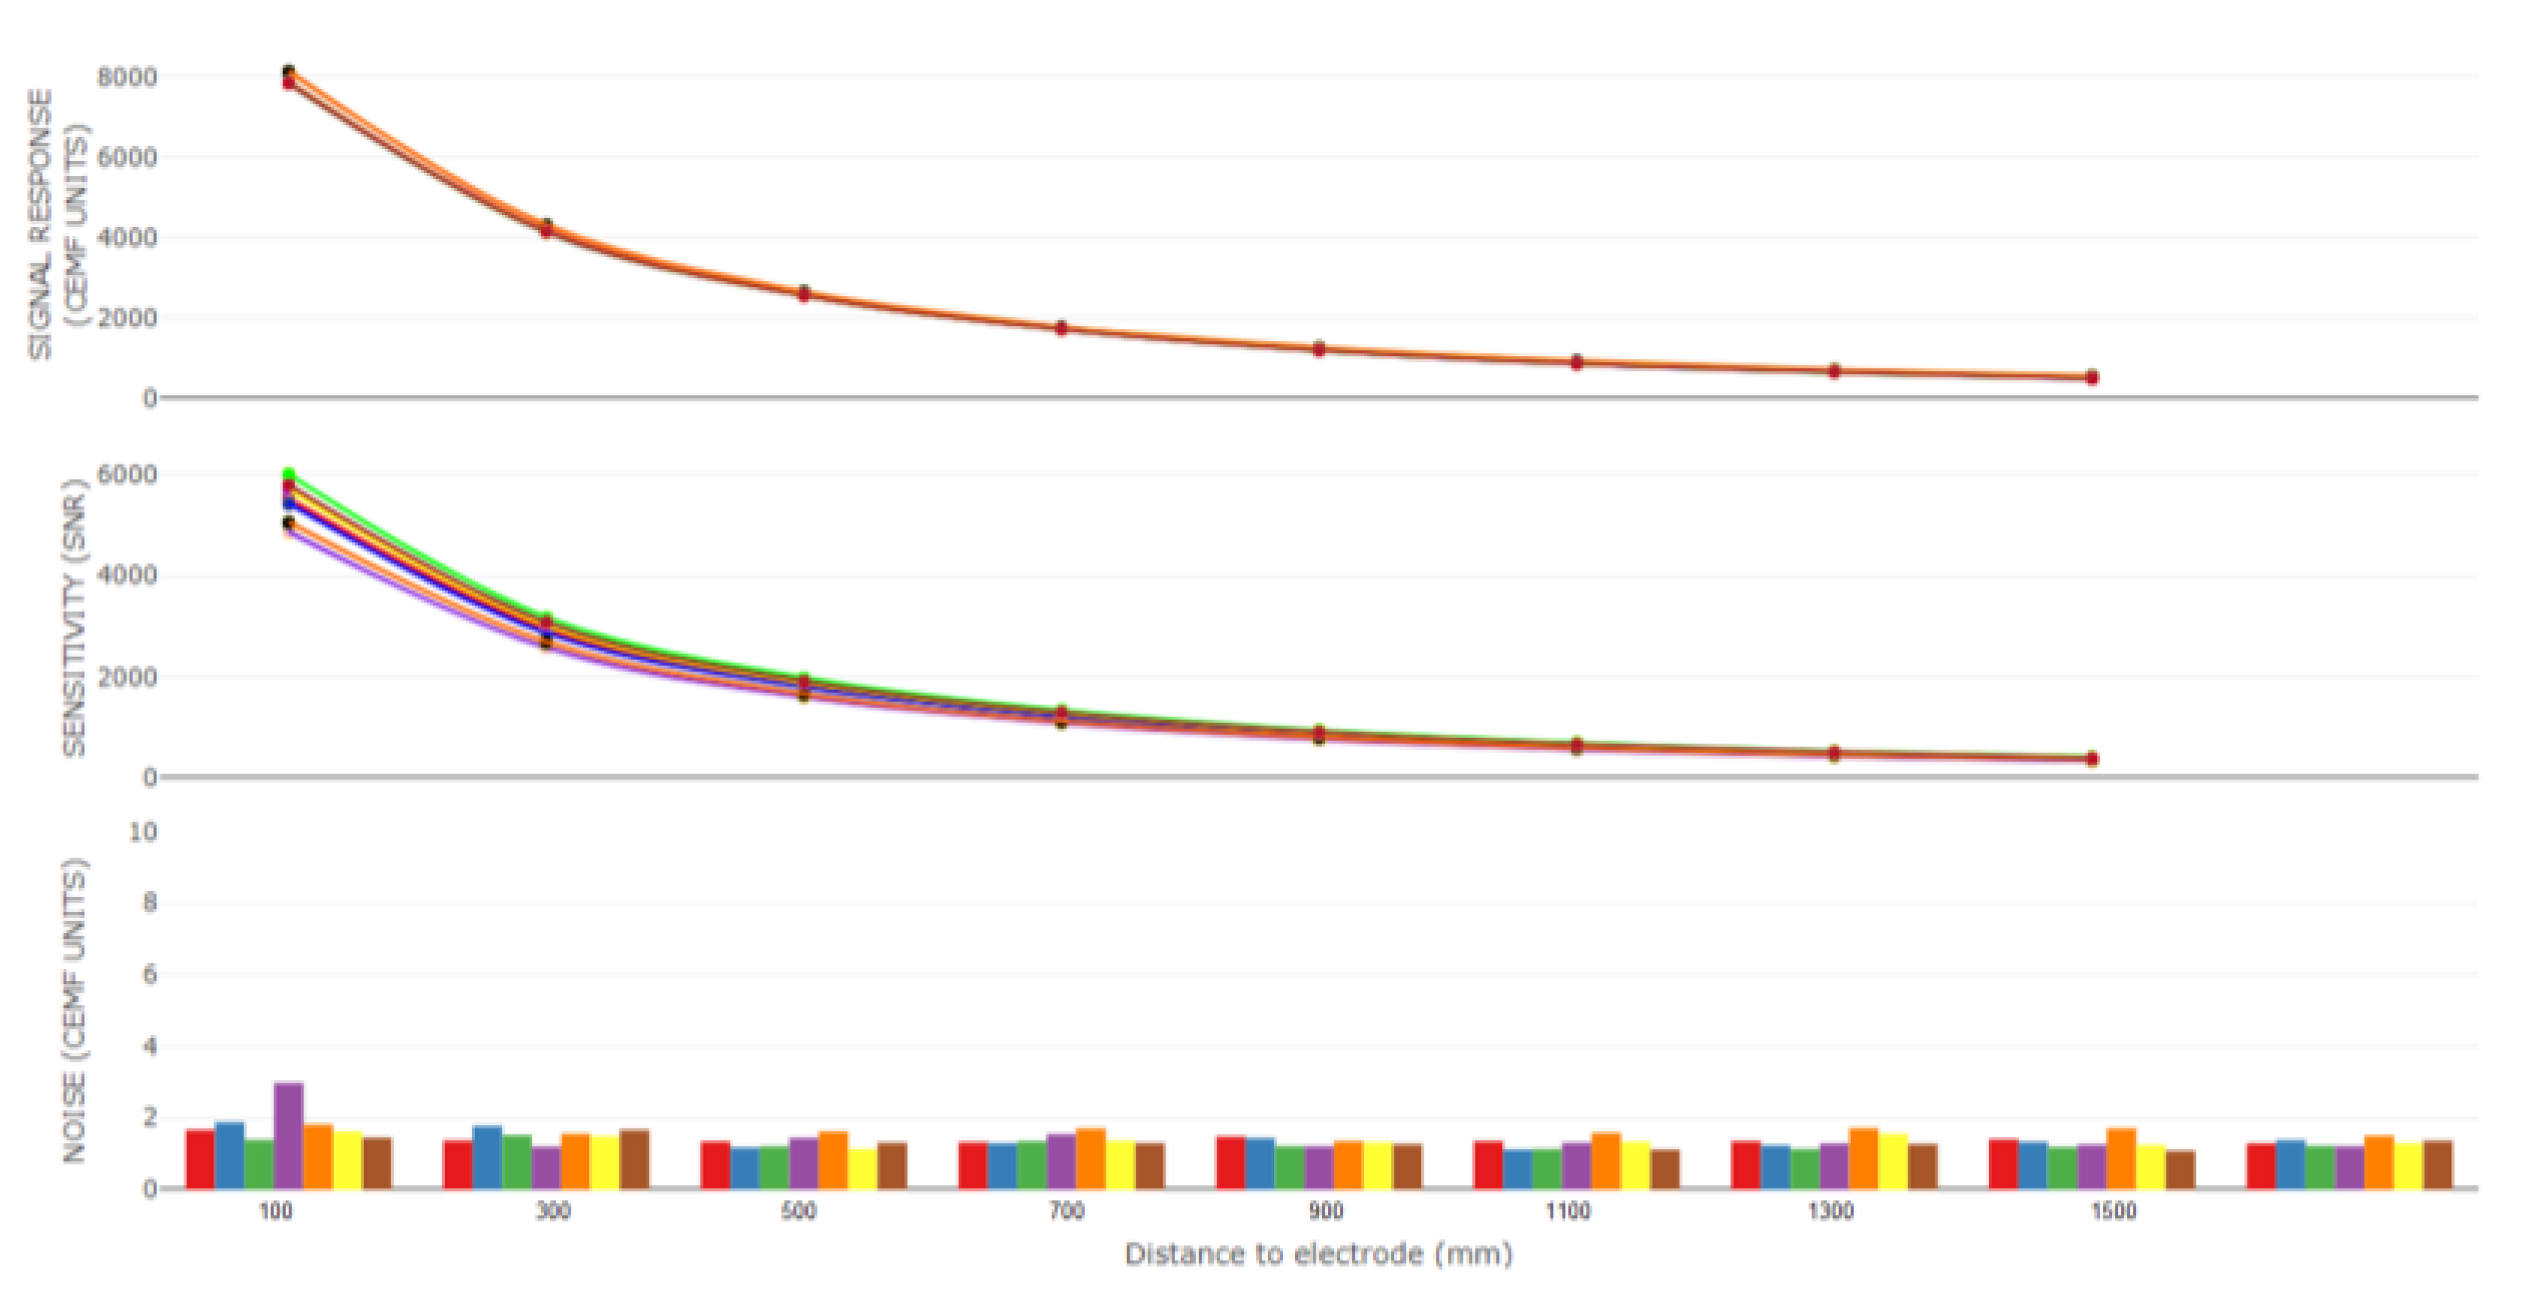
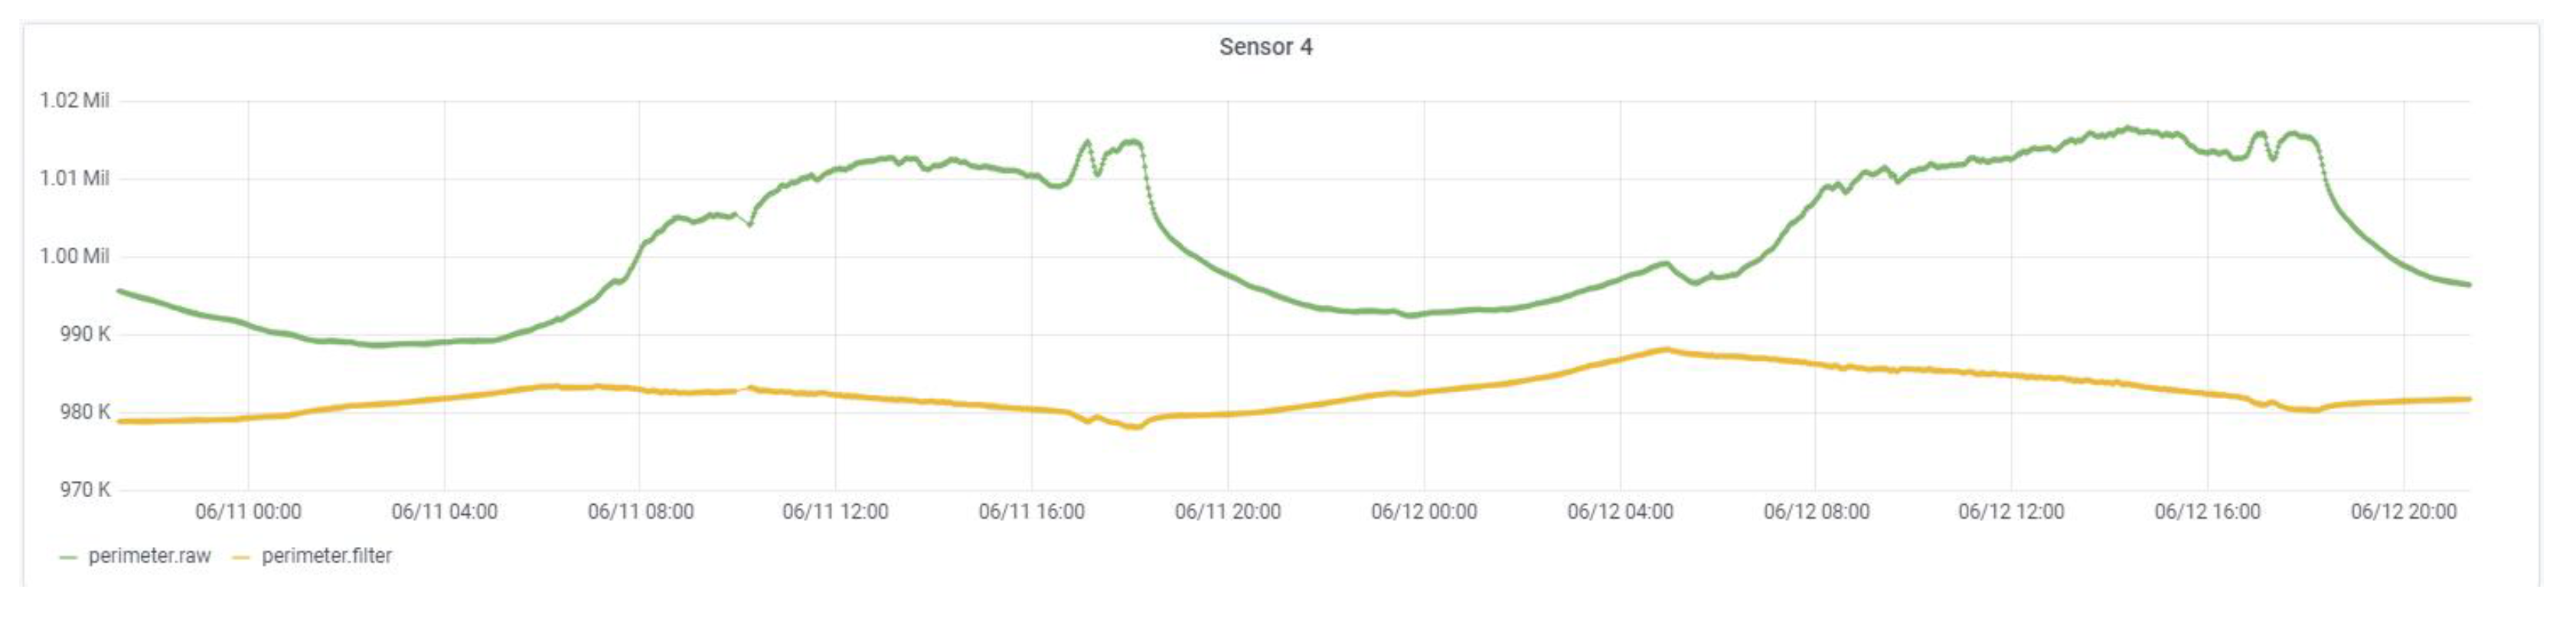
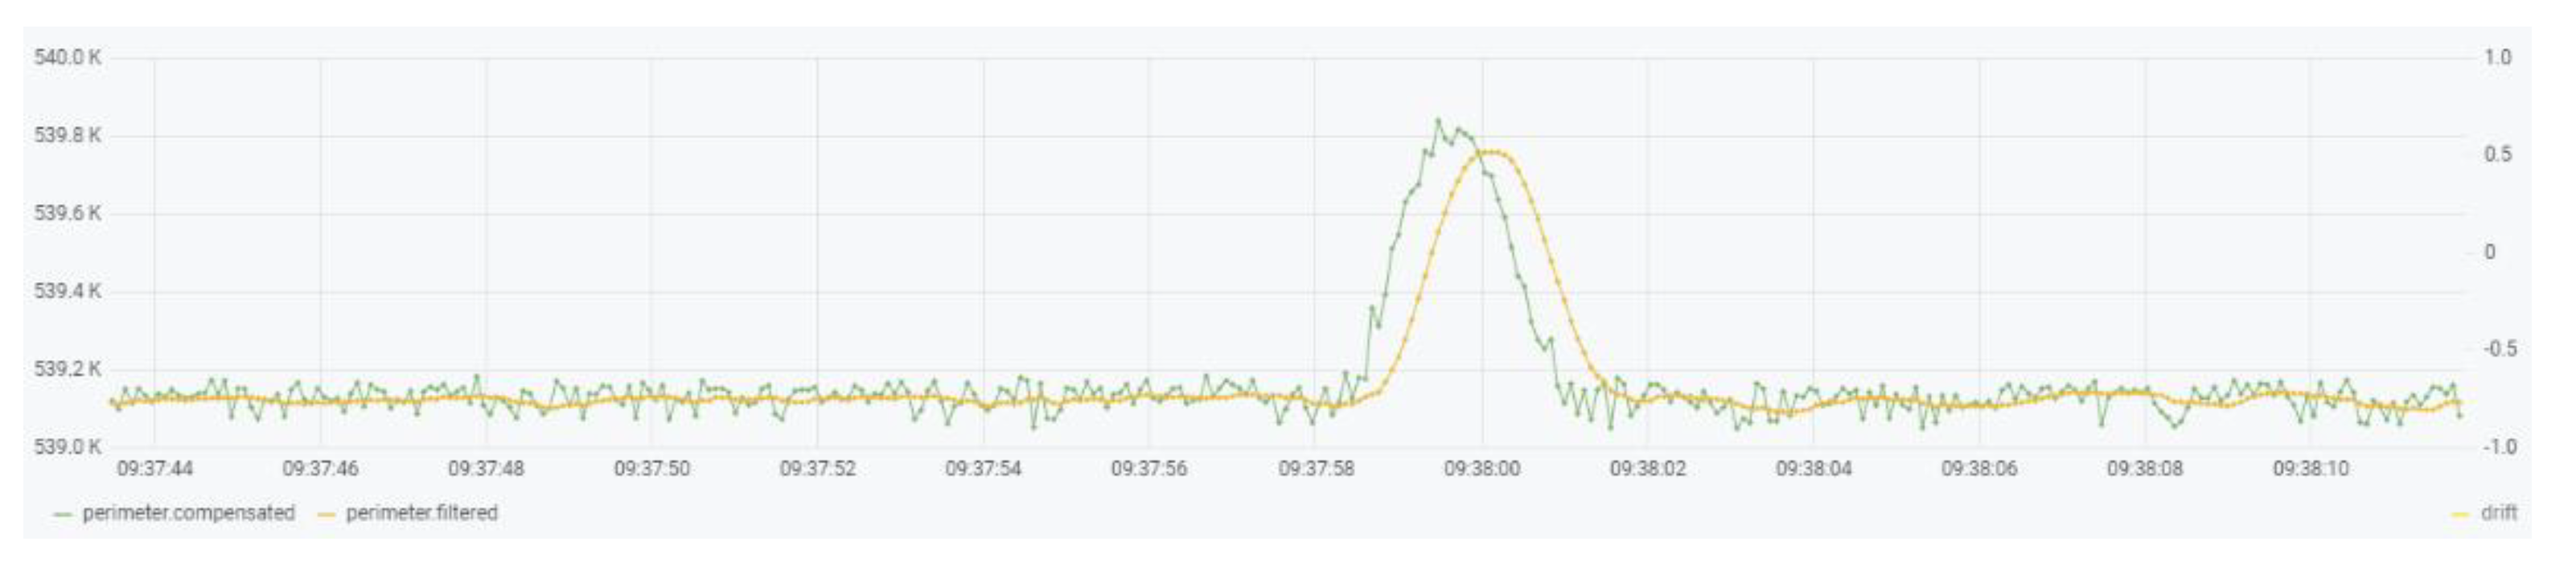
6.1. CEMF Results
- -
- Day 1—This was a windy day that caused the signal of these devices to be altered by external agents such as vegetation in the area. None of these phenomena should be detected by either of the two units. The system should only issue an alarm message if a person is in the perimeter. Therefore, this day will be used to see the robustness of the system against external agents.
- -
- Day 2—During this day a rain shower fell on the site. The CEMF signal is sensitive to rain, so it is crucial to observe the response of each unit under rain conditions. As with the agents mentioned above, rain is also an external agent that should not trigger any alarm.
- -
- Day 3—This was a test day where several persons were asked to perform prowling and intrusion events on each of these two units. This day will be used to validate the success rate of each system against real events.
- True positives (TP): the number of ranges of the ground truth in which a certain event was required and it was effectively detected.
- True negatives (TN): the number of ranges of the ground truth in which a certain event was restricted and it coincided that it was not detected.
- False positives (FP): the number of ranges of the ground truth in which a certain event was restricted and, instead, it was detected.
- False negatives (FN): the number of ranges of the ground truth in which a certain event was required and, instead, it was not detected.
- Sensitivity (Sen): was the proportion of ground truth event ranges that were correctly classified as detected from among all those that were required.
- Specificity (Spec): is the proportion of ground truth event ranges that were correctly classified as undetected from among all those that were restricted.
- Accuracy (Acc): is the proportion of total hits, without distinguishing between true positives and true negatives.
6.2. Vision Results
7. Conclusions
Author Contributions
Funding
Institutional Review Board Statement
Informed Consent Statement
Data Availability Statement
Conflicts of Interest
References
- Oxford Economics. Capital Project and Infrastructure Spending, Outlook to 2025; PricewaterhouseCoopers: London, UK, 2014; Available online: https://www.pwc.com/gx/en/capital-projects-infrastructure/publications/cpi-outlook/assets/cpi-outlook-to-2025.pdf (accessed on 20 October 2021).
- Commission of the European Communities. Communication from the Commission on a European Programme for Critical Infrastructure Protection; European Comission: Brussels, Belgium, 2006; Available online: https://eur-lex.europa.eu/LexUriServ/LexUriServ.do?uri=COM:2006:0786:FIN:EN:PDF (accessed on 20 October 2021).
- Elvik, R.; Vaa, T. The Handbook of Road Safety Measures, 1st ed.; Elsevier Science: Amsterdam, The Netherlands, 2004. [Google Scholar]
- Catalano, A.; Antonio Bruno, F.; Galliano, C.; Pisco, M.; Vito Persiano, G.; Cutolo, A.; Cusano, A. An optical fiber intrusion detection system for railway security. Sens. Actuators A 2017, 253, 91–100. [Google Scholar] [CrossRef]
- Nan, Q.; Li, S.; Yao, Y.; Li, Z.; Wang, H.; Wang, L.; Sun, L. A Novel monitoring approach for train tracking and incursion detection in underground structures based on ultra-weak FBG sensing array. Sensors 2019, 19, 2666. [Google Scholar] [CrossRef] [PubMed] [Green Version]
- Allwood, G.; Wild, G.; Hinckley, S. Optical fiber sensors in physical intrusion detection systems: A Review. IEEE Sens. J. 2016, 16, 5497–5509. [Google Scholar] [CrossRef] [Green Version]
- Inomata, K.; Tsujita, W.; Hirai, T.; Hirai, T. Two-frequency surveillance technique for intrusion-detection sensor with Leaky Coaxial Cables. In Proceedings of the 2014 IEEE Sensors Applications Symposium (SAS), Queenstown, New Zealand, 18–20 February 2014; pp. 103–106. [Google Scholar]
- Bhavani, M.S.S.; Babulu, K. Design and implementation of low cost microwave motion sensor based security system. Int. J. Eng. Res. Technol. (IJERT) 2013, 2, 1696–1700. [Google Scholar]
- Zimmerman, T.G.; Smith, J.R.; Paradiso, J.A.; Allport, D.; Gershenfeld, N. Applying Electric Field Sensing to Human-Computer Interfaces. In Proceedings of the CHI’95, Denver, CO, USA, 7–11 May 1995; ACM Press: New York, NY, USA, 1995. [Google Scholar]
- Smith, J.; White, T.; Dodge, C.; Paradiso, J.; Gershenfeld, N.; Allport, D. Electric field sensing for graphical interfaces. IEEE Eng. Med. Boil. Mag. 1998, 18, 54–60. [Google Scholar] [CrossRef]
- Ye, Y.; Deng, J.; Shen, S.; Hou, Z.; Liu, Y. A Novel method for proximity detection of moving targets using a large-scale planar capacitive sensor system. Sensors 2016, 16, 699. [Google Scholar] [CrossRef] [Green Version]
- George, B.; Zangl, H.; Bretterklieber, T.; Brasseur, G. Seat occupancy detection based on capacitive sensing. IEEE Trans. Instrum. Meas. 2009, 58, 1487–1494. [Google Scholar] [CrossRef]
- Satz, A.; Hammerschmidt, D.; Tumpold, D. Capacitive passenger detection utilizing dielectric dispersion in human tissues. Sens. Actuators A Phys. 2009, 152, 1–4. [Google Scholar] [CrossRef]
- Ye, Y.; He, C.; Liao, B.; Qian, G. Capacitive Proximity sensor array with a simple high sensitivity capacitance measuring circuit for human–Computer Interaction. IEEE Sens. J. 2018, 18, 5906–5914. [Google Scholar] [CrossRef]
- Kan, W.; Huang, Y.; Zeng, X.; Guo, X.; Liu, P. A dual-mode proximity sensor with combination of inductive and capacitive sensing units. Sens. Rev. 2018, 38, 199–206. [Google Scholar] [CrossRef]
- Zitouni, A.; Beheim, L.; Huez, R.; Belloir, F. Smart electromagnetic sensor for buried conductive targets identification. IEEE Sens. J. 2006, 6, 1580–1591. [Google Scholar] [CrossRef]
- Frejlichowski, D.; Gosciewska, K.; Forczmanski, P.; Hofman, R. Smart monitor—An intelligent security system for the protection of individuals and small properties with the possibility of home automation. Sensors 2014, 14, 9922–9948. [Google Scholar] [CrossRef] [PubMed] [Green Version]
- Kim, S.H.; Lim, S.C.; Kim, D.Y. Intelligent intrusion detection system featuring a virtual fence, active intruder detection, classification, tracking, and action recognition. Ann. Nucl. Energy 2018, 112, 845–855. [Google Scholar] [CrossRef]
- Jeon, E.S.; Choi, J.-S.; Lee, J.H.; Shin, K.Y.; Kim, Y.G.; Le, T.T.; Park, K.R. Human Detection Based on the Generation of a Background Image by Using a Far-Infrared Light Camera. Sensors 2015, 15, 6763–6788. [Google Scholar] [CrossRef] [Green Version]
- Castro, J.; Delgado, M.; Medina, J.; Lozano, M.D.R. Intelligent surveillance system with integration of heterogeneous information for intrusion detection. Expert Syst. Appl. 2011, 38, 11182–11192. [Google Scholar] [CrossRef]
- Zivkovic, Z.; Van Der Heihden, F. Efficient adaptive density estimation per image pixel for the task of background subtraction. Pattern Recognit. Lett. 2006, 27, 773–780. [Google Scholar] [CrossRef]
- Zivkovic, Z. Improved adaptive Gaussian mixture model for background subtraction. In Proceedings of the 17th International Conference on Pattern Recognition (ICPR), Cambridge, UK, 26 August 2004. [Google Scholar]
- Suzuki, S.; Abe, K. Topological structural analysis of digitized binary images by border following. Comput. Vis. Graph. Image Process. 1985, 30, 32–46. [Google Scholar] [CrossRef]
- Skylogic Research. Drone Market Sector Report; Skylogic Research: San Francisco, CA, USA, 2018. [Google Scholar]
- Gettinger, D.; Holland Michel, A. Drone Registrations; Center for the Study of the Drone at Bard College: Annandale-On-Hudson, NY, USA, 2017. [Google Scholar]
- Viola, P.; Jones, M. Rapid object detection using a boosted cascade of simple features. In Proceedings of the IEEE Computer Society Conference on Computer Vision and Pattern Recognition, CVPR 2001, Kauai, HI, USA, 8–14 December 2001. [Google Scholar]
- Dalal, N.; Triggs, B. Histograms of oriented gradients for human detection. In Proceedings of the IEEE Computer Society Conference on Computer Vision and Pattern Recognition (CVPR’05), San Diego, CA, USA, 20–25 June 2005; pp. 886–893. [Google Scholar]
- Redmon, J.; Divvala, S.; Girshick, R.; Farhadi, A. You only look once: Unified, real-time object detection. In Proceedings of the IEEE Conference on Computer Vision and Pattern Recognition (CVPR), Las Vegas, NV, USA, 27–30 June 2016. [Google Scholar]
- Barekatain, M.; Martí, M.; Shih, H.F.; Murray, S.; Nakayama, K.; Matsuo, Y.; Prendinger, H. Okutama-action: An aerial view video dataset for concurrent human action detection. In Proceedings of the IEEE Conference on Computer Vision and Pattern Recognition Workshops (CVPRW), Honolulu, HI, USA, 21–26 July 2017. [Google Scholar]


| Idle Class 1 | Prowling Class 2 | Intrusion Class 3 | Car Class 4 | % Accuracy | |
|---|---|---|---|---|---|
| Idle | 93 | 1 | 0 | 0 | 98.9 |
| Prowling | 9 | 114 | 0 | 0 | 92.7 |
| Intrusion | 0 | 0 | 108 | 0 | 100 |
| Car | 0 | 0 | 0 | 106 | 100 |
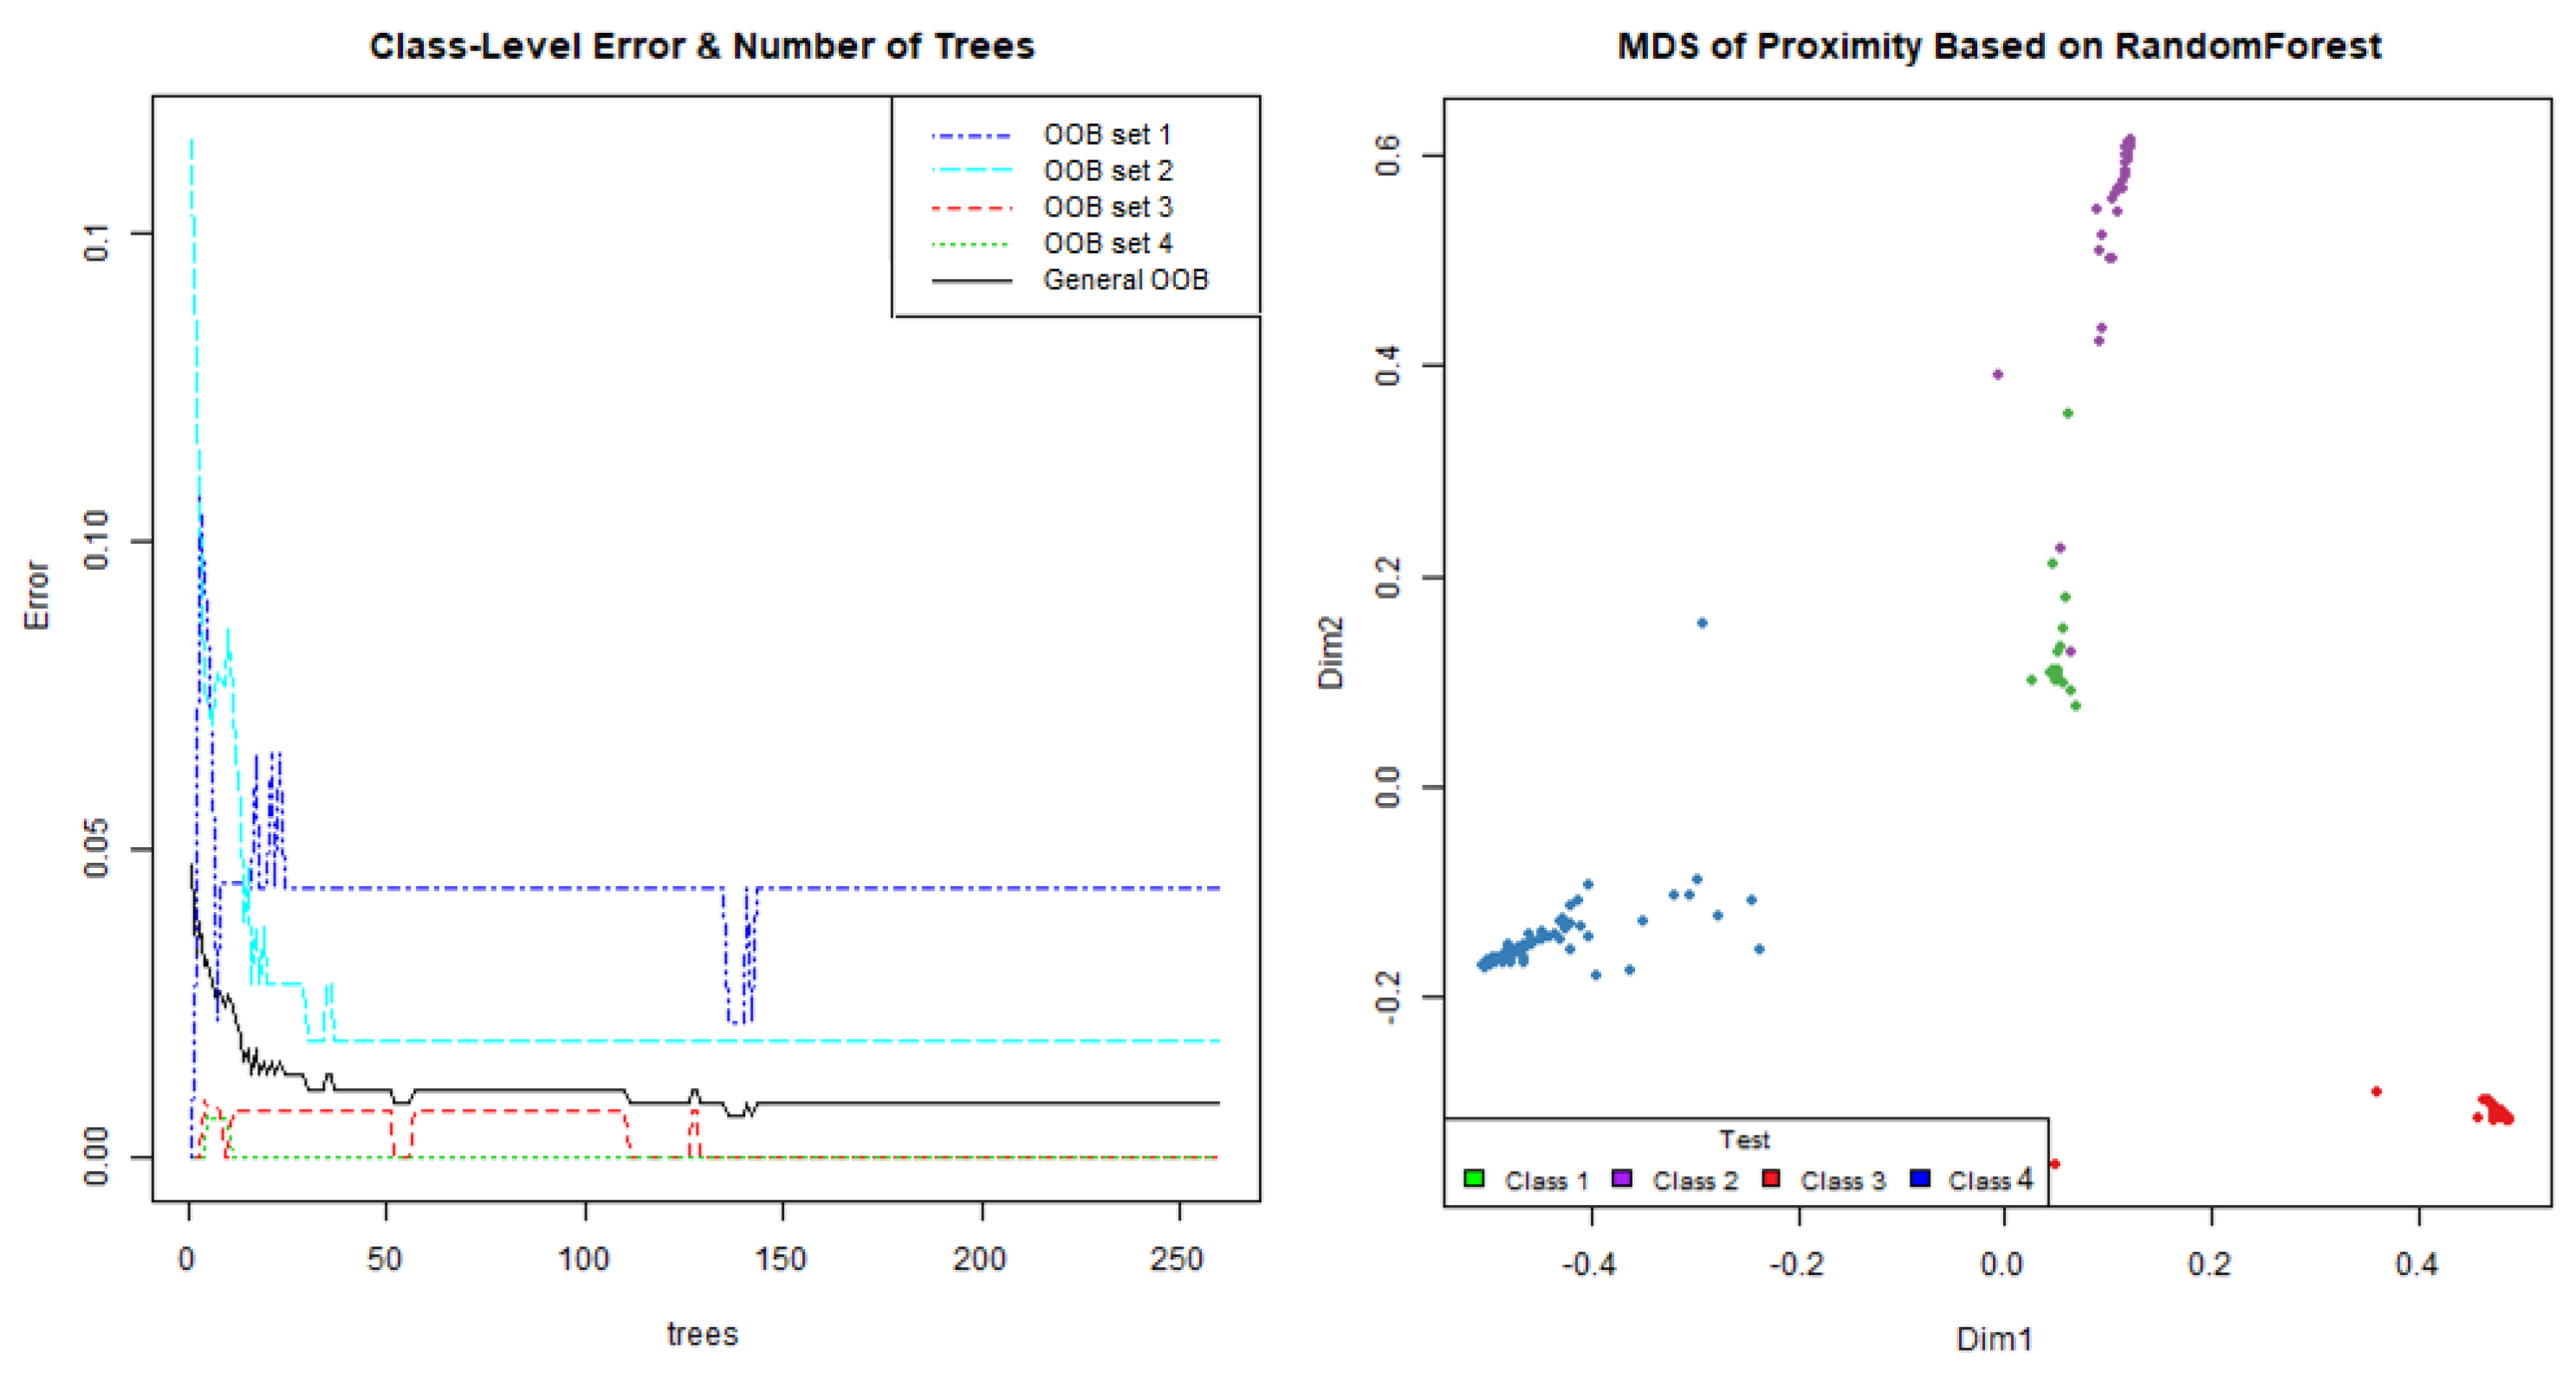
| Day 1 | Day 2 | Day 3 | ||
|---|---|---|---|---|
| − | True negative | 19 | 26 | 20 |
| Prowling | True positive | 5 | 2 | 29 |
| False negative | 0 | 0 | 0 | |
| False positive | 1 | 2 | 0 | |
| Intrusion | True positive | 0 | 0 | 14 |
| False negative | 0 | 0 | 0 | |
| False positive | 0 | 0 | 0 | |
| Car | True positive | 3 | 4 | 5 |
| False negative | 0 | 1 | 0 | |
| False positive | 0 | 0 | 0 | |
| Total | True negative | 65 | ||
| True positive | 62 | |||
| False negative | 1 | |||
| False Positive | 3 | |||
| Sensitivity | 98% | |||
| Specificity | 96% | |||
| Accuracy | 97% | |||
Publisher’s Note: MDPI stays neutral with regard to jurisdictional claims in published maps and institutional affiliations. |
© 2021 by the authors. Licensee MDPI, Basel, Switzerland. This article is an open access article distributed under the terms and conditions of the Creative Commons Attribution (CC BY) license (https://creativecommons.org/licenses/by/4.0/).
Share and Cite
Teixidó, P.; Gómez-Galán, J.A.; Caballero, R.; Pérez-Grau, F.J.; Hinojo-Montero, J.M.; Muñoz-Chavero, F.; Aponte, J. Secured Perimeter with Electromagnetic Detection and Tracking with Drone Embedded and Static Cameras. Sensors 2021, 21, 7379. https://doi.org/10.3390/s21217379
Teixidó P, Gómez-Galán JA, Caballero R, Pérez-Grau FJ, Hinojo-Montero JM, Muñoz-Chavero F, Aponte J. Secured Perimeter with Electromagnetic Detection and Tracking with Drone Embedded and Static Cameras. Sensors. 2021; 21(21):7379. https://doi.org/10.3390/s21217379
Chicago/Turabian StyleTeixidó, Pedro, Juan Antonio Gómez-Galán, Rafael Caballero, Francisco J. Pérez-Grau, José M. Hinojo-Montero, Fernando Muñoz-Chavero, and Juan Aponte. 2021. "Secured Perimeter with Electromagnetic Detection and Tracking with Drone Embedded and Static Cameras" Sensors 21, no. 21: 7379. https://doi.org/10.3390/s21217379