A Near-infrared Turn-on Fluorescent Sensor for Sensitive and Specific Detection of Albumin from Urine Samples

1
Department of Bioscience and Biotechnology, Bio/Molecular Informatics Center, Konkuk University, Hwayang-dong, Gwangjin-gu, Seoul 143-701, Korea
2
Department of Emergency Medicine, Kyung Hee University Hospital at Gangdong, Seoul 134-727, Korea
*
Authors to whom correspondence should be addressed.
†
These two authors contributed equally on this work.
Sensors 2020, 20(4), 1232; https://doi.org/10.3390/s20041232
Submission received: 26 January 2020
/
Revised: 22 February 2020
/
Accepted: 23 February 2020
/
Published: 24 February 2020
(This article belongs to the Section Biomedical Sensors)
Abstract
:A readily synthesizable fluorescent probe DMAT-π-CAP was evaluated for sensitive and selective detection of human serum albumin (HSA). DMAT-π-CAP showed selective turn-on fluorescence at 730 nm in the presence of HSA with more than 720-fold enhancement in emission intensity ([DMAT-π-CAP] = 10 μM), and rapid detection of HSA was accomplished in 3 s. The fluorescence intensity of DMAT-π-CAP was shown to increase in HSA concentration-dependent manner (Kd = 15.4 ± 3.3 μM), and the limit of detection of DMAT-π-CAP was determined to be 10.9 nM (0.72 mg/L). The 1:1 stoichiometry between DMAT-π-CAP and HSA was determined, and the displacement assay revealed that DMAT-π-CAP competes with hemin for the unique binding site, which rarely accommodates drugs and endogenous compounds. Based on the HSA-selective turn-on NIR fluorescence property as well as the unique binding site, DMAT-π-CAP was anticipated to serve as a fluorescence sensor for quantitative detection of the HSA level in biological samples with minimized background interference. Thus, urine samples were directly analyzed by DMAT-π-CAP to assess albumin levels, and the results were comparable to those obtained from immunoassay. The similar sensitivity and specificity to the immunoassay along with the simple, cost-effective, and fast detection of HSA warrants practical application of the NIR fluorescent albumin sensor, DMAT-π-CAP, in the analysis of albumin levels in various biological environments.
1. Introduction
Human serum albumin (HSA, 67 kDa) is the liver-produced most abundant protein (0.6 mM) in blood plasma [1]. As HSA is synthesized in the liver, hypoalbuminemia is related with liver failure which includes cirrhosis, liver cancer, hepatitis, alcohol-related liver disease, and fatty liver disease [2]. Some people with acute heart failure [3], kidney damage [4], protein-losing nephropathy and enteropathy [5] and malnutrition [6] are also susceptible to low albumin levels. On the other hand, hyperalbuminemia, an increased concentration of albumin in blood, is caused by dehydration and high protein diets [7]. HSA also serves as “taxis” for various endogenous compounds by using several ligand binding sites located on the net negatively charged globular surface: HSA binds and transports thyroid hormones, lipid-soluble hormones, unconjugated bilirubin, free fatty acids, and divalent cations (Ca2+ and Mg2+) [8]. By the same token, many drugs bind to HSA [9], and this event has great pharmaceutical interest because, upon binding to HSA, both the pharmacokinetic and pharmacodynamic properties of the drugs are affected.
Taken together, concentration of HSA can serve as prognostic marker of morbidity and mortality [7] and a predictive factor of the pharmacokinetic properties of the drugs [10]. Therefore, development of sensitive and selective detection method for quantification of HSA in biological samples is of clinical significance.
Various analytical methods have thus been developed for detection of HSA in blood, urine, and cell extracts, which include spectrophotometric (absorbance and fluorescence spectroscopy, and LCMS-proteomics), immunochemical (antibody), and radiochemical techniques [11,12,13]. Among those, due to high sensitivity and non-destructive nature, fluorescent measurement of HSA has attracted special addition. For this purpose, a series of molecular sensors that emit fluorescence upon binding to HSA have been discovered (Table 1).
These sensors are featured with HSA sensitivity and significant increases in the fluorescence intensities (9 ~ 400 fold) were observed upon binding to HSA (Table 1) [14,15,16,17,18,19,20,21,22,23,24]. In addition to the turn-on properties, sensors emitting fluorescent light in the near-infrared (NIR) range (650 nm–900 nm) has additional advantage of minimized interference of background fluorescence as well as deep tissue penetration. A dicyanomethylene-4H-chromene derivative (TG-SA) [14] and an indolium salt [16] represent the turn-on NIR fluorescent HSA sensors (Table 1). The fluorescent HSA sensors also exhibit favorable sensing properties including low detection limit (0.022 ~ 1.68 mg/L, Table 1) and wide detection range (Table 1). On the other hand, almost all HSA fluorescence sensors bind either to drug binding site 1 or to 2 and, due to competition with other drugs or endogenous compounds binding to the same binding site, they suffer from inaccurate determination of HSA (Table 1) [25,26,27]. In this context, sensors with the unique binding site have been expected to show enhanced HSA specificity but, to the best of our knowledge, ACDM is the sole example which targets neither drug site 1 nor 2 [15]. The accurate binding site of ACDM is still obscure, but the molecular dynamics study revealed the subdomain IB as the most probable binding site [15]. However, as ACDM emits fluorescent light at wavelength outside the NIR range (λem 612 nm), an HSA sensor with a unique binding site as well as NIR fluorescence emission has been highly anticipated to demonstrate HSA specificity with diagnostic applicability: NIR fluorescent sensors characterized by minimal background interference as well as high sample penetration depth are more appropriate to detect trace HSA in clinical samples.
Taken together, HSA sensors that have turn-on fluorescence in the NIR region with the characteristic binding site have not been disclosed, which prompted us to investigate novel scaffolds. Previously, we came to realize that a chlorinated α-cyanoacetophenone can serve as a good turn-on fluorescence sensor [28]. In this study, for fine control of HSA-selectivity as well as fluorescence emission wavelength, various aromatic moieties were incorporated into the α-cyanoacetophenone scaffold. Thus, we prepared a series of α-cyanoacetophenone derivatives conjugated with aromatic rings and, among those, (2E,4E,6E)-2-(3-chlorobenzoyl)-7-(5- (dimethylamino)thiophen-2-yl)hepta-2,4,6-trienenitrile (DMAT-π-CAP) showed HSA-selective turn-on NIR fluorescence by binding to hereto unexplored hemin-binding site.
2. Materials and Methods
2.1. Synthetic Procedure of DMAT-π-CAP (5)
Materials and reagents. Unless otherwise stated, chemicals were obtained from either Sigma-Aldrich (St.Louis, MO, USA), TCI (Tokyo, Japan), or Thermo Fisher Scientific (Waltham, MA, USA). A 400 AMX spectrometer (Bruker, Karlsruhe, Germany) (operating at 400 MHz and 100 MHz for 1H-NMR and 13C-NMR, respectively) was used to produce nuclear magnetic resonance spectra. Mass spectrometry data (m/z) were obtained by a FAB mass spectrometer (FAB-MS) at Korea Basic Science Institute (Daegu, Korea). Absorbance and fluorescence were recorded using a Cytation™ 5 system (BioTek, Winooski, VT, USA).
2.1.1. Synthesis of 5-(dimethylamino) thiophene-2-carbaldehyde (2)
Commercially available 5-bromothiophene-2-carboxaldehyde (1, 2.62 mmol), dissolved in H2O, was treated with dimethylamine (7.85 mmol), and the mixture was stirred at 100 ℃ for 12 h. After cooling to room temperature, water was added to the mixture, which was extracted with EtOAc three times. The organic layers were combined and washed with brine. After drying over MgSO4, the organic phase was concentrated under reduced pressure, and purification of the residue by column chromatography (silica gel, hexanes:acetone = 4:1) gave the desired product 2 in 92% yield as a yellow solid: 1H-NMR (500 MHz, acetone-d6) δ 9.49 (s, 1H), 7.60 (d, J = 4.5 Hz, 1H), 6.07 (d, J = 4.4 Hz, 1H), 3.11 (s, 6H).
2.1.2. Synthesis of (E)-3-(5-(dimethylamino) thiophen-2-yl) acrylaldehyde (3)
Under N2, a solution of 2 (2.40 mmol) and (1,3-dioxolan-2-ylmethyl)triphenylphosphonium bromide (3.36 mmol) in dry THF was treated with sodium methoxide (6.01 mmol). After stirring under reflux for 18 h, the reaction mixture was cooled to 0 °C. The reaction mixture was treated with 2 N HCl (30 mL), stirred at room temperature for 20 min, and neutralized with 2 N NaOH. After dilution with water, the mixture was extracted with EtOAc three times. The organic layers were combined and washed with brine. After drying over MgSO4, the organic phase was concentrated under reduced pressure, and purification of the residue by column chromatography (silica gel, hexane:ethyl acetate:acetone = 6:1:1) gave 3 in 34% yield as a yellow solid: 1H-NMR (500 MHz, acetone-d6): δ 9.45 (d, J = 7.8 Hz, 1H), 7.59 (d, J = 15.1 Hz, 1H), 7.26 (d, J = 4.3 Hz, 1H), 6.00 (d, J = 4.3 Hz, 1H), 5.96 (dd, J = 7.9 Hz, 7.2 Hz, 1H), 3.09 (s, 6H).
2.1.3. Synthesis of (2E, 4E)-5-(5-(dimethylamino)thiophen-2-yl)penta-2,4-dienal (4)
Under N2, a solution of 3 (0.81 mmol) and (1,3-dioxolan-2-ylmethyl)triphenylphosphonium bromide (1.14 mmol) in dry THF was treated with sodium methoxide (2.03 mmol). After stirring under reflux for 18 h, the reaction mixture was cooled to 0 °C. The reaction mixture was treated with 2 N HCl (30 mL), stirred at room temperature for 20 min, and neutralized with 2 N NaOH. After dilution with water, the mixture was extracted with EtOAc three times. The organic layers were combined and washed with brine. After drying over MgSO4., the organic phase was concentrated under reduced pressure, and purification of the residue by column chromatography (silica gel, hexane:ethyl acetate:acetone = 6:1:1) gave 4 in 42% yield as a red solid: 1H-NMR (500 MHz, acetone-d6): δ 9.50 (d, J = 10.1 Hz, 1H), 7.32 (dd, J = 14.0 Hz, 4.7 Hz, 1H), 7.16 (d, J = 18.2 Hz, 1H), 7.03 (d, J = 5.1 Hz, 1H), 6.43 (dd, J = 14.0 Hz, 4.6 Hz, 1H), 6.06 (dd, J = 10.1 Hz, 8.6 Hz, 1H), 5.9 (d, J = 5.2 Hz, 1H), 3.03 (s, 6H).
2.1.4. Synthesis of (2E,4E,6E)-2-(3-chlorobenzoyl)-7-(5-(dimethylamino)thiophen-2-yl)hepta-2,4,6- trienenitrile (5)
Compound 4 (83 mg, 0.32 mmol) obtained above was dissolved in dry THF (5 mL), and the solution was treated with imidazole (33 mg, 0.49 mmol) and 3-chlorobenzoylacetonitrile (87 mg, 0.49 mmol) under N2. After stirring at 60 °C for 18 h, the reaction mixture was cooled to room temperature and concentrated under reduced pressure. Purification of the residue by column chromatography (silica gel, hexane:dichloromethane:ethyl acetate = 6:1:1) gave 5 (64.9 mg, 0.18 mmol) in 55% yield as a blue solid: 1H-NMR (500 MHz, CDCl3): δ 7.87 (d, J = 12.3 Hz, 1H), 7.78 (s, 1H), 7.73 (d, J = 6.4 Hz, 1H), 7.52 (d, J = 6.2 Hz, 1H), 7.42 (t, J = 6.8 Hz, 1H), 7.27 (s, 1H), 7.11 (t, J = 12.5 Hz, 1H), 7.05 (d, J = 12.6 Hz, 1H), 7.03 (s, 1H), 6.77 (t, J = 12.7 Hz, 1H), 6.41 (t, J = 12.8 Hz, 1H), 3.10 (s, 6H); 13C-NMR (125 MHz, CDCl3): δ 187.4, 164.2, 157.0, 153.3, 139.3, 138.9, 136.0, 134.6, 132.2, 129.7, 128.7, 126.8, 125.8, 123.0, 120.5, 117.6, 104.1, 103.8, 42.3; FAB-MS calcd for C20H18ClN2OS [M+H]+ 369.0823, found 369.0828.
2.2. Determination of Fluorescence Properties of DMAT-π-CAP in PBS Buffer (pH 7.4)
Stock solutions of DMAT-π-CAP (500 μM in DMSO) and HSA (1 mM in PBS, pH 7.4) were prepared. At room temperature, 1 μL of HSA (1 mM in PBS, pH 7.4) and 1 μL of DMAT-π-CAP (500 μM in DMSO) stock solutions were mixed with 98 μL of PBS (pH 7.4). After incubation for 3 min, the mixture was transferred into 96-well plate and the fluorescence was measured (λex/λem = 600/730 nm) by a Cytation™ 5 system. All measurements were carried out in triplicates.
2.3. Determination of the Quantum Efficiency of Fluorescence of DMAT-π-CAP
At various concentrations (absorbances) of fluorescein (1-10 μM), integrated fluorescence intensity was measured (λex/λem = 430/515 nm) by a Cytation™ 5 system. The same experiment was performed by using various concentrations (absorbances) of DMAT-π-CAP (1-10 μM) in the absence and presence of HSA (10 μM). Absorbance of fluorescein (or DMAT-π-CAP) was then plotted against the integrated fluorescence intensity, and the resulting linear regression slope was determined to give Grads (or Gradx). By using fluorescein as a reference (Φs = 0.65 in water), quantum efficiency of DMAT-π-CAP (Φx) was determined (Φx = Φs[Gradx/Grads][ηx2/ηs2]). As all experiments were performed in the same solvent, water, solvent refractive index of DMAT-π-CAP (ηx) is equal to that of fluorescein (ηs).
2.4. HSA-Selective Turn-on Fluorescence of DMAT-π-CAP
Mixtures containing 1 μL of DMAT-π-CAP stock solution (500 μM) and 1 μL of various bioanalytes [1 mM except BSA (200 μM)] in PBS (pH 7.4) were incubated for 3 min at room temperature. After transferring into 96-well plate, the fluorescence was measured (λex/λem = 600/730 nm) by a Cytation™ 5 system. All measurements were carried out in triplicates. The bioanalytes include HSA, BSA, Na+, K+, Ca2+, Mg2+, NH4+, PO43-, urea, uric acid, glucose, glycine, leucine, isoleucine, lidocaine, bilirubin, γ-globulins, creatinine, pepsin, transferrin, human IgG, papain, chymotrypsinogen A, trypsin, and DNA.
2.5. Time-Dependent Fluorescence of DMAT-π-CAP after Incubation with HSA.
At room temperature, 1 μL of HSA (1 mM in PBS, pH 7.4) and 1 μL of DMAT-π-CAP (500 μM in DMSO) stock solutions were mixed with 98 μL of PBS (pH 7.4) in 96-well plate. Immediately after mixing, the fluorescence was measured (λex/λem = 600/730 nm) by a Cytation™ 5 system at every second for 3 min. All measurements were carried out in triplicates.
2.6. Concentration-Dependent Fluorescence of DMAT-π-CAP after Incubation with HSA
HSA stock solution (10 mM) was serially diluted with PBS (pH 7.4) to give HSA solutions with various concentrations (10, 9, 8, 7, 6, 5, 4, 3, 2, 1, 0.5, 0.25, 0.125 mM). DMAT-π-CAP (1 μL, 500 μM in DMSO) was mixed with 1 μL of each HSA solution in 98 μL of PBS (pH 7.4). After transferring into 96-well plate, fluorescence was measured (λex/λem = 600/730 nm) by a Cytation™ 5 system. All measurements were carried out in triplicates.
2.7. Limit of Detection (LOD) of DMAT-π-CAP
In the absence of HSA, fluorescence of DMAT-π-CAP (5 μM, PBS pH 7.4) was measured five times, and the standard deviation of blank measurement (σ) was determined. On the other hand, in the presence of varying concentrations of HSA, fluorescence intensity of DMAT-π-CAP (5 μM, PBS pH 7.4) at 730 nm was measured and, from the linear plot of the fluorescence intensity against HSA concentrations, the slope was determined. Limit of detection (LOD) of DMAT-π-CAP was then determined by the following equation: LOD = 3σ/slope.
2.8. Job’s Plot Analysis of DMAT-π-CAP
Mixtures of DMAT-π-CAP and HSA (total concentrations = 10 μM) were generated in PBS buffer (pH = 7.4) by varying molar ratios (0.1 ~ 0.9). Fluorescence measurements were performed as described above.
2.9. Dissociation Constant (Kd) of DMAT-π-CAP from HSA
Fluorescence intensity was measured (λex/λem = 600/730 nm) from incubation mixtures of DMAT-π-CAP (5 μM) and various concentrations of HSA (0.01, 0.02, 0.04, 0.08, 0.15, 0.3, 0.6, 1.25, 2.5, 5.0, 10, 20, 30, 40, 50, 60, 70, 80, 90, 100 μM). The titration curve thus obtained was fitted to the single site saturation binding equation [Y = BmaxX/(Kd+X), Y: fluorescence intensity of DMAT-π-CAP (5 μM), X: concentration of HSA] using SigmaPlot software [23], and the dissociation constant (Kd) as well as the maximum number of binding sites (Bmax) were then calculated.
2.10. Assignment of the Binding Site of DMAT-π-CAP on HSA
Stock solutions of DMAT-π-CAP (500 μM) and site-specific drugs (500 µM) in DMSO were prepared. Displacement of DMAT-π-CAP from the HSA-DMAT-π-CAP complex was performed by addition of one of the site-specific drugs (500 μM) including warfarin (drug binding site I, subdomain IIA), ibuprofen (drug binding site II, subdomain IIIA), and hemin (subdomain IB). At room temperature, 178 μL of albumin (10 μM) solution was mixed with DMAT-π-CAP (2 µL) and 20 μL of the site-specific drugs, and the resulting mixture was incubated at room temperature for 3 min. After incubation, 150 μL of the supernatant was transferred into 96-well plate and the fluorescence emission was measured (λex/λem = 600/730 nm) by s Cytation™ 5 system. All measurements were carried out in triplicates.
2.11. Assessment of Urinary Albumin Levels
2.11.1. Fluorometric Analysis of Urinary Albumin with DMAT-π-CAP
DMAT-π-CAP was dissolved in DMSO to obtain a 500 μM stock solution. Urine samples were collected from healthy female donors and used at the same day after centrifugation for 10 min at 1000 g at 4 ℃. For direct fluorometric measurement, DMAT-π-CAP (5 μM) was incubated with the undiluted urine samples for 3 min, and the fluorescence emission was measured (λex/λem = 600/730 nm) by a Cytation™ 5 system. On the other hand, fluorometric standard addition method was performed by incubating DMAT-π-CAP (500 μM, 1 μL) and various concentration of HSA (0, 2, 4, 6, 8, 10 μM; 1 μL) in urine (98 ~ 99 μL) 3 min. The fluorescence emission was then measured (λex/λem = 600/730 nm) by a Cytation™ 5 system. All measurements were carried out in triplicates.
2.11.2. Determination of Urinary Albumin by Immunoassay
For the determination of urinary albumin levels with immunoassay, human albumin ELISA kit (STA-383-Human Albumin ELISA kit Cell Biolabs, Inc., San Diego, CA, USA) was used according to the manufacturer’s protocol. The calibration curve obtained by using human HSA standard dissolved in assay buffer was used to estimate the HSA concentration in the urine sample.
2.12. Statistics
Data are expressed as means ± SD from at least three independent experiments. Tests used for nonparametric data included one-way analysis of variance (ANOVA) with Tukey’s post hoc test using a GraphPad Prism 5 software (San Diego, CA, USA, USA). Unless otherwise indicated, p values < 0.05 were considered statistically significant.
3. Results
3.1. Synthesis of DMAT-π-CAP
Straightforward synthesis of DMAT-π-CAP (5, Scheme 1) was completed from commercially available 5-bromothiophene-2-carbaldehyde (1) in four steps. Briefly, aromatic nucleophilic substitution by dimethylamine in refluxing water converted 1 into the corresponding 5-dimethylaminothiophene-2-carbaldehyde (2). Chain-elongated conjugated aldehyde 3 was then prepared by aldol condensation of 2 with (1,3-dioxolan-2-ylmethyl)-triphenylphosphonium bromide followed by acidic hydrolysis. The chain-elongation reaction was repeated on 3 to give 4, which was condensed with 3-chlorobenzoylacetonitrile under Knovenagel conditions to give the title compound DMAT-π-CAP (5).
3.2. Near-infrared Turn-on Fluorescence Properties of DMAT-π-CAP
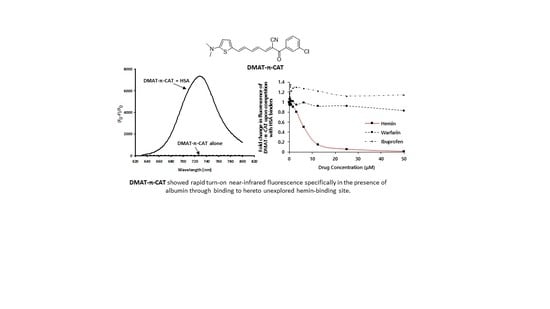
The fluorescence properties of DMAT-π-CAP was investigated in PBS buffer (pH 7.4), which showed an absorption maxima (λex) at 600 nm. DMAT-π-CAP (5 μM) alone did not show any noticeable emission fluorescence (Figure 1a, inset) but, in the presence of HSA (10 μM, 665 mg/L), it showed strong fluorescence in the NIR region (λem = 730 nm) culminating in more than 720-fold enhancement in the emission intensity (Figure 1a) and the quantum yield increase by 37-fold (Figure S1, Supplementary Material).
Compared with the previously reported fluorescent HSA sensors (Table 1), the remarkably high increase in fluorescence intensity of DMAT-π-CAP in the presence of HSA is noteworthy. Moreover, DMAT-π-CAP showed selective turn-on fluorescence in the presence of human (HSA) and bovine (BSA) albumin proteins, while no substantial fluorescence was observed upon co-incubation with various bioanalytes including intracellular ions, organic molecules, and proteins with wide range of isoelectric points and nucleic acid (Figure 1b). In addition, fluorescence signal from DMAT-π-CAP became stable in 3 s after incubation with HSA (Figure S2). Taken together, these data suggested selective and rapid binding of DMAT-π-CAP to HSA resulting in turn-on fluorescence in the NIR region.
The fluorescence intensity of DMAT-π-CAP at 730 nm was shown to increase in HSA concentration-dependent manner (Figure 2a). The steep increase in fluorescence intensity at lower HSA concentrations was followed by a plateau at 50 μM (3.3 g/L) and, at this concentration of HSA, more than 1,200-fold of fluorescence intensity increase of DMAT-π-CAP was achieved (Figure 2b). From the linear region of the HSA concentration-dependent fluorescence data (inset, Figure 2b; [HSA] = 0–10 μM, correlation coefficient R2 = 0.9892), the limit of detection (LOD) for HSA by DMAT-π-CAP (5 μM) was determined (LOD = 3σ/slope) to be 10.9 nM (0.72 mg/L), which is comparable to those of other HSA sensors (Table 1).
Considering the reference range of albumin in urine (2.2–25 mg/L) [29], the wide linear dynamic range spanning two orders of magnitude (0.01–10 μM; 0.72–665 mg/L) supports the clinical use of DMAT-π-CAP for detecting HSA.
3.3. The Binding Properties of DMAT-π-CAP to HSA
In order to gain in-depth information of the binding properties and the binding site of DMAT-π-CAP on HSA, we performed Job’s plot analysis as well as competition assay with site-specific binders. First, the stoichiometry of binding of DMAT-π-CAP on HSA was determined to be 1:1 by analysis of a Job’s plot, which showed the maximum fluorescence intensity when the molar fraction of DMAT-π-CAP approached 0.5 (Figure 3a). The 1:1 stoichiometry between DMAT-π-CAP and HSA also suggests the single binding site and, when the one-site binding model is applied to the data shown in Figure 2b, a relatively high binding affinity with a dissociation constant (Kd) of 15.4 ± 3.3 μM was obtained. Based on the one-site binding model, the binding site of DMAT-π-CAP on HSA was then explored. HSA possesses two distinct drug binding sites, and most drugs and fluorescence dyes are classified into specific binders to one of these two sites. By the same token, DMAT-π-CAP was anticipated to bind to either of the two drug binding sites, which could be confirmed by a competition binding assay with site-specific binders such as warfarin (drug site 1) and ibuprofen (drug site 2). However, fluorescence intensity from the preformed complex of DMAT-π-CAP and HSA was not affected by addition of increasing concentrations of warfarin or ibuprofen (Figure 3b).
Instead, hemin effectively replaced DMAT-π-CAP from HSA to result in sharp decrease in fluorescence intensity (>95% displacement by 25 μM of hemin), which suggests that DMAT-π-CAP and hemin share the same binding site in HSA. Collectively, these results demonstrate that the specific binding to the hereto unexplored hemin-binding site of HSA is responsible for the turn-on fluorescence of DMAT-π-CAP. Hemin, a porphyrin, is a rare example of the HSA-binders targeting its subdomain IB [30]. Bilirubin [31] and lidocaine [32] are also known to bind to subdomain IB but, while bilirubin and lidocaine did not compete with DMAT-π-CAP for binding to HSA (Figure 1b), hemin effectively displaced DMAT-π-CAP from its complex with HSA (Figure 3b). This result is not surprising in light of the distinct differences in the binding sites of these subdomain IB-binding molecules (Figure S3). Thus, it might be proposed that, among the various binding sites located in the subdomain IB of HSA, only the hemin-binding site specifically accommodates DMAT-π-CAP.
3.4. Determination of Urinary HSA Levels by Using DMAT-π-CAP
The unique binding mode of DMAT-π-CAP is reminiscent of ACDM, which demonstrated selective and sensitive detection of HSA through binding to a non-drug binding site [14]. In addition, NIR fluorescence property of DMAT-π-CAP locates its emission wavelength at 730 nm, which is far away from the interfering background fluorescence of biological samples such as plasma (~520 nm) [33] and urine (400 ~ 450 nm) [34]. Taken together, the HSA-selective turn-on NIR fluorescence property of DMAT-π-CAP along with its unique HSA-binding site was anticipated to allow detection and monitoring of the HSA levels in biological samples with minimized background interference. Thus, clinical applicability of DMAT-π-CAP as an HSA sensor was evaluated by measurement of urinary HSA levels. Urine samples were obtained from three healthy donors, and urinary HSA levels were determined by using direct fluorometric method as well as fluorometric standard addition method. The direct fluorometric analysis is based on the proportional relationship between fluorescence emission of DMAT-π-CAP and concentration of HSA (Figure 2b). Therefore, fluorescence intensities of DMAT-π-CAP (5 μM) were measured (λex/λem = 600/730 nm) in the presence of undiluted urine samples and, by using the linear relationship between fluorescence intensity and HSA concentration (Figure 2b), the urinary HSA concentrations were determined (4.9 mg/L, 7.5 mg/L, and 24.2 mg/L) (Figure 4).
The second fluorometric measurement of urinary HSA levels was accomplished by using the fluorometric standard addition method [23], and the urine samples were spiked with various concentrations of HSA (0.2–2.0 μM; 13.3–133.0 mg/L). The fluorescence of DMAT-π-CAP (5 μM) in each HSA-spiked urine sample was then measured (λem = 730 nm), and the fluorescence intensity of DMAT-π-CAP increased linearly as the spiked HSA increased (Figure S4). From the linear plots, the urinary albumin levels of the three donors were determined to be 4.8 mg/L, 7.6 mg/L, and 22.7 mg/L, respectively, which are in good agreement with those obtained by direct fluorometric method (Figure 4). On the other hand, immunoassay using anti-HSA antibody was also performed, and the urinary albumin levels determined by immunoassay (1.6 mg/L, 4.6 mg/L, and 21.4 mg/L, respectively) (Figure S5) was comparable to those obtained by the fluorometric analyses of DMAT-π-CAP (Figure 4). These results demonstrate convincingly that the sensitivity and selectivity of DMAT-π-CAP toward HSA remains unperturbed in urine and DMAT-π-CAP can serve as a suitable fluorescence probe for precise determination of the HSA levels in urine samples.
4. Conclusions
In summary, a readily synthesizable fluorescent probe DMAT-π-CAP was evaluated for sensitive and selective detection of HSA. DMAT-π-CAP showed selective turn-on fluorescence at 730 nm (λem) in the presence of HSA with more than 720-fold enhancement in emission intensity ([DMAT-π-CAP] = 10 μM), and rapid detection of HSA was accomplished in 3 s. The fluorescence intensity of DMAT-π-CAP was shown to increase in HSA concentration-dependent manner (Kd = 15.4 ± 3.3 μM), and the LOD of DMAT-π-CAP was determined to be 10.9 nM (0.72 mg/L). The 1:1 stoichiometry between DMAT-π-CAP and HSA was determined, and the displacement assay revealed that DMAT-π-CAP competes with hemin for the unique binding site, which rarely accommodates drugs and endogenous compounds. Based on the HSA-selective turn-on NIR fluorescence property as well as the unique binding site, DMAT-π-CAP was anticipated to serve as a fluorescence sensor for quantitative detection of the HSA level in biological samples with minimized background interference. Thus, urine samples were directly analyzed by DMAT-π-CAP to assess albumin levels, and the results were comparable to those obtained from immunoassay. The similar sensitivity and specificity to the immunoassay along with the simple, cost-effective, and fast detection of HSA warrants practical application of the NIR fluorescent albumin sensor, DMAT-π-CAP, in the analysis of albumin levels in various biological environments.
Supplementary Materials
The following are available online at https://www.mdpi.com/1424-8220/20/4/1232/s1, Figure S1: Determination of fluorescence quantum yield of DMAT-π-CAP using fluorescein as the reference, Figure S2: Time-dependent fluorescence intensity of DMAT-π-CAP (5 μM, λex = 730 nm) bound to HSA (10 μM), Figure S3: Superimposed structures of the subdomain IB of HSA complexed with hemin (PDB ID lo9x), bilirubin (PDB ID 2vue), and lidocaine (PDB ID 3jqz), Figure S4. Fluorescence response of 5 μM DMAT-π-CAP in three different urine samples spiked with various concentrations of HSA (13.3–133.0 mg/L), Figure S5: A calibration curve for human HSA immunoassay.
Author Contributions
Conceptualization, E.S. and W.J.; methodology, Y.K. and E.S.; software, Y.K.; validation, Y.K. and W.J.; formal analysis, M.K.K.; investigation, Y.K. and M.K.K.; resources, Y.C.; data curation, M.K.K.; writing—original draft preparation, Y.K.; writing—review and editing, Y.C.; visualization, M.K.K.; supervision, M.K.K.; project administration, Y.C.; funding acquisition, Y.C. All authors have read and agreed to the published version of the manuscript.
Funding
This research was supported by Konkuk University in 2017.
Conflicts of Interest
The authors declare no conflict of interest.
References
- Quinlan, G.J.; Martin, G.S.; Evans, T.W. Albumin: Biochemical properties and therapeutic potential. Hepatology 2005, 41, 1211–1219. [Google Scholar] [CrossRef]
- Mazzaferro, E.M.; Rudloff, E.; Kirby, R. The role of albumin replacement in the critically ill veterinary patient. J. Vet. Emerg. Crit. Care 2002, 12, 113–124. [Google Scholar] [CrossRef]
- Arques, S.; Ambrosi, P.J. Human serum albumin in the clinical syndrome of heart failure. Card. Fail. 2011, 17, 451–458. [Google Scholar] [CrossRef] [PubMed]
- Lang, J.; Katz, R.; Ix, J.H.; Gutierrez, O.M.; Peralta, C.A.; Parikh, C.R.; Satterfield, S.; Petrovic, S.; Devarajan, P.; Bennett, M.; et al. Association of serum albumin levels with kidney function decline and incident chronic kidney disease in elders. Nephrol. Dial. Transplant 2018, 33, 986–992. [Google Scholar] [CrossRef] [PubMed]
- Levitt, D.G.; Levitt, M.D. Protein losing enteropathy: comprehensive review of the mechanistic association with clinical and subclinical disease states. Clin. Exp. Gastroenterol. 2017, 10, 147–168. [Google Scholar] [CrossRef] [PubMed] [Green Version]
- Doweiko, J.P.; Nompleggi, D.J. The role of albumin in human physiology and pathophysiology, Part III: Albumin and disease states. J. Parenter. Enteral Nutr. 1991, 15, 476–483. [Google Scholar] [CrossRef] [PubMed]
- Levitt, D.G.; Levitt, M.D. Human serum albumin homeostasis: A new look at the roles of synthesis, catabolism, renal and gastrointestinal excretion, and the clinical value of serum albumin measurements. Int. J. Gen. Med. 2016, 9, 229–255. [Google Scholar] [CrossRef] [PubMed] [Green Version]
- Sand, K.M.; Bern, M.; Nilsen, J.; Noordzij, H.T.; Sandlie, I.; Andersen, J.T. Unraveling the interaction between FcRn and albumin: Opportunities for design of albumin-based therapeutics. Front. Immunol. 2015, 5, 682. [Google Scholar] [CrossRef] [Green Version]
- Yamasaki, K.; Chuang, V.T.; Maruyama, T.; Otagiri, M. Albumin–drug interaction and its clinical implication. Biochim. Biophys. Acta 2013, 1830, 5435–5443. [Google Scholar] [CrossRef]
- Dennis, M.S.; Zhang, M.; Meng, Y.G.; Kadkhodayan, M.; Kirchhofer, D.; Combs, D.; Damico, L.A. Albumin binding as a general strategy for improving the pharmacokinetics of proteins. J. Biol. Chem. 2002, 277, 35035–35043. [Google Scholar] [CrossRef] [Green Version]
- Seegmiller, J.C.; Sviridov, D.; Larson, T.S.; Borland, T.M.; Hortin, G.L.; Lieske, J.C. Comparison of urinary albumin quantification by immunoturbidimetry, competitive immunoassay, and protein-cleavage liquid chromatography-tandem mass spectrometry. Clin. Chem. 2009, 55, 1991–1994. [Google Scholar] [CrossRef] [PubMed] [Green Version]
- Rasanayagam, L.J.; Lim, K.L.; Beng, C.G.; Lau, K.S. Measurement of urine albumin using bromocresol green. Clin. Chim. Acta 1973, 44, 53–57. [Google Scholar] [CrossRef]
- Choi, S.; Choi, E.Y.; Kim, D.J.; Kim, J.H.; Kim, T.S.; Oh, S.W. A rapid, simple measurement of human albumin in whole blood using a fluorescence immunoassay (I). Clin. Chim. Acta 2004, 339, 147–156. [Google Scholar] [CrossRef] [PubMed]
- Rajasekhar, K.; Achar, C.J.; Govindaraju, T. A red-NIR emissive probe for the selective detection of albumin in urine samples and live cells. Org. Biomol. Chem. 2017, 15, 1584–1588. [Google Scholar] [CrossRef]
- Wang, Y.-R.; Feng, L.; Xu, L.; Li, Y.; Wang, D.- D.; Hou, J.; Zhou, K.; Jin, Q.; Ge, G.-B.; Cui, J.-N.; et al. A rapid-response fluorescent probe for the sensitive and selective detection of human albumin in plasma and cell culture supernatants. Chem. Commun. 2016, 52, 6064–6067. [Google Scholar] [CrossRef]
- Reja, S.I.; Khan, I.A.; Bhalla, V.; Kumar, M. A TICT based NIR-fluorescent probe for human serum albumin: A pre-clinical diagnosis in blood serum. Chem. Commun. 2016, 52, 1182–1185. [Google Scholar] [CrossRef]
- Kessler, M.A.; Meinitzer, A.; Petek, W.; Wolfbeis, O.S. Microalbuminuria and borderline-increased albumin excretion determined with a centrifugal analyzer and the Albumin Blue 580 fluorescence assay. Clin. Chem. 1997, 43, 996–1002. [Google Scholar] [CrossRef] [Green Version]
- Li, W.Y.; Chen, D.D.; Wang, H.; Luo, S.S.; Dong, L.C.; Zhang, Y.H.; Shi, J.B.; Tong, B.; Dong, Y.P. Quantitation of albumin in serum using “turn-on” fluorescent probe with aggregation-enhanced emission characteristics. ACS Appl. Mater. Interfaces 2015, 7, 26094–26100. [Google Scholar] [CrossRef]
- Hong, Y.; Feng, C.; Yu, Y.; Liu, J.; Lam, J.W.; Luo, K.Q.; Tang, B.Z. Quantitation, visualization, and monitoring of conformational transitions of human serum albumin by a tetraphenylethene derivative with aggregation-induced emission characteristics. Anal. Chem. 2010, 82, 7035–7043. [Google Scholar] [CrossRef]
- Min, J.; Lee, J.W.; Ahn, Y.H.; Chang, Y.T. Combinatorial dapoxyl dye library and its application to site selective probe for human serum albumin. J. Comb. Chem. 2007, 9, 1079–1083. [Google Scholar] [CrossRef]
- Jisha, V.S.; Arun, K.T.; Hariharan, M.; Ramaiah, D. Site-selective binding and dual mode recognition of serum albumin by a squaraine dye. J. Am. Chem. Soc. 2006, 128, 6024–6025. [Google Scholar] [CrossRef] [PubMed]
- Er, J.C.; Vendrell, M.; Tang, M.K.; Zhai, D.; Chang, Y.T. Fluorescent dye cocktail for multiplex drug-site mapping on human serum albumin. ACS Comb. Sci. 2013, 15, 452–457. [Google Scholar] [CrossRef] [PubMed]
- Wu, Y.Y.; Yu, W.T.; Hou, T.C.; Liu, T.K.; Huang, C.L.; Chen, I.C.; Tan, K.T. A selective and sensitive fluorescent albumin probe for the determination of urinary albumin. Chem. Commun. 2014, 50, 11507–11510. [Google Scholar] [CrossRef] [PubMed]
- Fan, J.; Sun, W.; Wang, Z.; Peng, X.; Li, Y.; Cao, J. A fluorescent probe for site I binding and sensitive discrimination of HSA from BSA. Chem. Commun. 2014, 50, 9573–9576. [Google Scholar] [CrossRef] [PubMed]
- Ghuman, J.; Zunszain, P.A.; Petitpas, I.; Bhattacharya, A.A.; Otagiri, M.; Curry, S. Structural basis of the drug-binding specificity of human serum albumin. J. Mol. Biol. 2005, 353, 38–52. [Google Scholar] [CrossRef]
- Sudlow, G.; Birkett, D.J.; Wade, D.N. The characterization of two specific drug binding sites on human serum albumin. Mol. Pharmacol. 1975, 11, 824–832. [Google Scholar]
- Sudlow, G.; Birkett, D.J.; Wade, D.N.; Sudlow, G.; Birkett, D.J.; Wade, D.N. Further characterization of specific drug binding sites on human serum albumin. Mol. Pharmacol. 1976, 12, 1052–1061. [Google Scholar]
- Park, K.-S.; Yoo, K.; Kim, M.K.; Jung, W.; Choi, Y.K.; Chong, Y. A novel probe with a chlorinated α-cyanoacetophenone acceptor moiety shows near-infrared fluorescence specific for tau fibrils. Chem. Pharm. Bull. 2017, 65, 1113–1116. [Google Scholar] [CrossRef] [Green Version]
- Akman, S.; Kurt, I.; Gultepe, M.; Dibirdik, I.; Kilinc, C.; Kutluay, T.; Karaca, L.; Bingol, N.K. The development and validation of a competitive, microtiter plate enzymeimmunoassay for human albumin in urine. J. Immunoassay 1995, 16, 279–296. [Google Scholar] [CrossRef]
- Zunszain, P.A.; Ghuman, J.; Komatsu, T.; Tsuchida, E.; Curry, S. Crystal structural analysis of human serum albumin complexed with hemin and fatty acid. BMC Struct. Biol. 2003, 3. [Google Scholar] [CrossRef] [Green Version]
- Zunszain, P.A.; Ghuman, J.; McDonagh, A.F.; Curry, S. Crystallographic analysis of human serum albumin complexed with 4Z,15E-Bilirubin-IXα. Mol Biol. 2008, 381, 394–406. [Google Scholar] [CrossRef] [PubMed] [Green Version]
- Hein, K.L.; Kragh-Hansen, U.; Morth, J.P.; Jeppesen, M.D.; Otzen, D.; Møller, J.V.; Nissen, P.J. Crystallographic analysis reveals a unique lidocaine binding site on human serum albumin. Struct. Biol. 2010, 171, 353–360. [Google Scholar] [CrossRef] [PubMed]
- Lualdi, M.; Battaglia, L.; Colombo, A.; Leo, E.; Morelli, D.; Poiasina, E.; Vannelli, A.; Marchesini, R. Colorectal cancer detection by means of optical fluoroscopy. A study on 494 subjects. Front. Biosci. 2010, 2, 694–700. [Google Scholar] [CrossRef] [PubMed] [Green Version]
- Anwer, A.G.; Sandeep, P.M.; Goldys, E.M.; Vemulpad, S. Distinctive autofluorescence of urine samples from individuals with bacteriuria compared with normals. Clin. Chim. Acta 2009, 401, 73–75. [Google Scholar] [CrossRef]
Scheme 1.
Synthesis of the title compound, DMAT-π-CAP (5).

Figure 1.
(a) Fluorescence spectra of DMAT-π-CAP (5 μM) in the absence and presence of HSA (10 μM). A magnified view of the boxed region is shown in the inset. (b) Fluorescence intensity of DMAT-π-CAP (5 μM) in the presence of various bioanalytes [10 μM except BSA (2 μM)]. (F0-F)/F0 indicates relative fluorescence intensity. Data are the mean ± standard error (n = 3).

Figure 2.
(a) Emission fluorescence spectra of DMAT-π-CAP (5 μM, λem = 730 nm) upon addition of increasing concentration of HSA (0, 1.25, 2.5, 5, 10, 20, 30, 40, 50, 60, 70, 80, 90, and 100 μM). (b) HSA-dependent change in the fluorescence intensity of DMAT-π-CAP. Inset shows the linear relationship between the fluorescence intensity of DMAT-π-CAP (5 μM) at 730 nm and the concentrations of HSA (0–10 μM). (F0-F)/F0 indicates relative fluorescence intensity.

Figure 3.
(a) Job’s plot analysis. Fluorescence intensity of a mixture of DMAT-π-CAP and HSA (total molar concentration = 10 μM at PBS) was measured at different molar ratios of the two components (0.1–0.9) (λem = 730 nm). (F0–F)/F0 indicates relative fluorescence intensity. (b) Changes in the fluorescence intensity (λem = 730 nm) from a mixture of DMAT-π-CAP (5 μM) and HSA (10 μM) upon addition of site-specific markers (warfarin, ibuprofen, and hemin).

Figure 4.
The albumin levels in urine samples determined by direct fluorometric method and standard addition method using DMAT-π-CAP were compared with those obtained by immunoassay. Data are mean ± SD. *, p < 0.05; **, p < 0.01, ***, p < 0.001.
Figure 4.
The albumin levels in urine samples determined by direct fluorometric method and standard addition method using DMAT-π-CAP were compared with those obtained by immunoassay. Data are mean ± SD. *, p < 0.05; **, p < 0.01, ***, p < 0.001.


Table 1.
Fluorescent HSA sensors: structures, fluorescence properties, HSA sensitivity (fluorescence fold increase), binding sites and sensing properties (limit of detection, detection range).
Table 1.
Fluorescent HSA sensors: structures, fluorescence properties, HSA sensitivity (fluorescence fold increase), binding sites and sensing properties (limit of detection, detection range).

| Name | Fluorescence properties | Sensing properties (mg/L) | Binding site d | Ref | |||
|---|---|---|---|---|---|---|---|
| λex (nm) a | λem (nm) b | Fold increase c | Limit of Detection | Detection range | |||
| TG-SA | 530 | 733 | 100 | 1.26 | 1.26–232 | I | 14 |
| ACDM | 560 | 612 | 75 | 2.5 | 0–300 | ND e | 15 |
| Indolium salt | 550 | 680 | 12 | 0.73 | 0.73–998 | I | 16 |
| AB 580 | 590 | 616 | 17 | 0.4 | 1–50 | NA f | 17 |
| DP-TPPNa | 310 | 443 | 9 | 1.68 | 1.68–100 | NA f | 18 |
| BSPOTPE | 350 | 475 | 300 | 0.67 | 0–6.7 | I/II f | 19 |
| A41-S | 360 | 473 | 55 | NA f | NA f | I | 20 |
| Squaraine Dye | 560 | 620 | 80 | NA f | NA f | II | 21 |
| BD140 | 520 | 585 | 41 | NA f | NA f | II | 22 |
| AL-1 | 456 | 490 | 400 | 0.4 | 0–66.5 | I | 23 |
| DH1 | 520 | 620 | 70 | 0.022 | 0-11.9 | I | 24 |
a Absorption wavelength; b Emission wavelength; c Fold increase in fluorescence intensity of the sensor after addition of HSA; d Drug binding site 1 (I) and 2 (II); e Not determined; f Not available.
© 2020 by the authors. Licensee MDPI, Basel, Switzerland. This article is an open access article distributed under the terms and conditions of the Creative Commons Attribution (CC BY) license (http://creativecommons.org/licenses/by/4.0/).
Share and Cite
MDPI and ACS Style
Kim, Y.; Shin, E.; Jung, W.; Kim, M.K.; Chong, Y. A Near-infrared Turn-on Fluorescent Sensor for Sensitive and Specific Detection of Albumin from Urine Samples. Sensors 2020, 20, 1232. https://doi.org/10.3390/s20041232
AMA Style
Kim Y, Shin E, Jung W, Kim MK, Chong Y. A Near-infrared Turn-on Fluorescent Sensor for Sensitive and Specific Detection of Albumin from Urine Samples. Sensors. 2020; 20(4):1232. https://doi.org/10.3390/s20041232
Chicago/Turabian StyleKim, Yoonjeong, Eunryeol Shin, Woong Jung, Mi Kyoung Kim, and Youhoon Chong. 2020. "A Near-infrared Turn-on Fluorescent Sensor for Sensitive and Specific Detection of Albumin from Urine Samples" Sensors 20, no. 4: 1232. https://doi.org/10.3390/s20041232
Note that from the first issue of 2016, this journal uses article numbers instead of page numbers. See further details here.