Three-Dimensional Device-Free Localization for Vehicle


Abstract
:1. Introduction
2. Related Works
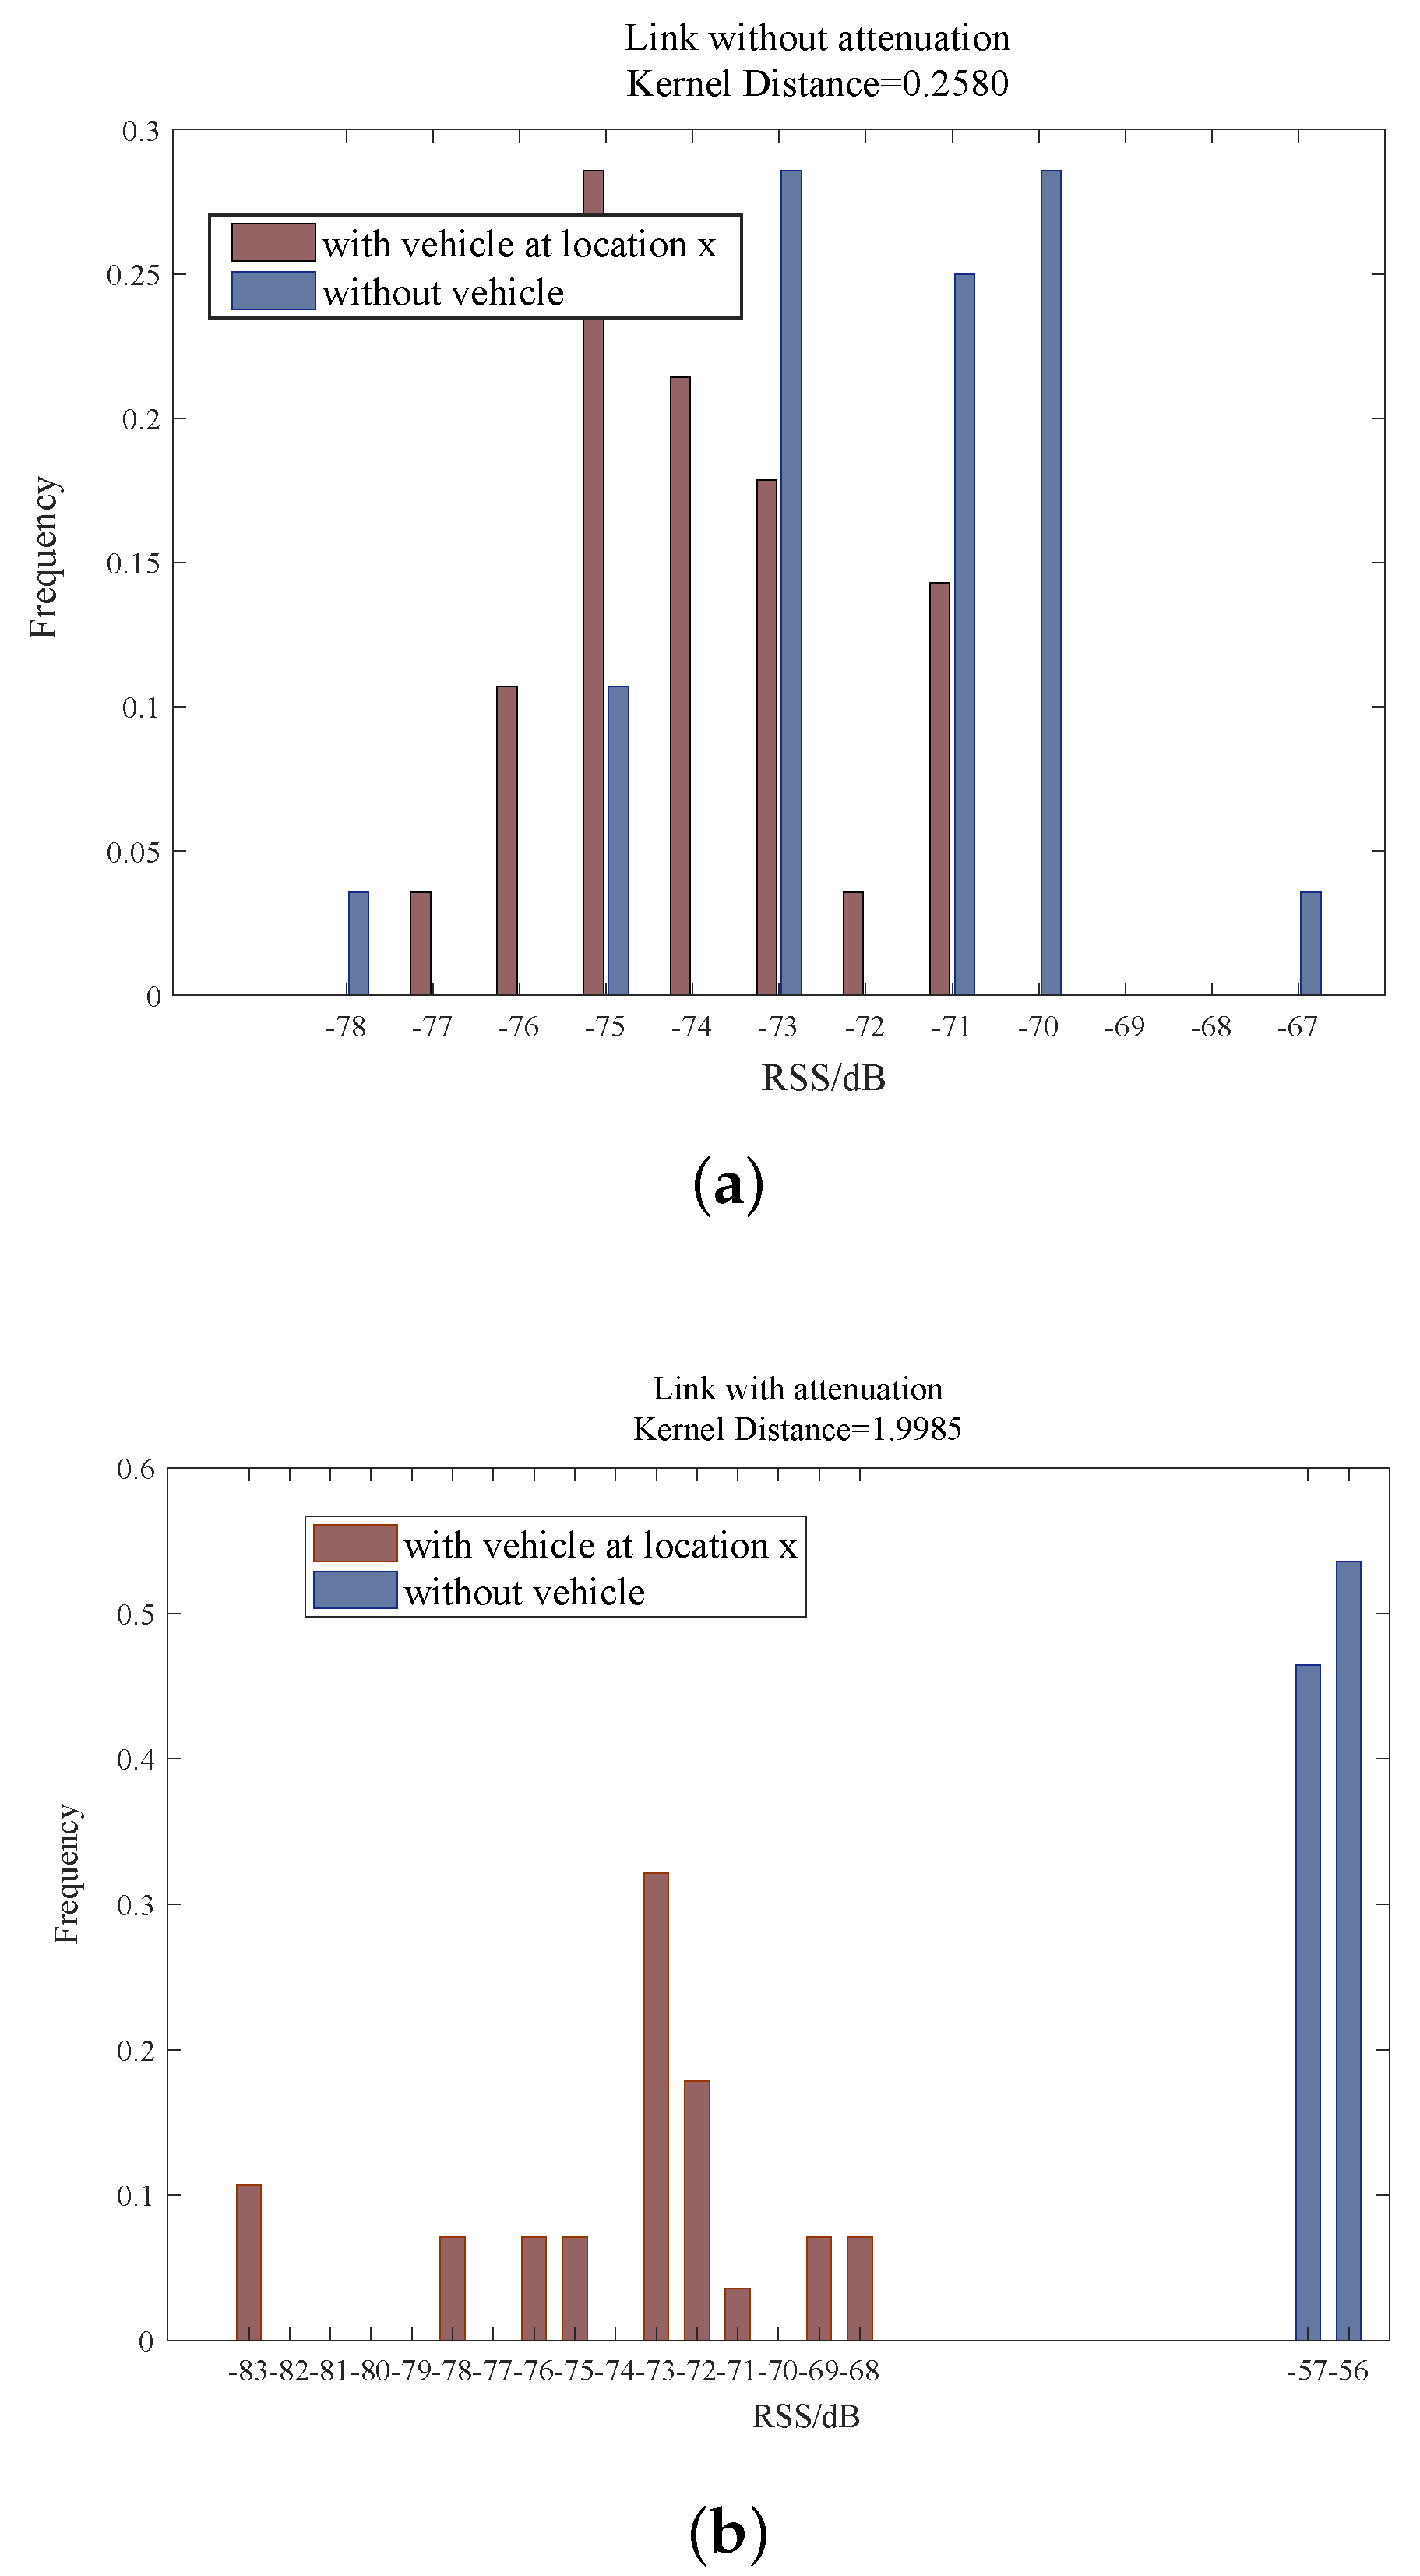
- We propose a screening method for blocked communication links based on the Gaussian kernel distance to differentiate whether a link is obscured or not by the vehicle in a cluttered environment.
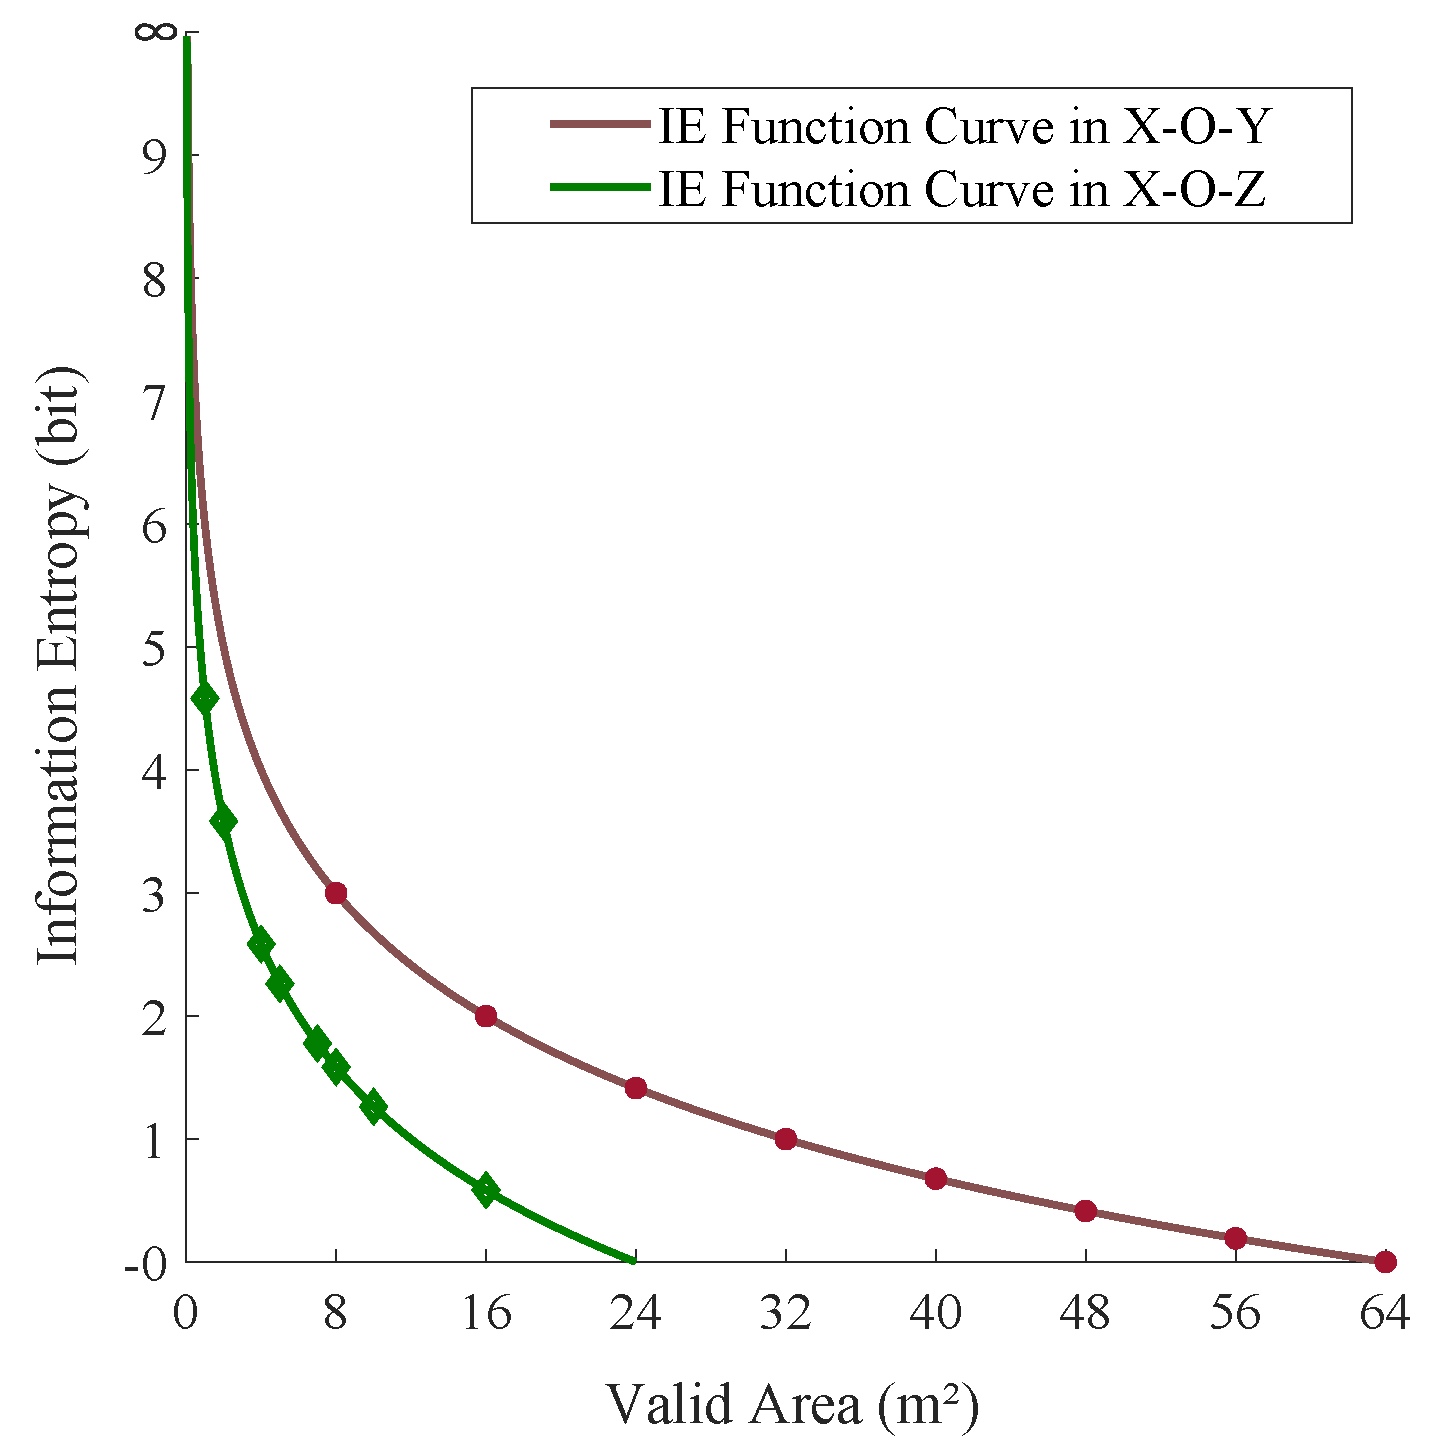
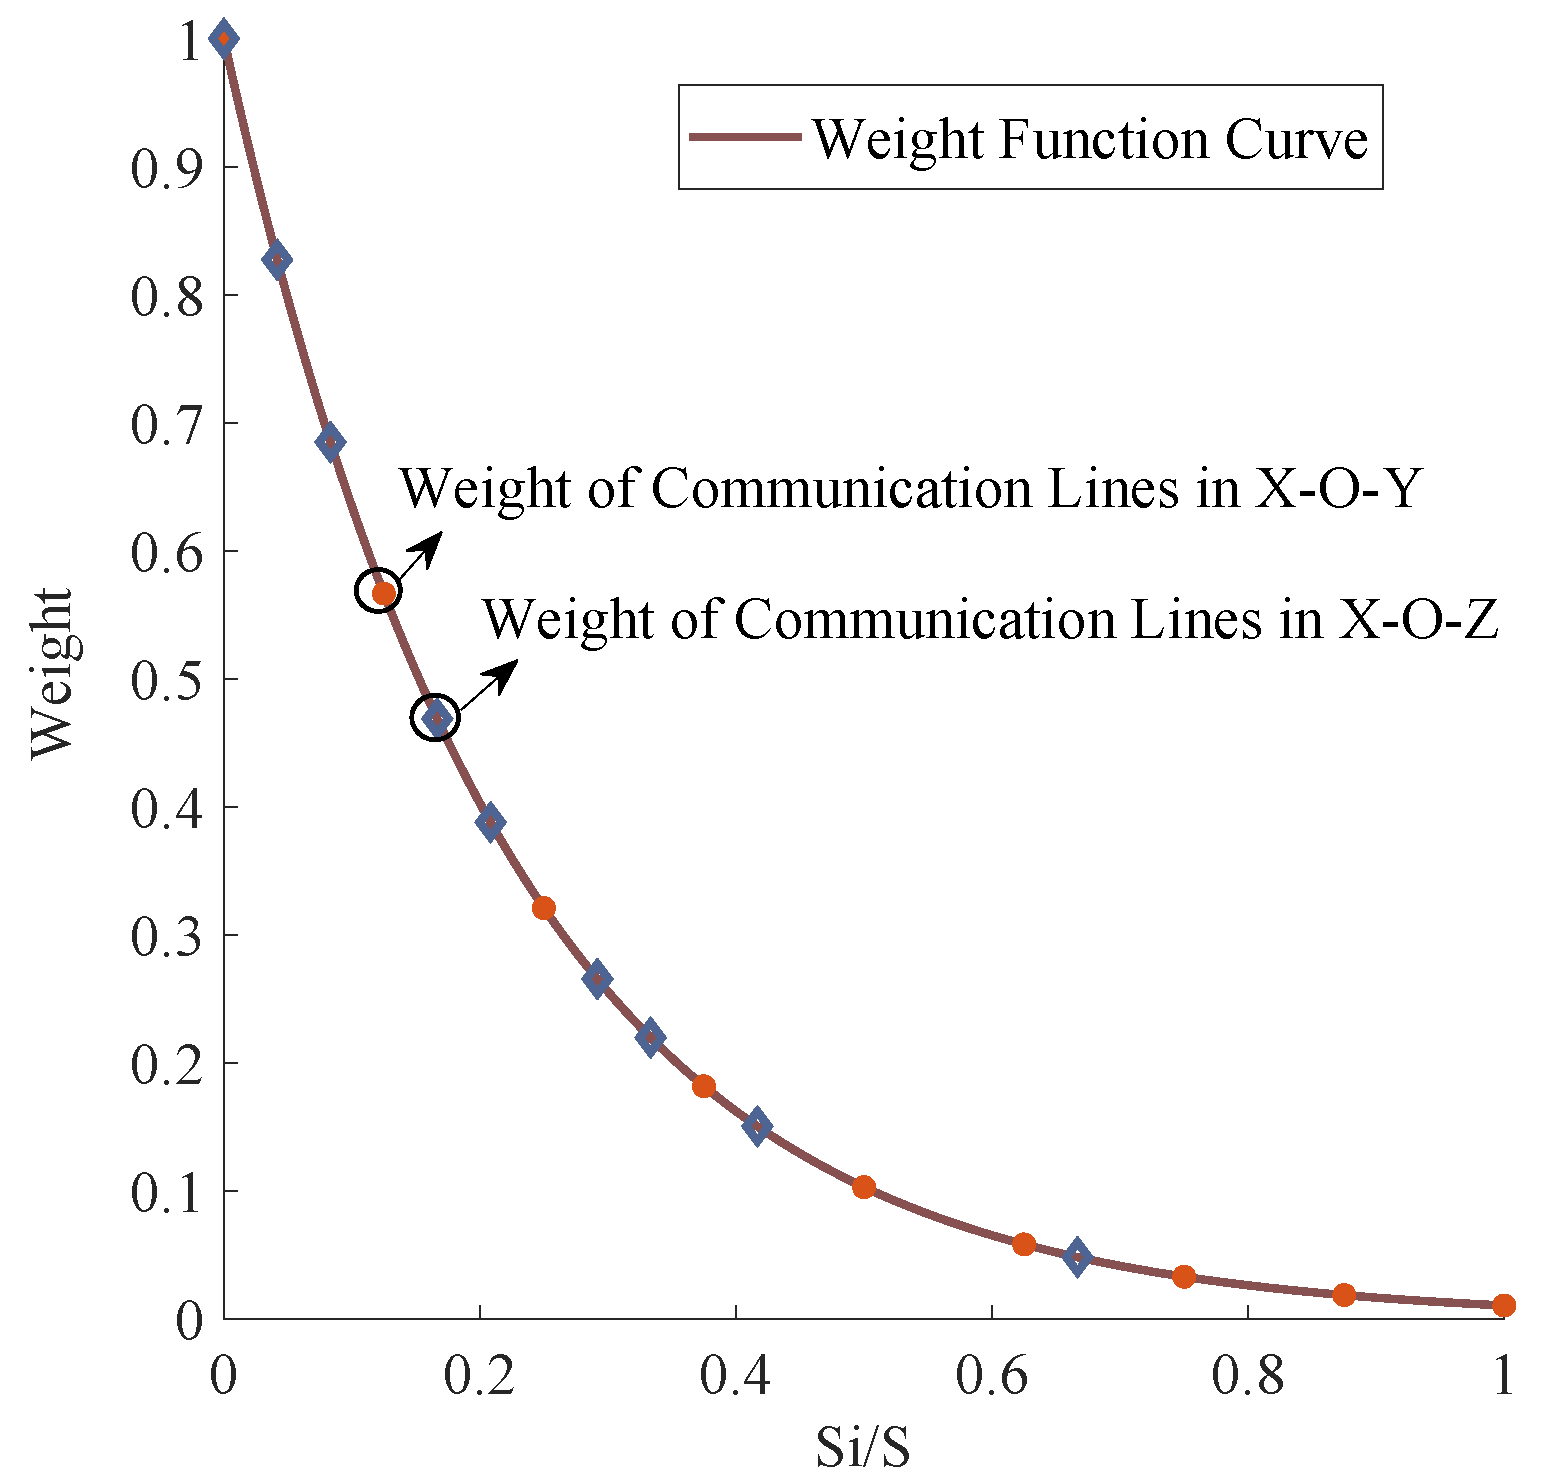
- We propose the use of information entropy (IE) to evaluate the contribution of the obscured links; according to the contribution to the vehicle localization, different weights are assigned to each obscured link.
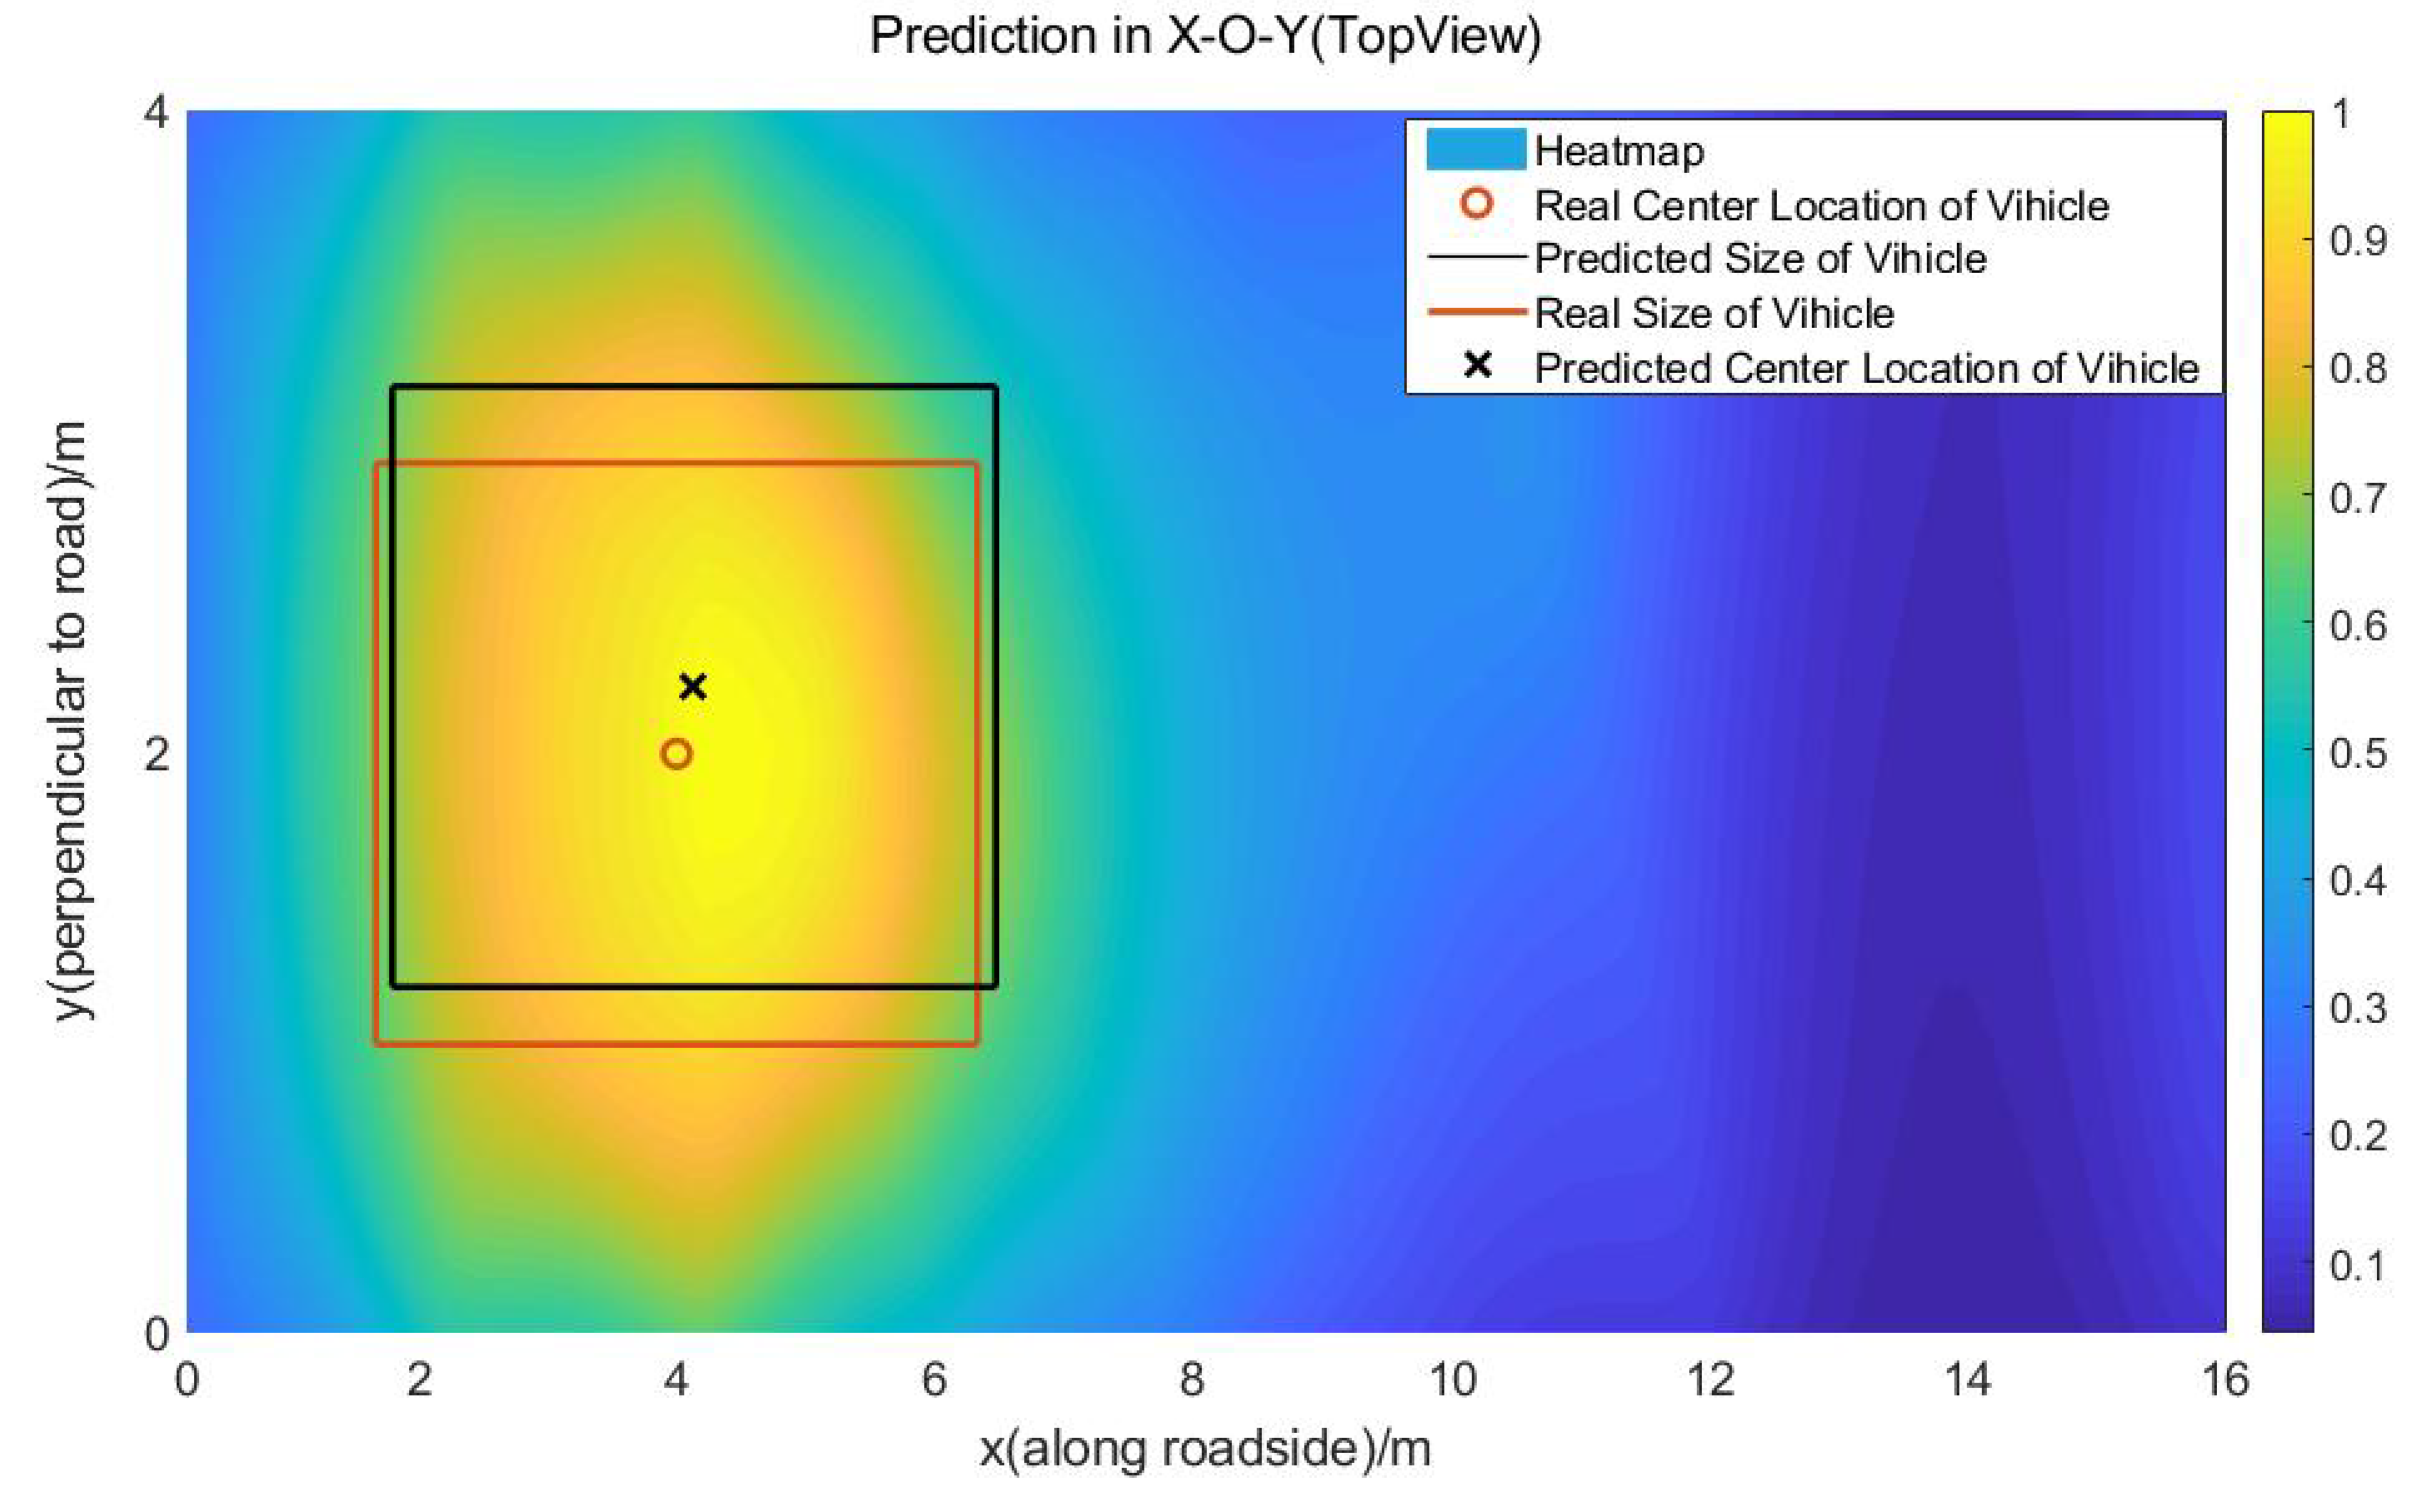
- We propose a combination weight allocation method based on the link weight and voxel spatial covariance to each voxel. Relying on the combination weight of each voxel, we generate a heat map of the monitoring area and estimate the location and the 3D information of the vehicle.
- We evaluate the proposed techniques with extensive experiments and analysis in a real testbed.
3. The Theory of 3D-DFL for Roadside Vehicle
3.1. The Overview of DFL for a Vehicle Based on WSN
3.2. The Voxels Partition and Its 2D Plane Projection
3.3. The Procedure of This Work
- We count the real-time RSS (RT-RSS) values of communication links in a period of time and generate the online-phase RSS histograms as .
- We calculate the kernel distance between the online-phase and offline-phase histograms of each communication link and compare the kernel distances with a threshold ; then, obtain the state (obscured or not obscured) of every communication link, expressed as a matrix S.
- We utilize the information entropy principle to calculate the communication link weight matrix , which is adopted to distinguish the contribution of the different obscured communication links to the 3D-DFL system.
- We divide the monitored area into 3D voxels and project them on the X-O-Y plane and the X-O-Z plane, expressed as and .
- We obtain the voxel weight matrix by multiplying the voxels’ space covariance of the X-O-Y plane, the matrix , the matrix and the voxel matrix in the same way, we can obtain the voxel weight matrix according to the product of the voxels’ space covariance in the X-O-Y plane, the matrix , the matrix and the voxel matrix .
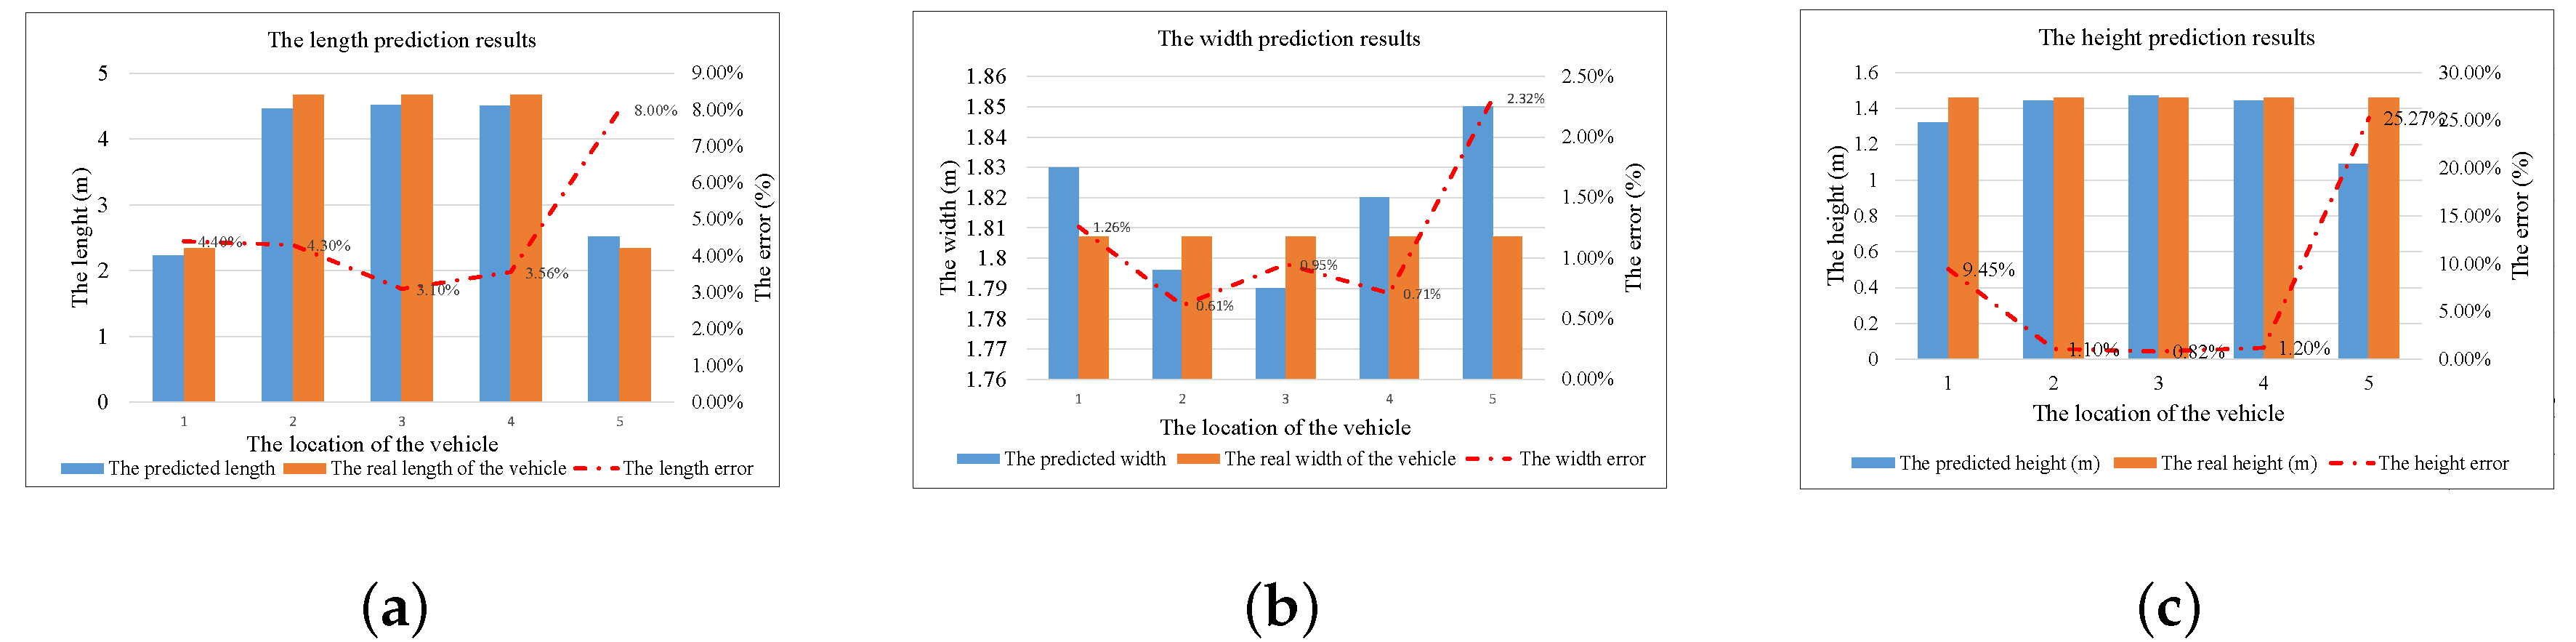
- We estimate the length and the width of the vehicle by taking an appropriate threshold for the heat map contours of the weight matrix ; in the same way, we can obtain the height of the vehicle from the weight matrix .
4. The Selection Method for the Obscured Link
4.1. RSS Characteristics Based on a Statistics Histogram
4.2. The Selecting Method Based on Kernel Distance
5. The Location and Three-Dimensional Estimation of the Vehicle
5.1. The Weight Allocation Method Based on the Information Entropy Principle for the Obscured Links
5.2. The Space Covariance of Voxels
5.3. The Location and the 3D Information of the Vehicle
5.3.1. The Voxel Weight Based on the Link Weight and the Spatial Covariance
5.3.2. The Location and the 3D Information Estimation Based on Contour Threshold
6. Experiments
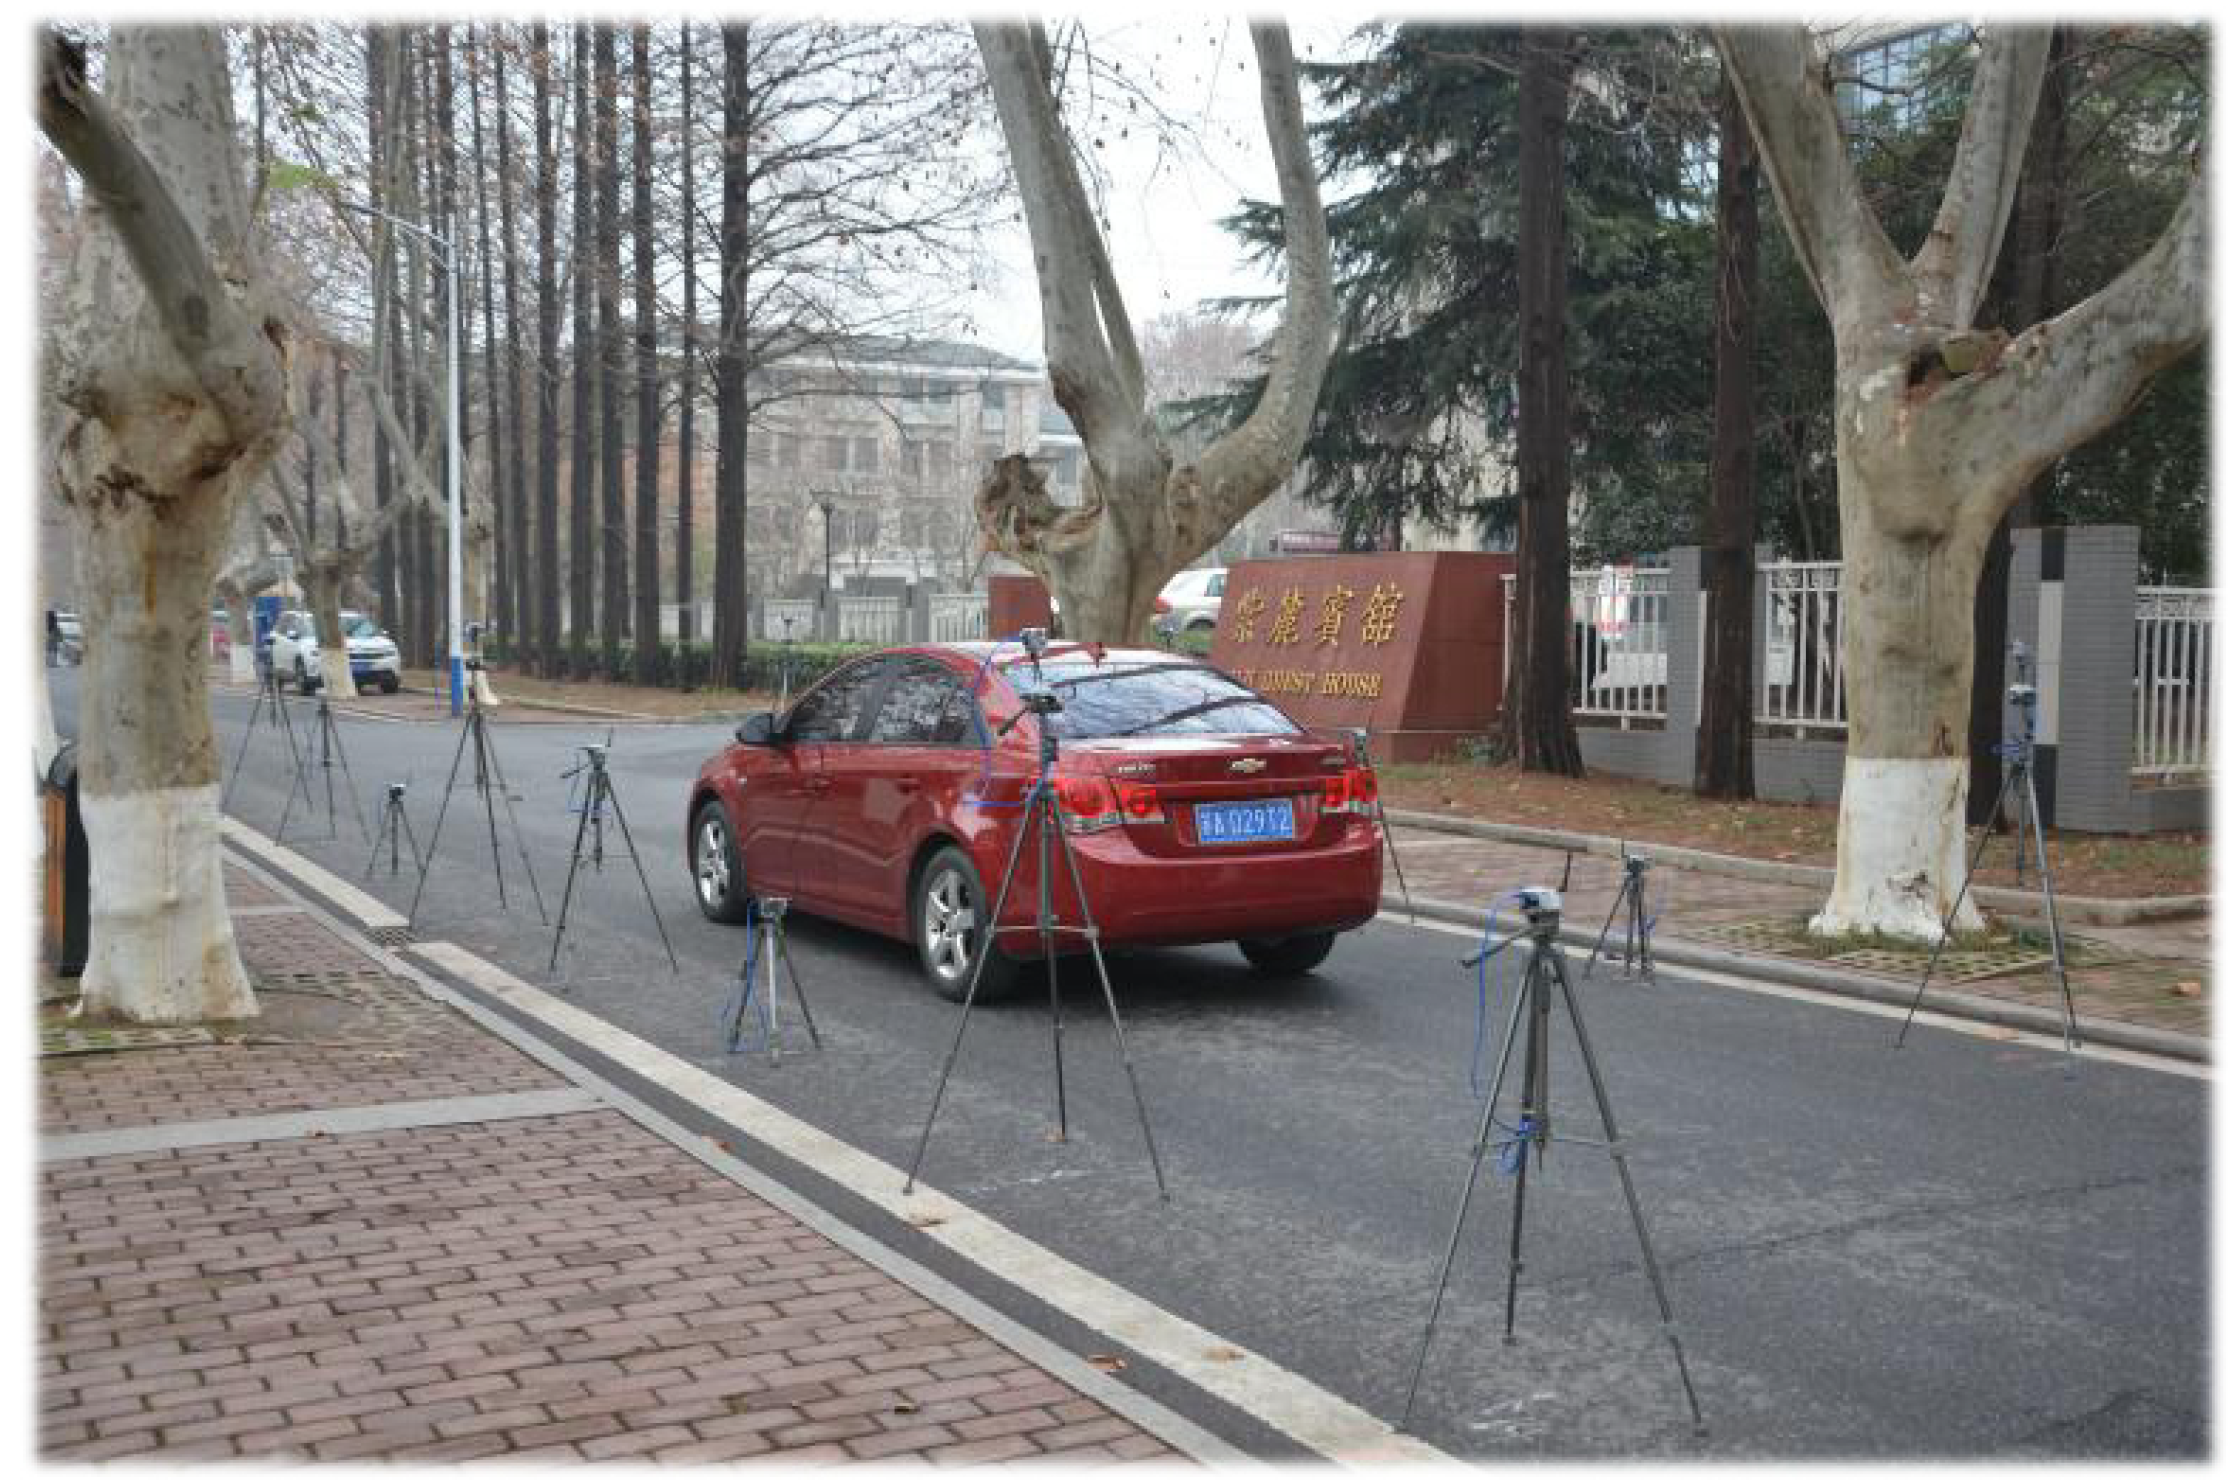
6.1. Experimental Setup
6.2. Results and Discussion
6.3. The Influence of Each Parameter to the Error of the Prediction Results
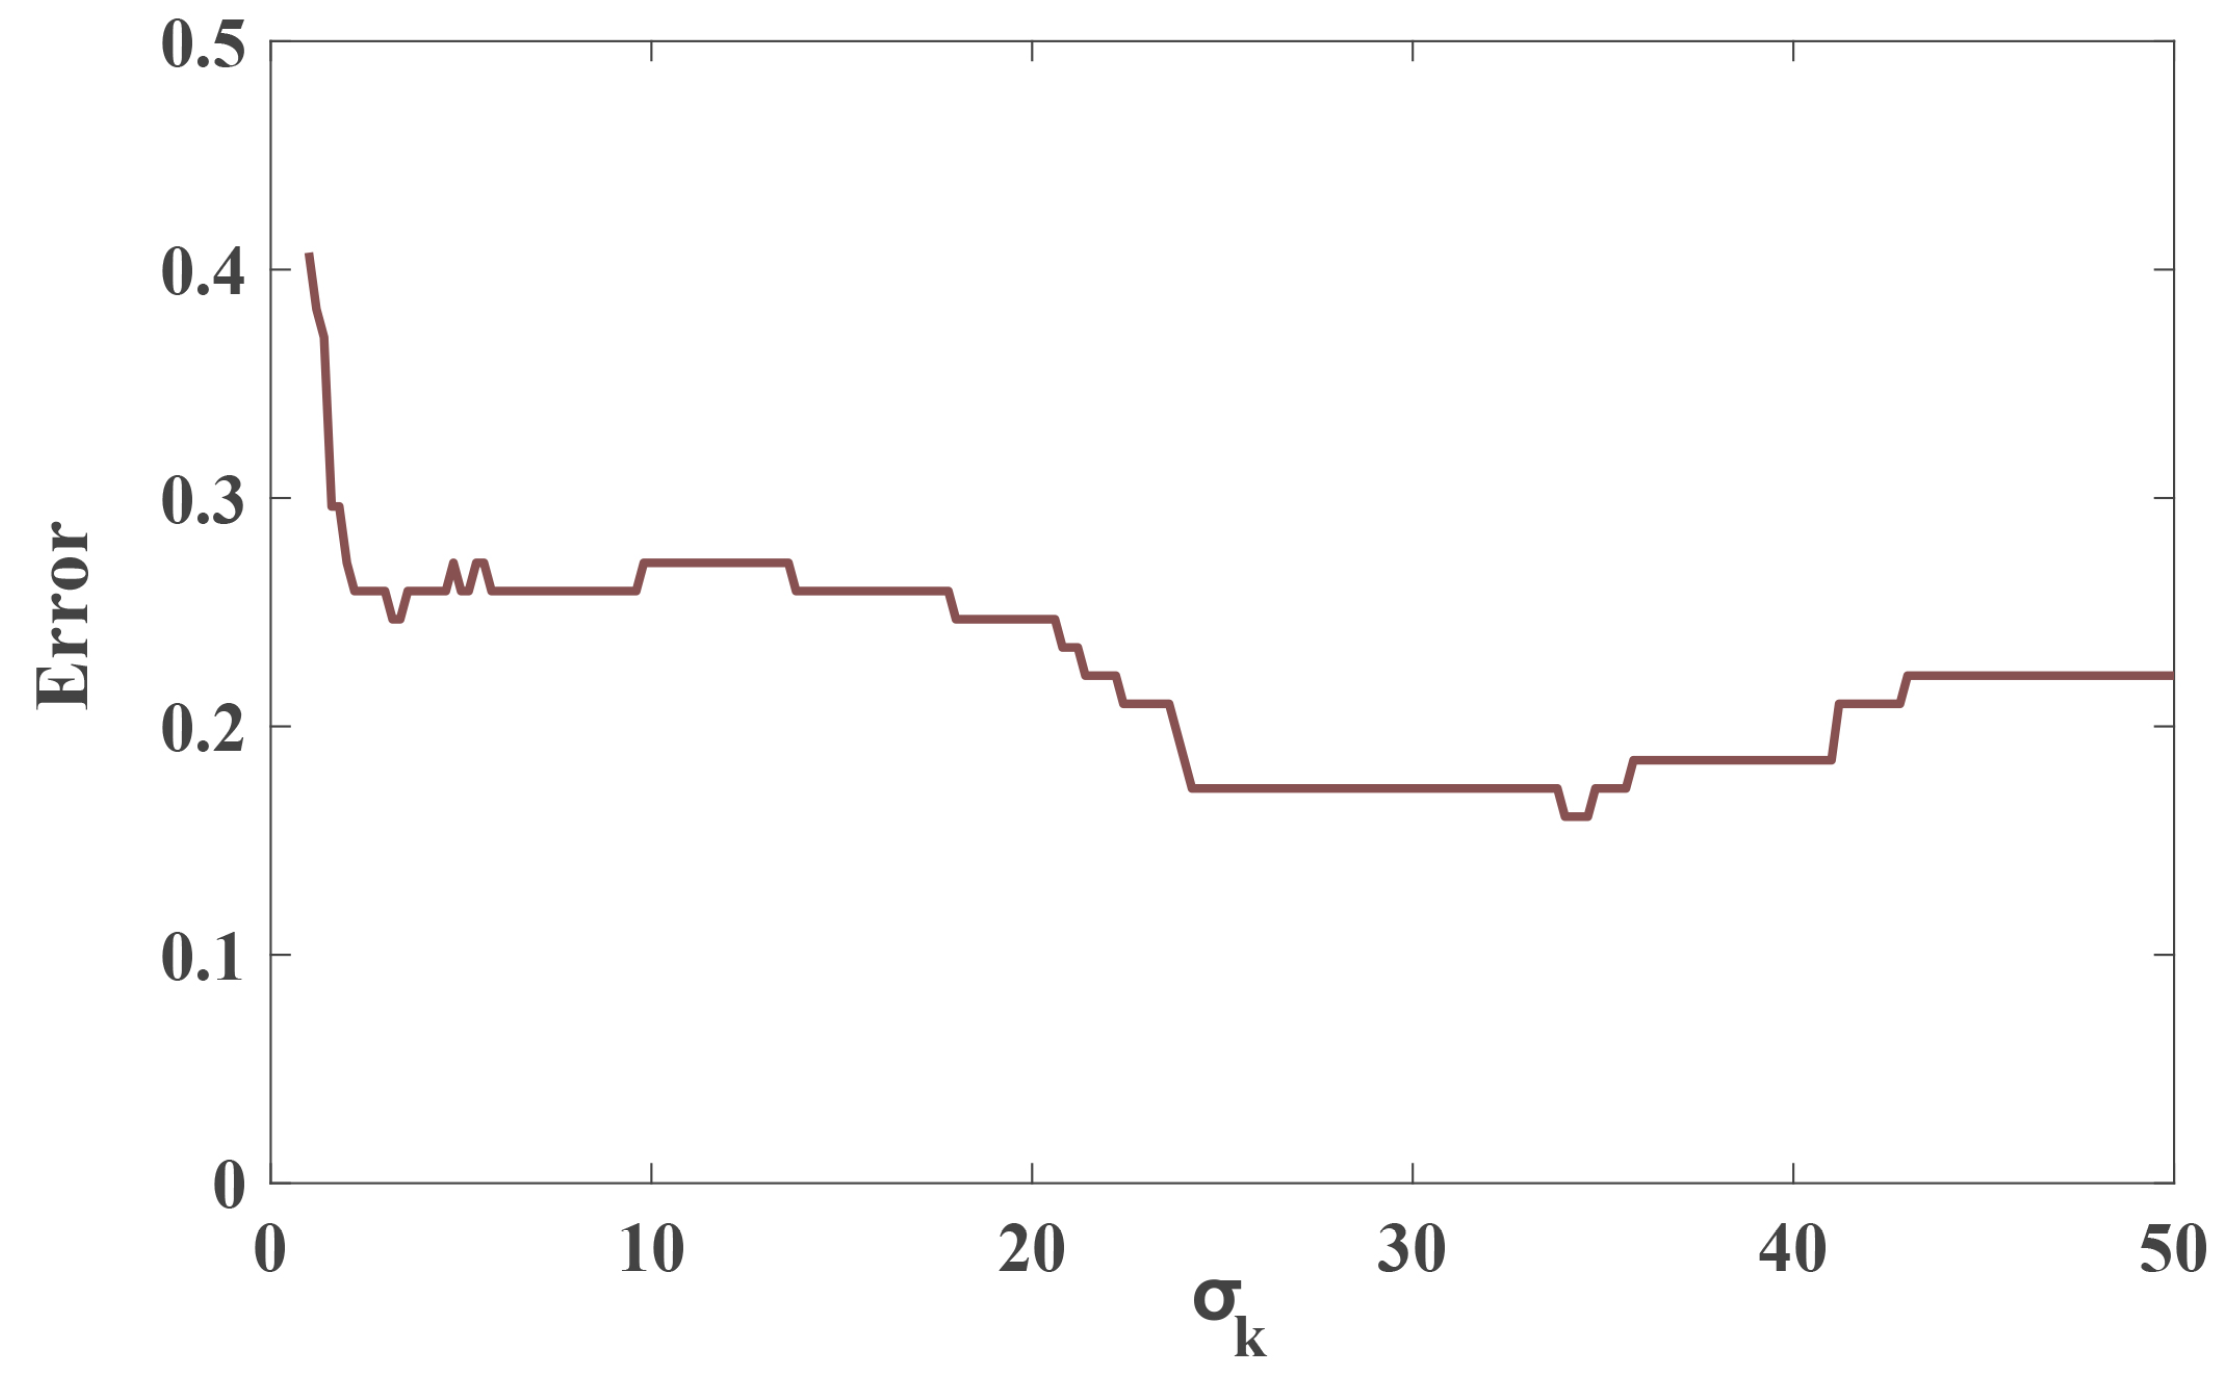
6.3.1. Effect of Gaussian Kernel Width Parameter on Link Screening Results
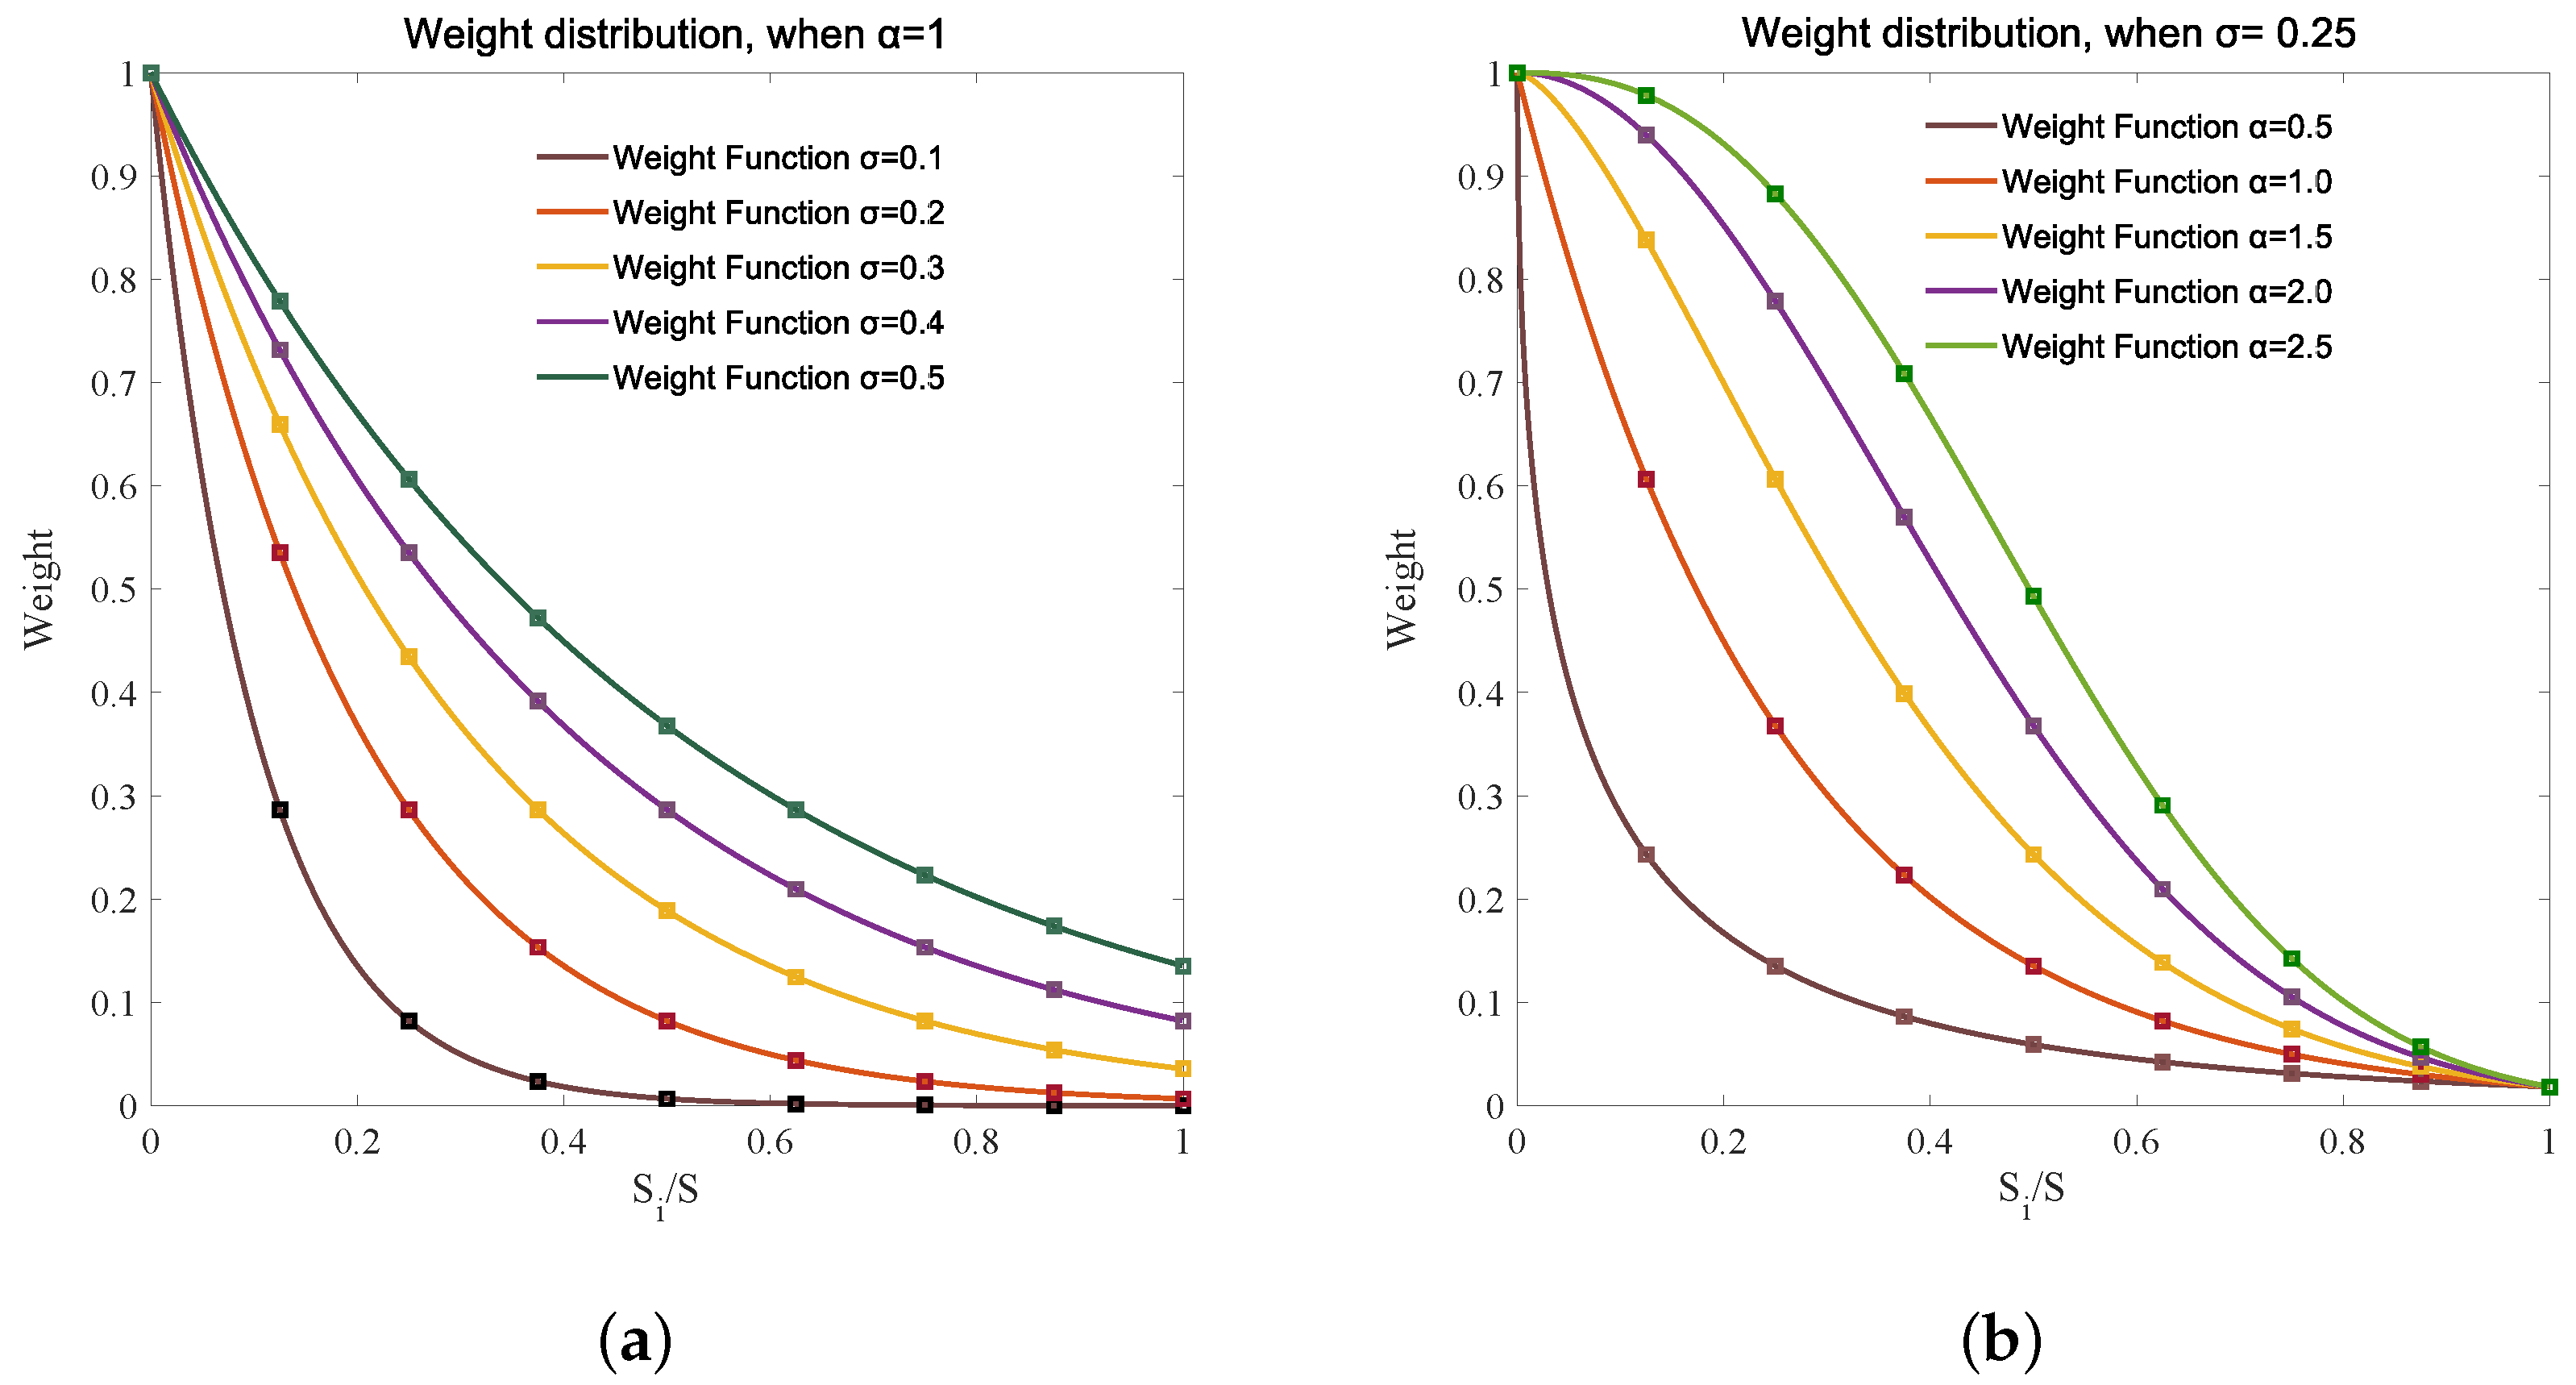
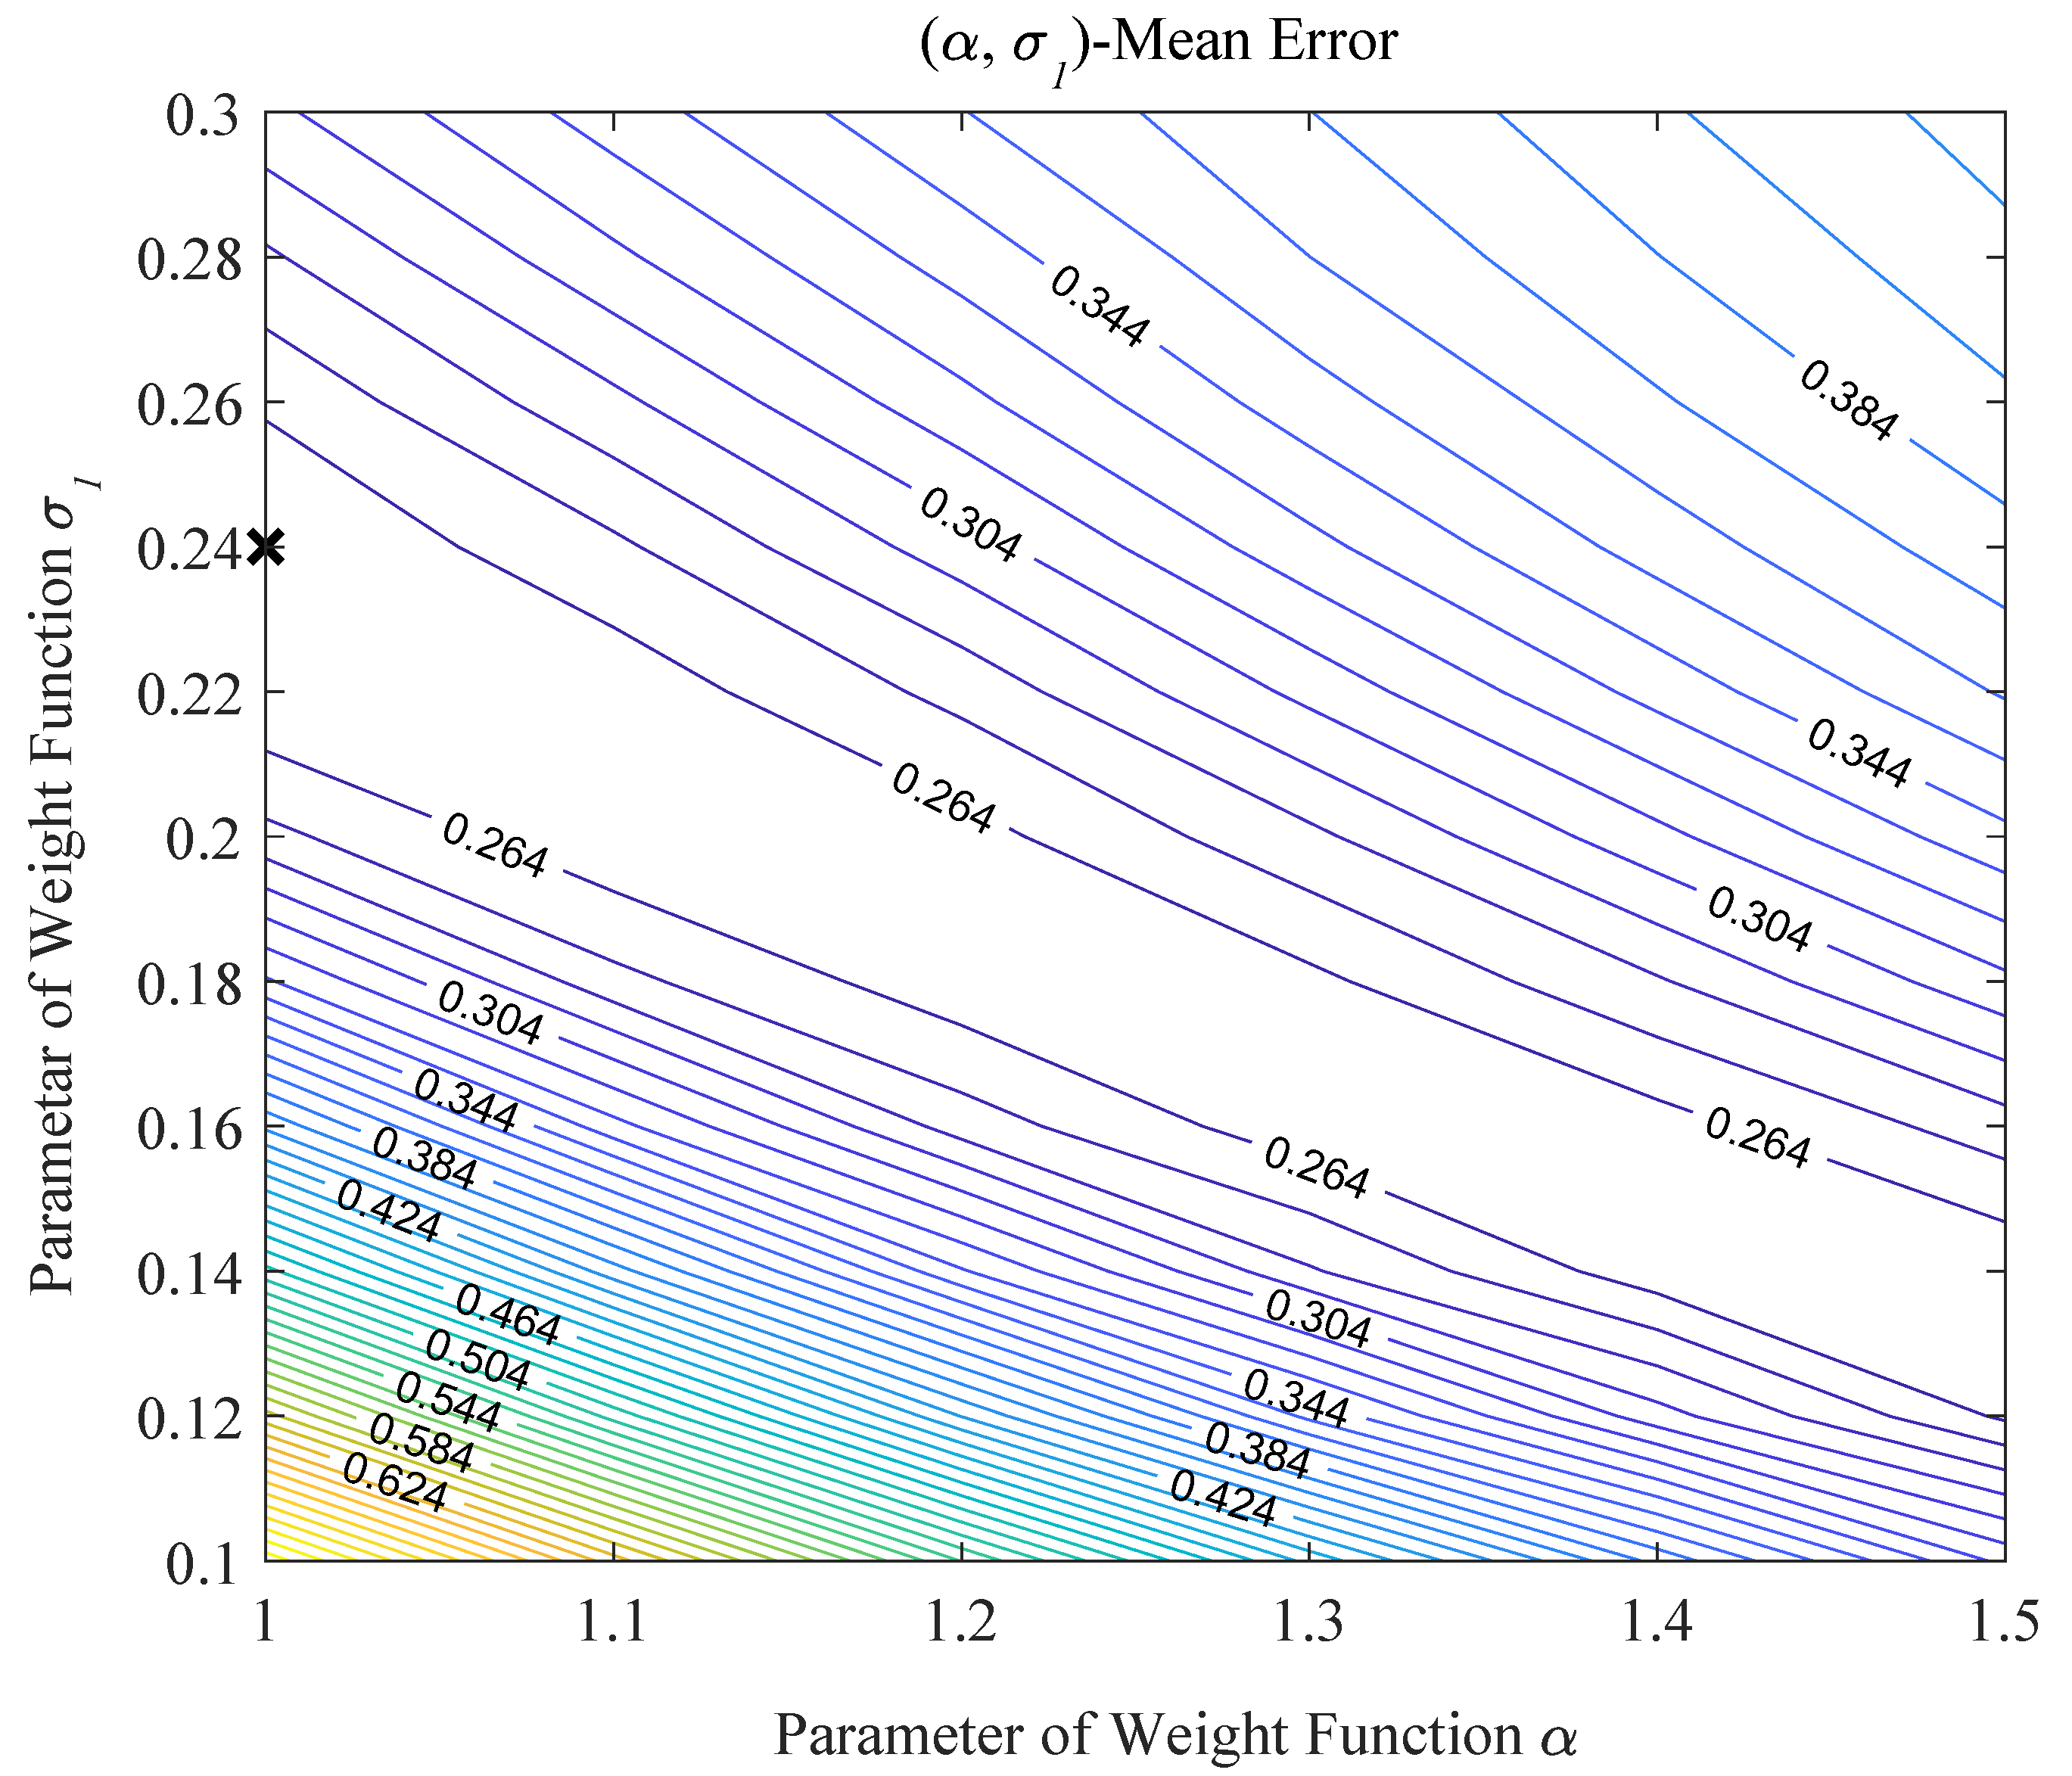
6.3.2. The Influence of and to the Weight Allocation Method Based on the IE Method
6.4. The Influence of the Sensor Network Topology on the Localization Accuracy
7. Conclusions
Author Contributions
Funding
Acknowledgments
Conflicts of Interest
References
- Wilson, J.; Patwari, N. Radio tomographic imaging with wireless networks. IEEE Trans. Mob. Comput. 2010, 9, 621–632. [Google Scholar] [CrossRef] [Green Version]
- Viani, F.; Rocca, P.; Oliveri, G.; Trinchero, D.; Massa, A. Localization, tracking, and imaging of targets in wireless sensor networks: An invited review. Radio Sci. 2011, 46, 8–9. [Google Scholar] [CrossRef]
- Zhao, Y.; Patwari, N.; Phillips, J.M.; Venkatasubramanian, S. Radio tomographic imaging and tracking of stationary and moving people via Kernel Distance. In Proceedings of the 2013 ACM/IEEE International Conference on Information Processing in Sensor Networks (IPSN), Philadelphia, PA, USA, 8–11 April 2013; pp. 229–240. [Google Scholar]
- Zhang, L.; Gao, Q.; Ma, X.; Wang, J.; Yang, T.; Wang, H. DeFi: Robust Training-Free Device-Free Wireless Localization with wiFi. IEEE Trans. Veh. Technol. 2018, 67, 8822–8831. [Google Scholar] [CrossRef]
- Shi, S.; Sigg, S.; Chen, L.; Ji, Y. Accurate Location Tracking From CSI-Based Passive Device-Free Probabilistic Fingerprinting. IEEE Trans. Veh. Technol. 2018, 67, 5217–5230. [Google Scholar] [CrossRef] [Green Version]
- Konings, D.; Alam, F.; Noble, F.; Lai, E.M. SpringLoc: A Device-Free Localization Technique for Indoor Positioning and Tracking Using Adaptive RSSI Spring Relaxation. IEEE Access 2019, 7, 56960–56973. [Google Scholar] [CrossRef]
- Zhang, L.; Wang, H. Device-Free Tracking via Joint Velocity and AOA Estimation With Commodity WiFi. IEEE Sens. J. 2019, 19, 10662–10673. [Google Scholar] [CrossRef]
- Anderson, C.R.; Martin, R.K.; Walker, T.O.; Thomas, R.W. Radio Tomography for Roadside Surveillance. IEEE J. Sel. Top. Signal Process. 2014, 8, 66–69. [Google Scholar] [CrossRef]
- Kassem, N.; Kosba, A.E.; Youssef, M. RF-based vehicle detection and speed estimation. In Proceedings of the 2012 IEEE 75th Vehicular Technology Conference (VTC Spring), Yokohama, Japan, 6–9 May 2012; pp. 1–5. [Google Scholar]
- Wang, J.; Tong, J.; Gao, Q.; Wu, Z.; Bi, S.; Wang, H. Device-Free Vehicle Speed Estimation with WiFi. IEEE Trans. Veh. Technol. 2018, 67, 8205–8214. [Google Scholar] [CrossRef]
- Youssef, M.; Mah, M.; Agrawala, A. Challenges: Device-free passive localization for wireless environments. In Proceedings of the 13th Annual ACM International Conference on Mobile Computing and Networking, Montreal, QC, Canada, 9–14 September 2007; pp. 222–229. [Google Scholar]
- Moussa, M.; Youssef, M. Smart devices for smart environments: Device-free passive detection in real environments. In Proceedings of the 2009 IEEE International Conference on Pervasive Computing and Communications, Galveston, TX, USA, 9–13 March 2009; pp. 1–6. [Google Scholar]
- Wilson, J.; Patwari, N. See-through walls: Motion tracking using variance-based radio tomography networks. IEEE Trans. Mob. Comput. 2011, 10, 612–621. [Google Scholar] [CrossRef]
- Bocca, M.; Kaltiokallio, O.; Patwari, N. Radio tomographic imaging for ambient assisted living. In Proceedings of the 2013 ACM/IEEE International Conference on Information Processing in Sensor Networks (IPSN), Philadelphia, PA, USA, 8–11 April 2013; pp. 108–130. [Google Scholar]
- Wang, J.; Gao, Q.; Wang, H.; Cheng, P.; Xin, K. Device-free localization with multidimensional wireless link information. IEEE Trans. Veh. Technol. 2015, 64, 356–366. [Google Scholar] [CrossRef]
- Wilson, J.; Patwari, N. A fade-level skew-laplace signal strength model for device-free localization with wireless networks. IEEE Trans. Mob. Comput. 2012, 11, 947–958. [Google Scholar] [CrossRef] [Green Version]
- Guo, Y.; Huang, K.; Jiang, N.; Guo, X.; Li, Y.; Wang, G. An exponential-Rayleigh model for RSS-based device-free localization and tracking. IEEE Trans. Mob. Comput. 2015, 14, 484–494. [Google Scholar] [CrossRef]
- Kaltiokallio, O.; Bocca, M.; Patwari, N. A fade level-based spatial model for radio tomographic imaging. IEEE Trans. Mob. Comput. 2014, 13, 1159–1172. [Google Scholar]
- Wang, J.; Gao, Q.; Pan, M.; Zhang, X.; Yu, Y.; Wang, H. Toward Accurate Device-Free Wireless Localization With a Saddle Surface Model. IEEE Trans. Veh. Technol. 2016, 65, 6665–6677. [Google Scholar] [CrossRef]
- Mager, B.; Patwari, N.; Bocca, M. Fall detection using RF sensor networks. In Proceedings of the 2013 IEEE 24th Annual International Symposium on Personal, Indoor, and Mobile Radio Communications (PIMRC), London, UK, 8–11 September 2013; pp. 3472–3476. [Google Scholar]
- Phillips, J.M.; Venkatasubramanian, S. A gentle introduction to the kernel distance. arXiv 2011, arXiv:1103.1625. [Google Scholar]
- Nuez, J.A.; Cincotta, P.M.; Wachlin, F.C. Information entropy. Celest. Mech. Dyn. Astron. 1996, 64, 43–53. [Google Scholar] [CrossRef]
- Kaltiokallio, O.; Bocca, M.; Patwari, N. Enhancing the accuracy of radio tomographic imaging using channel diversity. In Proceedings of the 2012 IEEE 9th International Conference on Mobile Ad-Hoc and Sensor Systems (MASS 2012), Las Vegas, NV, USA, 8–11 October 2012; pp. 254–262. [Google Scholar]


| Parameter | Value | Description |
|---|---|---|
| 30 | Gaussian kernel width | |
| 1 | Customized parameter in the IE method | |
| 0.24 | Customized parameter in the IE method | |
| 1 | Variance of each voxel in the covariance model | |
| 0.9 | Space constant of the covariance model |
| ID | Real Coordinates of the Vehicle (m) | Predicted Coordinates of the Vehicle (m) | RMSE (m) |
|---|---|---|---|
| 1 | (0, 2) | (1.80, 2.27) | 1.820 |
| 2 | (4, 2) | (3.94, 2.24) | 0.247 |
| 3 | (8, 2) | (7.99, 2.25) | 0.250 |
| 4 | (12, 2) | (11.89, 2.23) | 0.255 |
| 5 | (16, 2) | (14.57, 2.33) | 1.468 |
| Average | – | – | 0.808 |
© 2020 by the authors. Licensee MDPI, Basel, Switzerland. This article is an open access article distributed under the terms and conditions of the Creative Commons Attribution (CC BY) license (http://creativecommons.org/licenses/by/4.0/).
Share and Cite
Wang, M.; Yang, J.; Huang, B.; Yang, Y.; Xu, Y. Three-Dimensional Device-Free Localization for Vehicle. Sensors 2020, 20, 3775. https://doi.org/10.3390/s20133775
Wang M, Yang J, Huang B, Yang Y, Xu Y. Three-Dimensional Device-Free Localization for Vehicle. Sensors. 2020; 20(13):3775. https://doi.org/10.3390/s20133775
Chicago/Turabian StyleWang, Manyi, Jiaxing Yang, Binghua Huang, Yuan Yang, and Yadong Xu. 2020. "Three-Dimensional Device-Free Localization for Vehicle" Sensors 20, no. 13: 3775. https://doi.org/10.3390/s20133775