Novel Potentiometric 2,6-Dichlorophenolindo-phenolate (DCPIP) Membrane-Based Sensors: Assessment of Their Input in the Determination of Total Phenolics and Ascorbic Acid in Beverages


 ,
,  , and
, and
Abstract
:1. Introduction
2. Materials and Methods
2.1. Equipment
2.2. Reagents and Chemicals
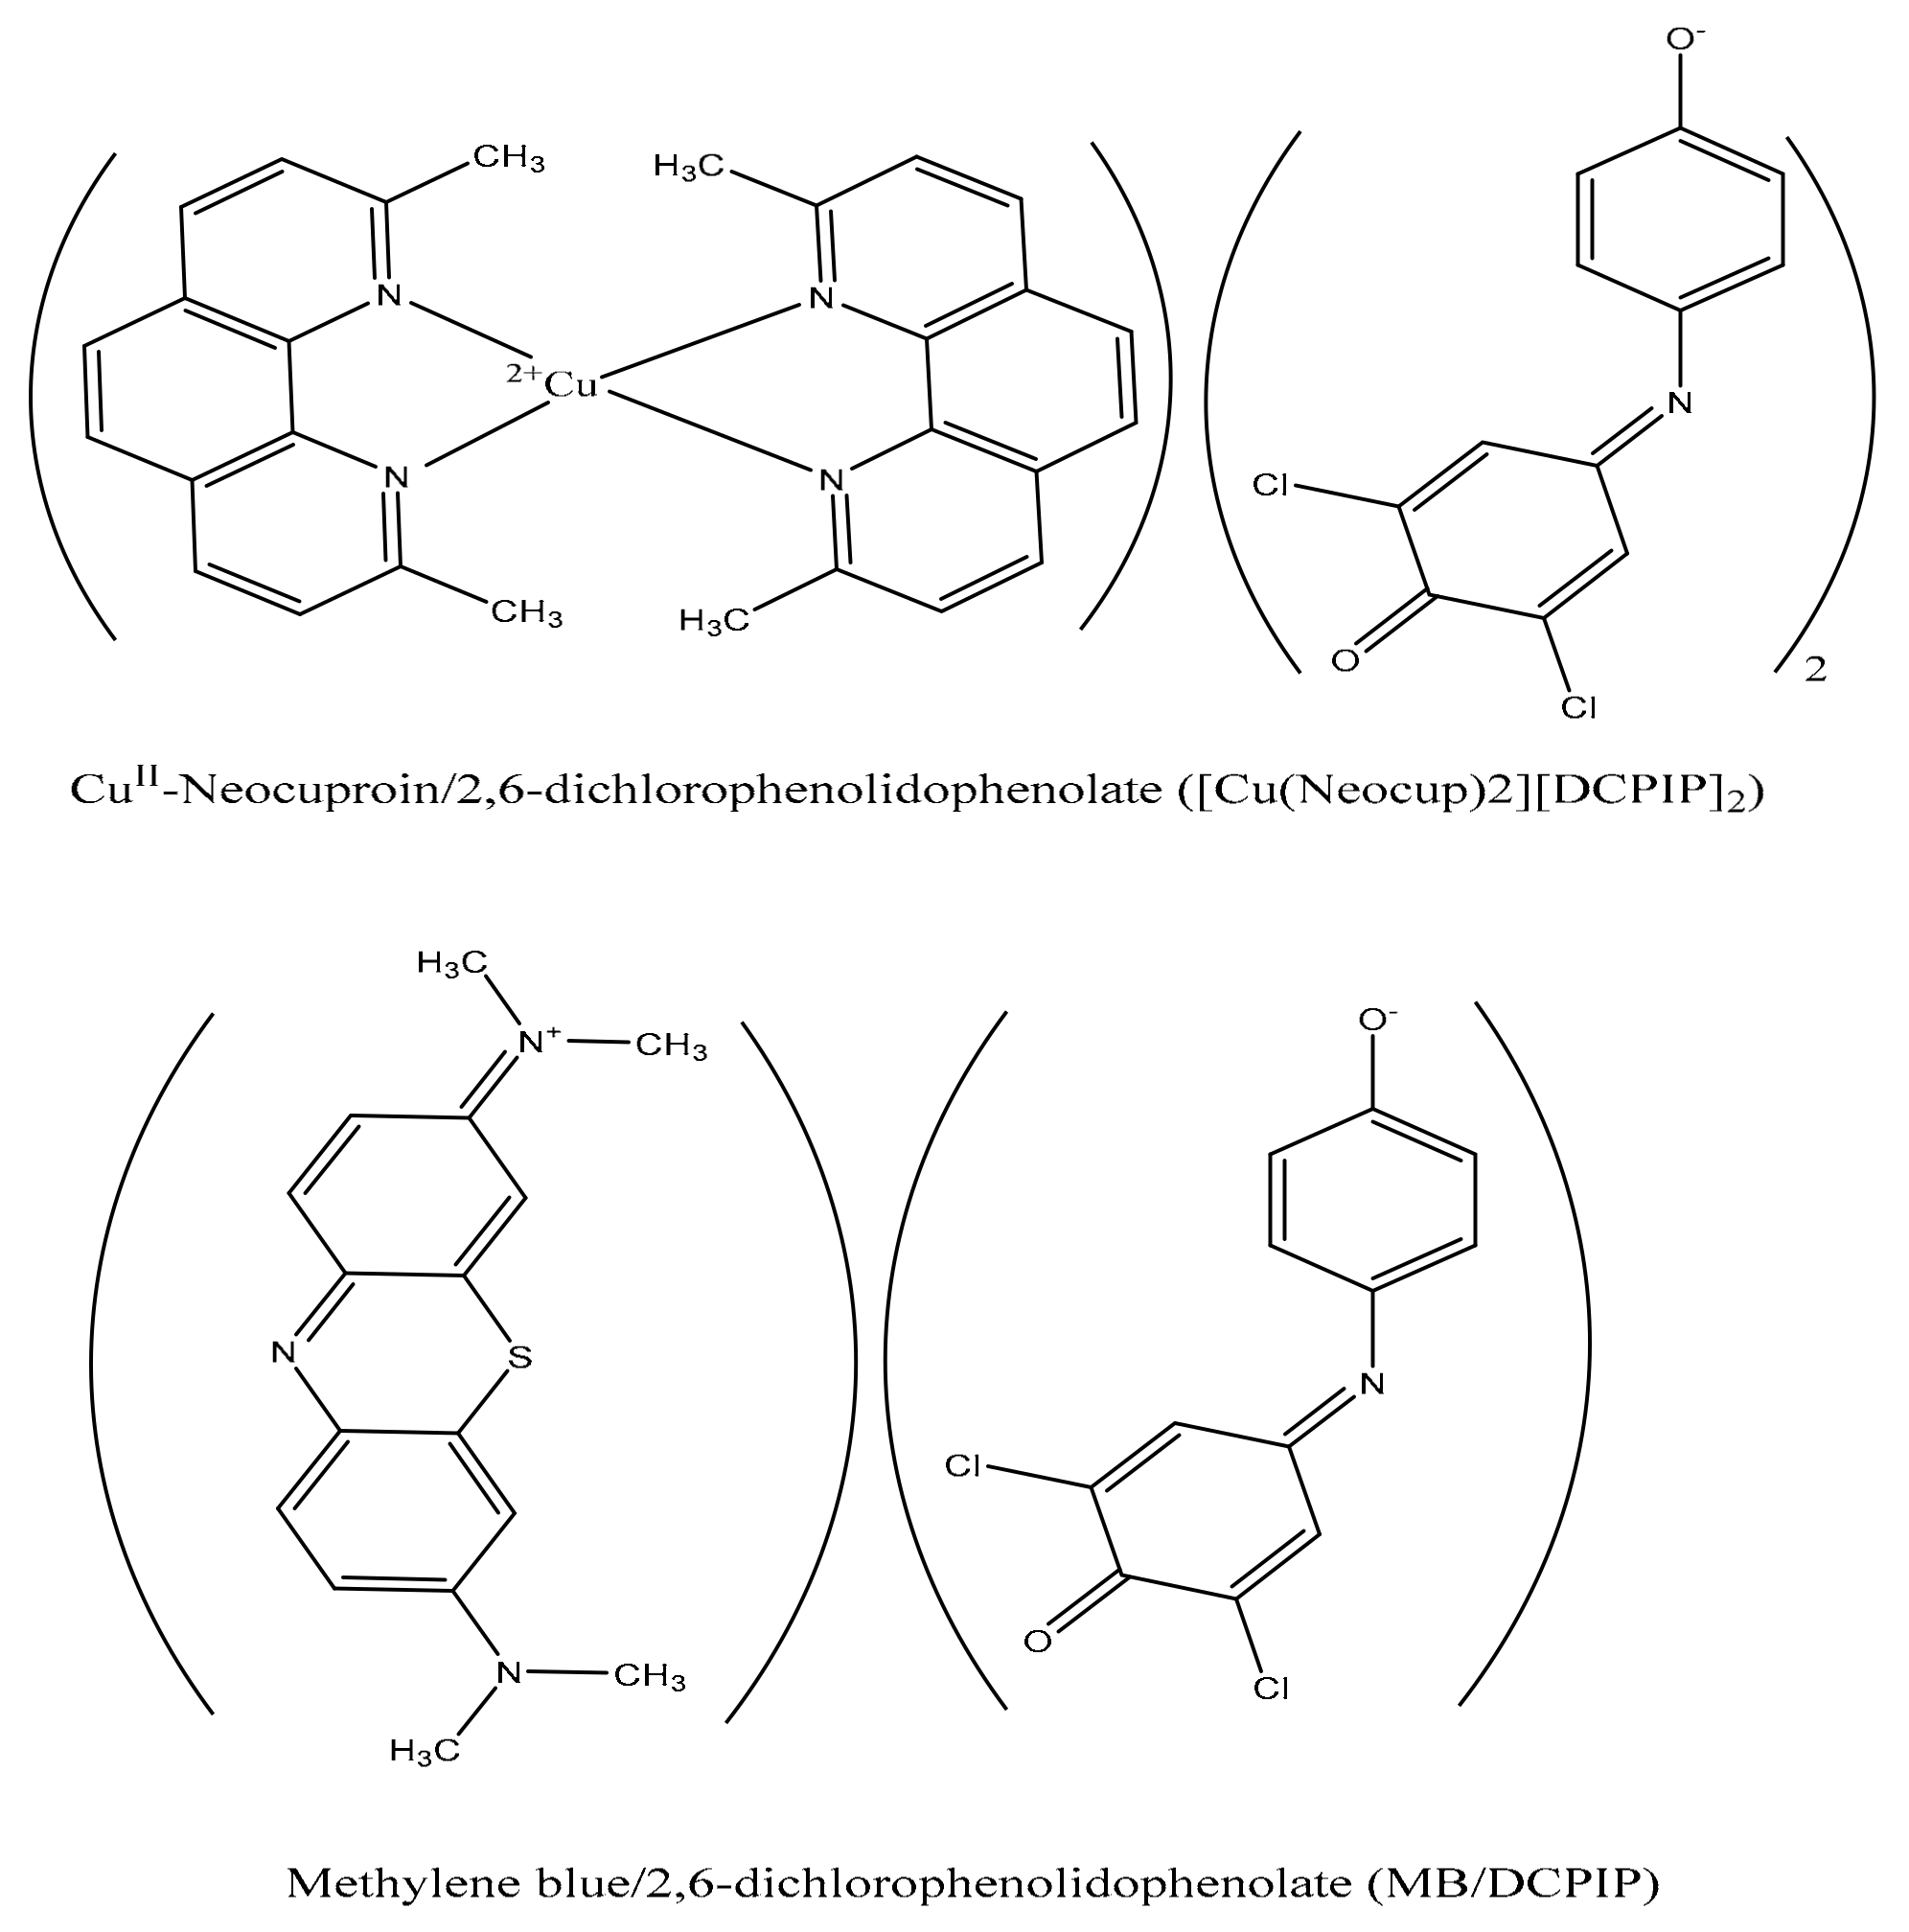
2.3. Membrane Preparation and Sensor Construction
2.4. Direct Potentiometric Measurements
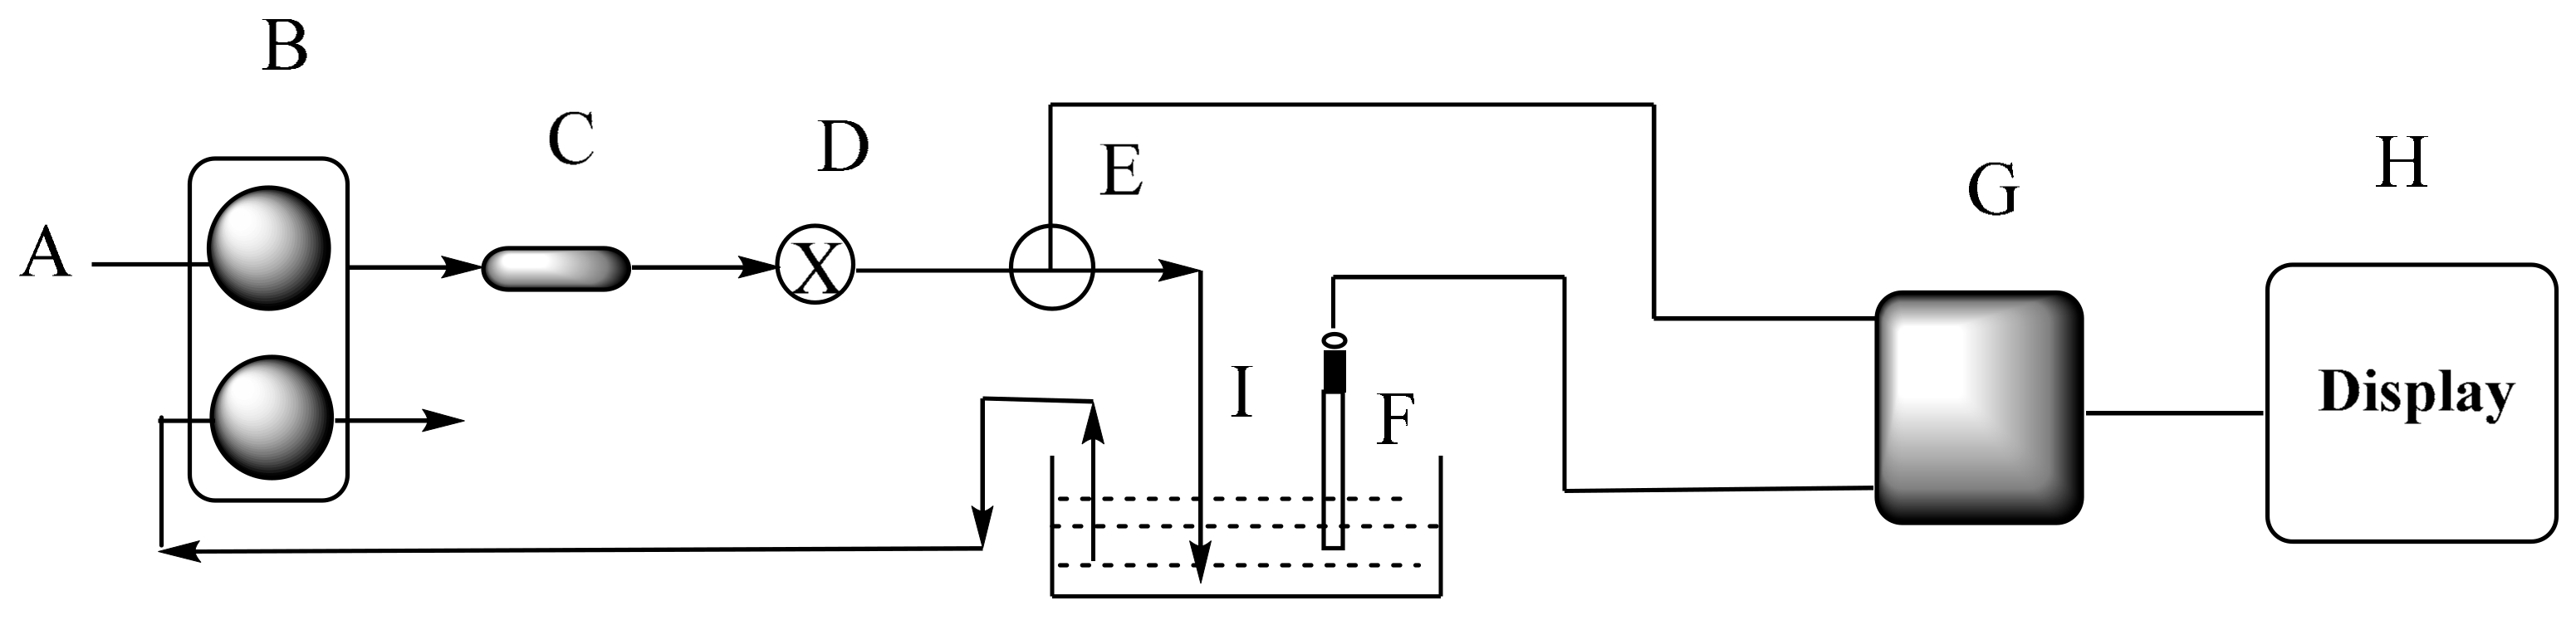
2.5. Flow Injection Setup
2.6. Potentiometric Determination of Phenlic Antioxidants
2.7. Total Antioxidant Capacity Assay in Beverages
3. Results and Discussion
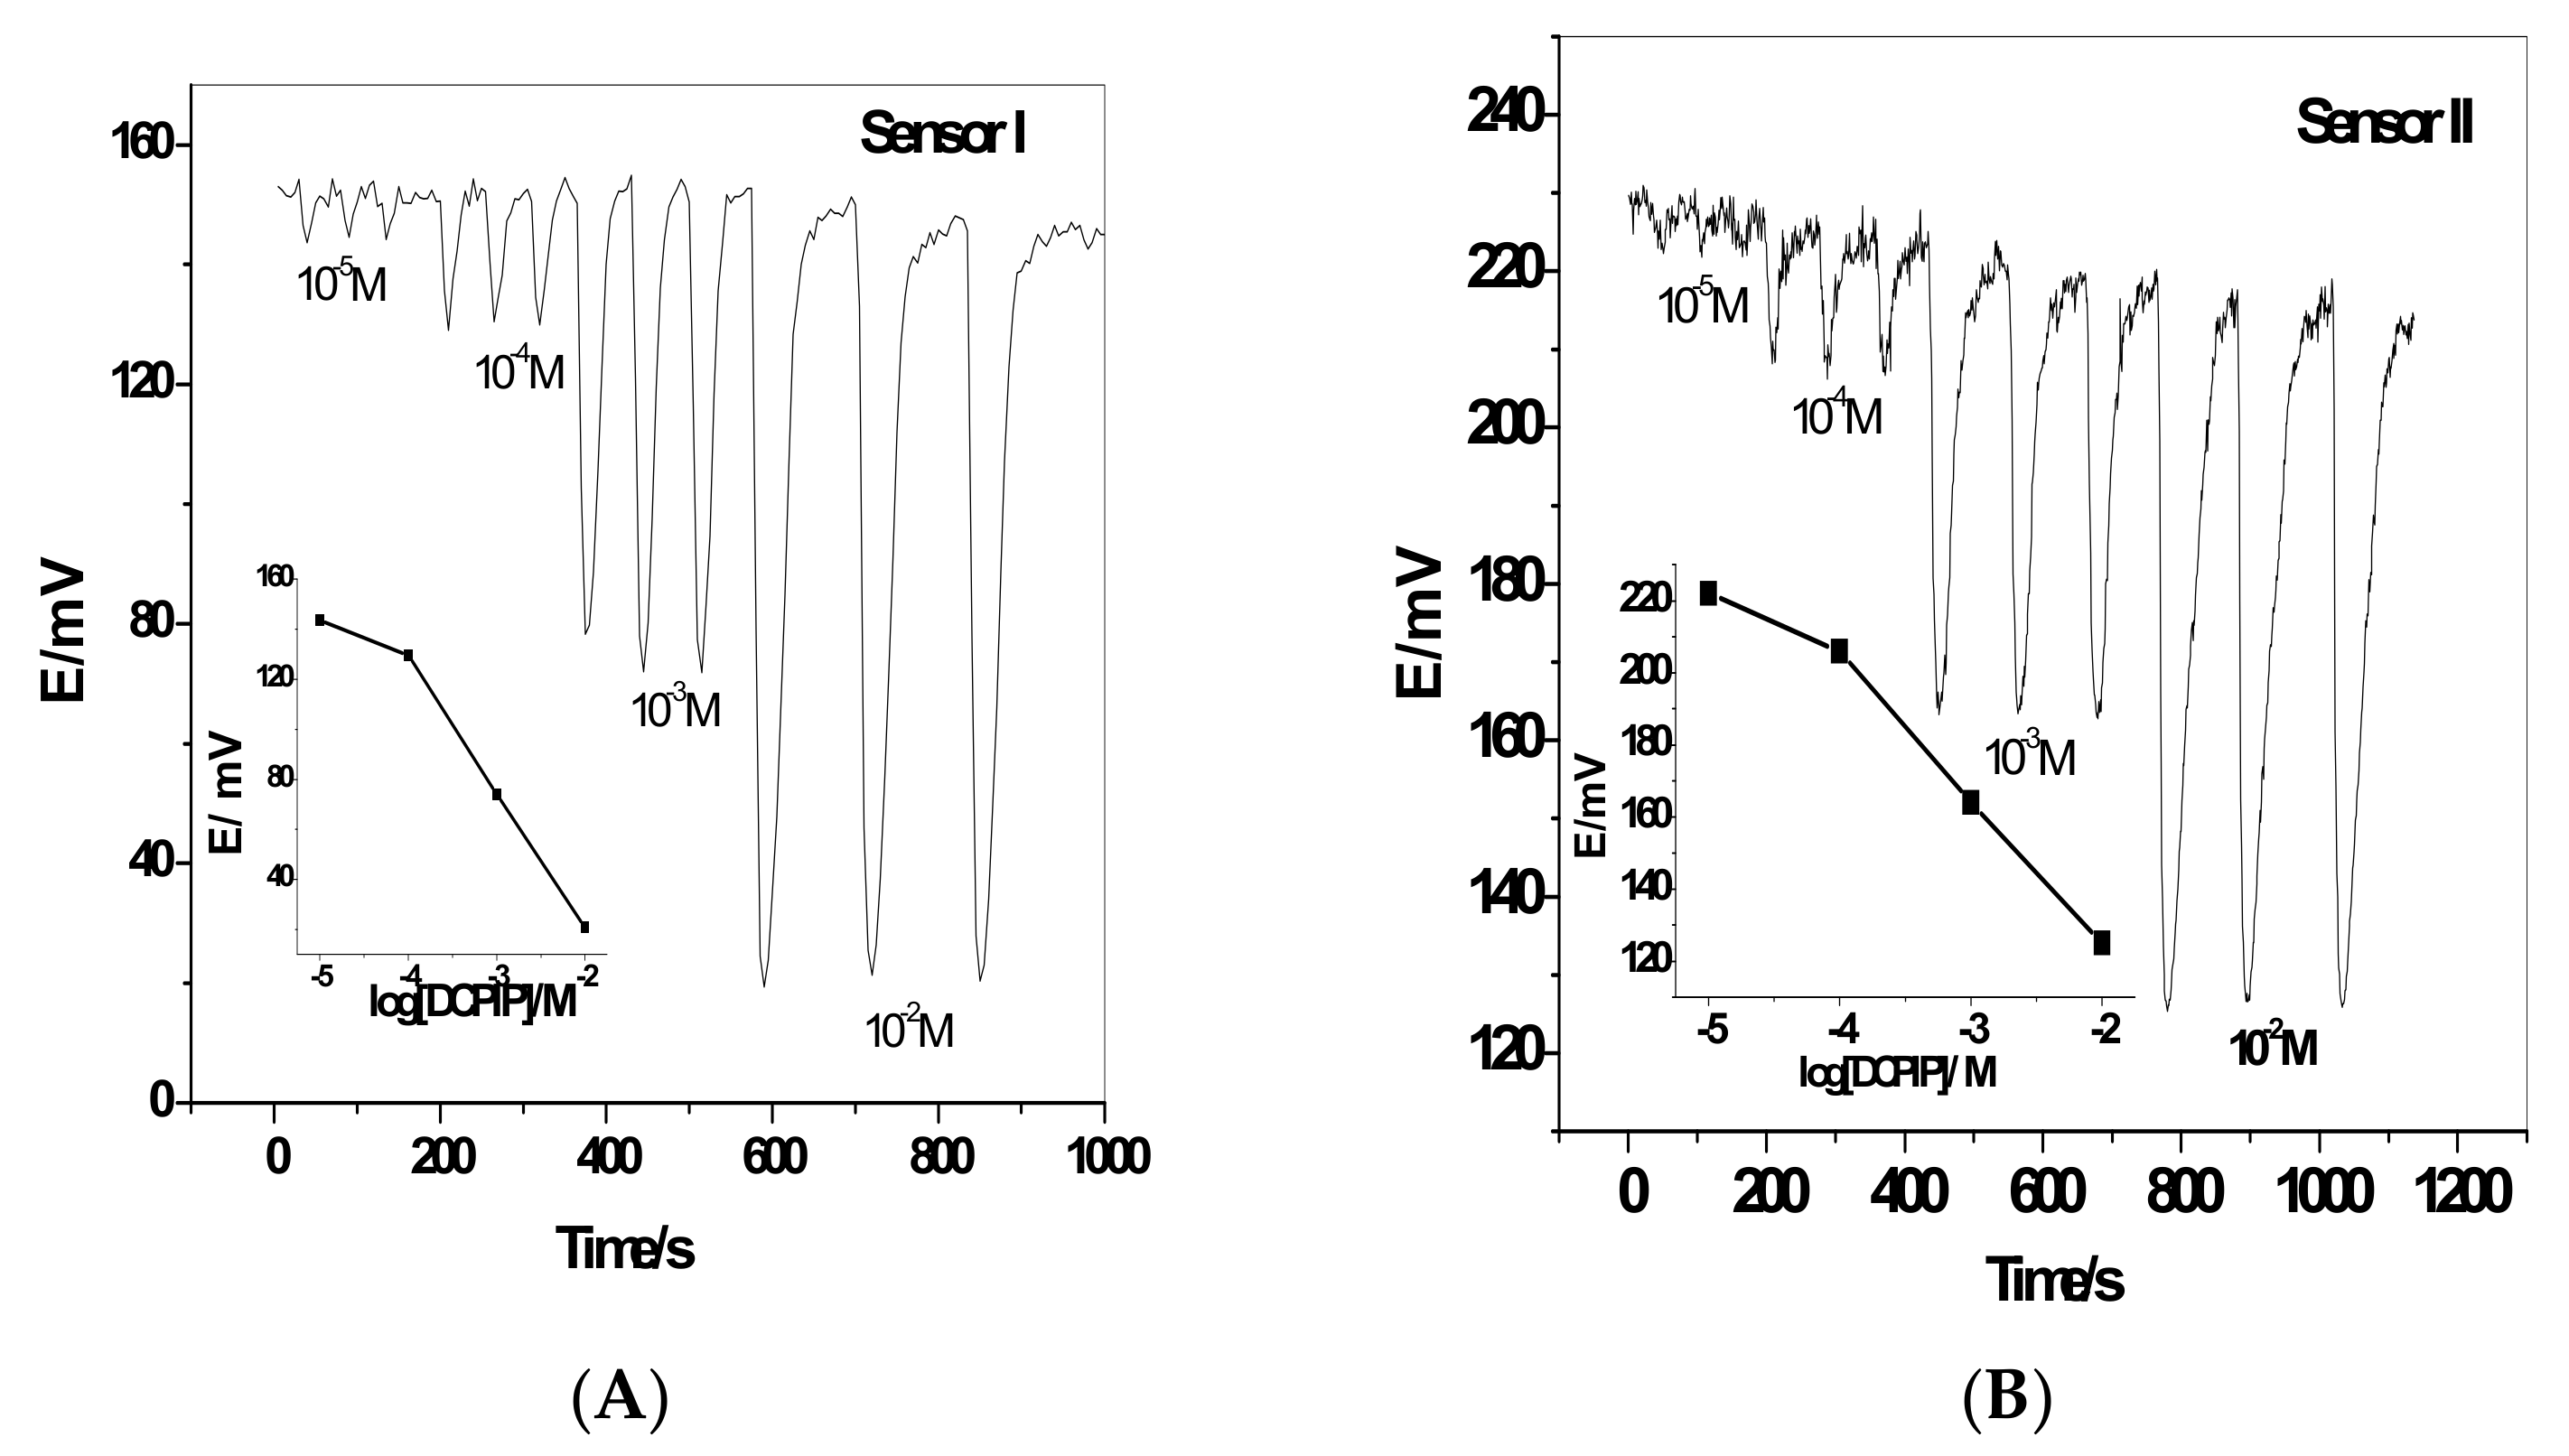
3.1. Performance Characteristics of the Sensors
3.2. Method Robustness and Ruggedness
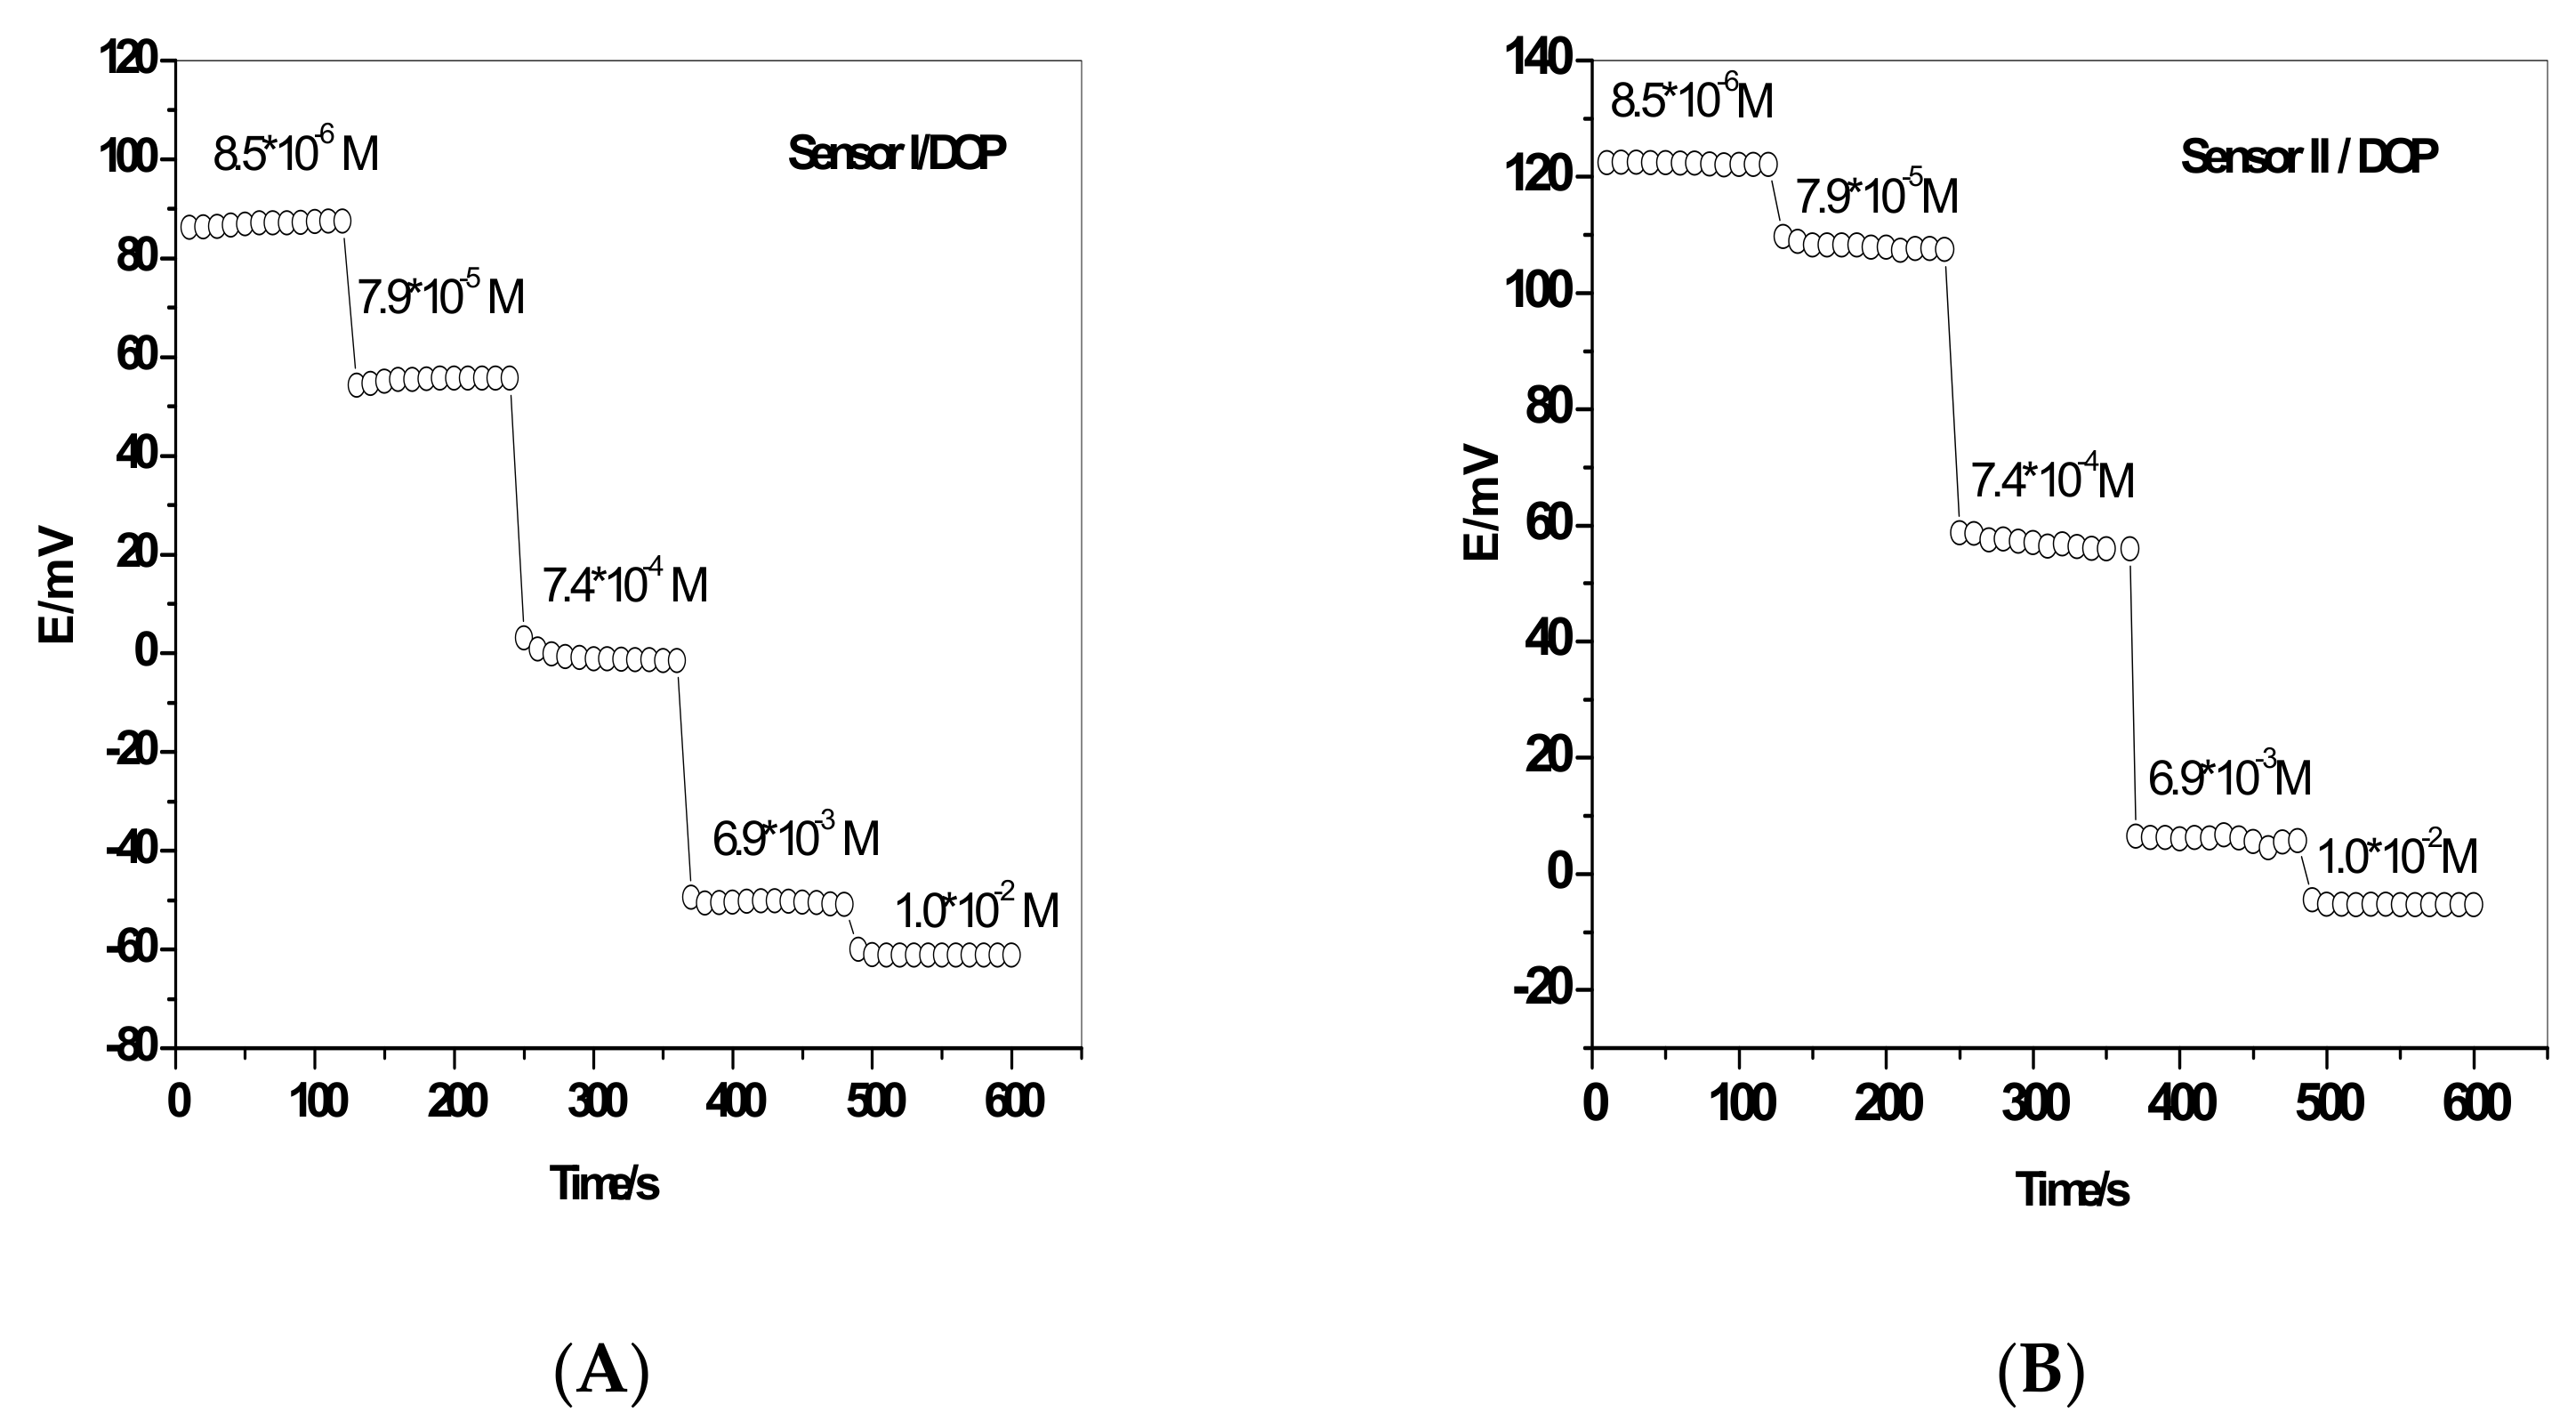
3.3. Potentiometric Determination of Phenolic Antioxidant Compounds

3.4. Analytical Applications
4. Conclusions
Author Contributions
Funding
Conflicts of Interest
References
- Gülçin, I. Antioxidant activity of food constituents: An overview. Arch. Toxicol. 2012, 86, 345–391. [Google Scholar] [CrossRef] [PubMed]
- Halliwell, B.; Gutteridge, J.M. Free Radicals in Biology and Medicine; Oxford University Press: Boston, MA, USA, 2015. [Google Scholar]
- Ames, B.N.; Shigenaga, M.K.; Hagen, T.M. Oxidants, antioxidants, and the degenerative diseases of aging. Proc. Natl. Acad. Sci. USA 1993, 90, 7915–7922. [Google Scholar] [CrossRef] [PubMed]
- Pietta, P.G. Flavonoids as antioxidants. J. Nat. Prod. 2000, 63, 1035–1042. [Google Scholar] [CrossRef]
- Stutts, K.J.; Wightman, R.M. Electrocatalysis of ascorbate oxidation with electrosynthesized, surface-bound mediators. Anal. Chem. 1983, 55, 1576–1579. [Google Scholar] [CrossRef]
- Huang, D.; Ou, B.; Prior, R.L. The chemistry behind antioxidant capacity assays. J. Agric. Food. Chem. 2005, 53, 1841–1856. [Google Scholar] [CrossRef] [PubMed]
- Halliwell, B. How to characterize a biological antioxidant. Free. Radic. Res. Commun. 1990, 9, 1–32. [Google Scholar] [CrossRef] [PubMed]
- Rimm, E.B.; Ascherio, A.; Giovannucci, E.; Spiegelman, D.; Stampfer, M.J.; Willett, W.C. Vegetable, fruit, and cereal fiber intake and risk of coronary heart disease among men. JAMA 1996, 275, 447–451. [Google Scholar] [CrossRef]
- Rimm, E.B.; Katan, M.B.; Ascherio, A.; Stampfer, M.J.; Willett, W.C. Relation between intake of flavonoids and risk for coronary heart disease in male health professionals. Ann. Intern. Med. 1996, 125, 384–389. [Google Scholar] [CrossRef] [PubMed]
- Eberhardt, M.V.; Lee, C.Y.; Liu, R.H. Antioxidant activity of fresh apples. Nature 2000, 405, 903–910. [Google Scholar] [CrossRef] [PubMed]
- Ganesan, K.; Kumar, K.S.; Rao, P.V.S. Comparative assessment of antioxidant activity in three edible species of green seaweed, enteromorpha from okha, northwest coast of india. Innov. Food Sci. Emerg. Technol. 2011, 12, 73–78. [Google Scholar] [CrossRef]
- Bocco, A.; Cuvelier, M.E.; Richard, H.; Berset, C. Antioxidant activity and phenolic composition of citrus peel and seed extracts. J. Agric. Food. Chem. 1998, 46, 2123–2129. [Google Scholar] [CrossRef]
- Paganga, G.; Miller, N.; Rice-Evans, C.A. The polyphenolic content of fruit and vegetables and their antioxidant activities. What does a serving constitute. Free. Radic. Res. 1999, 30, 153–162. [Google Scholar] [CrossRef]
- Pisoschi, A.M.; Cheregi, M.C.; Danet, A.F. Total antioxidant capacity of some commercial fruit juices: Electrochemical and spectrophotometrical approaches. Molecules 2009, 14, 480–486. [Google Scholar] [CrossRef]
- Lanina, S.A.; Toledo, P.; Sampels, S.; Kamal-Eldin, A.; Jastrebova, J.A. Comparison of reversed-phase liquid chromatography—mass spectrometry with electrospray and atmospheric pressure chemical ionization for analysis of dietary tocopherols. J. Chromatogr. A 2007, 1157, 159–170. [Google Scholar] [CrossRef]
- Barroso, M.F.; de-los-Santos-Álvarez, N.; Lobo-Castañón, M.J.; Miranda-Ordieres, A.J.; Delerue-Matos, C.; Oliveira, M.B.P.P.; Tuñón-Blanco, P. DNA-based biosensor for the electrocatalytic determination of antioxidant capacity in beverages. Biosens. Bioelectron. 2011, 26, 2396–2401. [Google Scholar] [CrossRef] [PubMed]
- Serafini, M.; Colombi, B.; Del Rio, D.; Brighenti, F.; Bianchi, M.; Salvatore, S.; Pellegrini, N. Total antioxidant capacity of plant foods, beverages and oils consumed in Italy assessed by three different in vitro assays. J. Nutr. 2003, 133, 2812–2819. [Google Scholar]
- Serafini, M.; Del Rio, D. Understanding the association between dietary antioxidants, redox status and disease: Is the total antioxidant capacity the right tool. Redox Rep. 2004, 9, 145–152. [Google Scholar] [CrossRef] [PubMed]
- Benzie, I.F.F.; Strain, J.J. Ferric reducing/antioxidant power assay: Direct measure of total antioxidant activity of biological fluids and modified version for simultaneous measurement of total antioxidant power and ascorbic acid concentration. Methods Enzymol. 1999, 299, 15–27. [Google Scholar] [PubMed]
- Re, R.; Pellegrini, N.; Proteggente, A.; Pannala, A.; Yang, M.; Rice-Evans, C. Antioxidant activity applying an improved ABTS radical cationdecolorization assay. Free Radic. Biol. Med. 1999, 26, 1231–1237. [Google Scholar] [CrossRef]
- Cao, G.; Alessio, H.M.; Cutler, R.G. Oxygen-radical absorbance capacity assay for antioxidants. Free Radic. Biol. Med. 1993, 14, 303–311. [Google Scholar] [CrossRef]
- Mullen, W.; Marks, S.C.; Crozier, A. Evaluation of phenolic compounds in commercial fruit juices and fruit drinks. J. Agric. Food. Chem. 2007, 55, 3148–3157. [Google Scholar] [CrossRef]
- Ou, B.; Huang, D.; Hampsch-Woodill, M.; Flanagan, J.A.; Deemer, E.K. Analysis of antioxidant activities of common vegetables employing oxygen radical absorbance capacity (orac) and ferric reducing antioxidant power (frap) assays: A comparative study. J. Agric. Food. Chem. 2002, 50, 3122–3128. [Google Scholar] [CrossRef] [PubMed]
- Nilsson, J.; Pillai, D.; Onning, G.; Persson, C.; Nilsson, A.; Akesson, B. Comparison of the 2,2’-azinobis-3-ethylbenzotiazo-line-6-sulfonic acid (ABTS) and ferric reducing anti-oxidant power (FRAP) methods to asses the total antioxidant capacity in extracts of fruit and vegetables. Mol. Nutr. Food Res. 2005, 49, 239–246. [Google Scholar] [CrossRef]
- Tomassetti, M.; Serone, M.; Angeloni, R.; Campanella, L.; Mazzone, E. Amperometric enzyme sensor to check the total antioxidant capacity of several mixed berries. Comparison with two other spectrophotometric and fluorimetric methods. Sensors 2015, 15, 3435–3452. [Google Scholar] [CrossRef] [PubMed]
- Campanella, L.; Gabbianelli, R.; Gatta, T.; Mazzone, E.; Tomassetti, M. A superoxide dismutase biosensor for measuring the antioxidant capacity of blueberry based integrators. Curr. Pharm. Anal. 2013, 9, 208–216. [Google Scholar] [CrossRef]
- Arteaga, J.F.; Ruiz-Montoya, M.; Palma, A.; Alonso-Garrido, G.; Pintado, S.; Rodríguez-Mellado, J.M. Comparison of the simple cyclic voltammetry (cv) and dpph assays for the determination of antioxidant capacity of active principles. Molecules 2012, 17, 5126. [Google Scholar] [CrossRef]
- Tougas, T.P.; Jannetti, J.M.; Collier, W.G. Theoretical and experimental response of a biamperometric detector for flow injection analysis. Anal. Chem. 1985, 57, 1377–1381. [Google Scholar] [CrossRef]
- Milardovic, S.; Kereković, I.; Derrico, R.; Rumenjak, V. A novel method for flow injection analysis of total antioxidant capacity using enzymatically produced ABTS+ and biamperometric detector containing interdigitated electrode. Talanta 2007, 71, 213–220. [Google Scholar] [CrossRef]
- Milardovic, S.; Kereković, I.; Rumenjak, V. A flow injection biamperometric method for determination of total antioxidant capacity of alcoholic beverages using bienzymatically produced ABTS+. Food Chem. 2007, 105, 1688–1694. [Google Scholar] [CrossRef]
- Schofield, D.; Braganza, J.M. Shortcomings of an automated assay for total antioxidant status in biological fluids. Clin. Chem. 1996, 42, 1712–1718. [Google Scholar]
- Milardovic, S.; Iveković, D.; Rumenjak, V.; Grabarić, B.S. Use of DPPH⋅DPPH Redox couple for biamperometric determination of antioxidant activity. Electroanalysis 2005, 17, 1847–1853. [Google Scholar] [CrossRef]
- Hassan, S.S.M.; Mahmoud, W.H.; Mohamed, A.H.K.; Kelany, A.E. Mercury(II) Ion-Selective Polymeric Membrane Sensors for Analysis of Mercury in Hazardous Wastes. Anal. Sci. 2006, 22, 877–881. [Google Scholar] [CrossRef]
- Moreira, F.T.C.; Guerreiro, J.R.L.; Azevedo, V.L.; Sales, M.G.F. New biomimetic sensors for the determination of tetracycline in biological samples: Batch and flow mode operations. Anal. Methods 2010, 2, 2039–2045. [Google Scholar] [CrossRef]
- Hassan, S.S.M.; Elnemma, E.M.; Mohamed, A.H.K. Novel Biomedical Sensors for Flow Injection Potentiometric Determination of Creatinine in Human Serum. Electroanalysis 2005, 17, 2246–2253. [Google Scholar] [CrossRef]
- Tessutti, L.S.; Macedo, D.V.; Kubota, L.T.; Alves, A.A. Measuring the antioxidant capacity of blood plasma using potentiometry. Anal. Biochem. 2013, 441, 109–114. [Google Scholar] [CrossRef]
- Abdullin, I.F.; Turova, E.N.; Ziyatdinova, G.K.; Budnikov, G.K. Potentiometric determination of ascorbic acid: Estimation of its contribution to the total antioxidant capacity of plant materials. J. Anal. Chem. 2002, 57, 353–355. [Google Scholar] [CrossRef]
- Shpigun, L.K.; Arharova, M.A.; Brainina, K.Z.; Ivanova, A.V. Flow injection potentiometric determination of total antioxidant activity of plant extracts. Anal. Chim. Acta 2006, 573, 419–426. [Google Scholar] [CrossRef]
- Brainina, K.Z.; Gerasimova, E.L.; Varzakova, D.P.; Balezin, S.L.; Portnov, I.G.; Makutina, V.A.; Tyrchaninova, E.V. Potentiometric method for evaluating the oxidant/antioxidant activity of seminal and follicular fluids and clinical significance of this parameter for human reproductive function. Open Chem. Biomed. Methods J. 2012, 5, 1–7. [Google Scholar] [CrossRef]
- Brainina, K.Z.; Galperin, L.G.; Gerasimova, E.L.; Khodos, M.Y. Noninvasive potentiometric method of determination of skin oxidant/antioxidant activity. IEEE Sens. J. 2012, 12, 527–532. [Google Scholar] [CrossRef]
- Brainina, K.Z.; Gerasimova, E.L.; Kasaikina, O.T.; Ivanova, A.V. Antioxidant activity evaluation assay based on peroxide radicals generation and potentiometric measurement. Anal. Lett. 2011, 44, 1405–1415. [Google Scholar] [CrossRef]
- Lugonja, N.M.; Stankovic, D.M.; Spasic, S.D.; Roglic, G.M.; Manoilovic, D.D.; Vrvic, M.M. Comparative electrochemical determination of total antioxidant activity in infant formula with breast milk. Food Anal. Method 2014, 7, 337–344. [Google Scholar] [CrossRef]
- Cabello, C.M.; Bair, W.B.; Bause, A.S.; Wondrak, G.T. Antimelanoma activity of the redox dye DCPIP (2,6-dichlorophenolindophenol) is antagonized by NQO1. Biochem. Pharmacol. 2009, 78, 344–354. [Google Scholar] [CrossRef]
- Kamel, A.H.; Khalifa, M.E.; Elgendy, F.A.; El-Maksoud, S.A. Newplastic membrane sensors for selective determination of pyridine as a hazardous pollutant: Validation and applications to flow injection analysis. Int. J. Electrochem. Sci. 2014, 9, 1663–1677. [Google Scholar]
- Vallverdú-Queralt, A.; Medina-Remón, A.; Casals-Ribes, I.; Lamuela-Raventos, R.M. Is there any difference between the phenolic content of organic and conventional tomato juices? Food Chem. 2012, 130, 222–227. [Google Scholar] [CrossRef]
- Guibault, G.G.; Durst, R.A.; Frant, M.S.; Freiser, H.; Hansen, E.H.; Light, T.S.; Pungor, E.; Rechnitz, G.; Rice, N.M.; Rohm, T.J.; et al. Recommendations for Nomenclature of Ion-Selective Electrodes. Pure Appl. Chem. 1976, 48, 127–132. [Google Scholar]
- Umezawa, Y.; Buhlmann, P.; Umezawa, K.; Tohda, K.; Amemiya, S. Potentiometric selectivity coefficients of ion-selective electrodes. Pure Appl. Chem. 2000, 72, 1851–2082. [Google Scholar] [CrossRef]


| Parameter | Sensor I/o-NPOE | Sensor I/DOP | Sensor II/o-NPOE | Senso II/DOP |
|---|---|---|---|---|
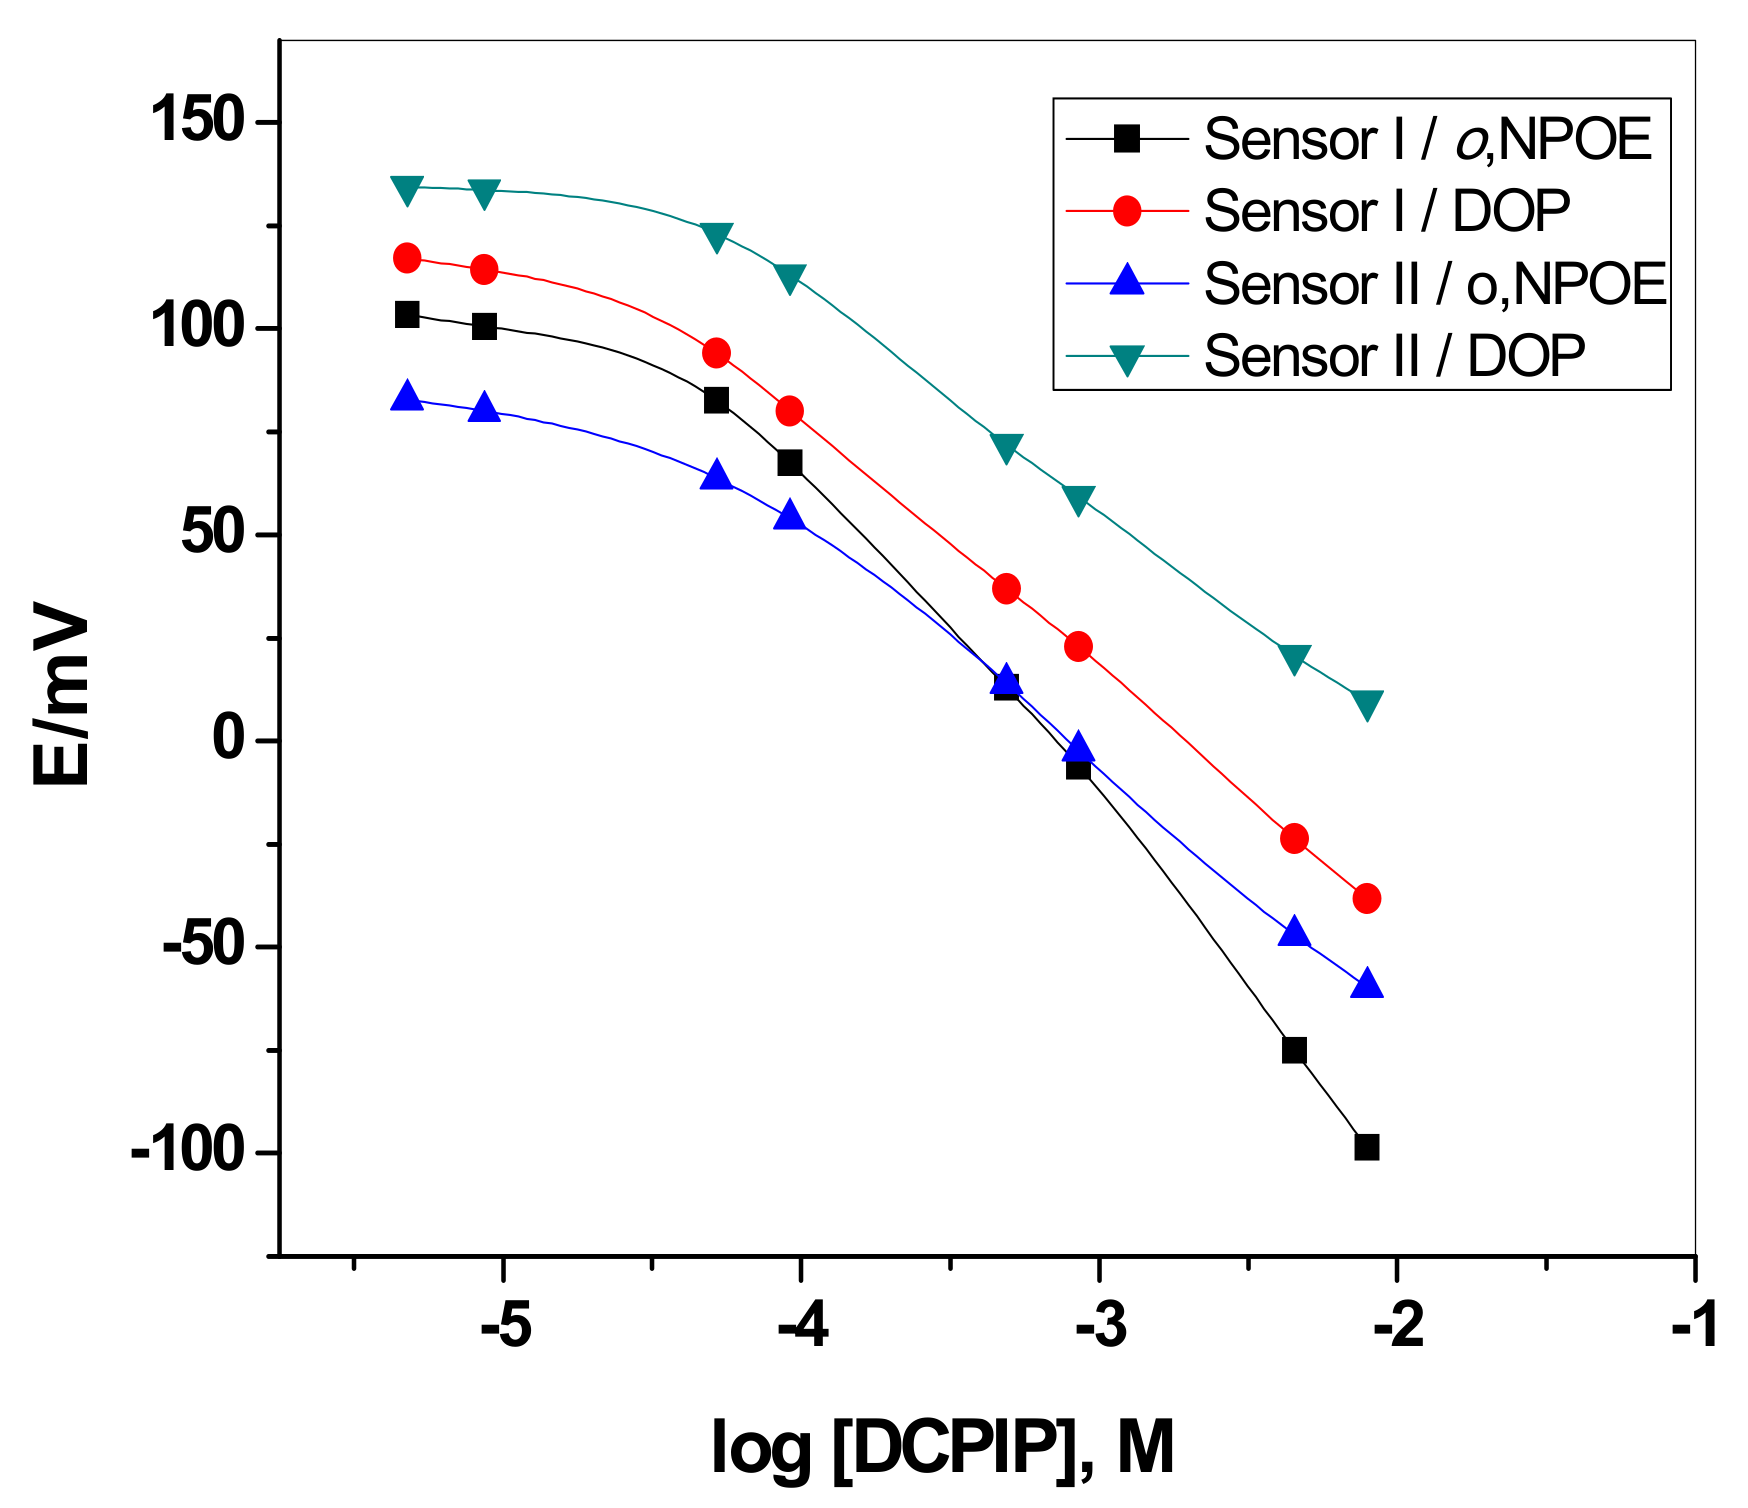
| Slope (mV/decade) | −82.25 ± 1 | −56.25 ± 1.7 | −59.5 ± 1.4 | −51.64 ± 2 |
| Correlation coefficient (r) | −0.996 | −0.998 | −0.999 | −0.998 |
| Linear range (M) | 9.9 × 10⁻⁵−1.0 × 10⁻² | 5.13 × 10⁻⁵−1.0 × 10⁻² | 6.5 × 10⁻⁵−1.0 × 10⁻² | 5.15 × 10⁻⁵−1.0 × 10⁻² |
| Detection limit (M) | 7.9 × 10⁻⁵ | 2.37 × 10⁻⁵ | 4.5 × 10⁻⁵ | 3.45 × 10⁻⁵ |
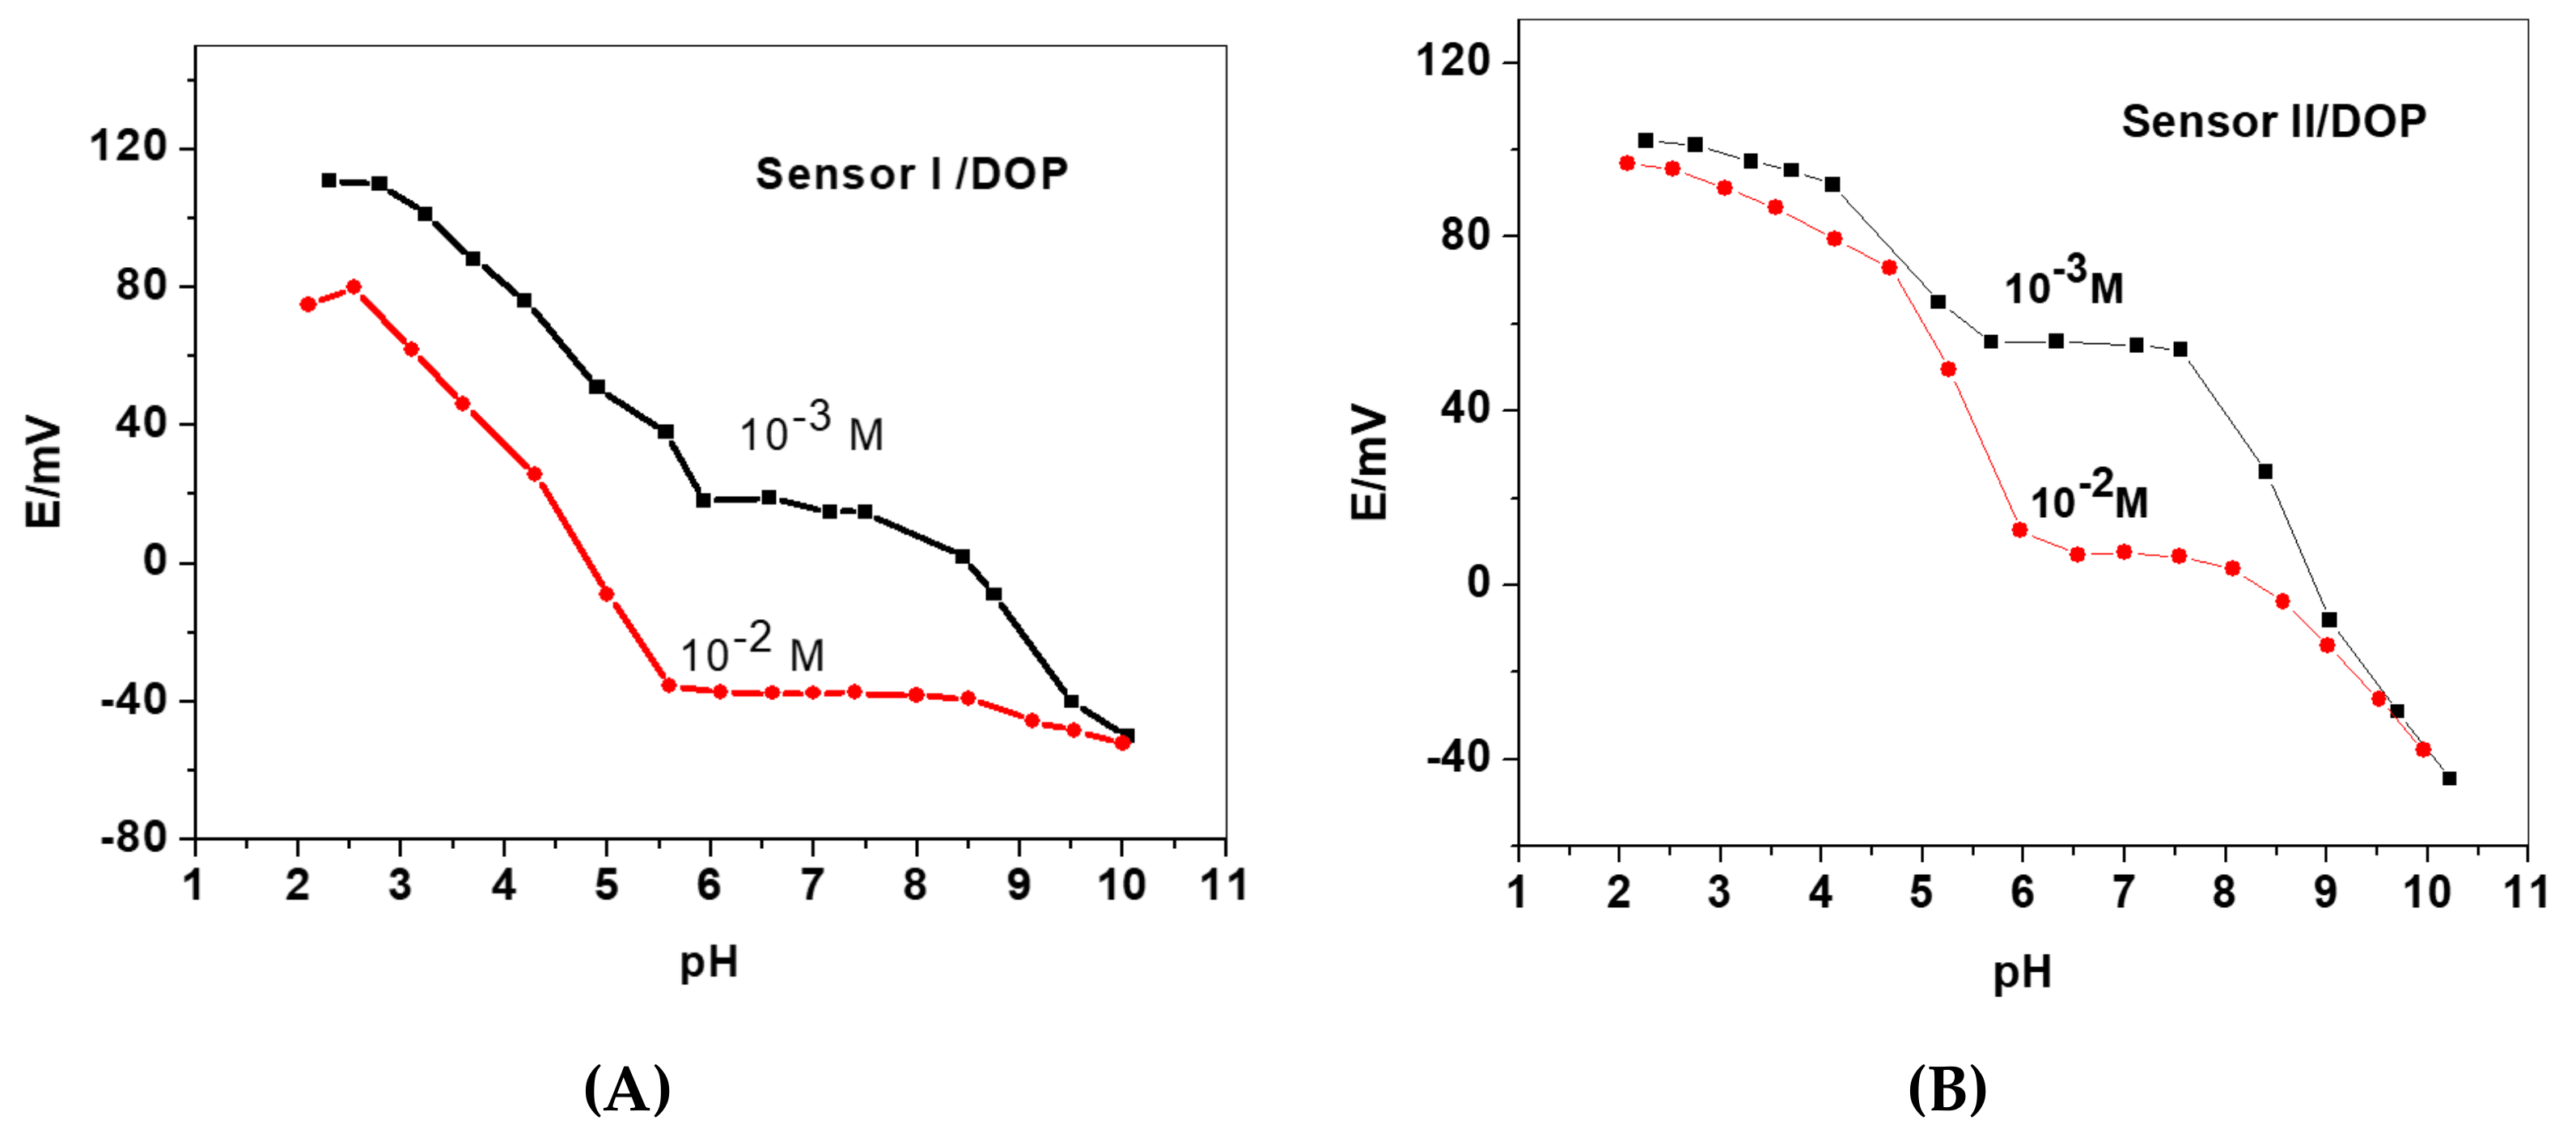
| Working range (pH) | 7 | 7 | 7 | 7 |
| Response (s) | <20 | <20 | <20 | <20 |
| Life span (week) | 12 | 6 | 12 | 6 |
| Standard deviation, σv (mV) | 0.58 | 1.15 | 1 | 1.5 |
| Accuracy (%) | 99.3 | 97.6 | 96 | 96.8 |
| Precision (%) | 0.6 | 0.8 | 1.7 | 1.1 |
| Parameter | Sensor I/DOP | Sensor II/DOP |
|---|---|---|
| Slope, mV/decade * | −42.3 ± 1.1 | −33.3 ± 0.9 |
| Correlation coefficient, r | −0.974 | −0.984 |
| Detection limit, M | 8.06 × 10⁻⁵ | 4.23 × 10⁻⁵ |
| Linear range, M | 9.8 × 10⁻⁵−1.0 × 10⁻² | 1.0 × 10⁻⁴−1.0 × 10⁻² |
| Life span, week | 12 | 12 |
| Optimum flow rate, mL/min | 3.5 | 3.5 |
| Sample frequency, sample/h | 51 | 42 |
| Interfering ion, J | (log KDCPIP, J) ± SD | |||
|---|---|---|---|---|
| Sensor I | Sensor II | |||
| o-NPOE | DOP | o-NPOE | DOP | |
| Cl− | −3.05 ± 0.1 | −2.15 ± 0.2 | −2.7 ± 0.2 | −2.9 ± 0.3 |
| Br− | −3.0 ± 0.4 | −2.1 ± 0.5 | −2.5 ± 0.3 | −3.1 ± 0.1 |
| NO2− | −2.9 ± 0.1 | −2.3 ± 0.4 | −2.2 ± 0.4 | −1.1 ± 0.2 |
| NO3− | −2.8 ± 0.3 | −2.5 ± 0.3 | −2.4 ± 0.4 | −1.5 ± 0.6 |
| Citrate | −3.2 ± 0.4 | −3.4 ± 0.1 | −3.6 ± 0.3 | −3.5 ± 0.2 |
| Acetate | −1.01 ± 0.2 | −0.9 ± 0.07 | −0.7 ± 0.03 | −0.68 ± 0.02 |
| PO43− | −3.4 ± 0.4 | −3.6 ± 0.4 | −3.3 ± 0.3 | −3.7 ± 0.4 |
| Phenol | −2.6 ± 0.1 | −2.37 ± 0.3 | −1.1 ± 0.2 | −1.93 ± 0.1 |
| Picrate | −0.8 ± 0.04 | −0.75 ± 0.03 | −0.75 ± 0.03 | −0.63 ± 0.03 |
| 2,4-DCP | −1.3 ± 0.2 | −2.7 ± 0.2 | −1.2 ± 0.1 | −1.8 ± 0.4 |
| I− | −2.65 ± 0.1 | −1.1 ± 0.1 | −1.01 ± 0.2 | −1.3 ± 0.2 |
| SCN− | −2.5 ± 0.2 | −1.5 ± 0.2 | −2.55 ± 0.2 | −1.02 ± 0.3 |
| Pyrogallol | −2.2 ± 0.3 | −1.8 ± 0.2 | −1.5 ± 0.1 | −2.1 ± 0.1 |
| Ferulic acid | −2.3 ± 0.2 | −2.8 ± 0.1 | −1.6 ± 0.3 | −2.5 ± 0.2 |
| Caffeic acid | −2.35 ± 0.1 | −2.8 ± 0.2 | −1.7 ± 0.2 | −2.4 ± 0.4 |
| Gallic acid | −2.4 ± 0.2 | −2.65 ± 0.3 | −1.65 ± 0.2 | −2.2 ± 0.2 |
| Catechol | −2.01 ± 0.2 | −2.55 ± 0.2 | −1.77 ± 0.4 | −2.47 ± 0.2 |
| Mixture | Added (µg/mL) | Sensor I/o-NPOE | Sensor I/DOP | ||||
|---|---|---|---|---|---|---|---|
| Found (µg/mL) | Recovery (%) | S.D. (%) | Found (µg/mL) | Recovery (%) | S.D. (%) | ||
| Ferulic acid (Fer) | 100 | 93.3 ± 7.2 | 93.3 | 1.2 | 94.1 ± 3.1 | 97.1 | 1.1 |
| Catechol (Cat) | 100 | 97.5 ± 3.5 | 97.5 | 0.9 | 96.7 ± 0.9 | 96.7 | 0.9 |
| Caffeic acid (CA) | 100 | 104.0 ± 1.5 | 104.0 | 0.7 | 99.1 ± 0.3 | 99.1 | 0.4 |
| Gallic acid (GA) | 100 | 94.0 ± 2.5 | 94.0 | 0.9 | 95.1±1.1 | 95.1 | 0.6 |
| Pyrogallol (Pyr) | 100 | 91.2 ± 6.5 | 91.2 | 0.3 | 93.7 ± 2.1 | 93.7 | 0.5 |
| Ascorbic acid (AA) | 100 | 102.3 ± 9.5 | 102.3 | 0.6 | 98.2 ± 2.4 | 98.2 | 1.4 |
| Cat + Fer | 200 | 214.2 ± 4.5 | 107.2 | 0.5 | 208.1 ± 3.1 | 104.0 | 1.3 |
| Fer + Pyr | 200 | 211.5 ± 6.5 | 105.7 | 0.6 | 207 ± 2.4 | 103.5 | 0.6 |
| Caf + Gal | 200 | 184 ± 3.5 | 92.0 | 1.2 | 194.2 ± 3.1 | 97.1 | 1.3 |
| Cat + Fer + Pyr | 300 | 294.3 ± 1.5 | 98.1 | 1.1 | 291.1 ± 7.1 | 97.0 | 0.7 |
| Sample | TAC, µg/mL * (AA) | |||
|---|---|---|---|---|
| DPPH Standard method [45] | Sensor I/DOP | Sensor II/DOP | ||
| 1-Vitacid a (Chemical Industries Development (CID), Egypt) | 1005.1 ± 3.8 | 980.7 ± 3.2 | 1010.1 ± 7.7 | |
| 2-C-Vit b (Universal Pharmaceutical Industries (Unipharma), Egypt) | 1010.2 ± 11.2 | 1050.3 ± 2.7 | 1062.6 ± 5.5 | |
| 3-Canned orange juices | 1-Juhayna Pure (El Dawleya Co. for Modern Food Industries, Egypt) (100%) | 513.6 ± 10.1 | 492.5 ± 6.6 | 483.8 ± 3.7 |
| 2- Juhayna (El Dawleya Co. for Modern Food Industries, Egypt) (˂25%) | 281.8 ± 5.4 | 255.2 ± 3.2 | 247.3 ± 7.1 | |
| 3-Domty (Arabian Food Industries, Egypt) (˂25%) | 424.5 ± 8.3 | 410.3 ± 5.9 | 371.7 ± 6.3 | |
| 4-Faragello Gold (The Egyptian Food Company, Egypt) (100%) | 157.7 ± 7.2 | 142.6 ± 7.1 | 139.4 ± 5.2 | |
| 5- Faragello (The Egyptian Food Company, Egypt) (10%) | 37.1 ± 1.8 | 28.2 ± 2.2 | 30.4 ± 2.1 | |
| 6- Easymoozoo (The Egyptian Food Company, Egypt) (10%) | 48.9 ± 5.6 | 36.4 ± 1.4 | 41.1 ± 1.9 | |
| 7- Prego (Brego for Food Industries, Egypt) (25%) | 104.9 ± 6.3 | 97.1 ± 1.2 | 91.2 ± 3.7 | |
| 8- Lipton iced tea (Pepsi Bugshan Investment, a SAE Unilever trademark) orange juice? | 95.9 ± 8.1 | 83.5 ± 2.4 | 81.4 ± 5.6 | |
| 4-Fresh Lemon juice | 378.6 ± 9.5 | 350.2 ± 4.2 | 361.3 ± 6.2 | |
| 5- Fresh Orange juice | 77.6 ± 2.4 | 66.1 ± 1.1 | 61.3 ± 3.7 | |
© 2019 by the authors. Licensee MDPI, Basel, Switzerland. This article is an open access article distributed under the terms and conditions of the Creative Commons Attribution (CC BY) license (http://creativecommons.org/licenses/by/4.0/).
Share and Cite
Elbehery, N.H.A.; Amr, A.E.-G.E.; Kamel, A.H.; Elsayed, E.A.; Hassan, S.S.M. Novel Potentiometric 2,6-Dichlorophenolindo-phenolate (DCPIP) Membrane-Based Sensors: Assessment of Their Input in the Determination of Total Phenolics and Ascorbic Acid in Beverages. Sensors 2019, 19, 2058. https://doi.org/10.3390/s19092058
Elbehery NHA, Amr AE-GE, Kamel AH, Elsayed EA, Hassan SSM. Novel Potentiometric 2,6-Dichlorophenolindo-phenolate (DCPIP) Membrane-Based Sensors: Assessment of Their Input in the Determination of Total Phenolics and Ascorbic Acid in Beverages. Sensors. 2019; 19(9):2058. https://doi.org/10.3390/s19092058
Chicago/Turabian StyleElbehery, Nada H. A., Abd El-Galil E. Amr, Ayman H. Kamel, Elsayed A. Elsayed, and Saad S. M. Hassan. 2019. "Novel Potentiometric 2,6-Dichlorophenolindo-phenolate (DCPIP) Membrane-Based Sensors: Assessment of Their Input in the Determination of Total Phenolics and Ascorbic Acid in Beverages" Sensors 19, no. 9: 2058. https://doi.org/10.3390/s19092058