Ultrasonography Features of the Plantar Fascia Complex in Patients with Chronic Non-Insertional Achilles Tendinopathy: A Case-Control Study

 ,
, 
 ,
,  , , and
Abstract
:1. Introduction
2. Methods
2.1. Design
2.2. Participants
2.3. Calculation of the Sample Size
2.4. Ethical Statement
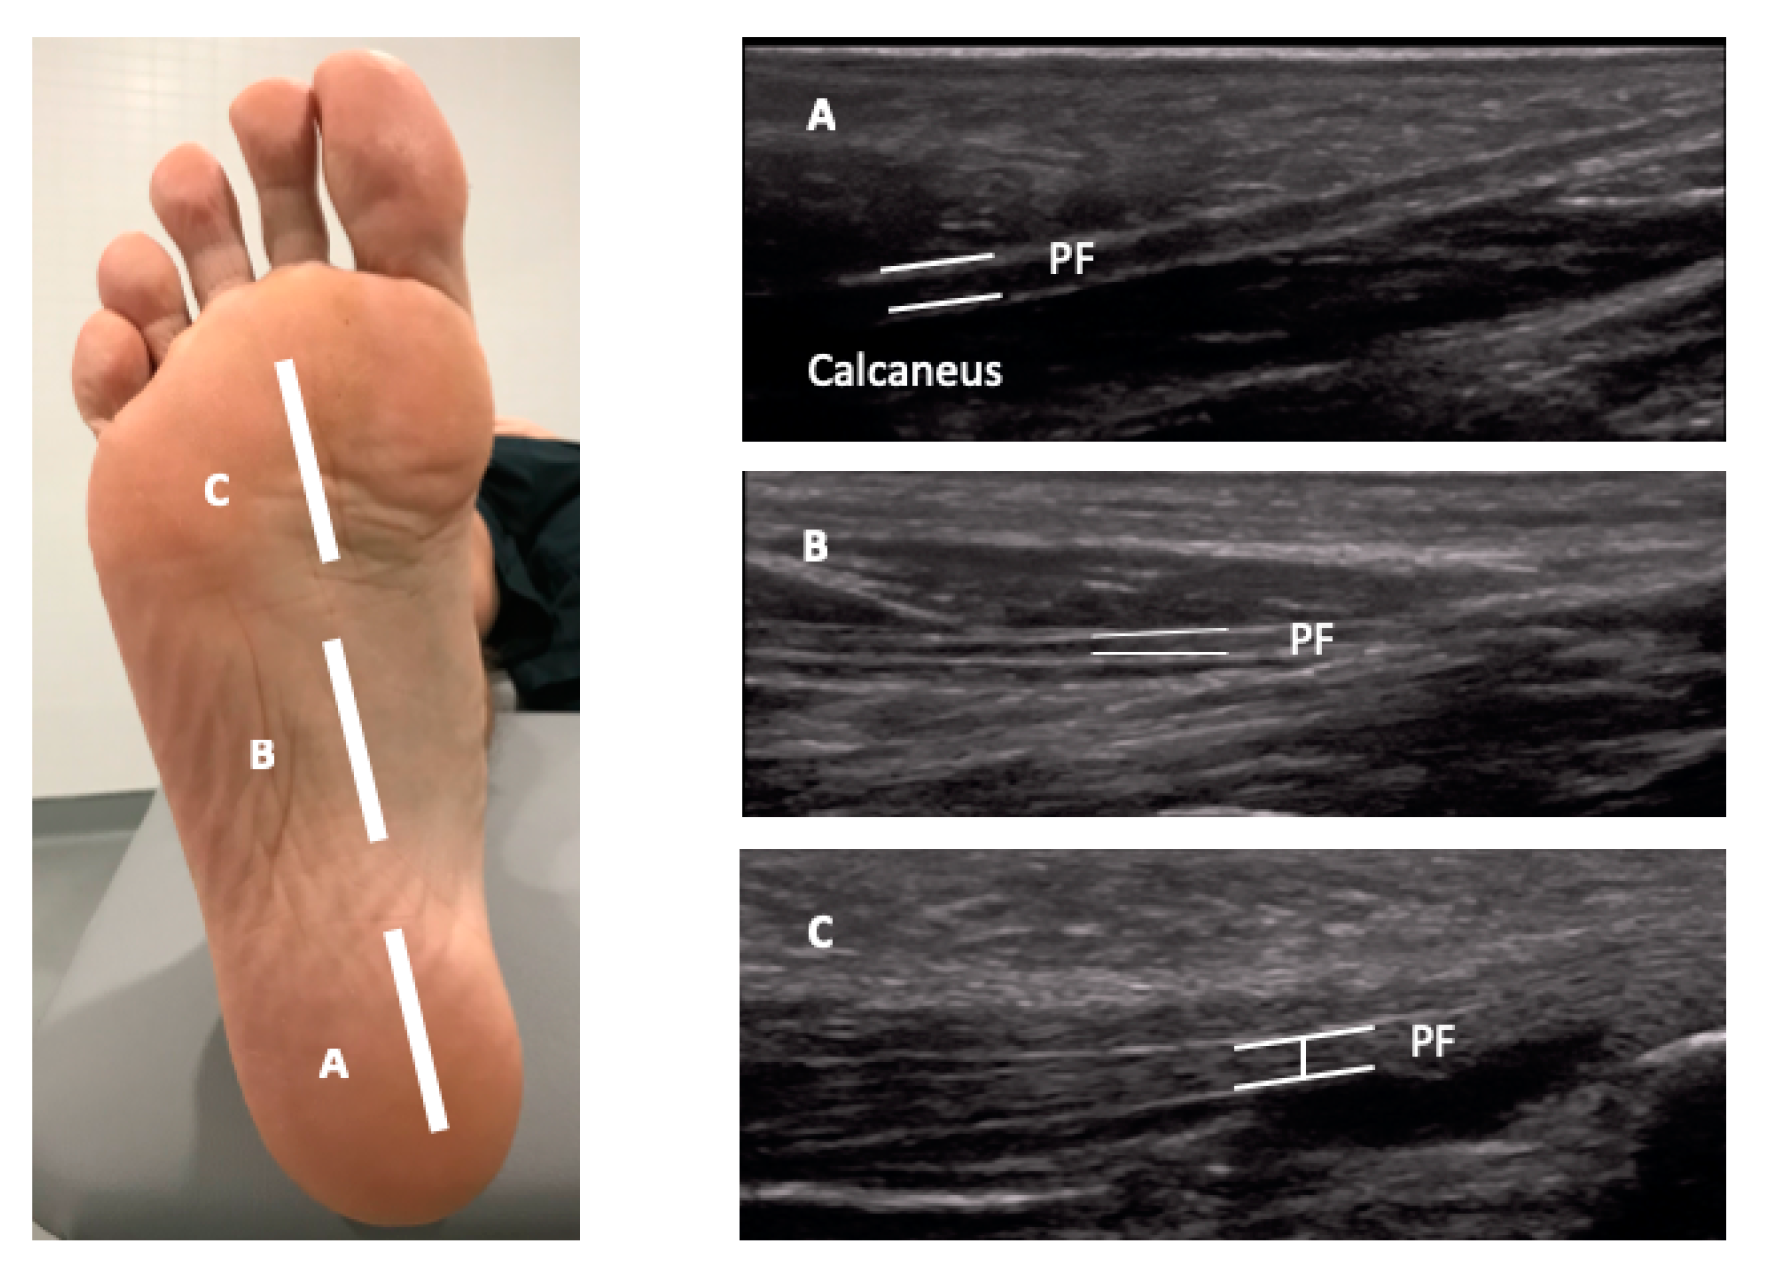
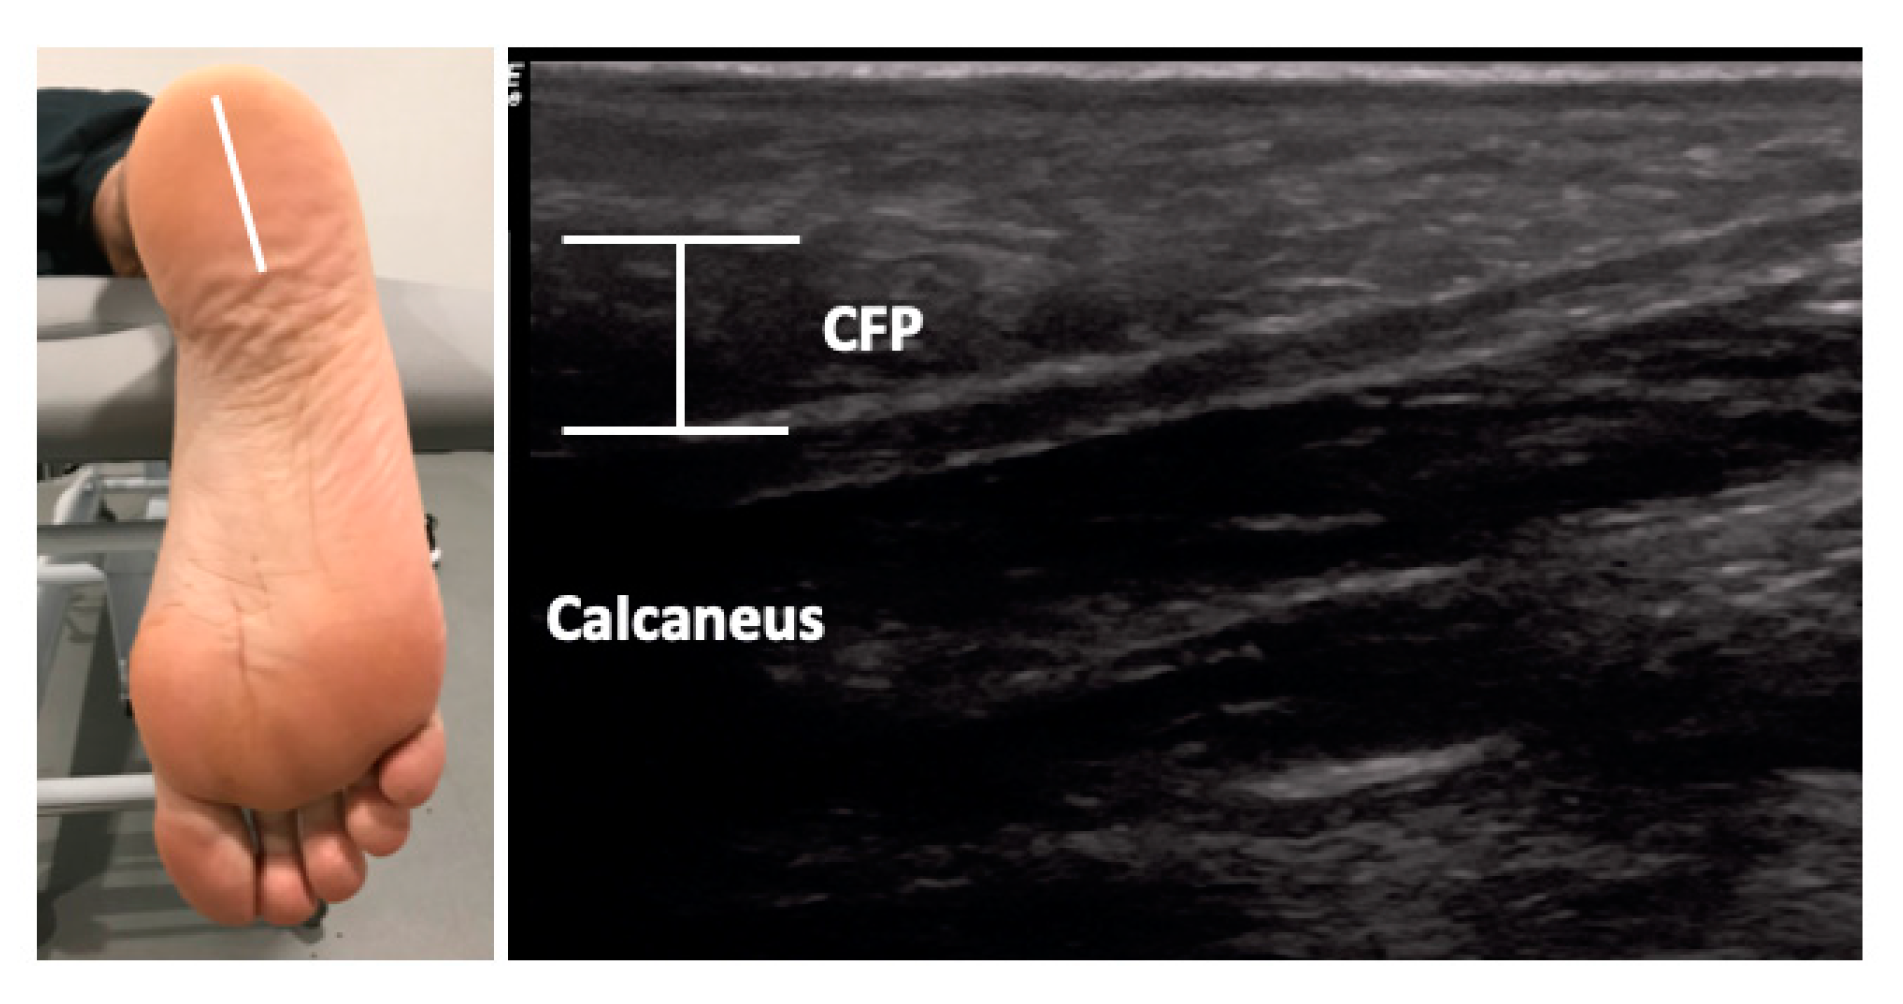
2.5. Ultrasonography Measurements
2.6. Data Analysis
3. Results
4. Discussion
5. Limitations
6. Conclusions
Author Contributions
Acknowledgments
Conflicts of Interest
References
- Jarvinen, T.A.; Kannus, P.; Paavola, M.; Jarvinen, T.L.; Jozsa, L.; Jarvinen, M. Achilles tendon injuries. Curr. Opin. Rheumatol. 2001, 13, 150–155. [Google Scholar] [CrossRef]
- Albers, I.S.; Zwerver, J.; Diercks, R.L.; Dekker, J.H.; Van den Akker-Scheek, I. Incidence and prevalence of lower extremity tendinopathy in a Dutch general practice population: A cross sectional study. BMC Musculoskelet. Disord. 2016, 17, 16. [Google Scholar] [CrossRef]
- Cook, J.L.; Purdam, C.R. Is tendon pathology a continuum? A pathology model to explain the clinical presentation of load-induced tendinopathy. Br. J. Sports Med. 2009, 43, 409–416. [Google Scholar] [CrossRef] [PubMed]
- Romero-Morales, C.; Martin-Llantino, P.J.; Calvo-Lobo, C.; Palomo-Lopez, P.; Lopez-Lopez, D.; Pareja-Galeano, H.; Rodriguez-Sanz, D. Comparison of the sonographic features of the Achilles Tendon complex in patients with and without achilles tendinopathy: A case-control study. Phys. Ther. Sport 2019, 35, 122–126. [Google Scholar] [CrossRef]
- Nadeau, M.-J.; Desrochers, A.; Lamontagne, M.; Larivière, C.; Gagnon, D.H. Quantitative ultrasound imaging of Achilles tendon integrity in symptomatic and asymptomatic individuals: Reliability and minimal detectable change. J. Foot Ankle Res. 2016, 9, 30. [Google Scholar] [CrossRef]
- Lorimer, A.V.; Hume, P.A. Achilles tendon injury risk factors associated with running. Sports Med. 2014, 44, 1459–1472. [Google Scholar] [CrossRef] [PubMed]
- Maganaris, C.N.; Narici, M.V.; Maffulli, N. Biomechanics of the Achilles tendon. Disabil. Rehabil. 2008, 30, 1542–1547. [Google Scholar] [CrossRef] [PubMed]
- Hintermann, B.; Nigg, B.M.; Sommer, C. Foot movement and tendon excursion: an in vitro study. Foot Ankle Int. 1994, 15, 386–395. [Google Scholar] [CrossRef] [PubMed]
- Galloway, M.T.; Lalley, A.L.; Shearn, J.T. The role of mechanical loading in tendon development, maintenance, injury, and repair. J. Bone Jt. Surg. Am. 2013, 95, 1620–1628. [Google Scholar] [CrossRef] [PubMed]
- Angin, S.; Crofts, G.; Mickle, K.J.; Nester, C.J. Ultrasound evaluation of foot muscles and plantar fascia in pes planus. Gait Posture 2014, 40, 48–52. [Google Scholar] [CrossRef] [PubMed]
- Huang, Y.-C.; Wang, L.-Y.; Wang, H.-C.; Chang, K.-L.; Leong, C.-P. The relationship between the flexible flatfoot and plantar fasciitis: Ultrasonographic evaluation. Chang Gung Med. J. 2004, 27, 443–448. [Google Scholar]
- Boussouar, A.; Meziane, F.; Crofts, G. Plantar fascia segmentation and thickness estimation in ultrasound images. Comput. Med. Imaging Graph. 2017, 56, 60–73. [Google Scholar] [CrossRef] [PubMed]
- Crofts, G.; Angin, S.; Mickle, K.J.; Hill, S.; Nester, C.J. Reliability of ultrasound for measurement of selected foot structures. Gait Posture 2014, 39, 35–39. [Google Scholar] [CrossRef]
- Draghi, F.; Gitto, S.; Bortolotto, C.; Draghi, A.G.; Ori Belometti, G. Imaging of plantar fascia disorders: Findings on plain radiography, ultrasound and magnetic resonance imaging. Insights Imaging 2017, 8, 69–78. [Google Scholar] [CrossRef]
- Lobo, C.C.; Marin, A.G.; Sanz, D.R.; Lopez, D.L.; Lopez, P.P.; Morales, C.R.; Corbalan, I.S. Ultrasound evaluation of intrinsic plantar muscles and fascia in hallux valgus: A case-control study. Medicine 2016, 95, e5243. [Google Scholar] [CrossRef]
- Lobo, C.C.; Morales, C.R.; Sanz, D.R.; Corbalan, I.S.; Marin, A.G.; Lopez, D.L. Ultrasonography Comparison of Peroneus Muscle Cross-sectional Area in Subjects With or Without Lateral Ankle Sprains. J. Manipulative Physiol. Ther. 2016, 39, 635–644. [Google Scholar] [CrossRef]
- Taniguchi, M.; Fukumoto, Y.; Kobayashi, M.; Kawasaki, T.; Maegawa, S.; Ibuki, S.; Ichihashi, N. Quantity and Quality of the Lower Extremity Muscles in Women with Knee Osteoarthritis. Ultrasound Med. Biol. 2015, 41, 2567–2574. [Google Scholar] [CrossRef]
- Strini, P.J.S.A.; Strini, P.J.S.A.; de Souza Barbosa, T.; Gavião, M.B.D. Assessment of thickness and function of masticatory and cervical muscles in adults with and without temporomandibular disorders. Arch. Oral Biol. 2013, 58, 1100–1108. [Google Scholar] [CrossRef]
- Mohseny, B.; Nijhuis, T.H.; Hundepool, C.A.; Janssen, W.G.; Selles, R.W.; Coert, J.H. Ultrasonographic quantification of intrinsic hand muscle cross-sectional area; reliability and validity for predicting muscle strength. Arch. Phys. Med. Rehabil. 2015, 96, 845–853. [Google Scholar] [CrossRef] [PubMed]
- Javanshir, K.; Amiri, M.; Mohseni Bandpei, M.A.; Penas, C.F.D.L.; Rezasoltani, A. The effect of different exercise programs on cervical flexor muscles dimensions in patients with chronic neck pain. J. Back Musculoskelet. Rehabil. 2015, 28, 833–840. [Google Scholar] [CrossRef]
- Teyhen, D.S.; Gill, N.W.; Whittaker, J.L.; Henry, S.M.; Hides, J.A.; Hodges, P. Rehabilitative ultrasound imaging of the abdominal muscles. J. Orthop. Sports Phys. Ther. 2007, 37, 450–466. [Google Scholar] [CrossRef]
- Whittaker, J.L.; Warner, M.B.; Stokes, M. Comparison of the Sonographic Features of the Abdominal Wall Muscles and Connective Tissues in Individuals with and without Lumbopelvic Pain. J. Orthop. Sports Phys. Ther. 2013, 43, 11–19. [Google Scholar] [CrossRef]
- Romero-Morales, C.; Almazán-Polo, J.; Rodríguez-Sanz, D.; Palomo-López, P.; López-López, D.; Vázquez-González, S.; Calvo-Lobo, C. Rehabilitative Ultrasound Imaging Features of the Abdominal Wall Muscles in Elite and Amateur Basketball Players. Appl. Sci. 2018, 8, 809. [Google Scholar] [CrossRef]
- Hall, M.M.; Finnoff, J.T.; Sayeed, Y.A.; Smith, J. Sonographic Evaluation of the Plantar Heel in Asymptomatic Endurance Runners. J. Ultrasound Med. 2015, 34, 1861–1871. [Google Scholar] [CrossRef] [Green Version]
- Welch, V.; Jull, J.; Petkovic, J.; Armstrong, R.; Boyer, Y.; Cuervo, L.G.; Edwards, S.; Lydiatt, A.; Gough, D.; Grimshaw, J.; et al. Protocol for the development of a CONSORT-equity guideline to improve reporting of health equity in randomized trials. Implement. Sci. 2015, 10, 146. [Google Scholar] [CrossRef] [Green Version]
- Alfredson, H.; Pietila, T.; Jonsson, P.; Lorentzon, R. Heavy-load eccentric calf muscle training for the treatment of chronic Achilles tendinosis. Am. J. Sports Med. 1998, 26, 360–366. [Google Scholar] [CrossRef]
- Alfredson, H.; Cook, J. A treatment algorithm for managing Achilles tendinopathy: New treatment options. Br. J. Sports Med. 2007, 41, 211–216. [Google Scholar] [CrossRef] [PubMed]
- Romero-Morales, C.; Martín-Llantino, P.J.; Calvo-Lobo, C.; Beltran-Alacreu, H.; López-López, D.; Sánchez-Gómez, R.; Rodríguez-Sanz, D. Effectiveness of Eccentric Exercise and a Vibration or Cryotherapy Program in Enhancing Rectus Abdominis Muscle Thickness and Inter-Rectus Distance in Patients with Chronic Mid-Portion Achilles Tendinopathy: A Randomized Clinical Trial. Int. J. Med. Sci. 2018, 15, 1764–1770. [Google Scholar] [CrossRef] [PubMed]
- Rathleff, M.S.; Moelgaard, C.; Lykkegaard Olesen, J. Intra- and interobserver reliability of quantitative ultrasound measurement of the plantar fascia. J. Clin. Ultrasound 2011, 39, 128–134. [Google Scholar] [CrossRef] [PubMed]
- Lopez-Lopez, D.; Becerro-de-Bengoa-Vallejo, R.; Losa-Iglesias, M.E.; Soriano-Medrano, A.; Palomo-Lopez, P.; Morales-Ponce, A.; Rodriguez-Sanz, D.; Calvo-Lobo, C. Relationship Between Decreased Subcalcaneal Fat Pad Thickness and Plantar Heel Pain. A Case Control Study. Pain Physician 2019, 22, 109–116. [Google Scholar]
- Maffulli, N.; Kader, D. Tendinopathy of tendo achillis. J. Bone Jt. Surg. Br. 2002, 84, 1–8. [Google Scholar] [CrossRef] [PubMed]
- Cornwall, M.W.; McPoil, T.G. Plantar fasciitis: Etiology and treatment. J. Orthop. Sports Phys. Ther. 1999, 29, 756–760. [Google Scholar] [CrossRef]
- Karr, S.D. Subcalcaneal heel pain. Orthop. Clin. N. Am. 1994, 25, 161–175. [Google Scholar]
- Lai, A.; Schache, A.G.; Lin, Y.-C.; Pandy, M.G. Tendon elastic strain energy in the human ankle plantar-flexors and its role with increased running speed. J. Exp. Biol. 2014, 217, 3159–3168. [Google Scholar] [CrossRef] [Green Version]
- Hsu, C.-C.; Tsai, W.-C.; Hsiao, T.-Y.; Tseng, F.-Y.; Shau, Y.-W.; Wang, C.-L.; Lin, S.-C. Diabetic effects on microchambers and macrochambers tissue properties in human heel pads. Clin. Biomech. 2009, 24, 682–686. [Google Scholar] [CrossRef]
- Silver, D.A.; Kerr, P.S.; Andrews, H.S.; Atkins, R.M. Heel pad thickness following calcaneal fractures: ultrasound findings. Injury 1994, 25, 39–40. [Google Scholar] [CrossRef]
- Prichasuk, S. The heel pad in plantar heel pain. J. Bone Jt. Surg. Br. 1994, 76, 140–142. [Google Scholar] [CrossRef]


| Data | Achilles Tendinopathy (n = 71) | Controls (n = 70) | P-Value Cases vs. Controls |
|---|---|---|---|
| Weight, kg | 76.00 ± 12.00 † | 75.00 ± 18.50 † | 0.412 ‡ |
| Age, year | 45.11 ± 12.75 * | 37.61 ± 11.91 * | 0.200 ** |
| Height, m | 1.76 ± 0.11 † | 1.76 ± 0.12 † | 0.566 ‡ |
| BMI, kg/m2 | 24.81 ± 2.13 † | 23.88 ± 3.67 † | 0.012 ‡ |
| VAS | 2.00 ± 3.00 † | N/A | N/A |
| VISA-A | 56.00 ± 14.00 † | N/A | N/A |
| Sex, men/women | 62/9 | 54/18 | 0.086 ‡‡ |
| Measurement | Tendinopathy (n = 71) | Controls (n = 72) | P-Value |
|---|---|---|---|
| Distance | |||
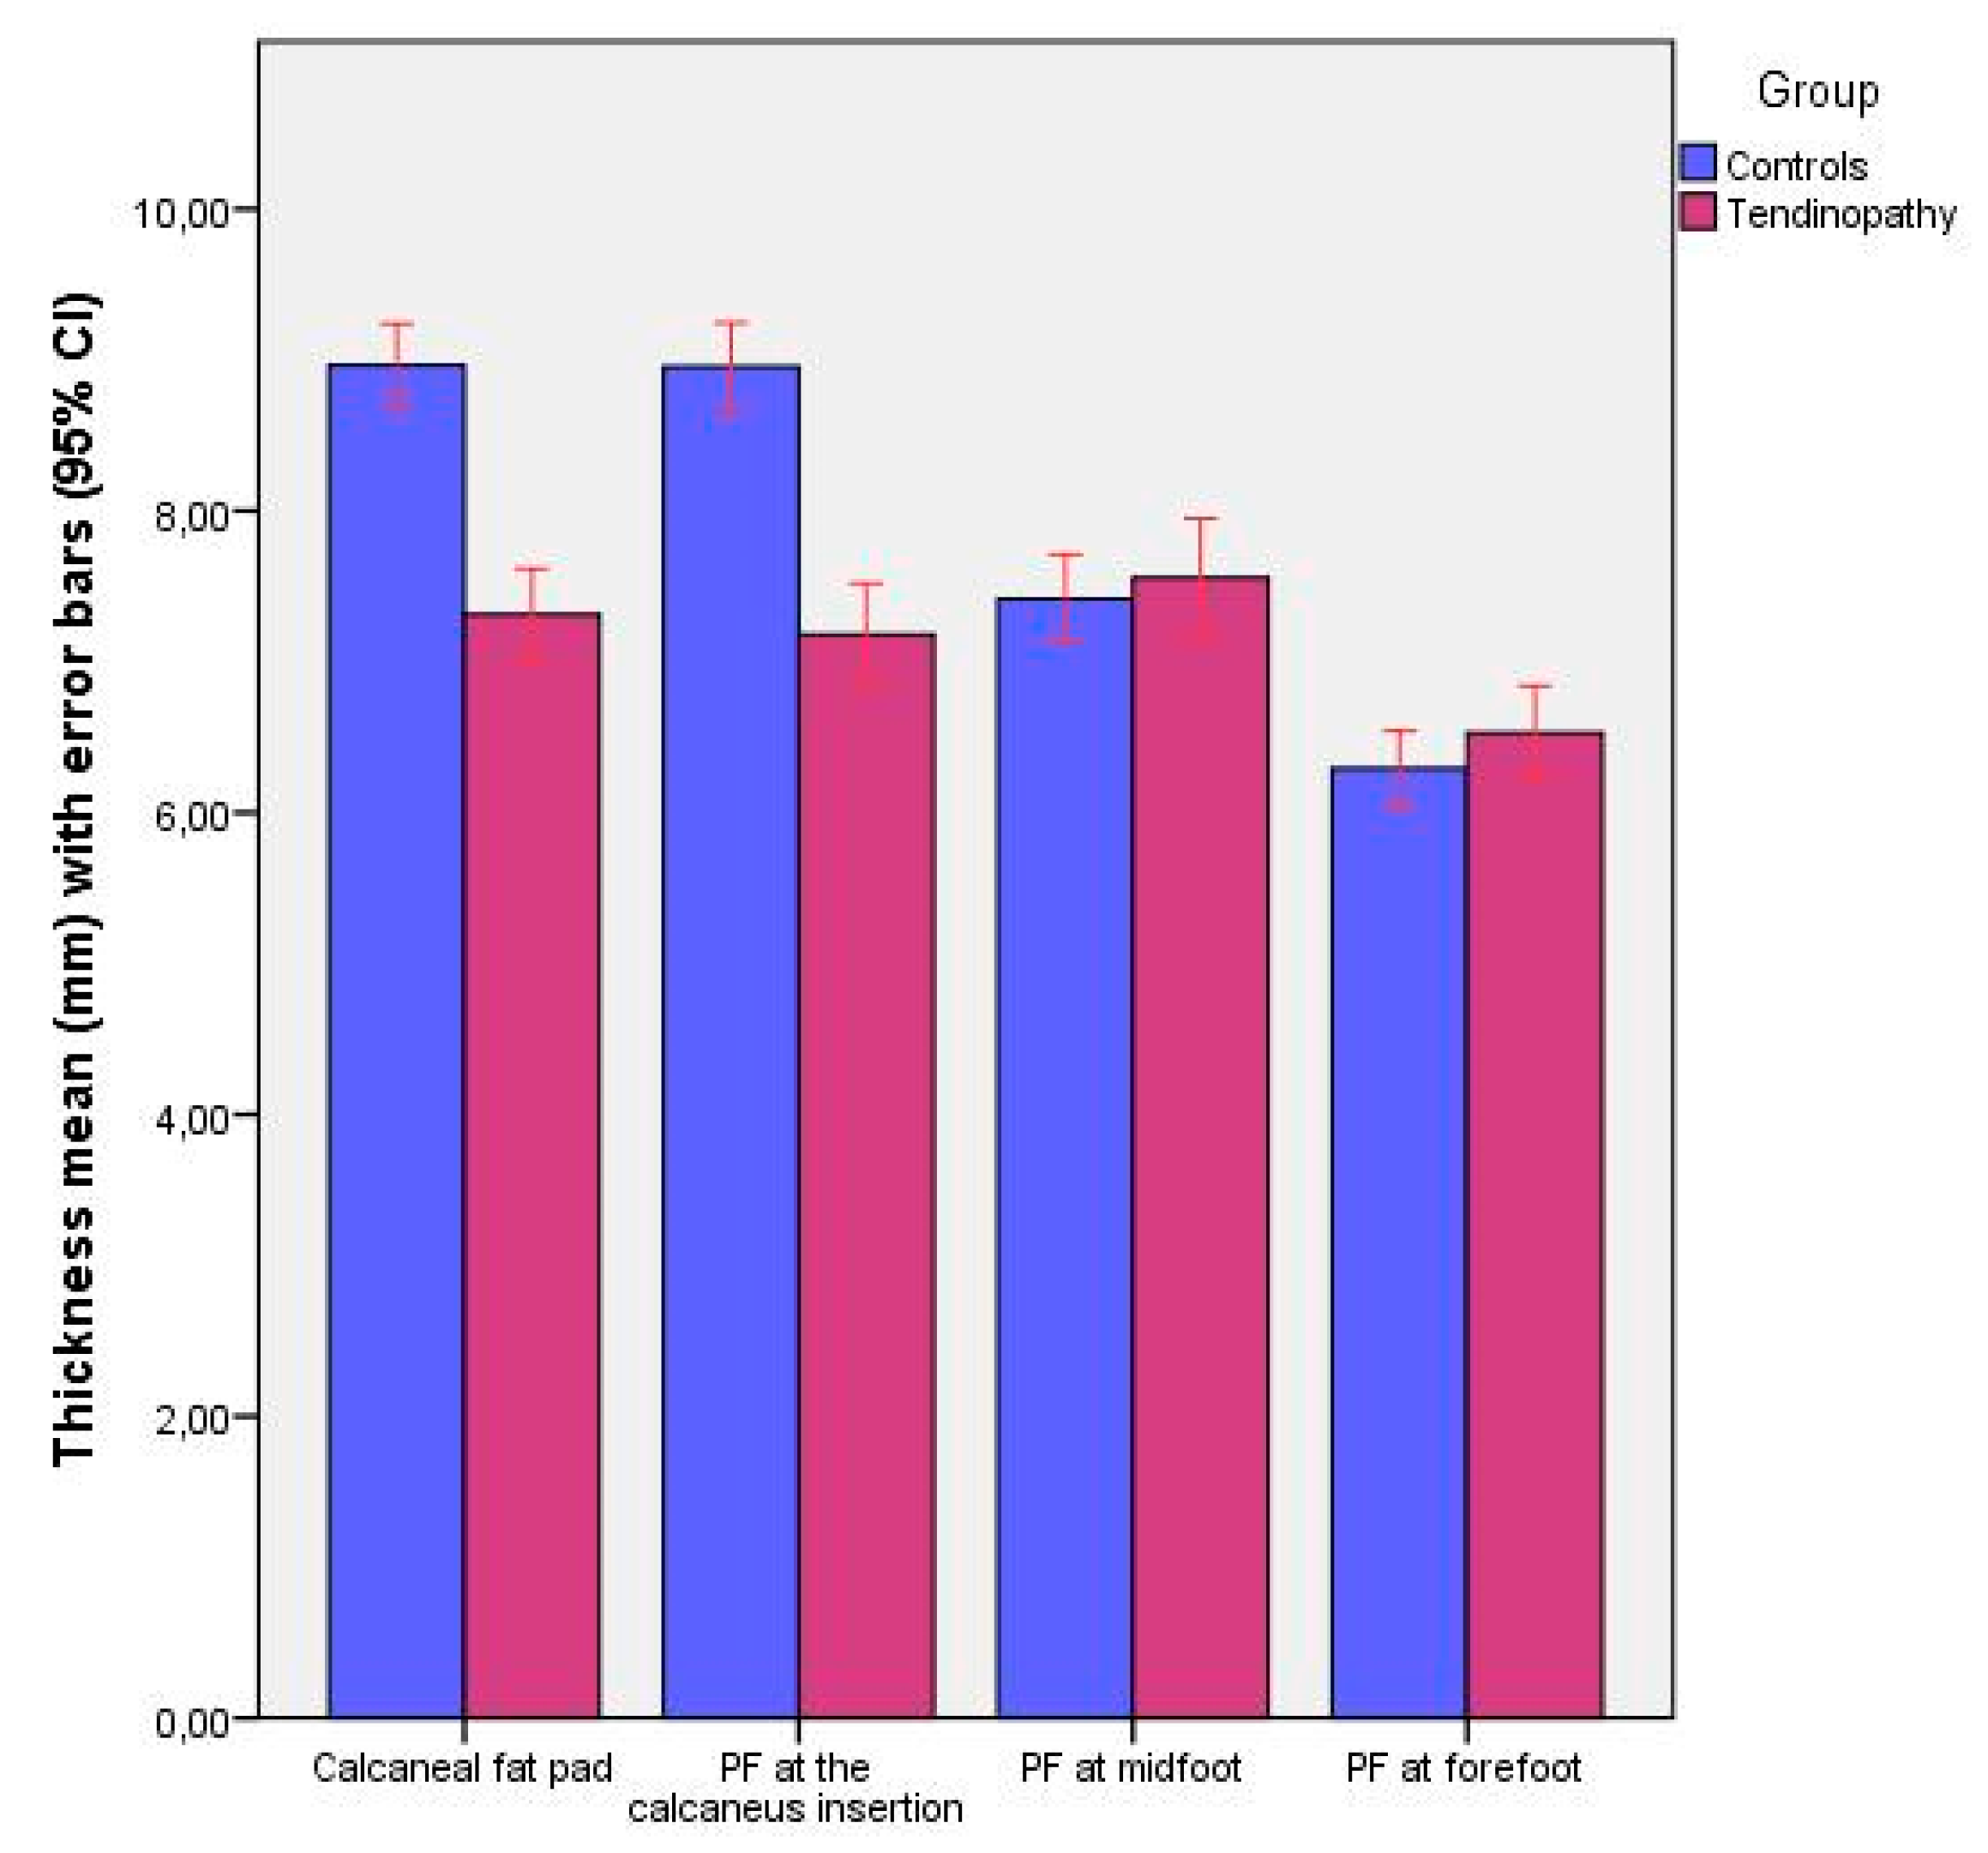
| Calcaneal fat pad | 7.21 ± 1.59 (4.77–11.21) † | 8.87 ± 1.59 (6.68–12.74) † | 0.000 ‡ |
| PF at the calcaneus insertion thickness | 6.99 ± 1.84 (4.30–10.93) † | 8.94 ± 1.65 (6.11–12.62) † | 0.000 ‡ |
| PF at midfoot thickness | 7.55 ± 1.66 (4.72–12.45) * | 7.41 ± 1.24 (4.85–10.43) * | 0.579 ** |
| PF at forefoot thickness | 6.19 ± 1.55 (4.20–10.84) † | 6.32 ± 1.64 (3.83–8.55) † | 0.607 ‡ |
| Parameter | Model | R2 Change | Model R2 |
|---|---|---|---|
| CFP thickness (mm) | 8.226 | ||
| −1.774 * Group | 0.315 ‡ | ||
| +0.985 * Sex | 0.067 ‡ | 0.382 | |
| PF thickness at calcaneus insertion (mm) | 7.371 | ||
| −1.818 * Group | 0.309 ‡ | ||
| + 0.021 * Weight (kg) | 0.023 † | 0.323 |
© 2019 by the authors. Licensee MDPI, Basel, Switzerland. This article is an open access article distributed under the terms and conditions of the Creative Commons Attribution (CC BY) license (http://creativecommons.org/licenses/by/4.0/).
Share and Cite
Romero-Morales, C.; Martín-Llantino, P.J.; Calvo-Lobo, C.; López-López, D.; Sánchez-Gómez, R.; De-La-Cruz-Torres, B.; Rodríguez-Sanz, D. Ultrasonography Features of the Plantar Fascia Complex in Patients with Chronic Non-Insertional Achilles Tendinopathy: A Case-Control Study. Sensors 2019, 19, 2052. https://doi.org/10.3390/s19092052
Romero-Morales C, Martín-Llantino PJ, Calvo-Lobo C, López-López D, Sánchez-Gómez R, De-La-Cruz-Torres B, Rodríguez-Sanz D. Ultrasonography Features of the Plantar Fascia Complex in Patients with Chronic Non-Insertional Achilles Tendinopathy: A Case-Control Study. Sensors. 2019; 19(9):2052. https://doi.org/10.3390/s19092052
Chicago/Turabian StyleRomero-Morales, Carlos, Pedro Javier Martín-Llantino, César Calvo-Lobo, Daniel López-López, Rubén Sánchez-Gómez, Blanca De-La-Cruz-Torres, and David Rodríguez-Sanz. 2019. "Ultrasonography Features of the Plantar Fascia Complex in Patients with Chronic Non-Insertional Achilles Tendinopathy: A Case-Control Study" Sensors 19, no. 9: 2052. https://doi.org/10.3390/s19092052