LoRaWAN Battery-Free Wireless Sensors Network Designed for Structural Health Monitoring in the Construction Domain

 , , ,
, , ,
Abstract
:1. Introduction
2. Design and Implementation of the Prototype of Sensing Nodes
2.1. Topology of the Sensing Nodes
2.2. Rectennas
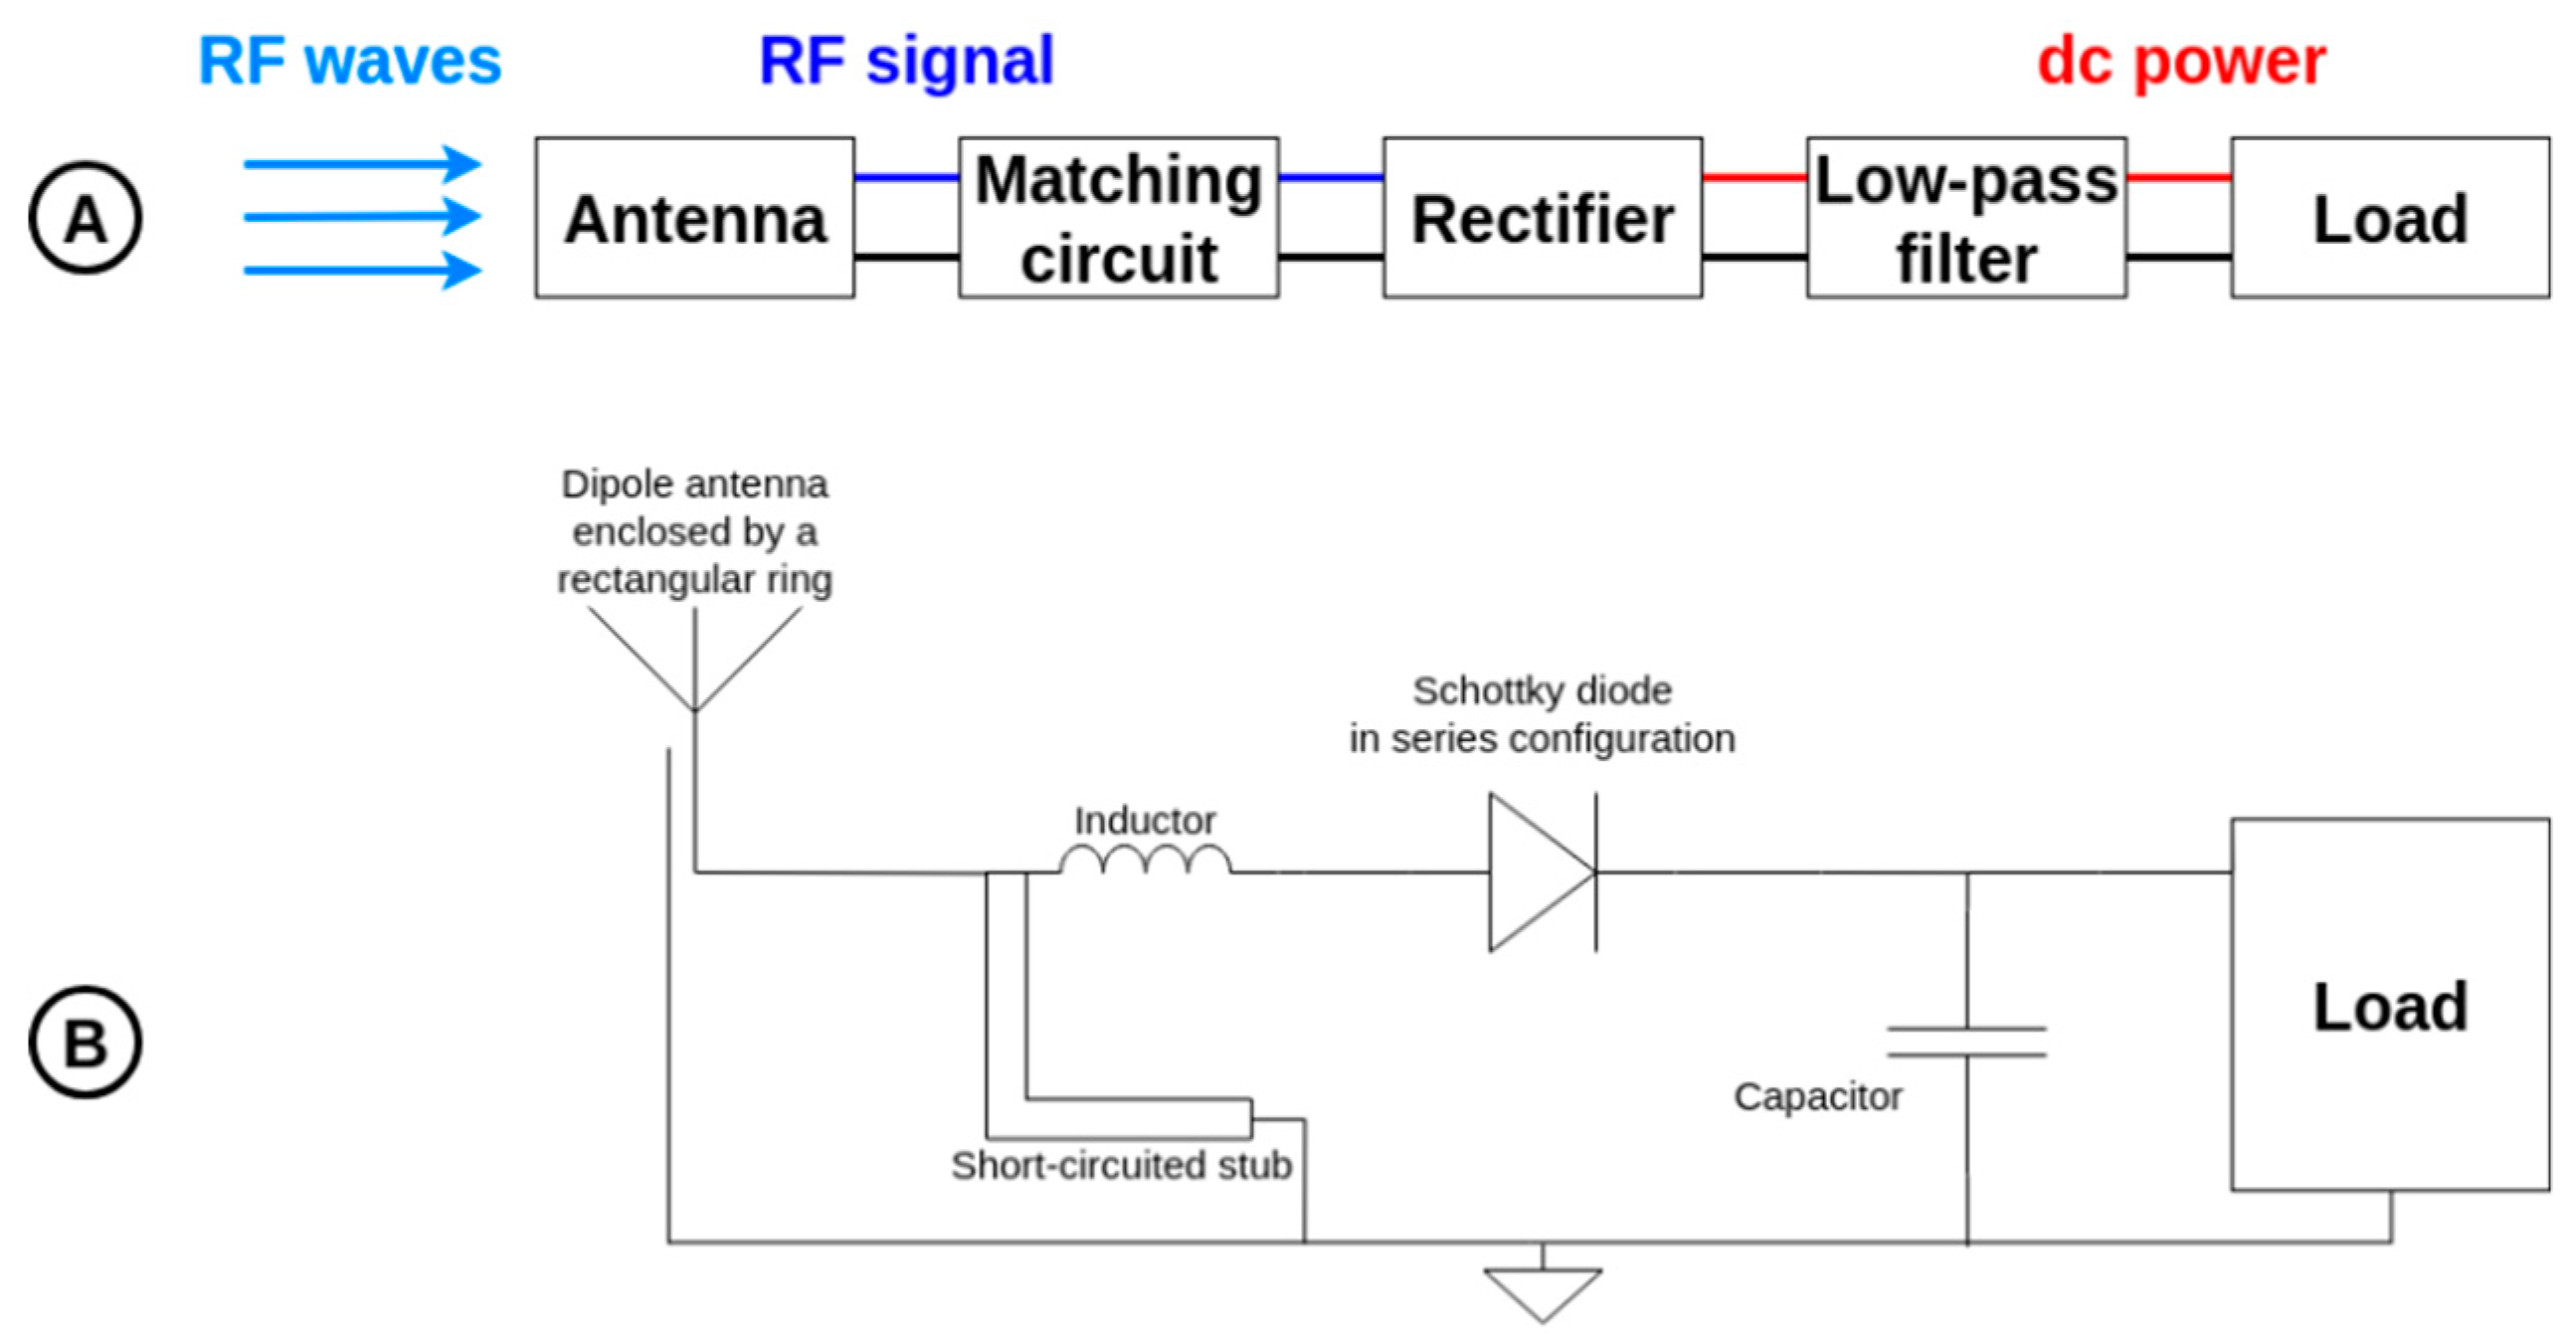
- (i)
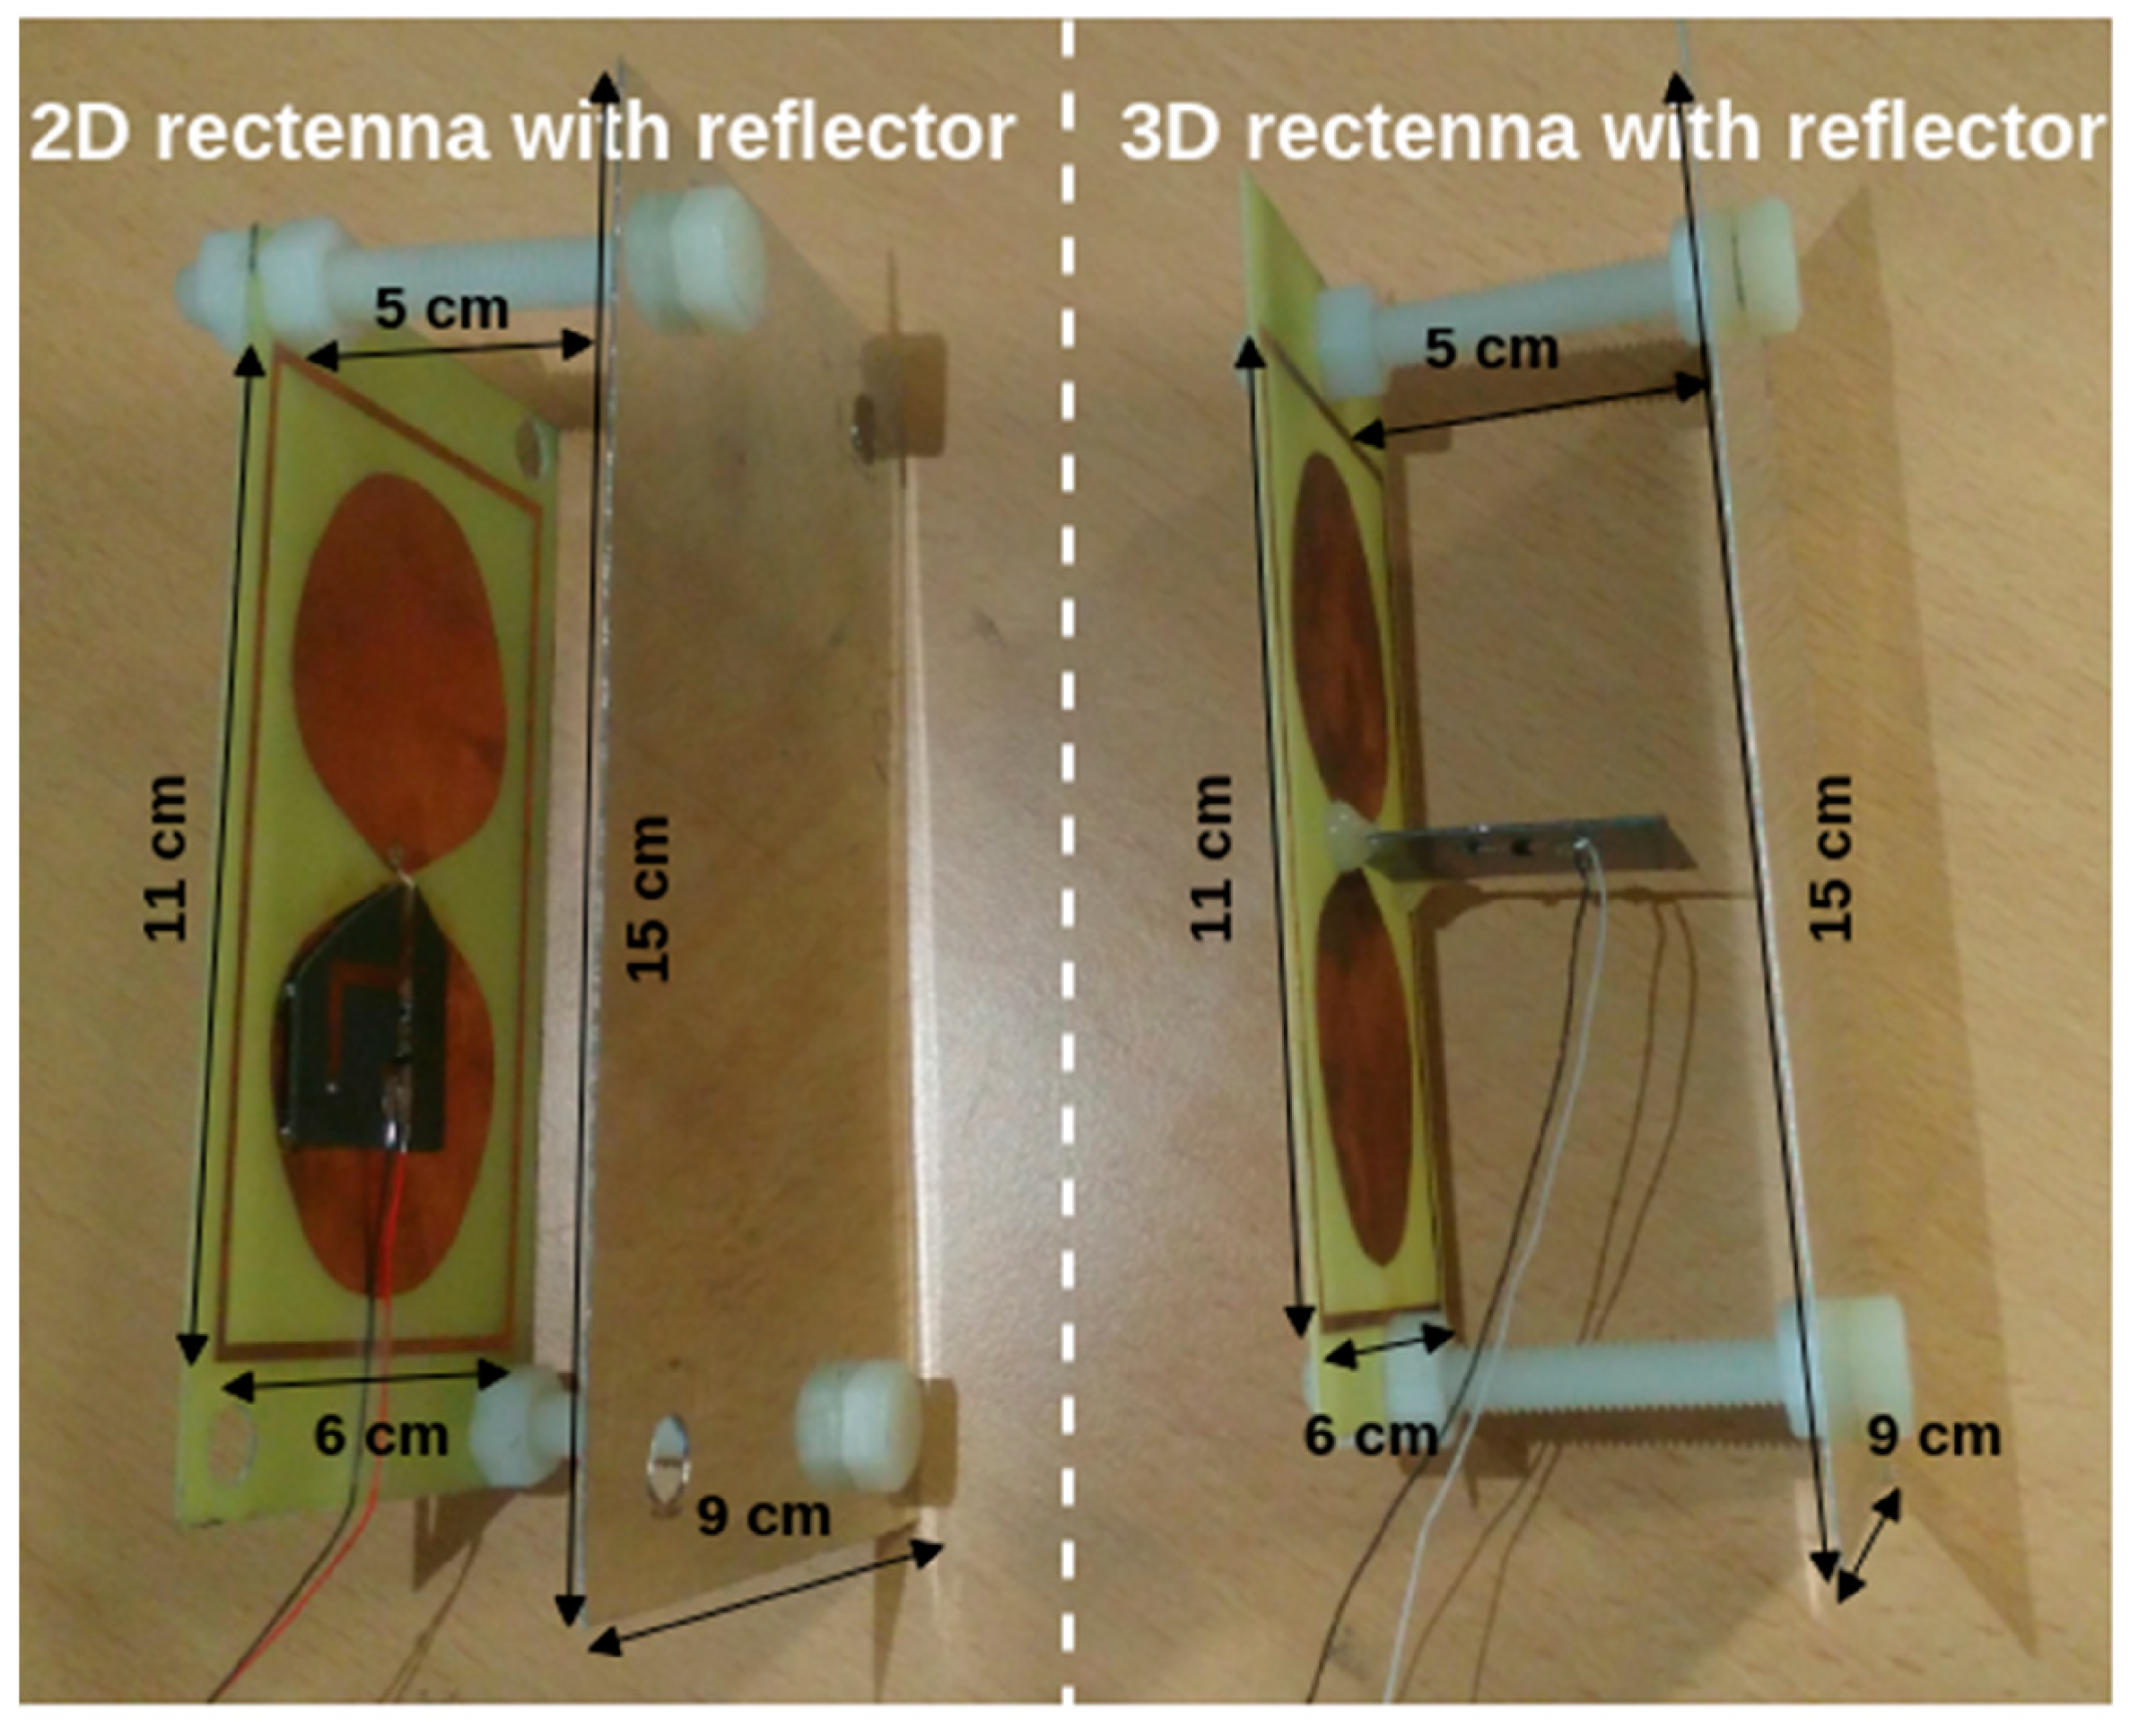
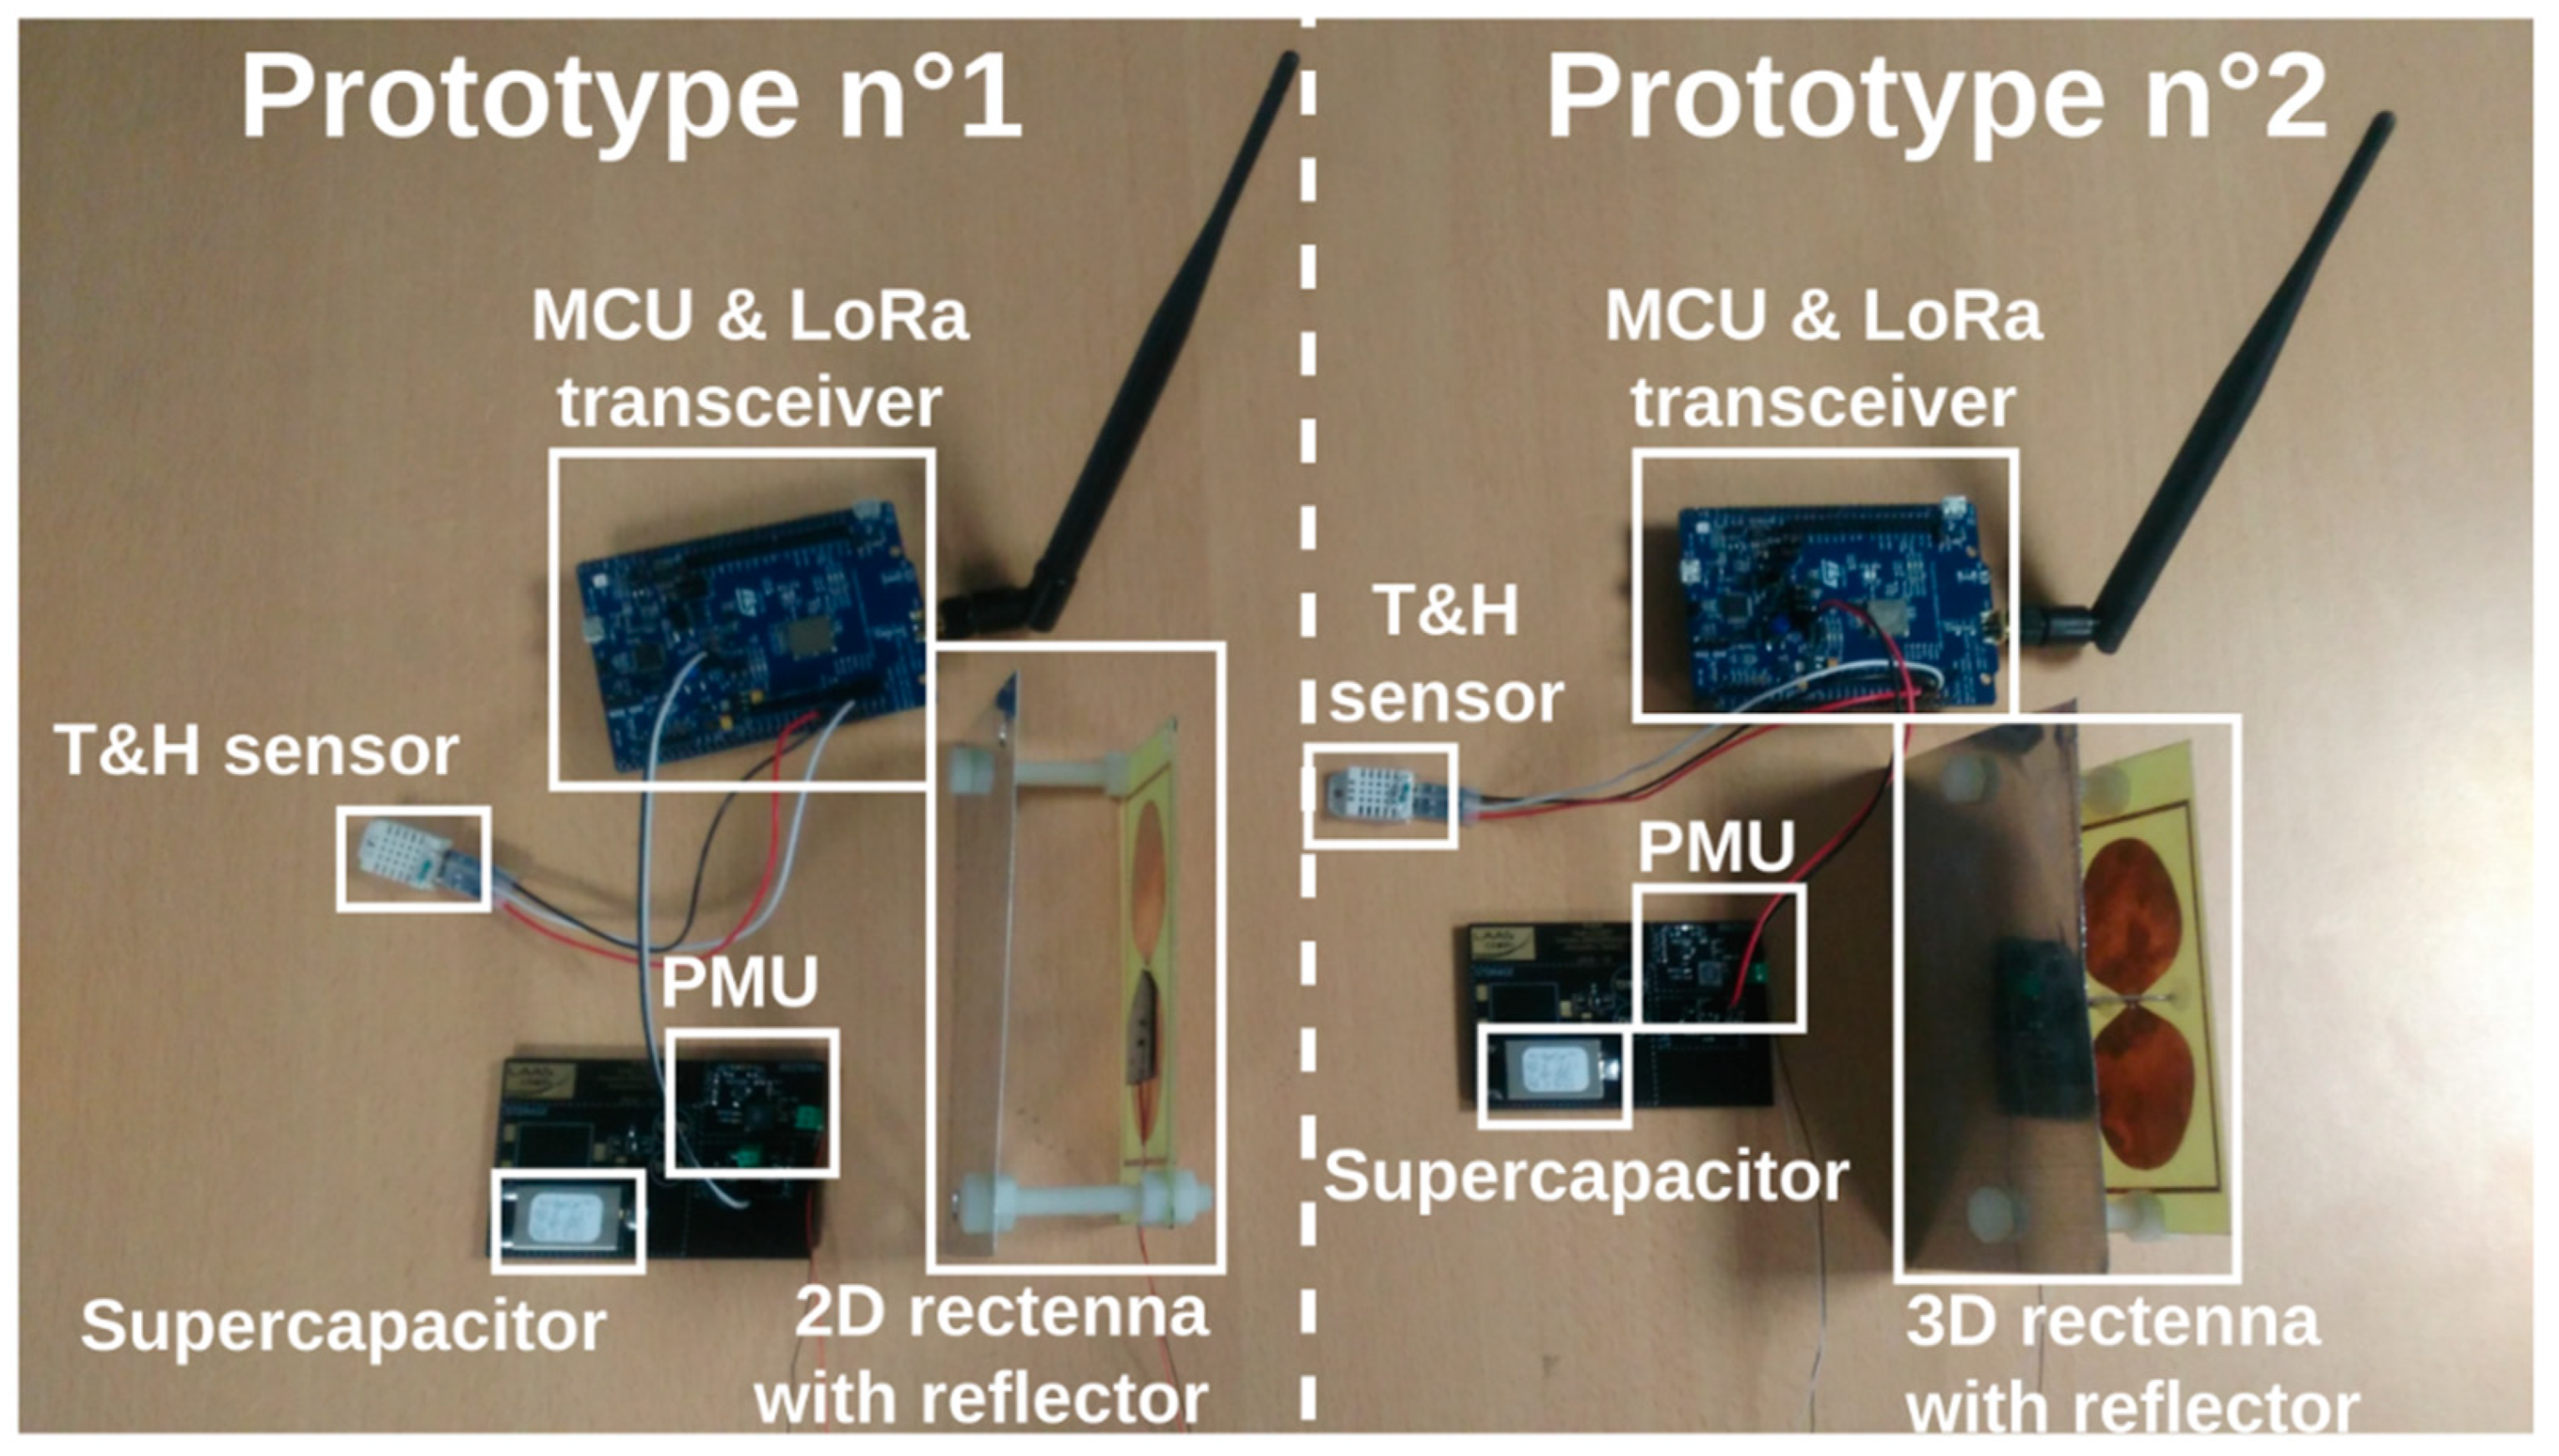
- a compact (11 cm × 6 cm) and broadband dipole antenna enclosed by a rectangular ring [31], manufactured on FR4 substrate (thickness: 0.8 mm, relative electric permittivity: 4.4 and loss tangent: 0.02) which captures and converts the generated electromagnetic energy field into a RF signal around the ISM 868 MHz band. Its simulated (HFSS—High Frequency Structure Simulator—from Ansys Inc. (Canonsburg, PA, USA)) maximal gain is +2.2 dBi at this frequency.
- (ii)
- a single Schottky diode (Broadcom Inc. (San Jose, CA, USA) HSMS 2850 mounted in series configuration) high-frequency RF rectifier (manufactured on Rogers Corporation (Chandler, AZ, USA) RT/Duroid 5870 substrate, thickness: 0.787 mm, relative electric permittivity: 2.3 and loss tangent: 0.0012) which converts the guided RF signal into DC power. For the first rectenna, the RF rectifier is connected with the antenna in an overlapping manner to have a planar two-dimensional (2D) rectenna. For the second rectenna, the RF rectifier is orthogonally connected with the antenna to have a three-dimensional (3D) rectenna.
- (iii)
- a metallic reflector (15 cm × 9 cm) positioned at 5 cm behind the rectennas (2D and 3D), which can increase the antenna gain (respectively from +2.2 dBi to +6.6 dBi) while having a three-dimensional structure comparable in terms of volume with the three-dimensional rectenna used in [32]. The manufactured rectennas are represented in Figure 6.
2.3. Power Management Unit
2.4. Supercapacitor
2.5. Microcontroller Unit and LoRa Transceiver
2.6. Temperature and Relative Humidity Sensor
2.7. Complete Operation
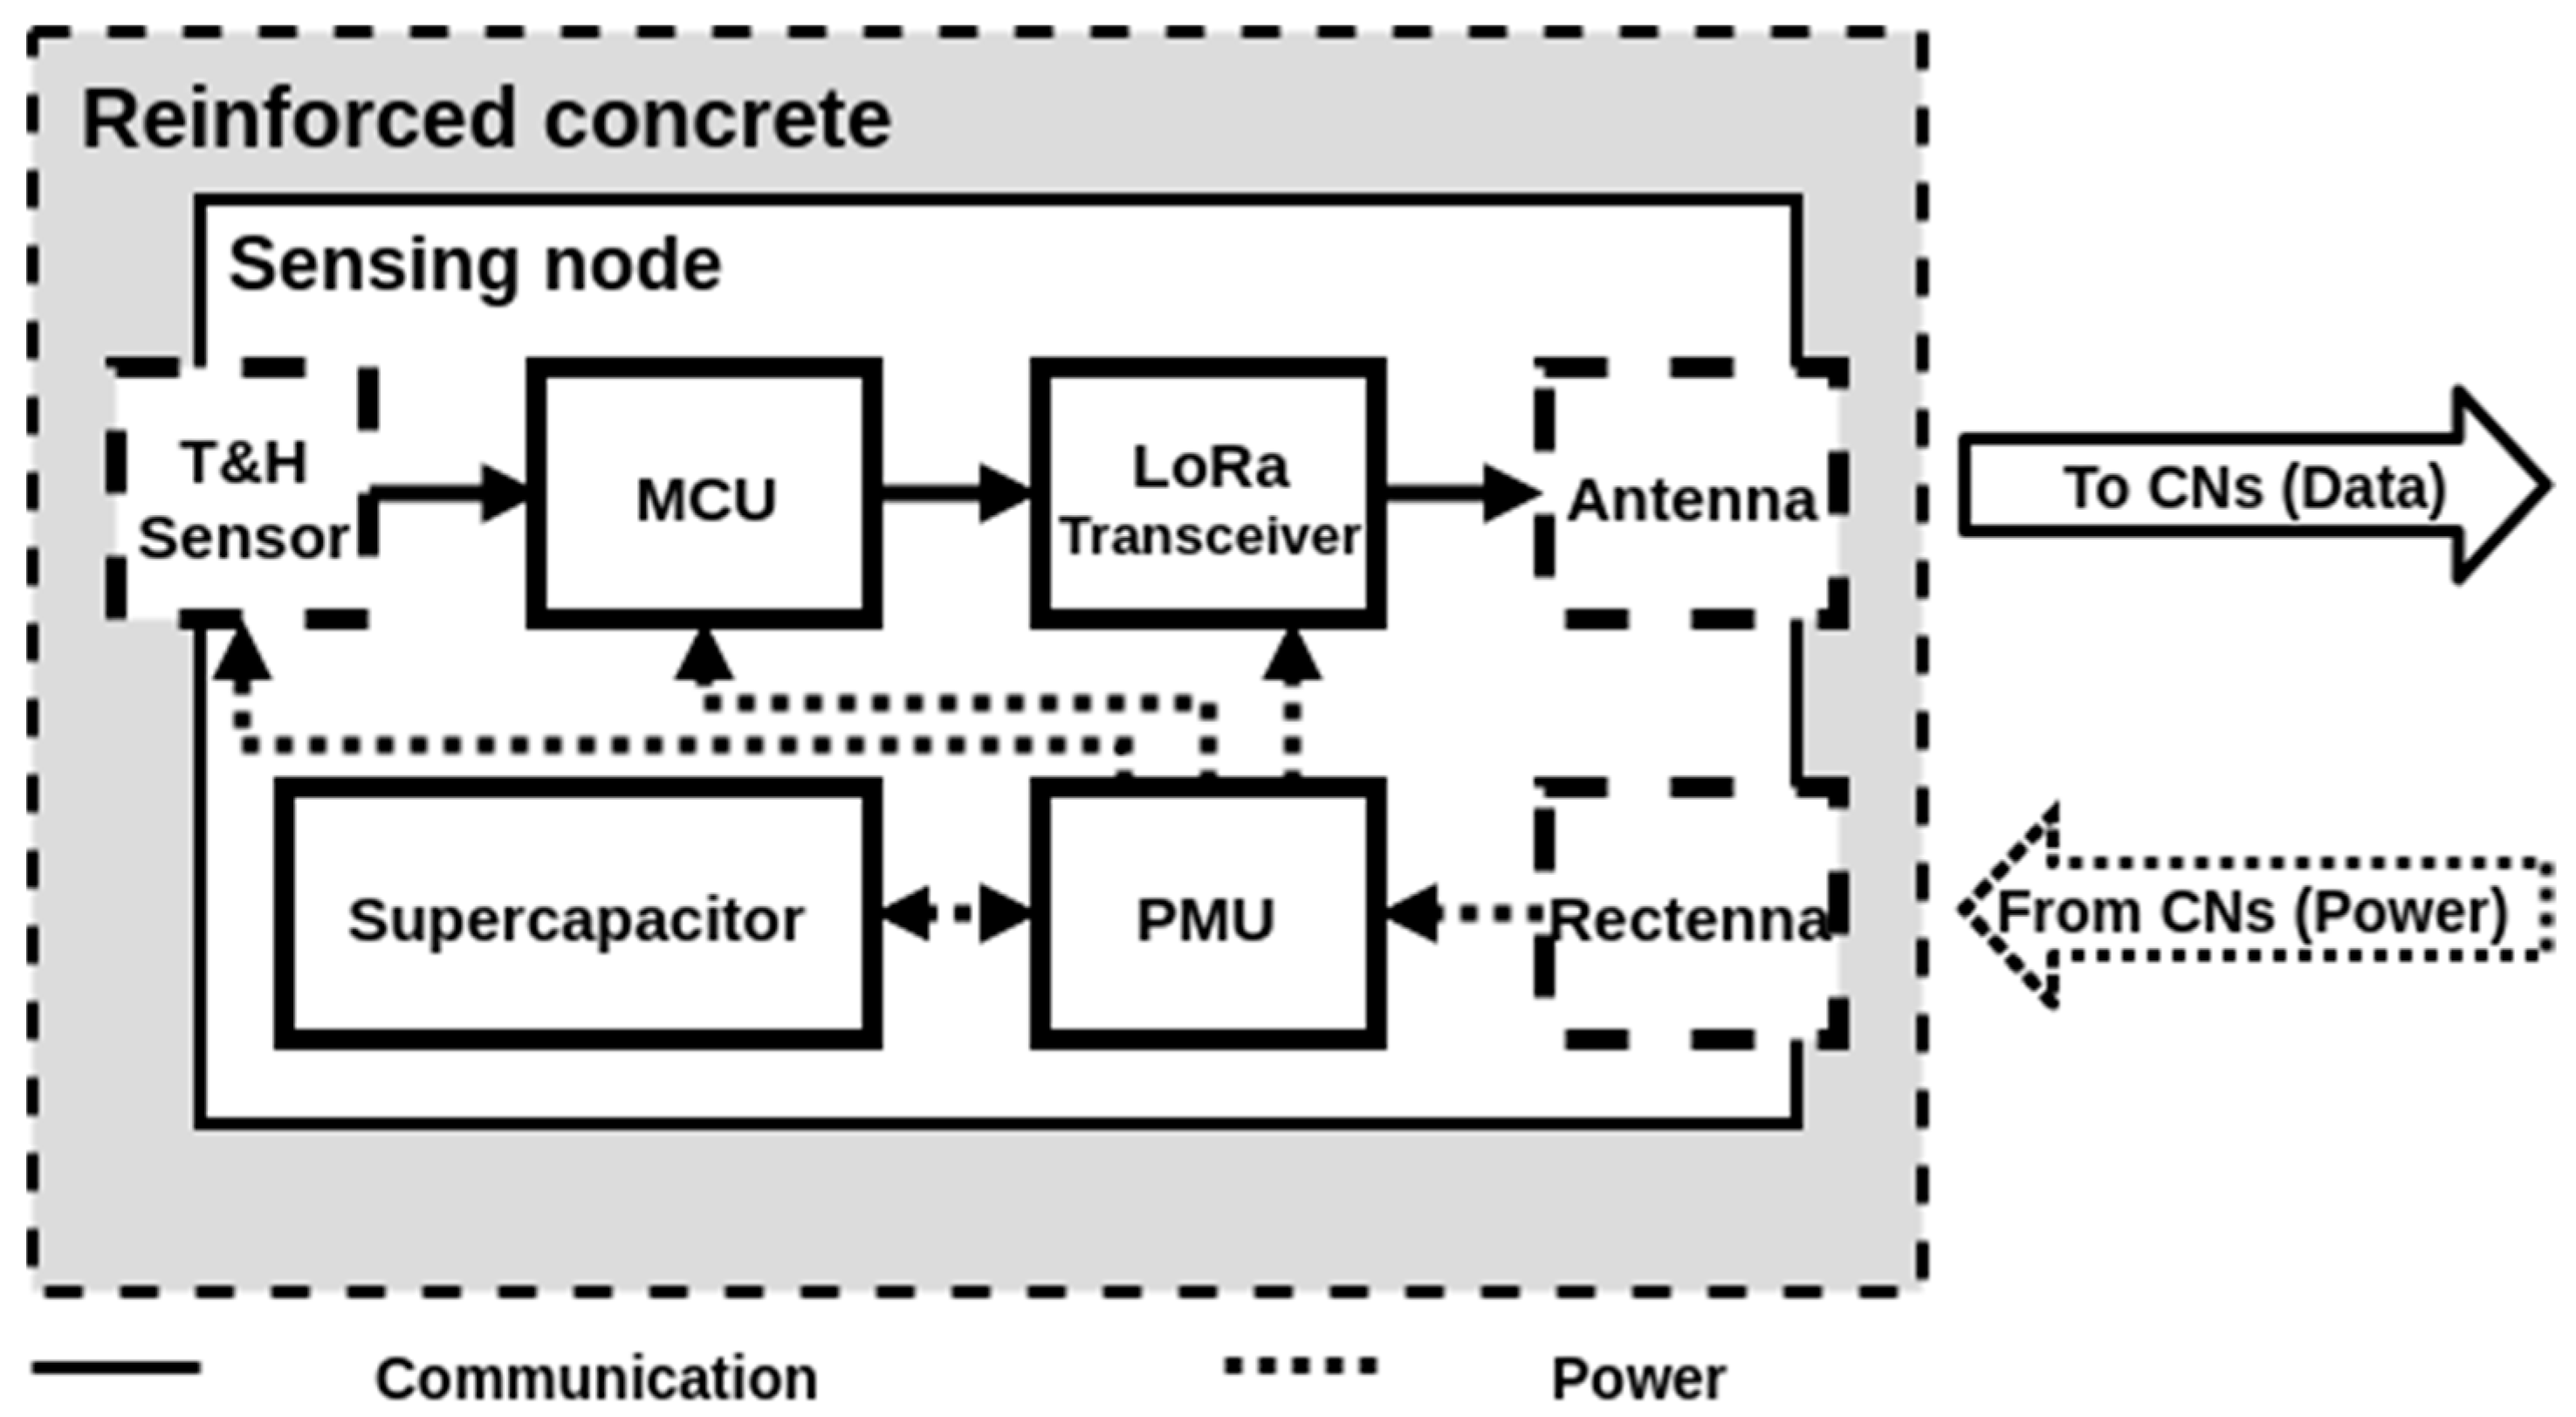
- (i)
- the energy autonomy is performed by the WPT system (RF power source and rectennas), the supercapacitor and the PMU;
- (ii)
- the measurement is performed by a temperature and relative humidity sensor;
- (iii)
- the unidirectional wireless communication is warranted by the developed software implemented in the MCU and the LoRa transceiver; and
- (iv)
- the reconfigurability of the periodicity of measurement and data communication is possible by tuning the amount of transmitted power via the RF source.
3. Experimental Results
3.1. Individual Sensing Node Prototype Characterization
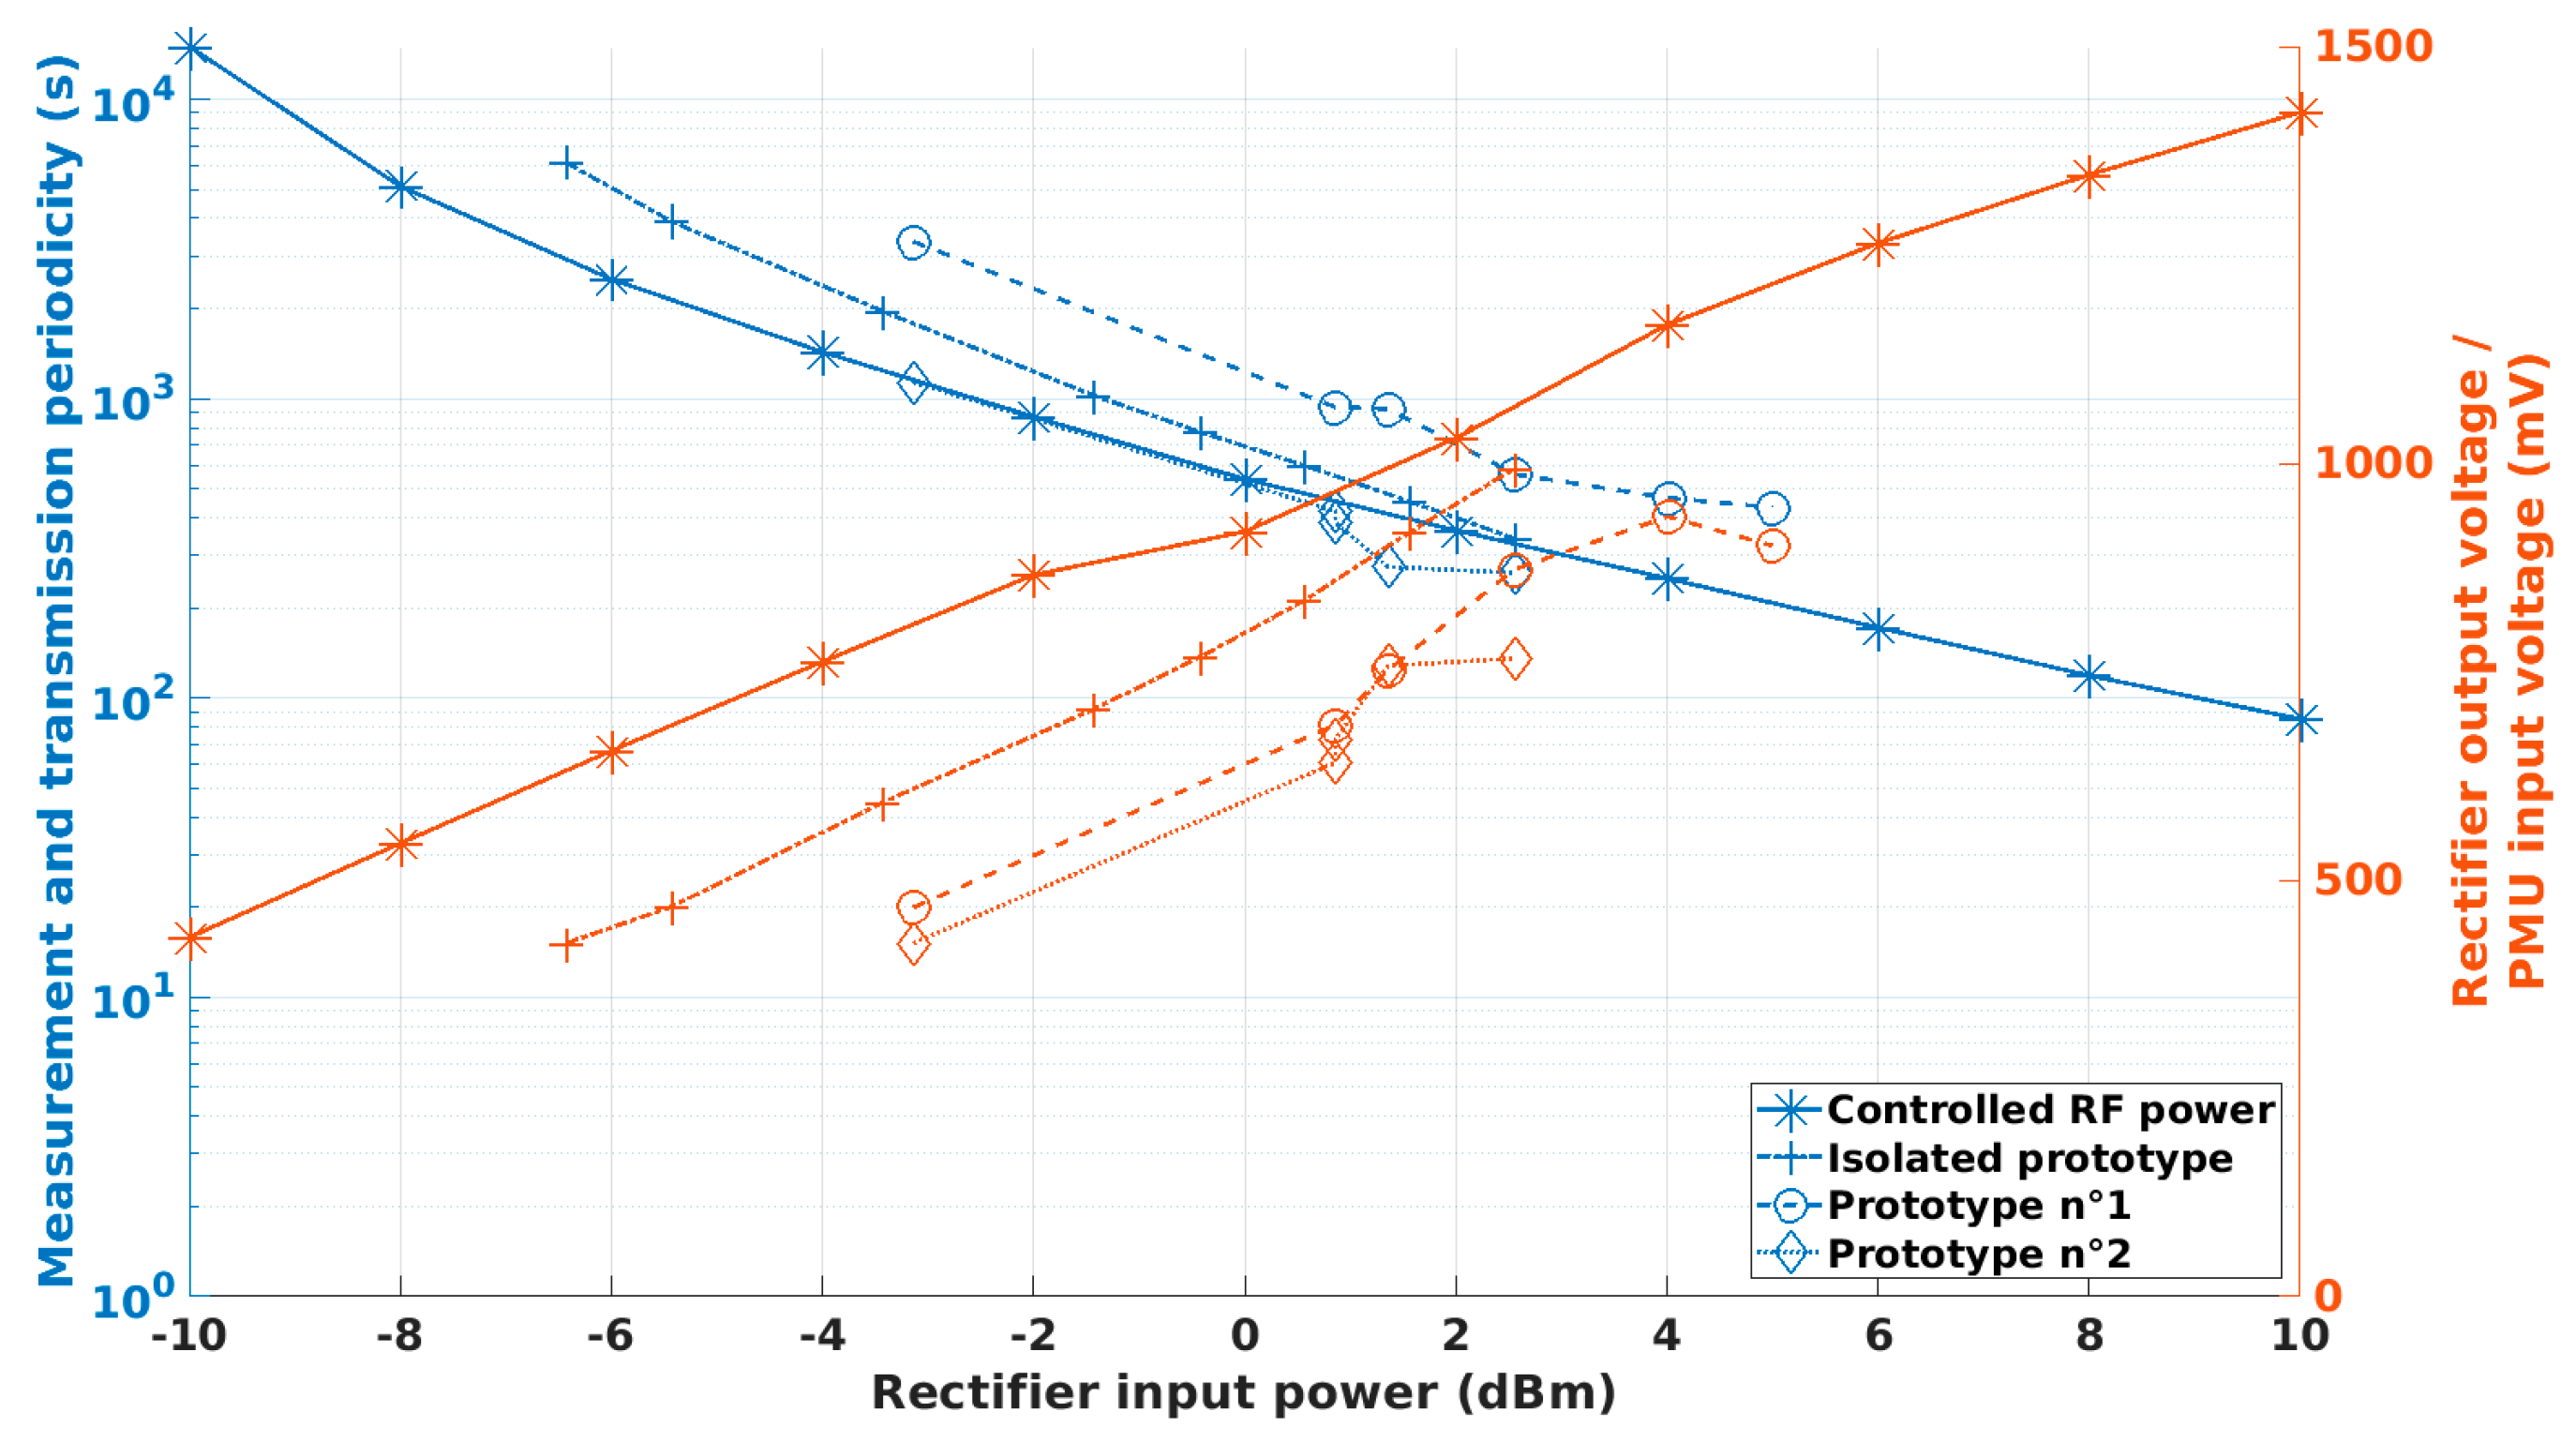
3.1.1. Experimental Results with Controlled RF Power at the Input of the RF Rectifier
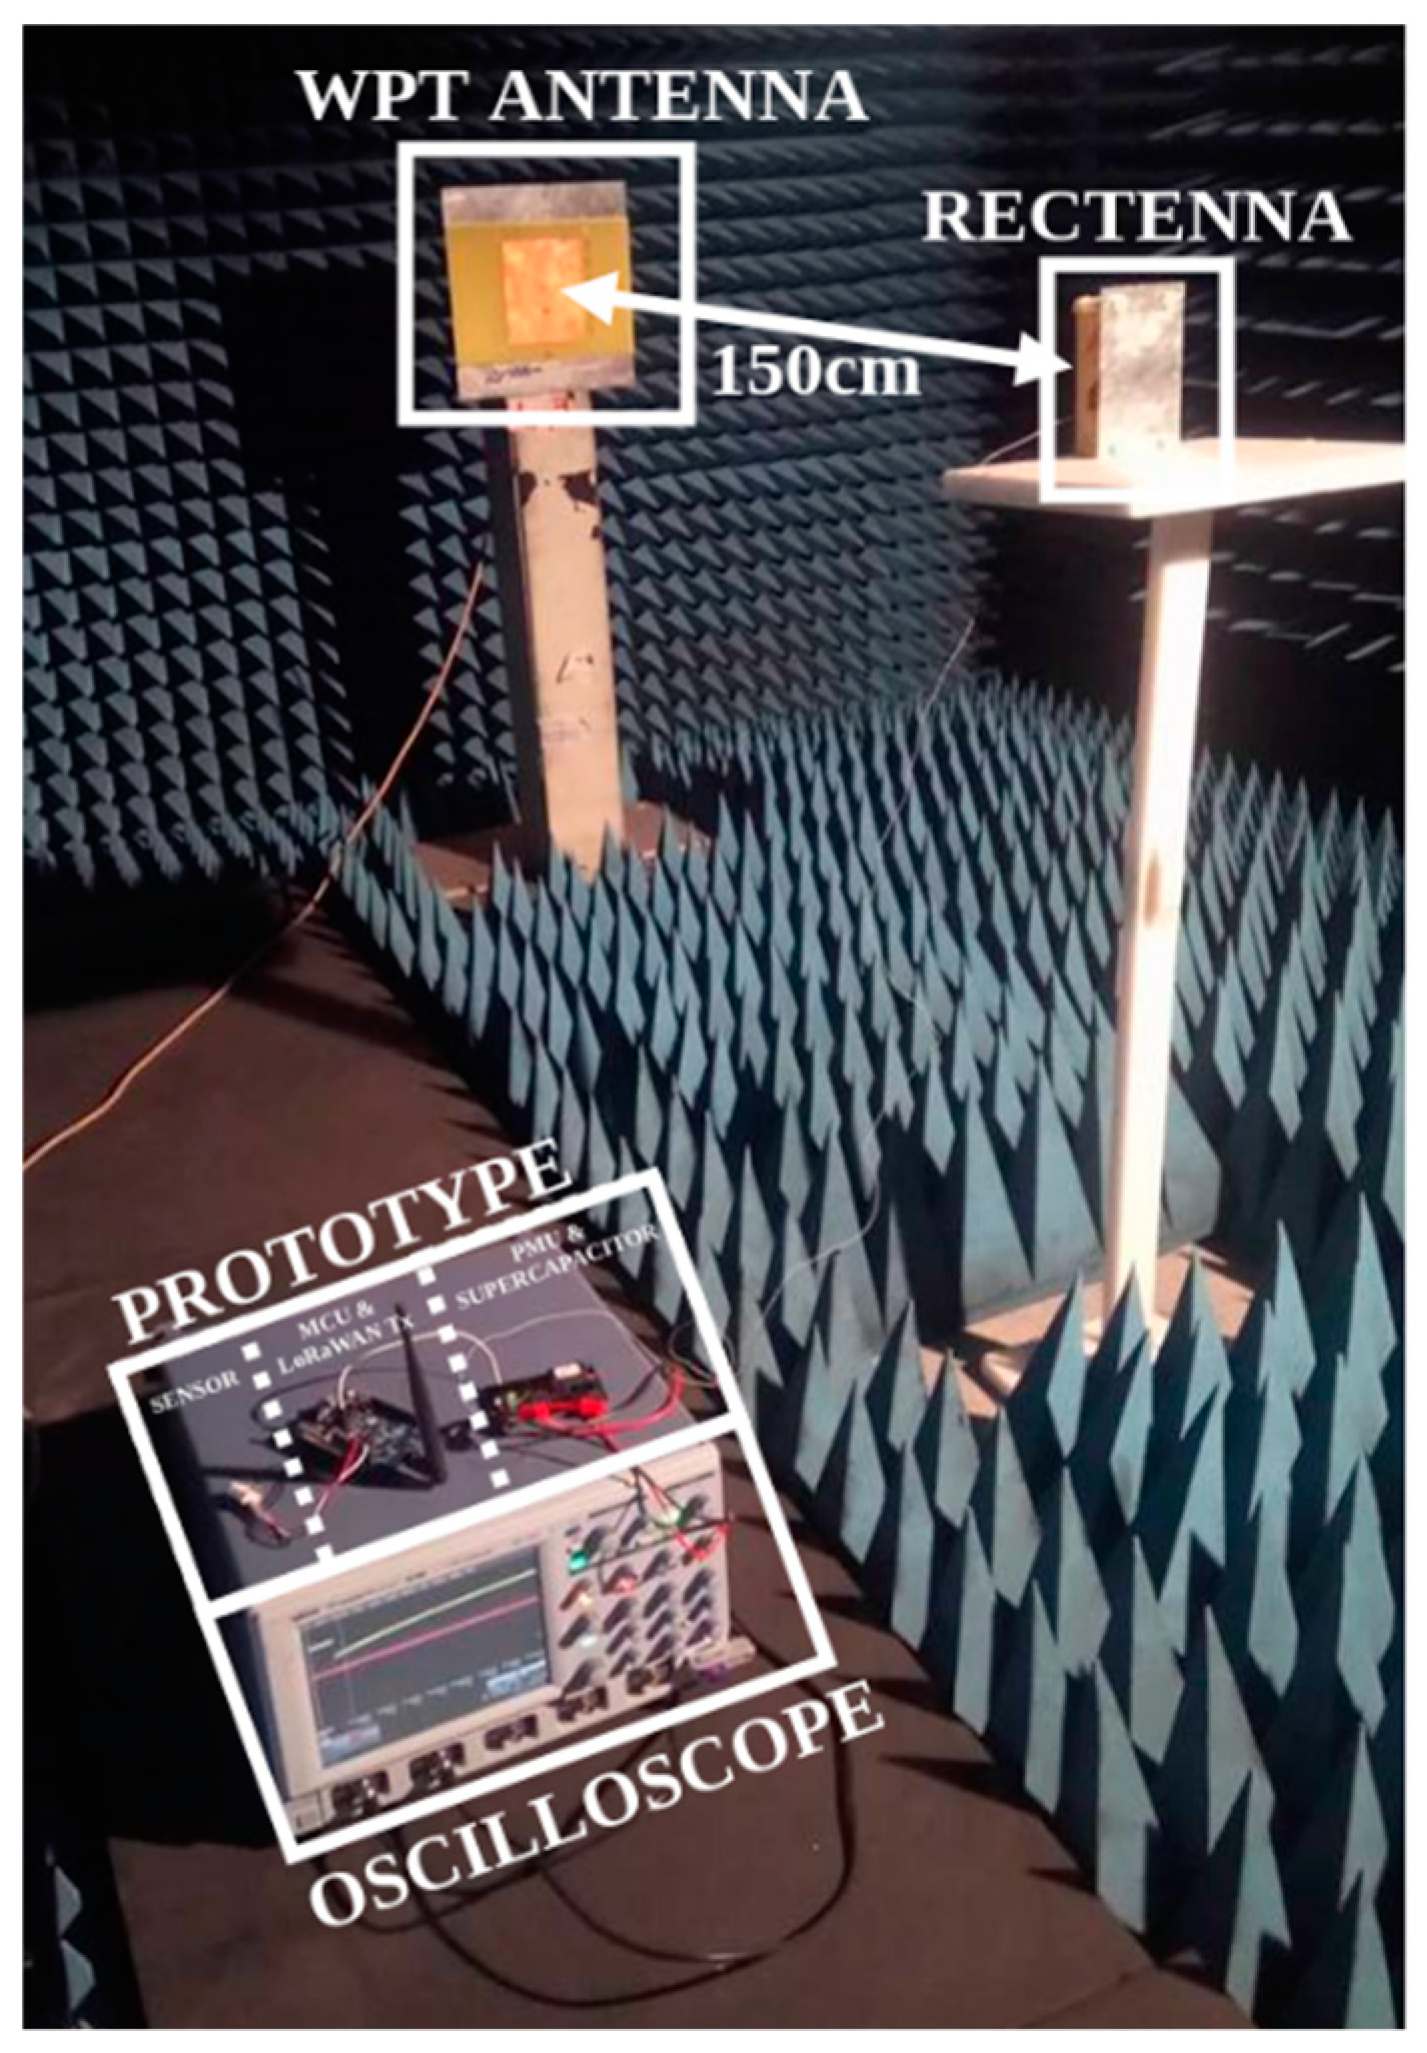
3.1.2. Experimental Results with Controlled WPT System in an Anechoic Chamber
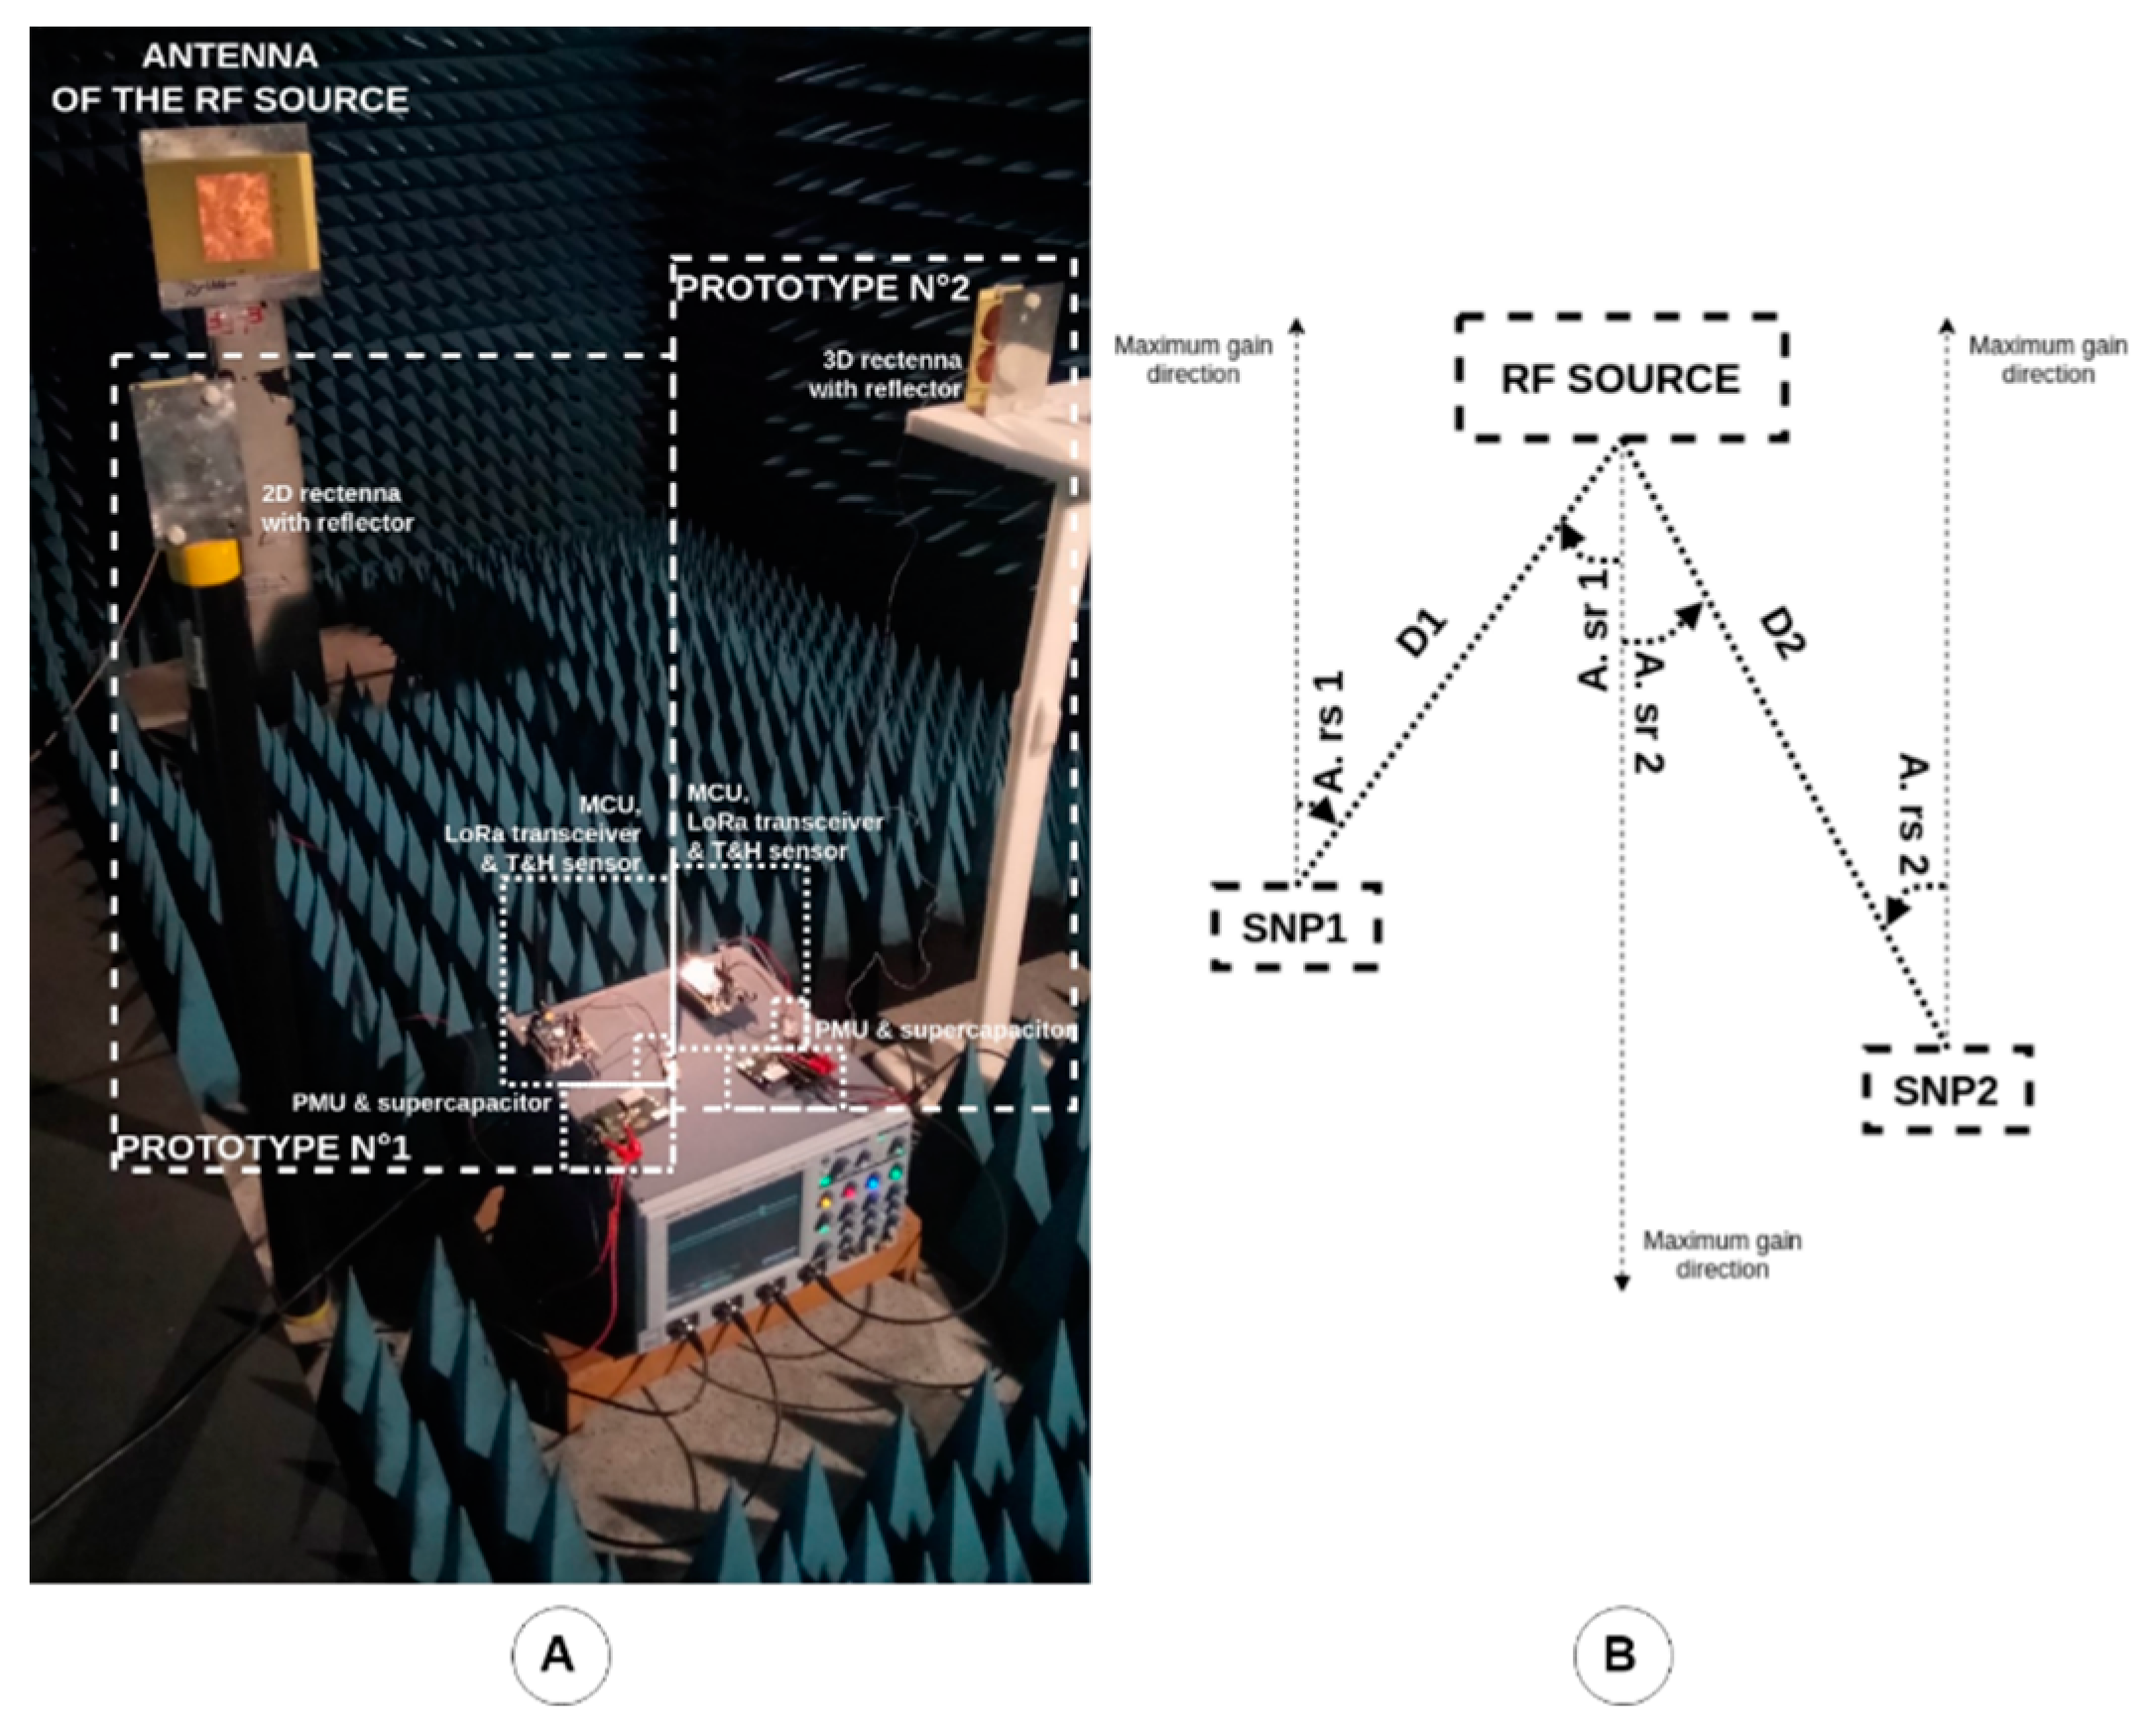
3.2. Deployment of a Network of Two Prototypes
- (i)
- to check that a unique RF power source is sufficient to power many sensing nodes in a defined area;
- (ii)
- to have a first idea of the undesired interactions between the SN prototypes (i.e., coupling interferences, multipath effects, etc.); and
- (iii)
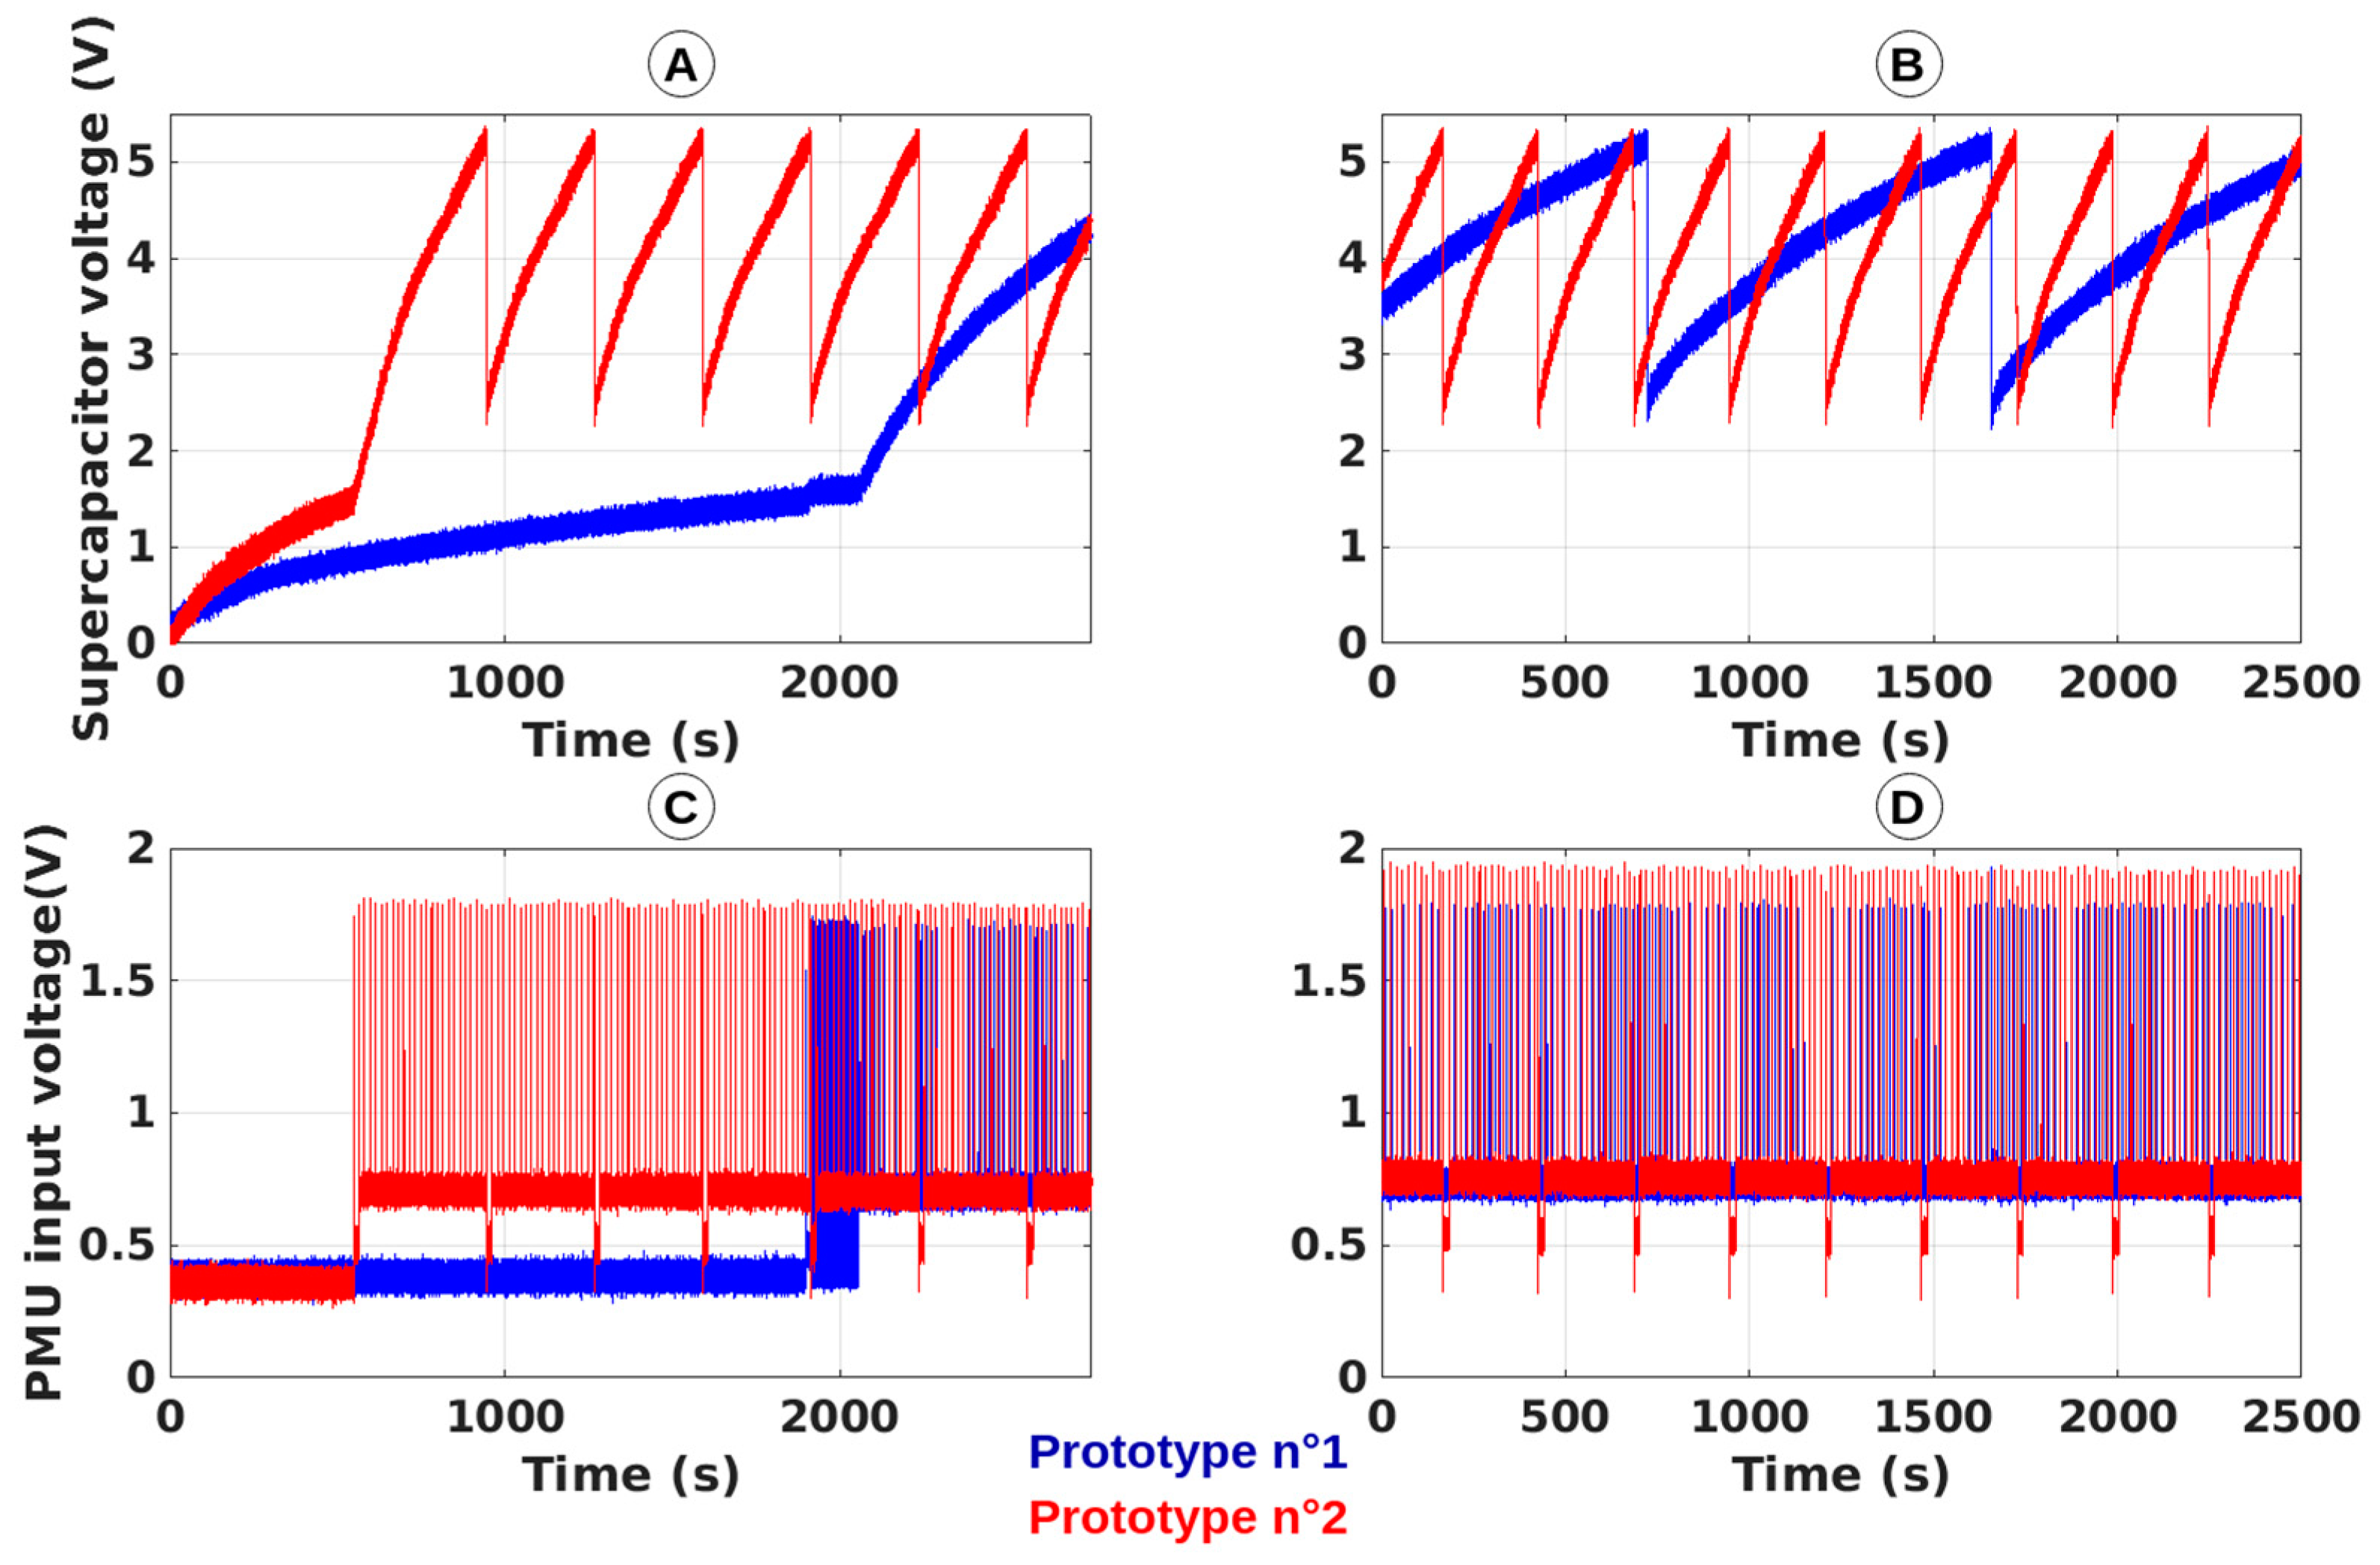
- to estimate the diversity in the performances induced by the intrinsic differences of the components (e.g., rectenna, PMU board, etc.) used to build the two prototypes. The SN prototype using the 2D rectenna with the metallic reflector is named Prototype no. 1 (SNP1) and the SN prototype using the 3D rectenna with the metallic reflector is named Prototype no. 2 (SNP2).
- (i)
- both SN prototypes were tested alone in the same configuration to gain an idea of the intrinsic differences/diversity between SN prototypes;
- (ii)
- both rectennas of the SN prototypes were illuminated with the same power density and for two different values to have an idea of the diversity between SN prototypes;
- (iii)
- both rectennas of the SN prototypes were illuminated with the same power density to have an idea of the impact of the orientation of the rectenna according to the direction of the maximal gain of the antenna of the RF source; and
- (iv)
- both rectennas of the SN prototypes were illuminated with different power densities to have an idea of the impact of a SN prototype on the other.
- (i)
- as expected, a unique RF source can efficiently wirelessly power several sensing nodes located in a dedicated area. The actual RF source (composed of the RF signal generator and the patch antenna) can generate a power density of 0.5 µW/cm2—which is enough to power the SN prototypes—at a maximum distance of 550 cm in the direction the maximal gain and at 390 cm for an angle of 30° for an EIRP of 2W or +33 dBm (maximum EIRP value authorized by regulation [30]), according to Equations (2) and (3).
- (ii)
- the acquired results are coherent with those obtained during the characterization of each prototype with some small discrepancies.
- (iii)
- there are some inconsistencies between the measurements performed with the two SN prototypes for which the only major difference is related to the rectennas used (2D rectenna with reflector plan for SNP1 and 3D rectenna with reflector plan for SNP2). This difference can be explained by the intrinsic diversity of the building blocks of our prototypes (especially the rectenna, the PMU and the supercapacitor), by the approximation in the calculation of the generated power densities and RF power at the input of the rectifiers and by the errors during the experiments and measurements.
- (iv)
- as expected, the orientation of the rectenna regarding the direction of the maximal gain of the RF source antenna has an influence by changing the ‘relative’ gain of the antenna integrated into the rectenna, with respect to the direction of the incoming electromagnetic waves generated by the RF source.
- (v)
- some interactions between the different SN prototypes were observed during the experiments. Prototype no. 2 was fixed and its rectifier output voltages, thus the periodicities of its measurement and transmission, are influenced by the location of prototype no. 1. Multipath effect and coupling can justify these observations.
4. Discussions
4.1. Improvements Achieved
4.2. Future Work
4.3. Temperature and Humidity Sensor Choice
5. Conclusions
Author Contributions
Funding
Acknowledgments
Conflicts of Interest
References
- Bhuiyan, M.Z.A.; Wu, J.; Wang, G.; Cao, J.; Jiang, W.; Atiquzzaman, M. Towards Cyber-Physical Systems Design for Structural Health Monitoring: Hurdles and Opportunities. ACM Trans. Cyber-Phys. Syst. 2017, 1, 1–19. [Google Scholar] [CrossRef]
- Noel, A.B.; Abdaoui, A.; Elfouly, T.; Ahmed, M.H.; Badawy, A.; Shehata, M.S. Structural health monitoring using wireless sensor networks: A comprehensive survey. IEEE Commun. Surv. Tutor. 2017, 19, 1403–1423. [Google Scholar] [CrossRef]
- Alahakoon, S.; Preethichandra, D.M.; Ekanayake, E.M. Sensor network applications in structures—A survey. EJSE Spec. Issue Sens. Netw. Build. Monit. Theory Real Appl. 2009, 1–10. [Google Scholar]
- What Is BIM? Available online: https://www.autodesk.com/solutions/bim (accessed on 27 November 2018).
- Kubler, S.; Derigent, W.; Thomas, A.; Rondeau, E. Problem definition methodology for the ‘Communicating Material’ paradigm. IFAC Proc. Vol. 2010, 43, 198–203. [Google Scholar] [CrossRef]
- Jover, J. Contribution à la Réduction des Pertes D’informations dans l’industrie du bois: Utilisation de la Résonance Quadrupolaire Nucléaire pour l’identification de Marqueurs Chimiques et de la Virtualisation du Processus de Production pour la Détermination de Nomenclatures Divergentes. Ph.D. Dissertation, Université de Lorraine, Nancy, France, 2013. [Google Scholar]
- Kubler, S.; Derigent, W.; Thomas, A.; Rondeau, E. Prototyping of a communicating textile. In Proceedings of the International Conference on Industrial Engineering and Systems Management (IESM), Metz, France, 25–27 May 2011. [Google Scholar]
- Johann, S.; Strangfeld, C.; Müller, M.; Mieller, B.; Bartholmai, M. RFID sensor systems embedded in concrete–requirements for long–term operation. Mater. Today Proc. 2016, 4, 5827–5832. [Google Scholar] [CrossRef]
- McBIM Research Project. Available online: http://www.agence-nationale-recherche.fr/en/anr-funded-project/?tx_lwmsuivibilan_pi2%5BCODE%5D=ANR-17-CE10-0014 (accessed on 27 November 2018).
- Kosmatka, S.H.; Kerkhoff, B.; Panarese, W.C. Design and Control of Concrete Mixtures, 14th ed.; Portland Cement Assoc.: Skokie, IL, USA, 2002; p. 358. [Google Scholar]
- Gallucci, L.; Menna, C.; Angrisani, L.; Asprone, D.; Moriello, R.S.L.; Bonavolontà, F.; Fabbrocino, F. An embedded wireless sensor network with wireless power transmission capability for the structural health monitoring of reinforced concrete structures. Sensors 2017, 17, 2566. [Google Scholar] [CrossRef]
- Ikonen, J.; Knutas, A.; Hämäläinen, H.; Ihonen, M.; Porras, J.; Kallonen, T. Use of embedded RFID tags in concrete element supply chains. J. Inf. Technol. Constr. (ITCON) 2013, 18, 119–147. [Google Scholar]
- 360SmartConnect (Trans en Provence, France). Available online: https://www.360sc.io/ (accessed on 27 November 2018).
- Sensohive (Odense, Denmark). Available online: https://sensohive.com/ (accessed on 27 November 2018).
- Giatec (Ottawa, Ontario, Canada). Available online: https://www.giatecscientific.com/ (accessed on 27 November 2018).
- Concrefy, Concremote (Venlo, Netherlands). Available online: https://www.concrefy.com/en/services-products/concremote/ (accessed on 27 November 2018).
- Krikidis, I.; Timotheou, S.; Nikolaou, S.; Zheng, G.; Ng, D.W.K.; Schober, R. Simultaneous wireless information and power transfer in modern communication systems. IEEE Commun. Mag. 2014, 52, 104–110. [Google Scholar] [CrossRef] [Green Version]
- Perera, T.D.P.; Jayakody, D.N.K.; Chatzinotas, S.; Sharma, V. Wireless Information and Power Transfer: Issues, Advances, and Challenges. In Proceedings of the IEEE 86th Vehicular Technology Conference (VTC-Fall), Toronto, ON, Canada, 24–27 September 2017; pp. 1–7. [Google Scholar]
- Lee, W.K.; Schubert, M.J.; Ooi, B.Y.; Ho, S.J.Q. Multi-Source Energy Harvesting and Storage for Floating Wireless Sensor Network Nodes with Long Range Communication Capability. IEEE Trans. Ind. Appl. 2018, 54, 2606–2615. [Google Scholar] [CrossRef]
- Francesco, O.; Mezzetti, C.B.; Cottone, F. Vibrations powered LoRa sensor: An electromechanical energy harvester working on a real bridge. In Proceedings of the IEEE Sensors, Orlando, FL, USA, 30 October–3 November 2016; pp. 1–3. [Google Scholar]
- Polonelli, T.; Brunelli, D.; Guermandi, M.; Benini, L. An accurate low-cost Crackmeter with LoRaWAN communication and energy harvesting capability. In Proceedings of the IEEE 23rd International Conference on Emerging Technologies and Factory Automation (ETFA), Torino, Italy, 4–7 September 2018; Volume 1, pp. 671–676. [Google Scholar]
- Dalpiaz, G.; Longo, A.; Nardello, M.; Passerone, R.; Brunello, D. A battery-free non-intrusive power meter for low-cost energy monitoring. In Proceedings of the IEEE Industrial Cyber-Physical Systems (ICPS), St. Petersburg, Russia, 15–18 May 2018; pp. 653–658. [Google Scholar]
- Peng, Y.; Shangguan, L.; Hu, Y.; Qian, Y.; Lin, X.; Chen, X.; Fang, D.; Jamieson, K. Plora: A passive long-range data network from ambient lora transmissions. In Proceedings of the 2018 Conference of the ACM Special Interest Group on Data Communication (ACM), Budapest, Hungary, 20–25 August 2018; pp. 147–160. [Google Scholar]
- Talla, V.; Hessar, M.; Kellogg, B.; Najafi, A.; Smith, J.R.; Gollakota, S. Lora backscatter: Enabling the vision of ubiquitous connectivity. Proc. Acm Interact. Mob. Wearable Ubiquitous Technol. 2017, 1, 1–24. [Google Scholar] [CrossRef]
- Tjukovs, S.; Eidaks, J.; Pikulins, D. Experimental Verification of Wireless Power Transfer Ability to Sustain the Operation of LoRaWAN Based Wireless Sensor Node. In Proceedings of the IEEE 2018 Advances in Wireless and Optical Communications (RTUWO 2018), Latvia, Riga, 15-–16 November 2018; pp. 83–88. [Google Scholar]
- Loubet, G.; Takacs, A.; Dragomirescu, D. Implementation of a Battery-Free Wireless Sensor for Cyber-Physical Systems dedicated to Structural Health Monitoring Applications. IEEE Access Spec. Sect. Cyber-Phys. Syst. 2019. [Google Scholar] [CrossRef]
- Matiko, J.W.; Grabham, N.J.; Beeby, S.P.; Tudor, M.J. Review of the application of energy harvesting in buildings. Meas. Sci. Technol. 2013, 25, 012002. [Google Scholar] [CrossRef]
- Jang, Y.; Han, J.K.; Baek, J.I.; Moon, G.W.; Kim, J.M.; Sohn, H. Novel multi-coil resonator design for wireless power transfer through reinforced concrete structure with rebar array. In Proceedings of the IEEE 3rd International. Future Energy Electronics Conference and ECCE Asia (IFEEC 2017-ECCE Asia), Kaohsiung, Taiwan, 3–7 June 2017; pp. 2238–2243. [Google Scholar]
- Jonah, O.; Georgakopoulos, S.V. Wireless power transfer in concrete via strongly coupled magnetic resonance. IEEE Trans. Antennas Propag. 2013, 61, 1378–1384. [Google Scholar] [CrossRef]
- ETSI. Electromagnetic Compatibility and Radio Spectrum Matters (ERM); Short Range Devices (SRD) Intended for Operation in the Bands 865 MHz to 868 MHz and 915 MHz to 921 MHz; Guidelines for the Installation and Commissioning of Radio Frequency Identification (RFID) Equipment at UHF; Document ETSI TR 102 436, V2.1.1; ETSI: Sophia Antipolis, France, 2014. [Google Scholar]
- Okba, A.; Takacs, A.; Aubert, H. Compact Flat Dipole Rectenna for IoT Applications. Prog. Electromagn. Res. C 2018, 87, 39–49. [Google Scholar] [CrossRef]
- Loubet, G.; Takacs, A.; Dragomirescu, D. Towards the Design of Wireless Communicating Reinforced Concrete. IEEE Access Spec. Sect. Wirel. Powered Netw. Algorithms Appl. Technol. 2018, 6, 1–13. [Google Scholar] [CrossRef]
- Sidibe, A.; Okba, A.; Takacs, A.; Aubert, H. Design and Characterization of a Compact Rectenna for Structural Health Monitoring Applications. IEEE APS 2019. under review. [Google Scholar]
- Texas Instruments—bq25504 Ultra Low-Power Boost Converter with Battery Management for Energy Harvester Applications. Available online: http://www.ti.com/lit/ds/symlink/bq25504.pdf (accessed on 14 January 2019).
- AVX. BestCap® Ultra-low ESR High Power Pulse Supercapacitors. Available online: http://datasheets.avx.com/BestCap.pdf (accessed on 14 January 2019).
- Murata: LoRa Module Datasheet. Available online: https://wireless.murata.com/RFM/data/type_abz.pdf (accessed on 14 January 2019).
- STMicroelectronics. STM32L072x8 STM32L072xB STM32L072xZ. Available online: https://www.st.com/resource/en/datasheet/stm32l072v8.pdf (accessed on 14 January 2019).
- Semtech. LoRa—SX1276/77/78/79. Available online: https://www.semtech.com/products/wireless-rf/lora-transceivers/SX1276 (accessed on 14 January 2019).
- STMicroelectronics. B-L072Z-LRWAN1. Available online: https://www.st.com/en/evaluation-tools/b-l072z-lrwan1.html (accessed on 14 January 2019).
- The Things Network. Available online: https://www.thethingsnetwork.org/ (accessed on 14 January 2019).
- LoRa Alliance Technical Committee. LoRaWAN 1.1 Specification; LoRa Alliance Technical Committee: Beaverton, OR, USA, 2017; Available online: https://lora-alliance.org/sites/default/files/2018-04/lorawantm_specification_-v1.1.pdf (accessed on 14 January 2019).
- IEEE 802.15.1 Working Group. IEEE Standard for Information Technology-Telecommunications and Information Exchange Between Systems-Local and Metropolitan Area Networks-Specific Requirements-Part 15.1: Wireless Medium Access Control (MAC) and Physical Layer (PHY) Specifications for Wireless Personal Area Networks (WPANs); IEEE Standard 802.15.1; IEEE Standard Association: Piscataway, NJ, USA, 2005. [Google Scholar]
- IEEE 1902.1 Working Group. IEEE Standard for Long Wavelength Wireless Network Protocol; IEEE Standard 1902.1; IEEE Standard Association: Piscataway, NJ, USA, 2009. [Google Scholar]
- Sparkfun. Digital-Output Relative Humidity & Temperature Sensor/Module—DHT22. Available online: https://www.sparkfun.com/datasheets/Sensors/Temperature/DHT22.pdf (accessed on 14 January 2019).
- Murthy, S.G.N. Batteryless Wireless RFID based embedded sensors for long term monitoring of reinforced concrete structures. In Proceedings of the International Symposium Non-Destructive Testing in Civil Engineering (NDT-CE), Berlin, Germany, 15–17 September 2015; pp. 15–17. [Google Scholar]
- Zhang, J.; Tian, G.; Marindra, A.; Sunny, A.; Zhao, A. A review of passive RFID tag antenna-based sensors and systems for structural health monitoring applications. Sensors 2017, 17, 265. [Google Scholar] [CrossRef] [PubMed]
- Nishimoto, H.; Kawahara, Y.; Asami, T. Prototype implementation of ambient RF energy harvesting wireless sensor networks. In Proceedings of the IEEE Sensors, Kona, HI, USA, 1–4 November 2010; pp. 1282–1287. [Google Scholar]
- Visser, H.J.; Vullers, R.J. Wireless sensors remotely powered by RF energy. In Proceedings of the IEEE 6th European Conference on Antennas and Propagation (EUCAP), Prague, Czech Republic, 26–30 March 2012; pp. 1–4. [Google Scholar]
- Parks, A.N.; Sample, A.P.; Zhao, Y.; Smith, J.R. A wireless sensing platform utilizing ambient RF energy. In Proceedings of the IEEE Topical Conference on Power Amplifiers for Wireless and Radio Applications (PAWR), Austin, TX, USA, 20–21 January 2013; pp. 160–162. [Google Scholar]
- Syed, Y.; Hegde, B.G.; Prabhakar, T.V.; Manjunath, M.; Vinoy, K.J. RF energy harvesting chip powered sensor node. In Proceedings of the IEEE International Conference on Electronics, Circuits and Systems (ICECS), Monte Carlo, Monaco, 11–14 December 2016; pp. 748–751. [Google Scholar]
- la Rosa, R.; Trigona, C.; Zoppi, G.; di Carlo, C.A.; di Donato, L.; Sorbello, G. RF energy scavenger for battery-free Wireless Sensor Nodes. In Proceedings of the IEEE International Instrumentation and Measurement Technology Conference (I2MTC), Houston, TX, USA, 14–17 May 2018; pp. 1–5. [Google Scholar]
- Janhunen, J.; Mikhaylov, K.; Petäjäjärvi, J.; Sonkki, M. Wireless Energy Transfer Powered Wireless Sensor Node for Green IoT: Design, Implementation and Evaluation. Sensors 2019, 19, 90. [Google Scholar] [CrossRef] [PubMed]
- Luca, A.; Pathirana, V.; Ali, S.Z.; Dragomirescu, D.; Udrea, F. Experimental, analytical and numerical investigation of non-linearity of SOI diode temperature sensors at extreme temperatures. Sens. Actuators A Phys. 2015, 222, 31–38. [Google Scholar] [CrossRef]
- Texas Instruments. HDC1080 Low Power, High Accuracy Digital Humidity Sensor with Temperature Sensor. Available online: http://www.ti.com/lit/ds/symlink/hdc1080.pdf (accessed on 24 January 2019).
- Texas Instruments. HDC1010 Low Power, High Accuracy Digital Humidity Sensor with Temperature Sensor. Available online: http://www.ti.com/lit/ds/symlink/hdc1010.pdf (accessed on 24 January 2019).
- Bosch. BME280 Combined Humidity and Pressure Sensor. Available online: https://ae-bst.resource.bosch.com/media/_tech/media/datasheets/BST-BME280-DS002.pdf (accessed on 24 January 2019).
- Sensirion. Datasheet SHT3C. Available online: https://www.sensirion.com/fileadmin/user_upload/customers/sensirion/Dokumente/0_Datasheets/Humidity/Sensirion_Humidity_Sensors_SHTC3_Datasheet.pdf (accessed on 24 January 2019).
- Sensirion. Datasheet SHTW2. Available online: https://www.sensirion.com/fileadmin/user_upload/customers/sensirion/Dokumente/0_Datasheets/Humidity/Sensirion_Humidity_Sensors_SHTW2_Datasheet.pdf (accessed on 24 January 2019).


| [Reference] Year | Energy Source(s) | Energy Storage Capacitance | Sensor Type | Periodicity of Measurement and/or Transmission | Application(s) |
|---|---|---|---|---|---|
| [20] 2016 | Mechanical (vibrations) | 100 mF | Temperature Humidity (rain) Vehicles counter | 3 h 30 min (estimation) | Bridges SHM |
| [24] 2017 | Backscattering | N/A | N/A | N/A | SHM; Precision agriculture; Smart contact lens; Flexible epidermal patch sensor |
| [22] 2018 | Electrical induction | 22 mF | Electricity consumption/AC current | Seconds (few) | Smart grids |
| [21] 2018 | Solar and battery | 2 F and 1400 mAh | Crackmeter | N/A | SHM of construction materials |
| [19] 2018 | Solar and thermal | 20 Ah | Temperature Humidity pH | Hour | environment (water) monitoring |
| [23] 2018 | Backscattering and solar | 33 mF | N/A | 20 min (estimation) | N/A |
| This work 2019 | RF WPT | 22 mF | Temperature Relative humidity | Controlled by the WPT system (minutes to hours, or more) | Communicating material SHM in harsh environments CPS |
| Technology | Standard | Directionality | Frequency Band (ISM) | Range | Minimal Data Frame Size (byte) |
|---|---|---|---|---|---|
| LoRa | LoRaWAN [41] | Uplink (Downlink restricted) | 433/868/915 MHz (far-field) | Long (km) | 14 |
| Bluetooth Low Energy (BLE) | IEEE 802.15.1 [42] | Bidirectional “Uplink-only” available | 2.4 GHz (far-field) | Middle (tens of m) | 11 |
| RuBee | IEEE 1902.1 [43] | Bidirectional | 131 kHz (near-field) (65 kHz for WPT) | Middle (tens of m) | 5 |
| Power Density (µW/cm²) | Rectifier Input Power (dBm) [Estimation] | Rectifier Output Voltage (mV) | Measurements Periodicity |
|---|---|---|---|
| 0.52 | –6.43 | 424 | ~1 h 43 min |
| 0.66 | –5.43 | 468 | ~1 h 06 min |
| 1.04 | –3.43 | 593 | ~32 min 38 s |
| 1.65 | –1.43 | 705 | ~17 min 04 s |
| 2.08 | –0.43 | 767 | ~12 min 47 s |
| 2.62 | +0.56 | 835 | ~9 min 59 s |
| 3.30 | +1.56 | 917 | ~7 min 34 s |
| 4.16 | +2.56 | 994 | ~5 min 41 s |
| Prototype no. 1 | Prototype no. 2 | ||||||||||||
|---|---|---|---|---|---|---|---|---|---|---|---|---|---|
| PD11 µW/cm2 | P12 dBm | D13 cm | A. sr 14 ° | A. rs 15 ° | V16 mV | T17 | PD21 µW/cm2 | P22 dBm | D23 cm | A. sr 24 ° | A. rs 25 ° | V26 mV | T27 |
| 4.16 | +2.56 | 150 | 0 | 0 | 873 | 9 min 19 s | / | / | / | / | / | / | / |
| / | / | / | / | / | / | / | 4.16 | +2.56 | 150 | 0 | 0 | 766 | 4 min 22 s |
| 1.27 | −3.14 | 150 | 20 | 20 | 467 | 55 min 48 s | 1.27 | −3.14 | 150 | 20 | 20 | 424 | 18 min 53 s |
| 3.16 | +0.86 | 150 | 20 | 20 | 686 | 15 min 36 s | 3.16 | +0.86 | 150 | 20 | 20 | 669 | 6 min 25 s |
| 3.16 | +1.36 | 150 | 20 | 0 | 752 | 15 min 25 s | 3.16 | +1.36 | 150 | 20 | 0 | 757 | 4 min 34 s |
| 5.86 | +4.01 | 110 | 20 | 20 | 936 | 7 min 46 s | 3.16 | +0.86 | 150 | 20 | 20 | 741 | 4 min 42 s |
| 7.96 | +5.01 | 75 | 30 | 30 | 901 | 7 min 13 s | 3.16 | +0.86 | 150 | 20 | 20 | 641 | 7 min 01 s |
| [Reference] Year | Energy Source(s) (Distance/Frequencies) | Energy Storage Capacitance | Communication Technology (Frequency/Range) | Sensor Type | Periodicity of Transmissions |
|---|---|---|---|---|---|
| [47] 2010 | FF RF EH from TV broadcast (hundreds of meters or kilometres/VHF or UHF) | 100 µF | SimpliciTI (2.4 GHz/middle) | Temperature Voltage | 5 s |
| [48] 2012 | FF RF EH from ambient sources (ISM band) (meters/2.45 GHz) | (Battery) | N/A (433 MHz/m) | Temperature and humidity | 45 s |
| [49] 2013 | FF RF EH from TV broadcast or cellular base station (hundreds of meters or kilometres/VHF and UHF) | 160 µF | N/A (2.45 GHz/m) | Temperature and luminosity | [1 min; 4 min 30 s] |
| [50] 2016 | FF RF WPT (metres/868 MHz) | 1.8 mF | BLE (2.45 GHz/m) | Temperature | 30 min |
| [8] 2017 | Inductive WPT (centimetres/100 kHz) | (Battery) | M-BUS (169 MHz/hundreds of meters) | Stress and temperature | When powered |
| [51] 2018 | FF RF WPT (tens of centimetres/868 MHz) | 1 mF | Bluetooth (2.45 GHz/m) | Temperature and voltage | [5 s; 20 s] |
| [52] 2018 | FF RF WPT (meters/868 MHz) | N/A | BLE (2.45 GHz/m) | Displacement Temperature and humidity | 0.5 s |
| This work 2019 | Far field RF WPT from dedicated RF source (meters) | 22 mF | LoRa/LoRaWAN (868 MHz/km) | Temperature and relative humidity | Controlled by the WPT system (minutes to hours, or more) |
| Reference | Adafruit DHT22 [44] | Texas Instruments [HDC2080] [54] | Texas Instruments [HDC2010] [55] | Bosch [BME280] [56] | Sensirion [SHTW2] [57] | Sensirion [SHTC3] [58] | ThermoDiode [53] | |
|---|---|---|---|---|---|---|---|---|
| Functionality | Temperature | Yes | Yes | Yes | Yes | Yes | Yes | Yes |
| Humidity | Yes | Yes | Yes | Yes | Yes | Yes | No | |
| Measure in Isolation | No | Yes | Yes | Yes | No | No | N/A | |
| Humidity Characteristics | Average Accuracy (± %RH) | 3 | 2 | 2 | 3 | 3 | 2 | N/A |
| Specified Range (%RH) | 0 to 100 | 0 to 100 | 0 to 100 | 0 to 100 | 0 to 100 | 0 to 100 | N/A | |
| Temperature Characteristics | Average Accuracy (± °C) | 0.5 | 0.2 | 0.2 | 0.5 | 0.3 | 0.2 | 0.1 |
| Specified Range (°C) | –40 to +80 | –40 to +85 | –40 to +85 | –40 to +85 | –30 to +100 | –40 to +125 | –200 to +600 | |
| General Characteristics | Response Time (s) | 2 | 8 | 8 | 1 | <5 to 30 | <5 to 30 | <1 * |
| Average Power Consumption (µW) | 2800 | 1 | 1 | 3.3 | 8.6 | 16 | <1 * | |
| Sleep Current (µA) | / | 0.05 | 0.05 | 0.1 | 0.7 | 0.3 | / | |
| Measurement Time (ms) | 800 | - | - | 2 | 1 | 1 | <10 * | |
© 2019 by the authors. Licensee MDPI, Basel, Switzerland. This article is an open access article distributed under the terms and conditions of the Creative Commons Attribution (CC BY) license (http://creativecommons.org/licenses/by/4.0/).
Share and Cite
Loubet, G.; Takacs, A.; Gardner, E.; De Luca, A.; Udrea, F.; Dragomirescu, D. LoRaWAN Battery-Free Wireless Sensors Network Designed for Structural Health Monitoring in the Construction Domain. Sensors 2019, 19, 1510. https://doi.org/10.3390/s19071510
Loubet G, Takacs A, Gardner E, De Luca A, Udrea F, Dragomirescu D. LoRaWAN Battery-Free Wireless Sensors Network Designed for Structural Health Monitoring in the Construction Domain. Sensors. 2019; 19(7):1510. https://doi.org/10.3390/s19071510
Chicago/Turabian StyleLoubet, Gaël, Alexandru Takacs, Ethan Gardner, Andrea De Luca, Florin Udrea, and Daniela Dragomirescu. 2019. "LoRaWAN Battery-Free Wireless Sensors Network Designed for Structural Health Monitoring in the Construction Domain" Sensors 19, no. 7: 1510. https://doi.org/10.3390/s19071510