Characterization of Human Tear Fluid by Means of Surface-Enhanced Raman Spectroscopy †

 , , ,
, , , 
Abstract
:1. Introduction
2. Materials and Methods
2.1. Tears Collection
2.2. SERS Implementation
2.3. SERS Measurements
2.4. Data Analysis
3. Results
4. Discussion
5. Conclusions
Author Contributions
Conflicts of Interest
References
- Hagan, S.; Martin, E.; Enríquez-de-Salamanca, A. Tear fluid biomarkers in ocular and systemic disease: Potential use for predictive, preventive and personalised medicine. EPMA J. 2016, 7, 15. [Google Scholar] [CrossRef] [PubMed]
- Börger, M.; Funke, S.; Bähr, M.; Grus, F.; Lingor, P. Biomarker sources for Parkinson’s disease: Time to shed tears? Basal Ganglia 2015, 5, 63–69. [Google Scholar] [CrossRef]
- D’Apuzzo, F.; Perillo, L.; Delfino, I.; Portaccio, M.; Lepore, M.; Camerlingo, C. Monitoring early phases of orthodontic treatment by means of Raman spectroscopies. J. Biomed. Opt. 2017, 22, 115001. [Google Scholar] [CrossRef] [PubMed]
- Camerlingo, C.; Zenone, F.; Perna, G.; Capozzi, V.; Cirillo, N.; Gaeta, G.M.; Lepore, M. An investigation on micro-Raman spectra and wavelet data analysis for Pemphigus Vulgaris follow-up monitoring. Sensors 2008, 8, 3656–3664. [Google Scholar] [CrossRef]
- Rusciano, G.; Zito, G.; Pesce, G.; Del Prete, S.; Cennamo, G.; Sasso, A. Assessment of conjunctival microvilli abnormality by micro-Raman analysis. J. Biophotonics 2016, 9, 551–559. [Google Scholar] [CrossRef]
- Ga̧sior-Głogowska, M.; Komorowska, M.; Hanuza, J.; Ma̧czka, M.; Zaja̧c, A.; Ptak, M.; Bȩdziński, R.; Kobielarz, M.; Maksymowicz, K.; Kuropka, P.; et al. FT-Raman spectroscopic study of human skin subjected to uniaxial stress. J. Mech. Behav. Biomed. Mater. 2013, 18, 240–252. [Google Scholar]
- Reichebacher, M.; Popp, J. Challenges in molecular structure determination. In Vibrational Spectroscopy XX; Springer: Heidelberg, Germany, 2013; pp. 63–143. [Google Scholar]
- Filik, J.; Stone, N. Analysis of human tear fluid by Raman spectroscopy. Anal. Chim. Acta 2008, 616, 177–184. [Google Scholar] [CrossRef] [PubMed]
- Filik, J.; Stone, N. Investigation into the protein composition of human tear fluid using centrifugal filters and drop coating deposition Raman spectroscopy. J. Raman Spectrosc. 2009, 40, 218–224. [Google Scholar] [CrossRef]
- Kuo, M.-T.; Lin, C.-C.; Liu, H.-Y.; Chang, H.-C. Tear Analytical Model Based on Raman microspectroscopy for investigation of infectious diseases of the ocular surface. Investig. Ophthalmol. Vis. Sci. 2011, 52, 4942–4950. [Google Scholar] [CrossRef]
- Hu, P.; Zheng, X.S.; Zong, C.; Li, M.H.; Zhang, L.Y.; Li, W.; Ren, B. Drop-coating deposition and surface-enhanced Raman spectroscopies (DCDRS and SERS) provide complementary information of whole human tears. J. Raman Spectrosc. 2014, 45, 565–573. [Google Scholar] [CrossRef]
- Choi, S.; Moon, S.W.; Shin, J.-H.; Park, H.-K.; Jin, K.-H. Label-free biochemical method for early detection of Adenoviral conjuctivitis using human tear biofluids. Anal. Chem. 2014, 86, 11093–11099. [Google Scholar] [CrossRef]
- Kim, W.-S.; Shin, J.-H.; Park, H.-K.; Choi, S. A low-cost, monometallic, surface-enhanced Raman scattering-functionalized paper platform for spot-on bioassays. Sens. Actuators B Chem. 2016, 222, 1112–1118. [Google Scholar] [CrossRef]
- Filik, J.; Stone, N. Drop coating deposition Raman spectroscopy of protein mixtures. Analyst 2007, 132, 544–550. [Google Scholar] [CrossRef] [PubMed]
- Frens, G. Particle size and sol stability in metal colloids. Colloid Polym. Sci. 1972, 250, 736–741. [Google Scholar] [CrossRef]
- Camerlingo, C.; Portaccio, M.; Tatè, R.; Lepore, M.; Delfino, I. Fructose and pectin detection in fruit-based food products by Surface-Enhanced Raman Spectroscopy. Sensors 2017, 17, 839. [Google Scholar] [CrossRef]
- Haiss, W.; Thanh, N.T.K.; Aveyard, J.; Ferni, D.G. Determination of Size and Concentration of Gold nanoparticles from UV-Vis Spectra. Anal. Chem. 2007, 79, 4215–4221. [Google Scholar] [CrossRef] [PubMed]
- Njoki, P.N.; Lim, I.S.; Mott, D.; Park, H.-Y.; Khan, B.; Mishra, S.; Sujakumar, R.; Luo, J.; Zhong, C.-J. Size correlation of optical and spectroscopic properties for gold nanoparticles. J. Phys. Chem. C 2007, 111, 14664–14669. [Google Scholar] [CrossRef]
- Camerlingo, C.; Zenone, F.; Gaeta, G.M.; Riccio, R.; Lepore, M. Wavelet data processing of micro-Raman spectra of biological samples. Meas. Sci. Technol. 2006, 17, 298–303. [Google Scholar] [CrossRef]
- Ameer, F.S.; Pittman, C.U., Jr.; Zhang, D. Quantification of Resonance Raman Enhancement Factors for Rhodamine 6G (R6G) in Water and on Gold and Silver Nanoparticles: Implications for Single-Molecule R6G SERS. J. Phys. Chem. C 2013, 117, 27096–27104. [Google Scholar] [CrossRef]
- Madzharova, F.; Heiner, Z.; Gühlke, M.; Kneipp, J. Surface-Enhanced Hyper-Raman Spectra of Adenine, Guanine, Cytosine, Thymine, and Uracil. J. Phys. Chem. 2016, 120, 15415–15423. [Google Scholar] [CrossRef]
- Stewart, S.; Fredericks, P.M. Surface-enhanced Raman spectroscopy of amino acids adsorbed on an electrochemically prepared silver surface. Spectrochim. Acta Part A 1999, 55, 1641–1660. [Google Scholar] [CrossRef]
- Fullard, R.J.; Sbyder, C. Protein levels in nonstimulated and stimulated tears of normal human subjects. Investig. Ophthalmol. Vis. Sci. 1990, 31, 1119–1126. [Google Scholar]
- Mackie, I.A.; Seal, D.V. Confirmatory tests for the dry eye of Sjögren’s syndrome. Scand. J. Rheumatol. Suppl. 1986, 61, 220–223. [Google Scholar] [PubMed]
- Boersma, H.G.; van Bijsterveld, O.P. The lactoferrin test for the diagnosis of keratoconjunctivitis sicca in clinical practice. Ann. Ophthalmol. 1987, 19, 152–154. [Google Scholar] [PubMed]
- Goren, M.B.; Goren, S.B. Diagnostic tests in patients with symptoms of keratoconjunctivitis sicca. Ann. J. Ophthalmol. 1988, 106, 570–574. [Google Scholar] [CrossRef]
- González-Chávez, S.A.; Arévalo-Gallegos, S.; Rascón-Cruz, Q. Lactoferrin: Structure, function and applications. Int. J. Antimicrob. Agents 2009, 33, 301e1–301e8. [Google Scholar] [CrossRef]
- Querinjean, P.; Masson, P.L.; Heremans, J.F. Molecular Weight, Single-chain structure and Amino acid composition of human Lactoferrin. Eur. J. Biochem. 1971, 20, 420–425. [Google Scholar] [CrossRef]
- Thompson, A.R. Amino acid sequence in lysozyme. 1. Displacement chromatography of peptides from a partial hydrolysate on ion-exchange resins. Biochem. J. 1955, 60, 507–515. [Google Scholar] [CrossRef]
- Hu, J.; Sheng, R.S.; Xu, Z.S.; Zheng, Y. Surface enhanced Raman spectroscopy of lysozyme. Spectrochim. Acta 1995, 51A, 1087–1096. [Google Scholar]
- Saari, K.M.; Aine, E.; Posz, A.; Klockars, M. Lysozyme content of tears in normal subjects and in patients with external eye infections. Graefes Arch. Clin. Exp. Ophthalmol. 1983, 221, 86–88. [Google Scholar] [CrossRef]
- Yokoyama, M.; Nishimura, T.; Yamada, K.; Jeong, H.; Kido, M.; Sakurai, Y.; Ohno, Y. Raman spectroscopy of tear fluid with paper substrates for point-of-care therapeutic drug monitoring. J. Nurs. Sci. Eng. 2015, 2, 25–31. [Google Scholar]
- Yamada, K.; Endo, T.; Imai, H.; Kido, M.; Jeong, H.; Ohno, Y. Effectiveness of surface enhanced Raman spectroscopy of tear fluid with soft substrate for point-of-care therapeutic drug monitoring. In Optical Diagnostics and Sensing XVI: Toward Point-of-Care Diagnostics; Coté, G.L., Ed.; International Society for Optics and Photonics: Bellingham, DC, USA, 2017; Volume 9715, p. 97150E. [Google Scholar]


| id. Number | Birth Year | Sex |
|---|---|---|
| A | 1985 | f |
| B | 1980 | f |
| C | 1972 | f |
| D | 1956 | f |
| E | 1952 | m |
| F | 1948 | m |
| G | 1943 | f |
| H | 1933 | m |
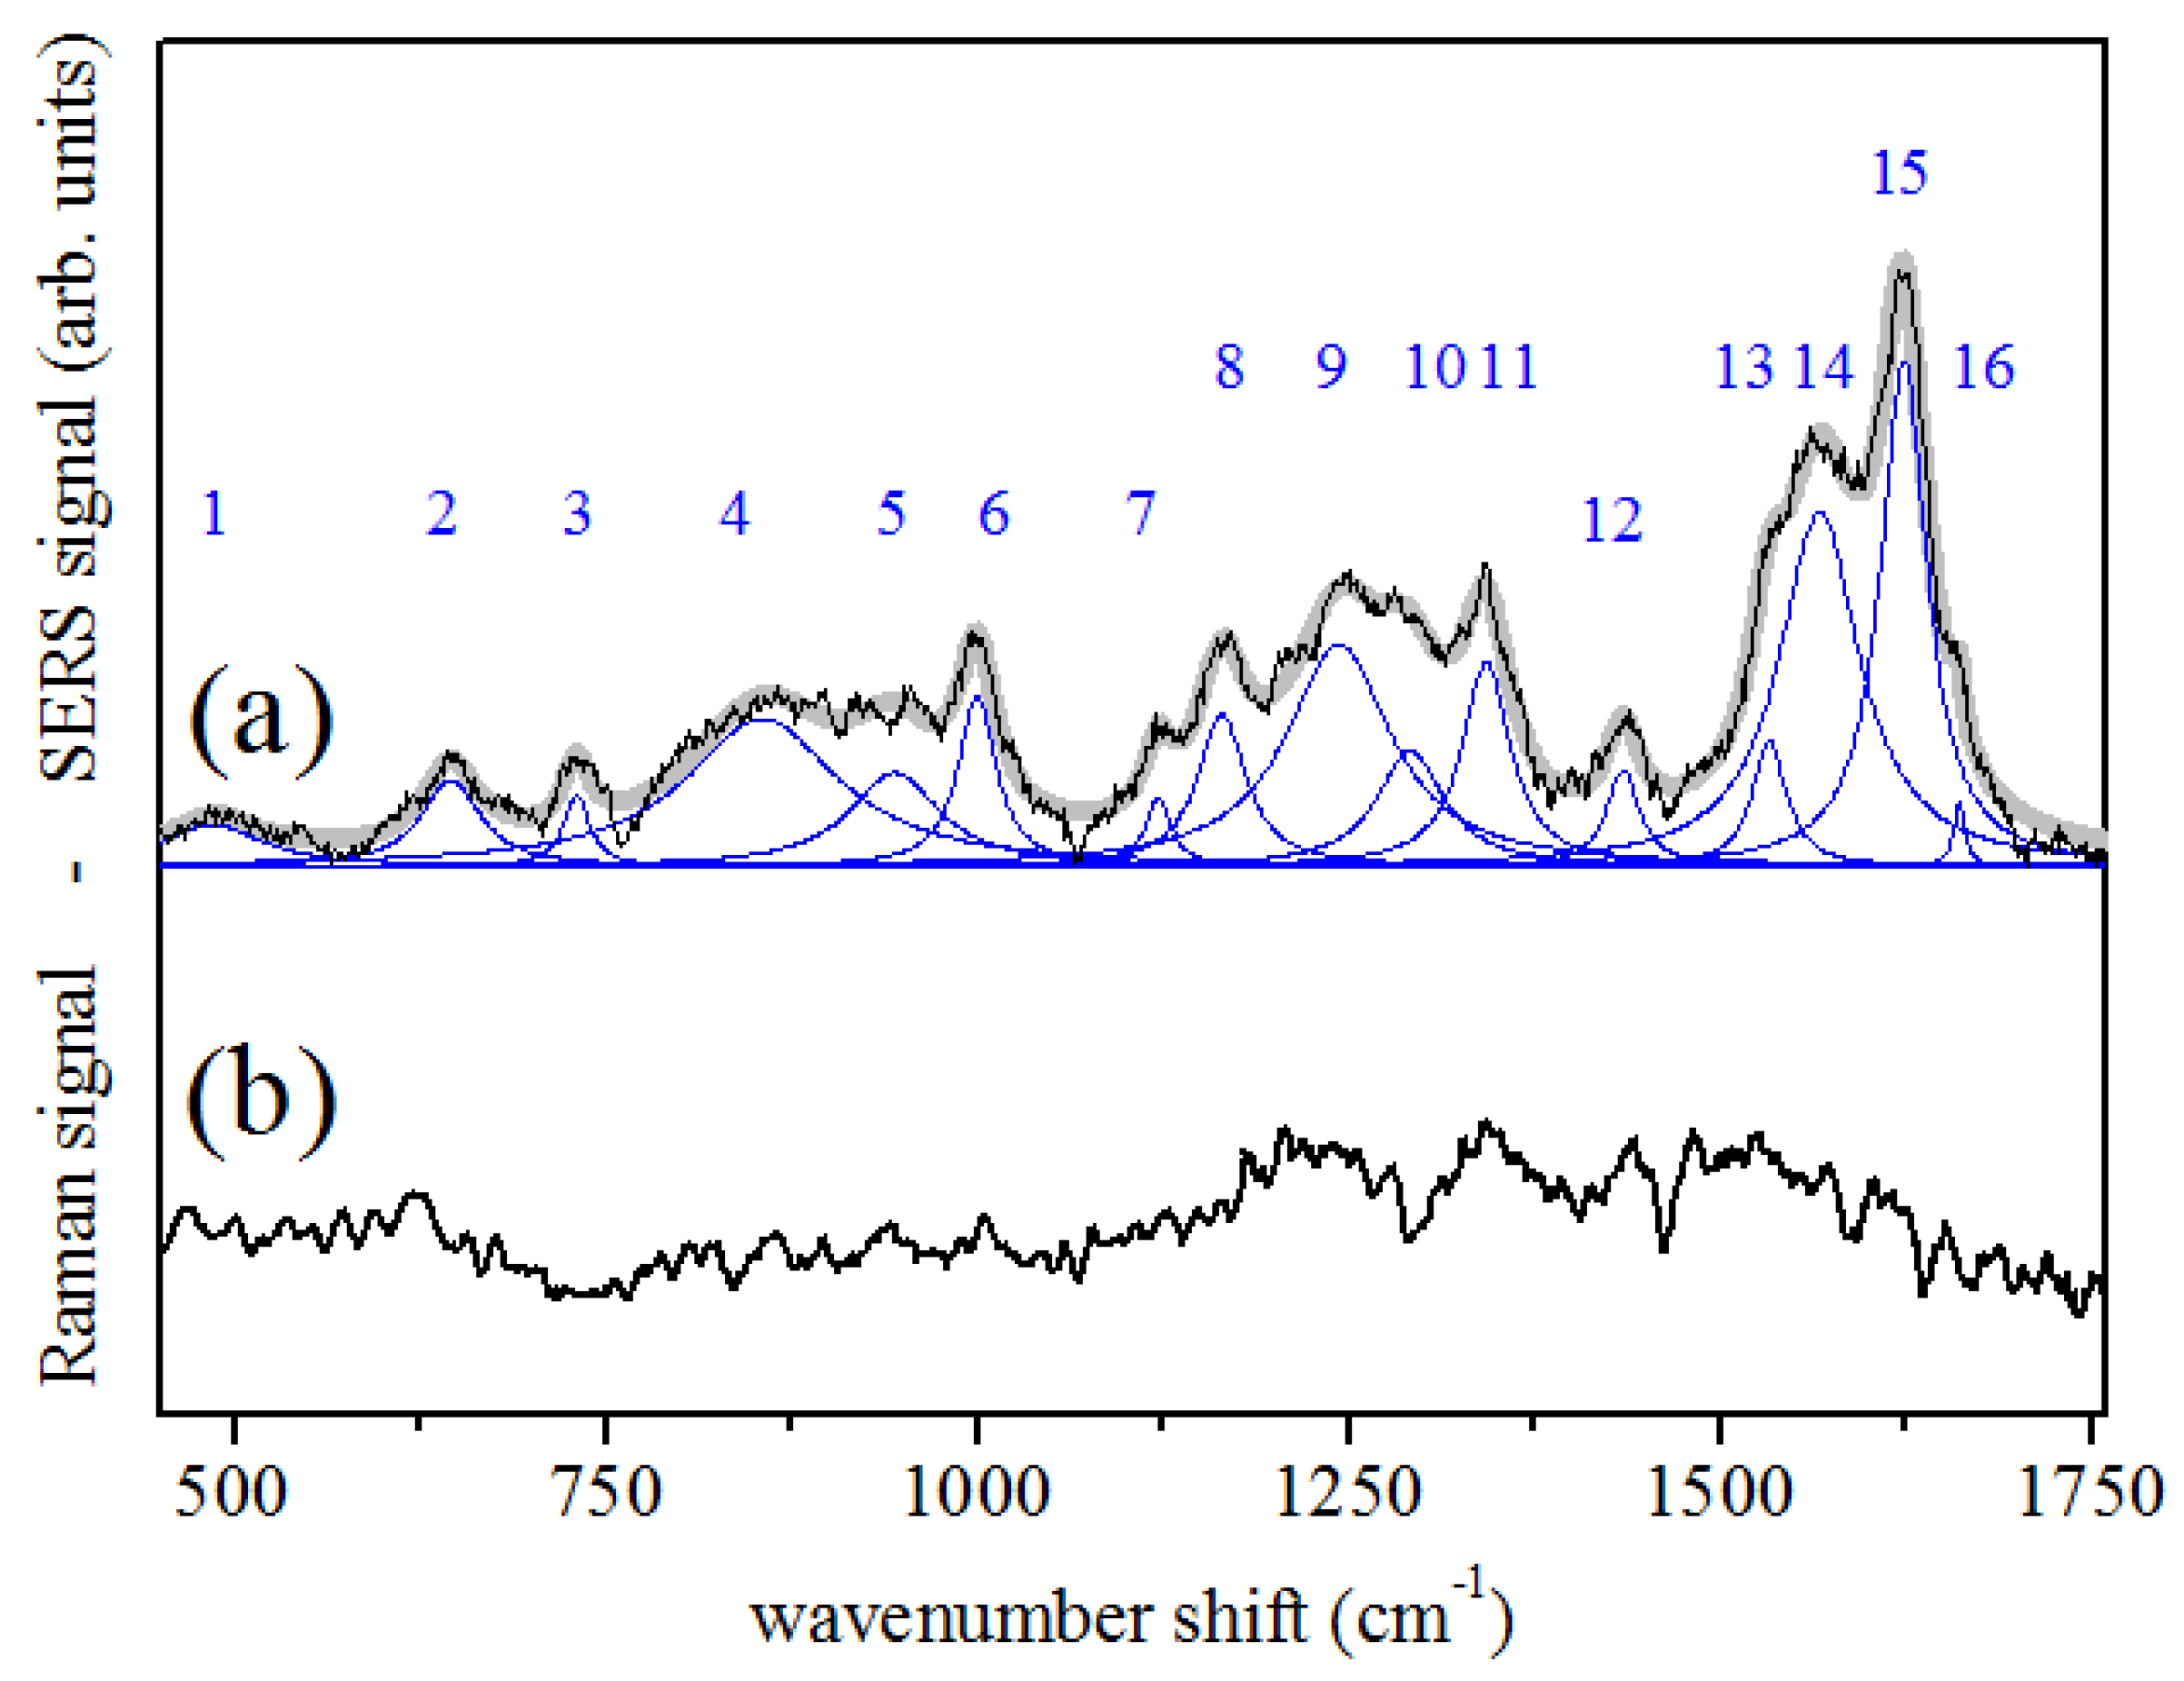
| nr | Center (cm) | Assignment | Component |
|---|---|---|---|
| 1 | 484 | Ring def. | amino acids |
| 2 | 645 | COO wag. | amino acids |
| 3 | 730 | COO def. | amino acids |
| 4 | 855 | C-C str. | amino acids |
| 5 | 944 | C-C str. | amino acids |
| 6 | 1000 | symm. ring CC str. | phenylalanine |
| 7 | 1121 | NH def. | amino acids |
| 8 | 1165 | N-H wag. | amino acids |
| 9 | 1243 | Amide III -sheet, CH wag. | protein |
| 10 | 1291 | Amide III -helix CH wag. | protein |
| 11 | 1342 | C-H def. | Aspartic acid, amino acids |
| 12 | 1435 | CO symm. str. | Glutamic acid, amino acids |
| 13 | 1533 | C-C str. | amino acids |
| 14 | 1567 | NH sciss. | amino acids |
| 15 | 1624 | Indole N-H, C=O str. | amino acids |
| 16 | 1661 | Amide I -helix | protein |
| Component | Mol. Weight (KDa) | c (mg/mL) [10] | c (M) | Description |
|---|---|---|---|---|
| lactoferrin | 80 | 1.8–2.7 | 23–34 | iron binding glycoprotein |
| lysozyme | 14 | 1.6–2.5 | 111–172 | single chain polypeptide |
| lipocaline | 20 | 1.2–2.95 | 62–145 | low mol. weight protein |
| immunoglobulins (IgA) | 162 | 0.2–0.3 | 1.5–1.9 | glycoproteins (antibodies) |
| albumine | 66 | 1.3 | 20 | single peptide chain |
© 2019 by the authors. Licensee MDPI, Basel, Switzerland. This article is an open access article distributed under the terms and conditions of the Creative Commons Attribution (CC BY) license (http://creativecommons.org/licenses/by/4.0/).
Share and Cite
Camerlingo, C.; Lisitskiy, M.; Lepore, M.; Portaccio, M.; Montorio, D.; Prete, S.D.; Cennamo, G. Characterization of Human Tear Fluid by Means of Surface-Enhanced Raman Spectroscopy. Sensors 2019, 19, 1177. https://doi.org/10.3390/s19051177
Camerlingo C, Lisitskiy M, Lepore M, Portaccio M, Montorio D, Prete SD, Cennamo G. Characterization of Human Tear Fluid by Means of Surface-Enhanced Raman Spectroscopy. Sensors. 2019; 19(5):1177. https://doi.org/10.3390/s19051177
Chicago/Turabian StyleCamerlingo, Carlo, Mikhail Lisitskiy, Maria Lepore, Marianna Portaccio, Daniela Montorio, Salvatore Del Prete, and Gilda Cennamo. 2019. "Characterization of Human Tear Fluid by Means of Surface-Enhanced Raman Spectroscopy" Sensors 19, no. 5: 1177. https://doi.org/10.3390/s19051177