Monitoring Land Subsidence in Wuhan City (China) using the SBAS-InSAR Method with Radarsat-2 Imagery Data

 ,
, 
Abstract
:1. Introduction
2. Study Area and Data Preparation
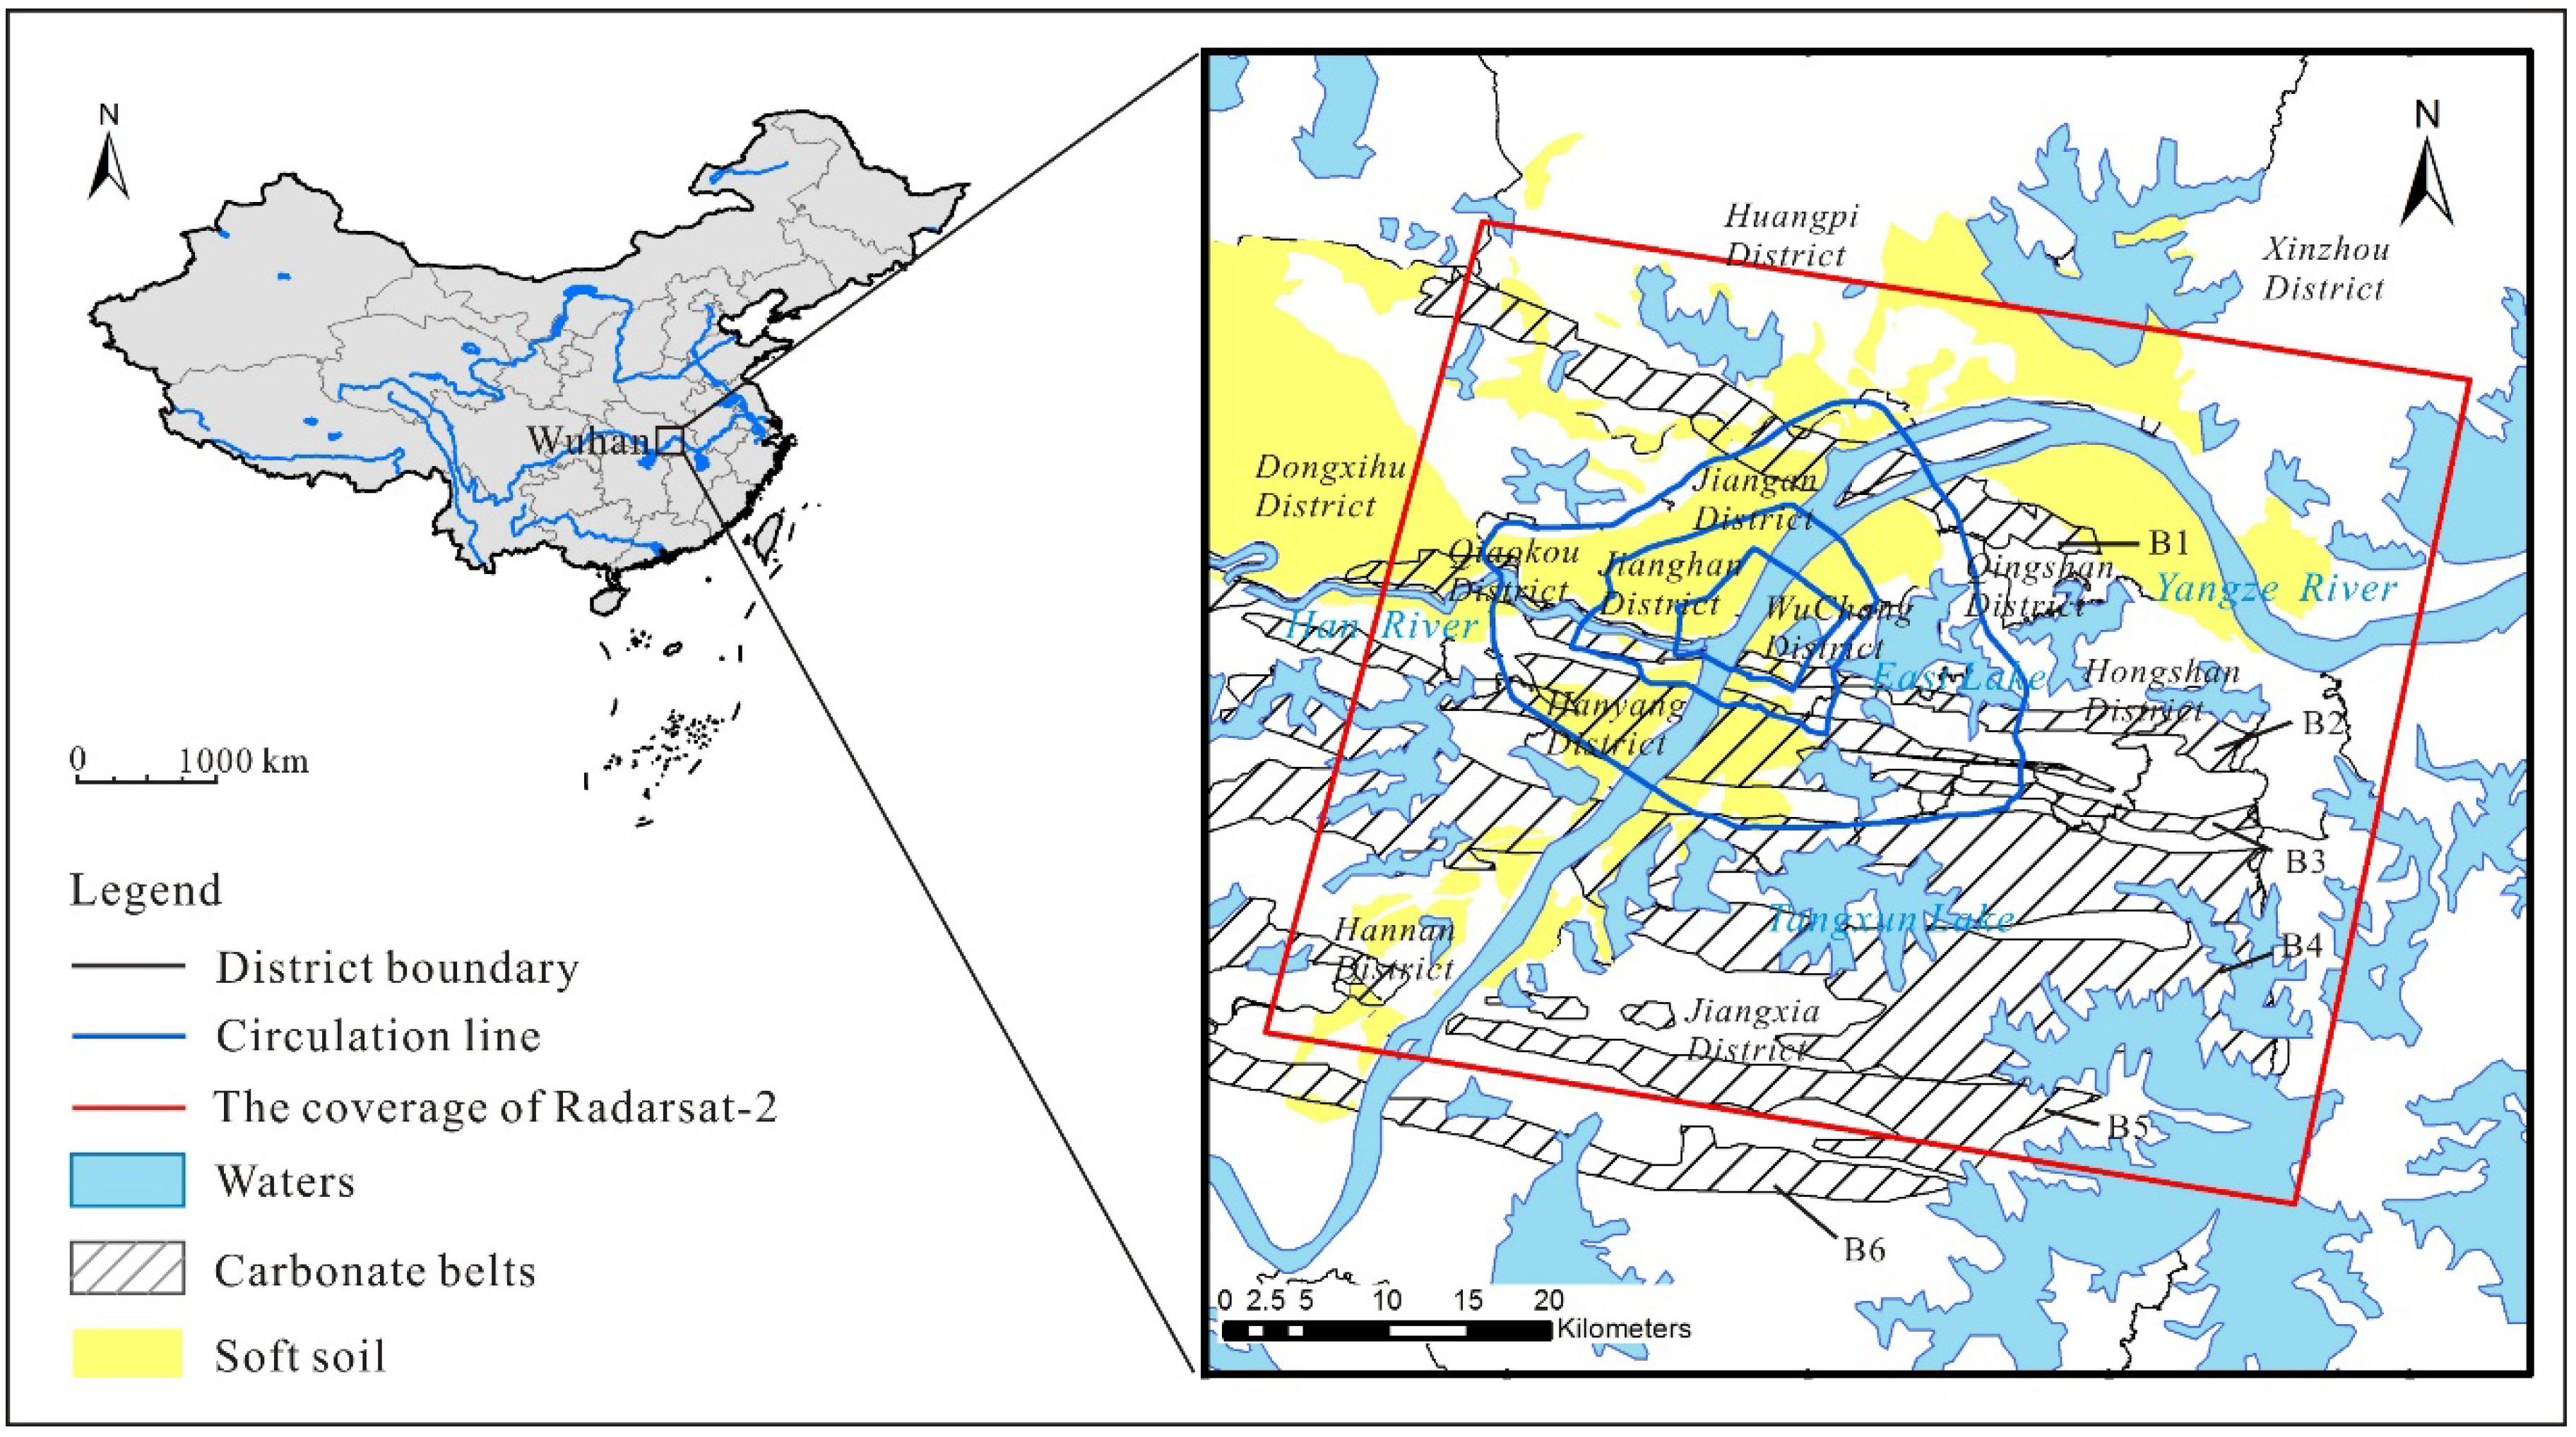
2.1. Study Area
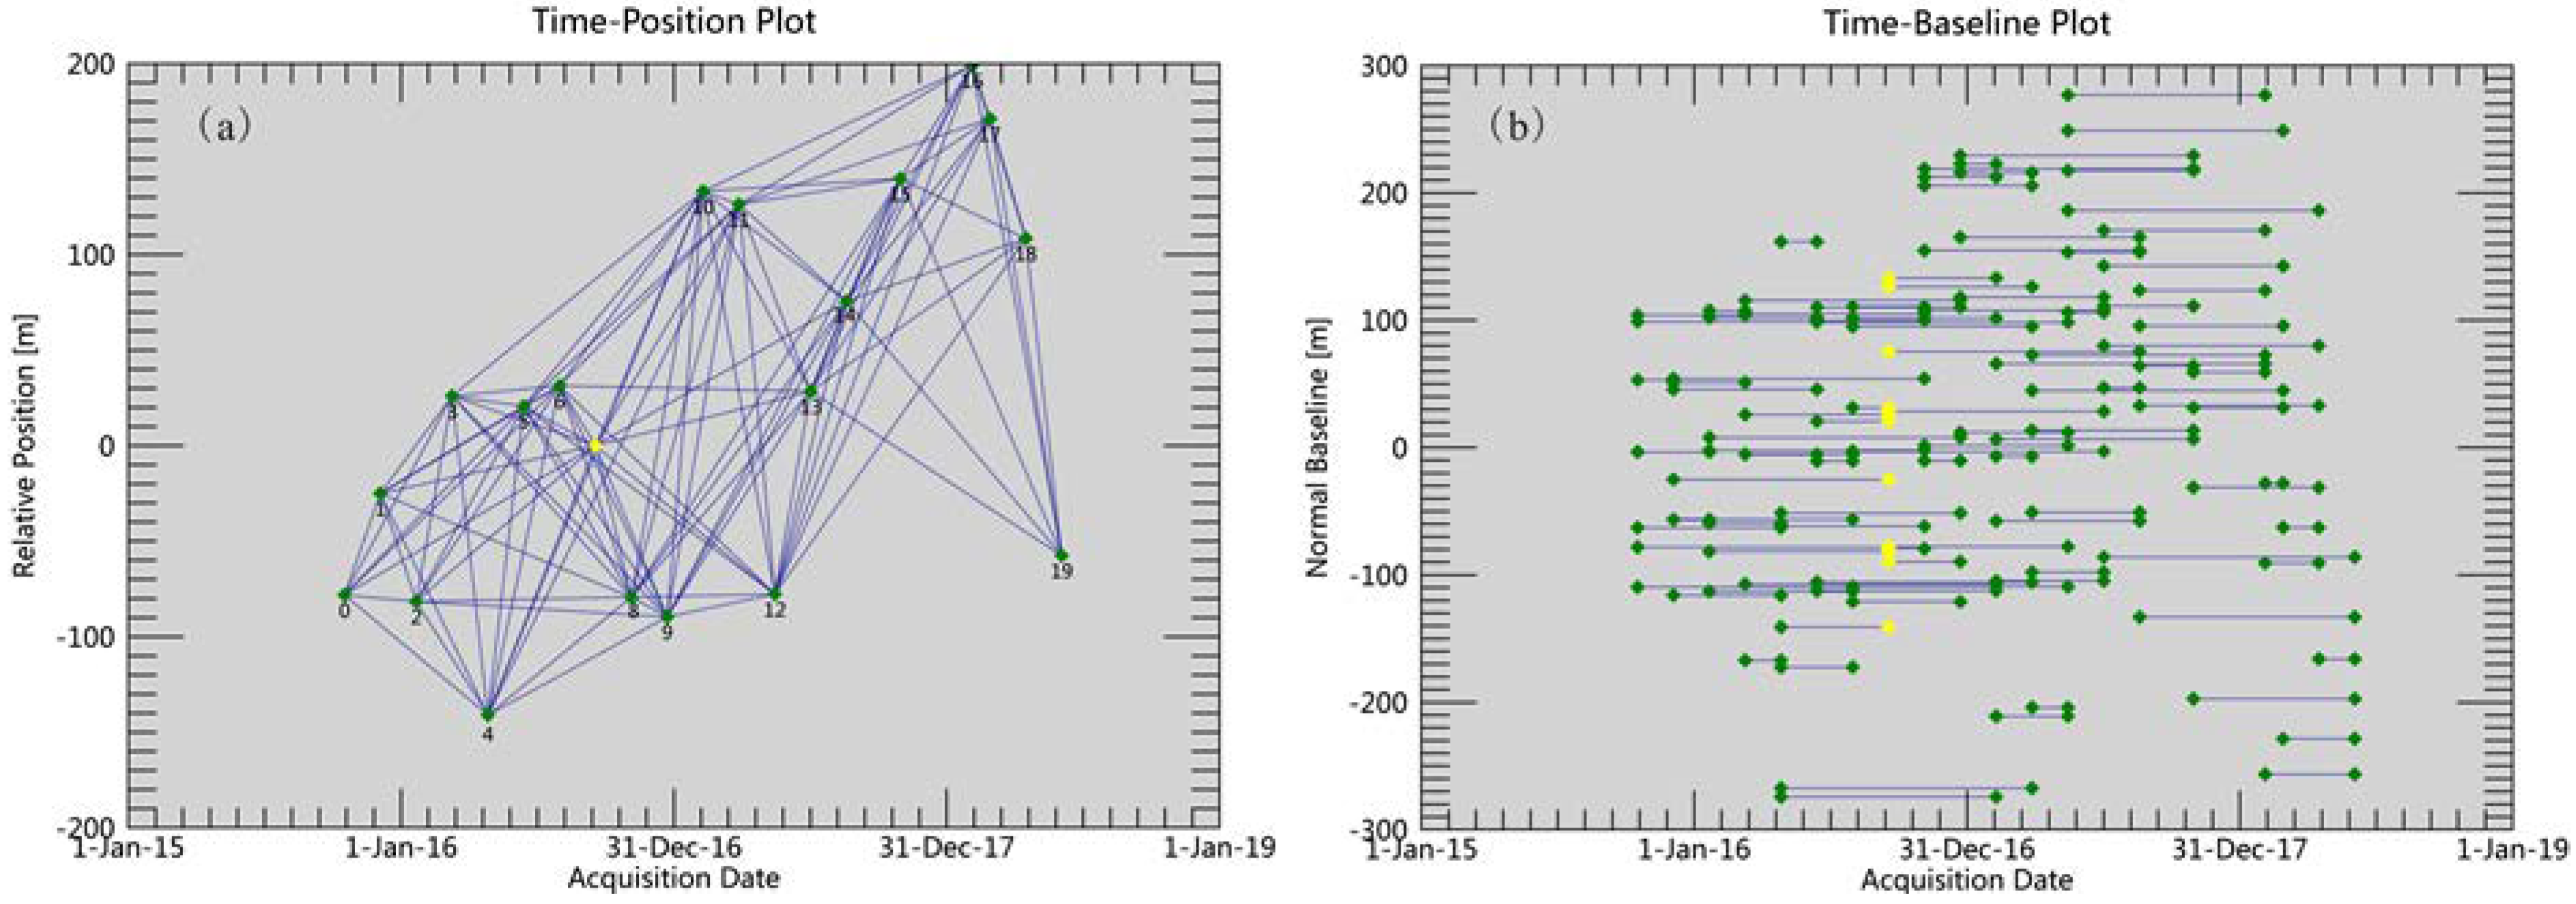
2.2. Datasets
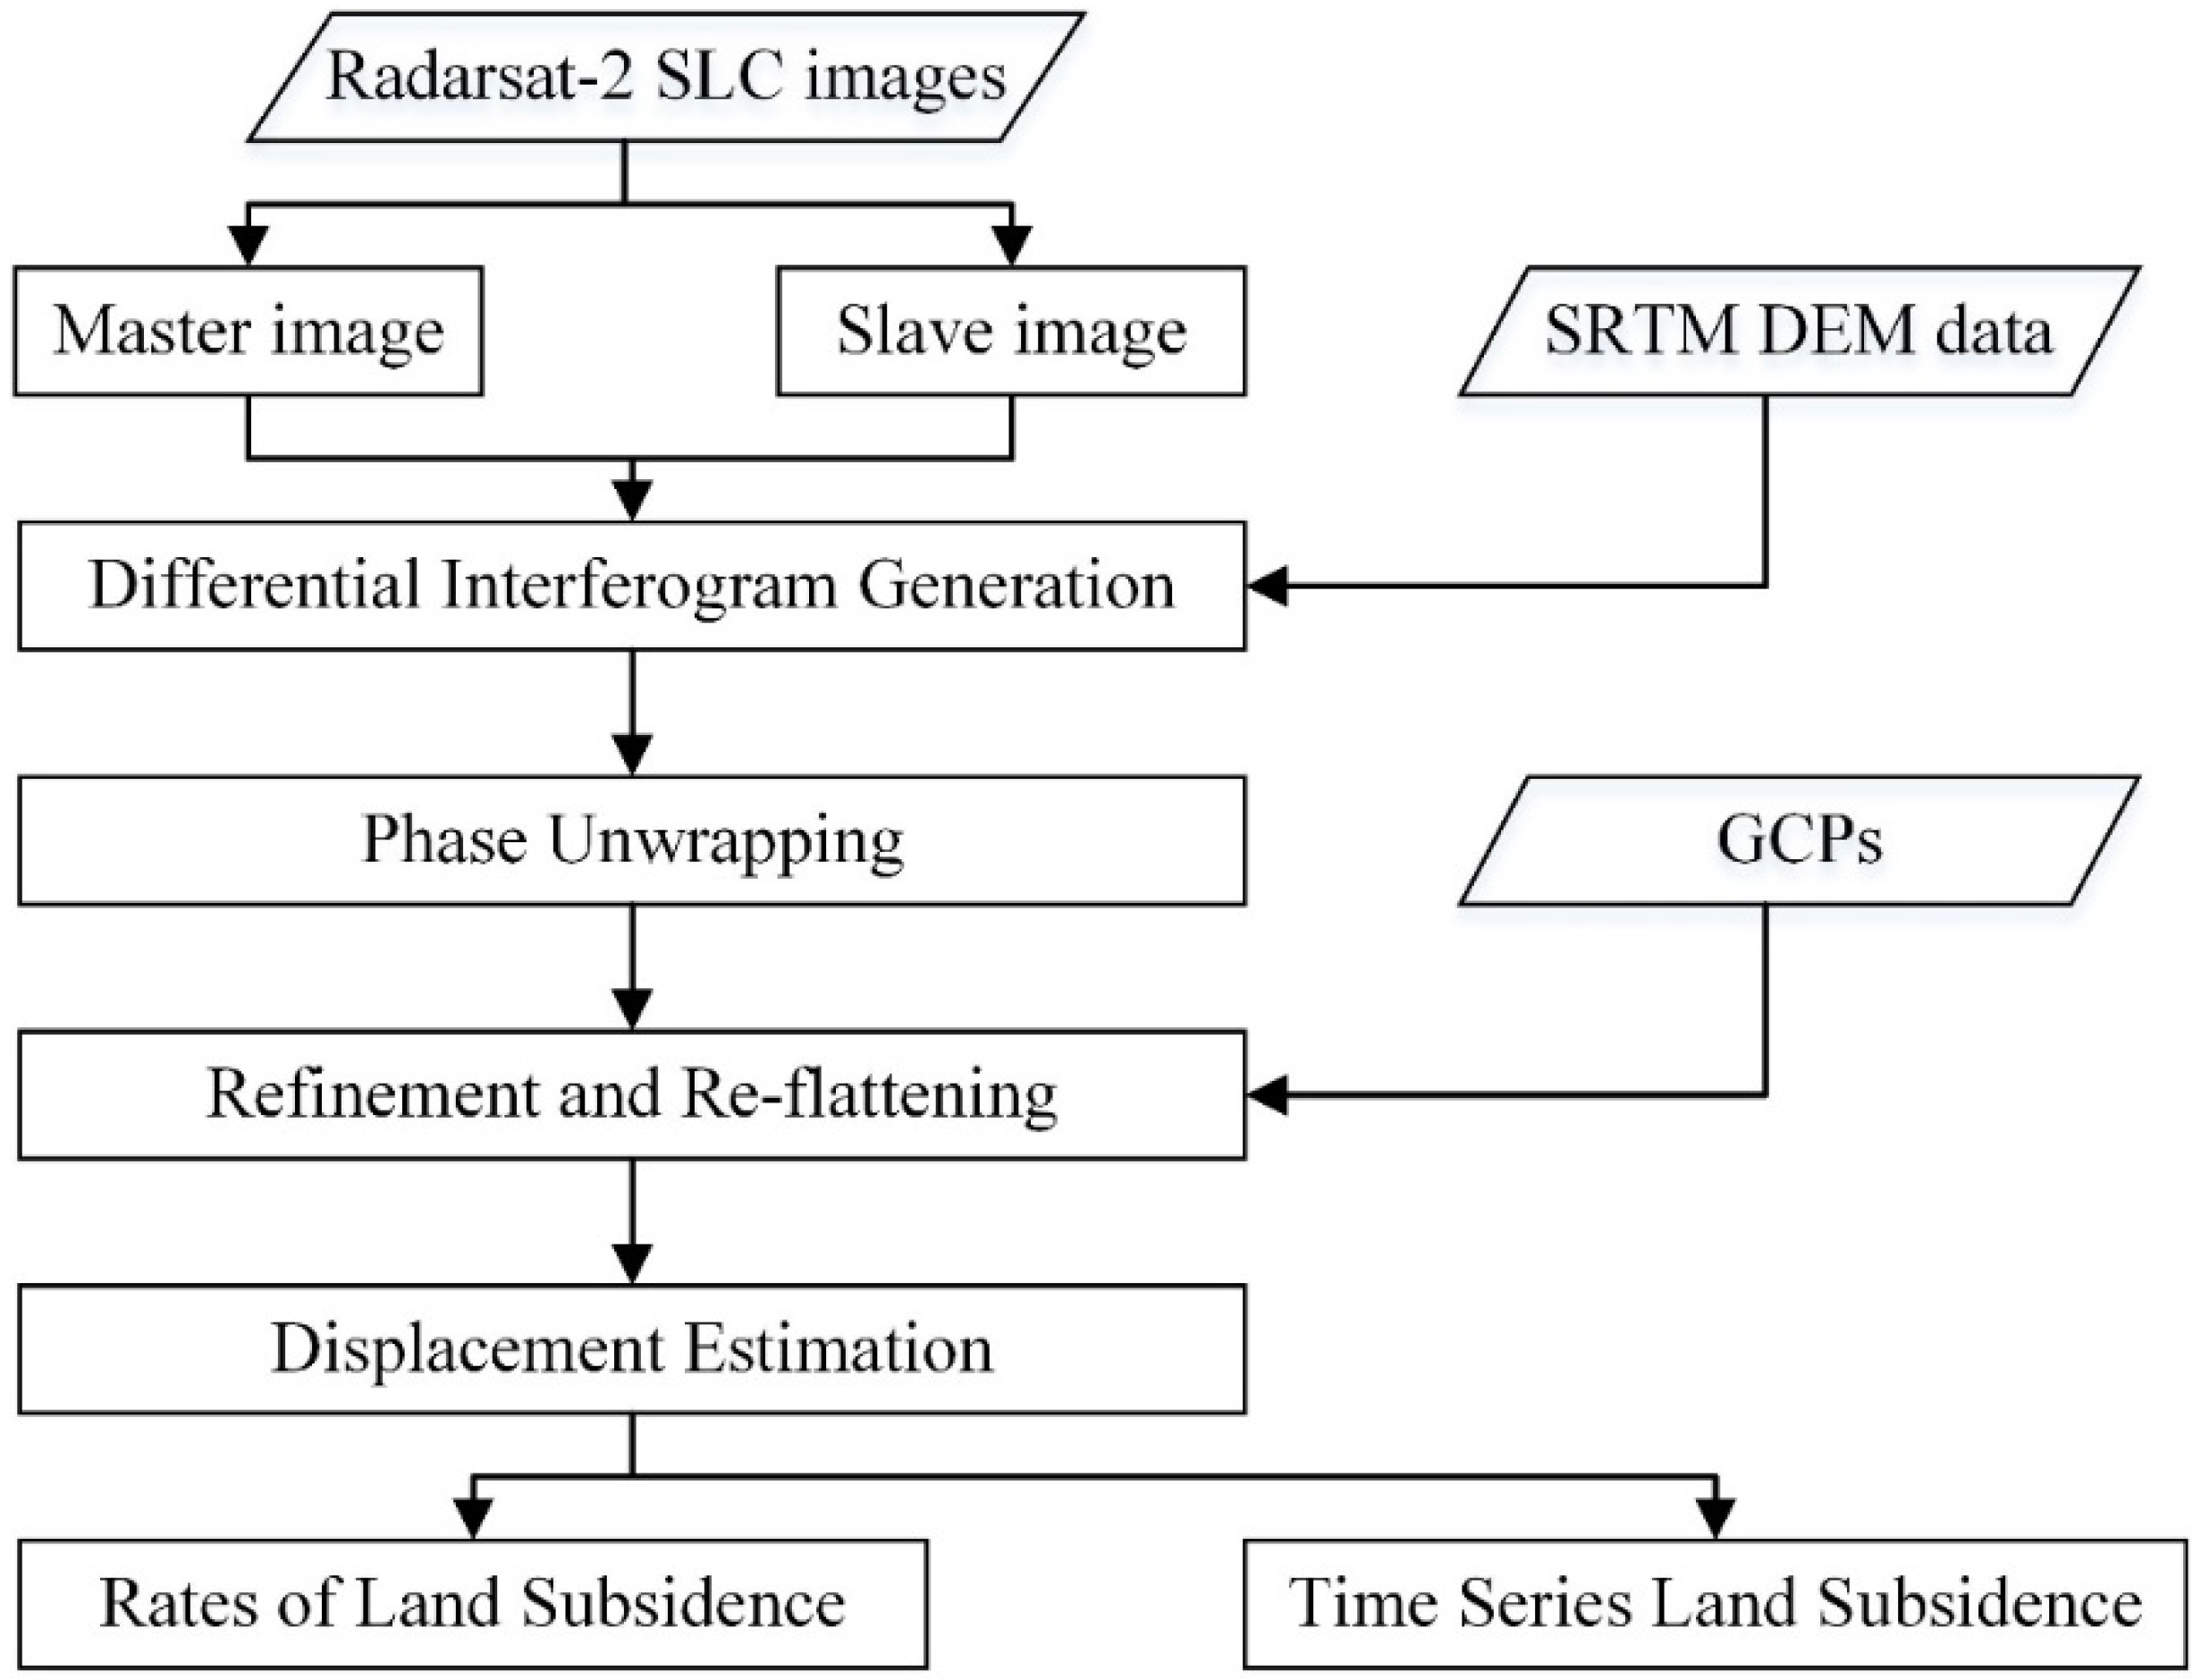
3. Methodology
3.1. Differential Interferogram Generation
3.2. Phase Unwrapping
3.3. Refinement and Re-flattening
3.4. Displacement Estimation
3.5. InSAR Data Validation by Using Leveling Benchmarks
4. Results and Validation
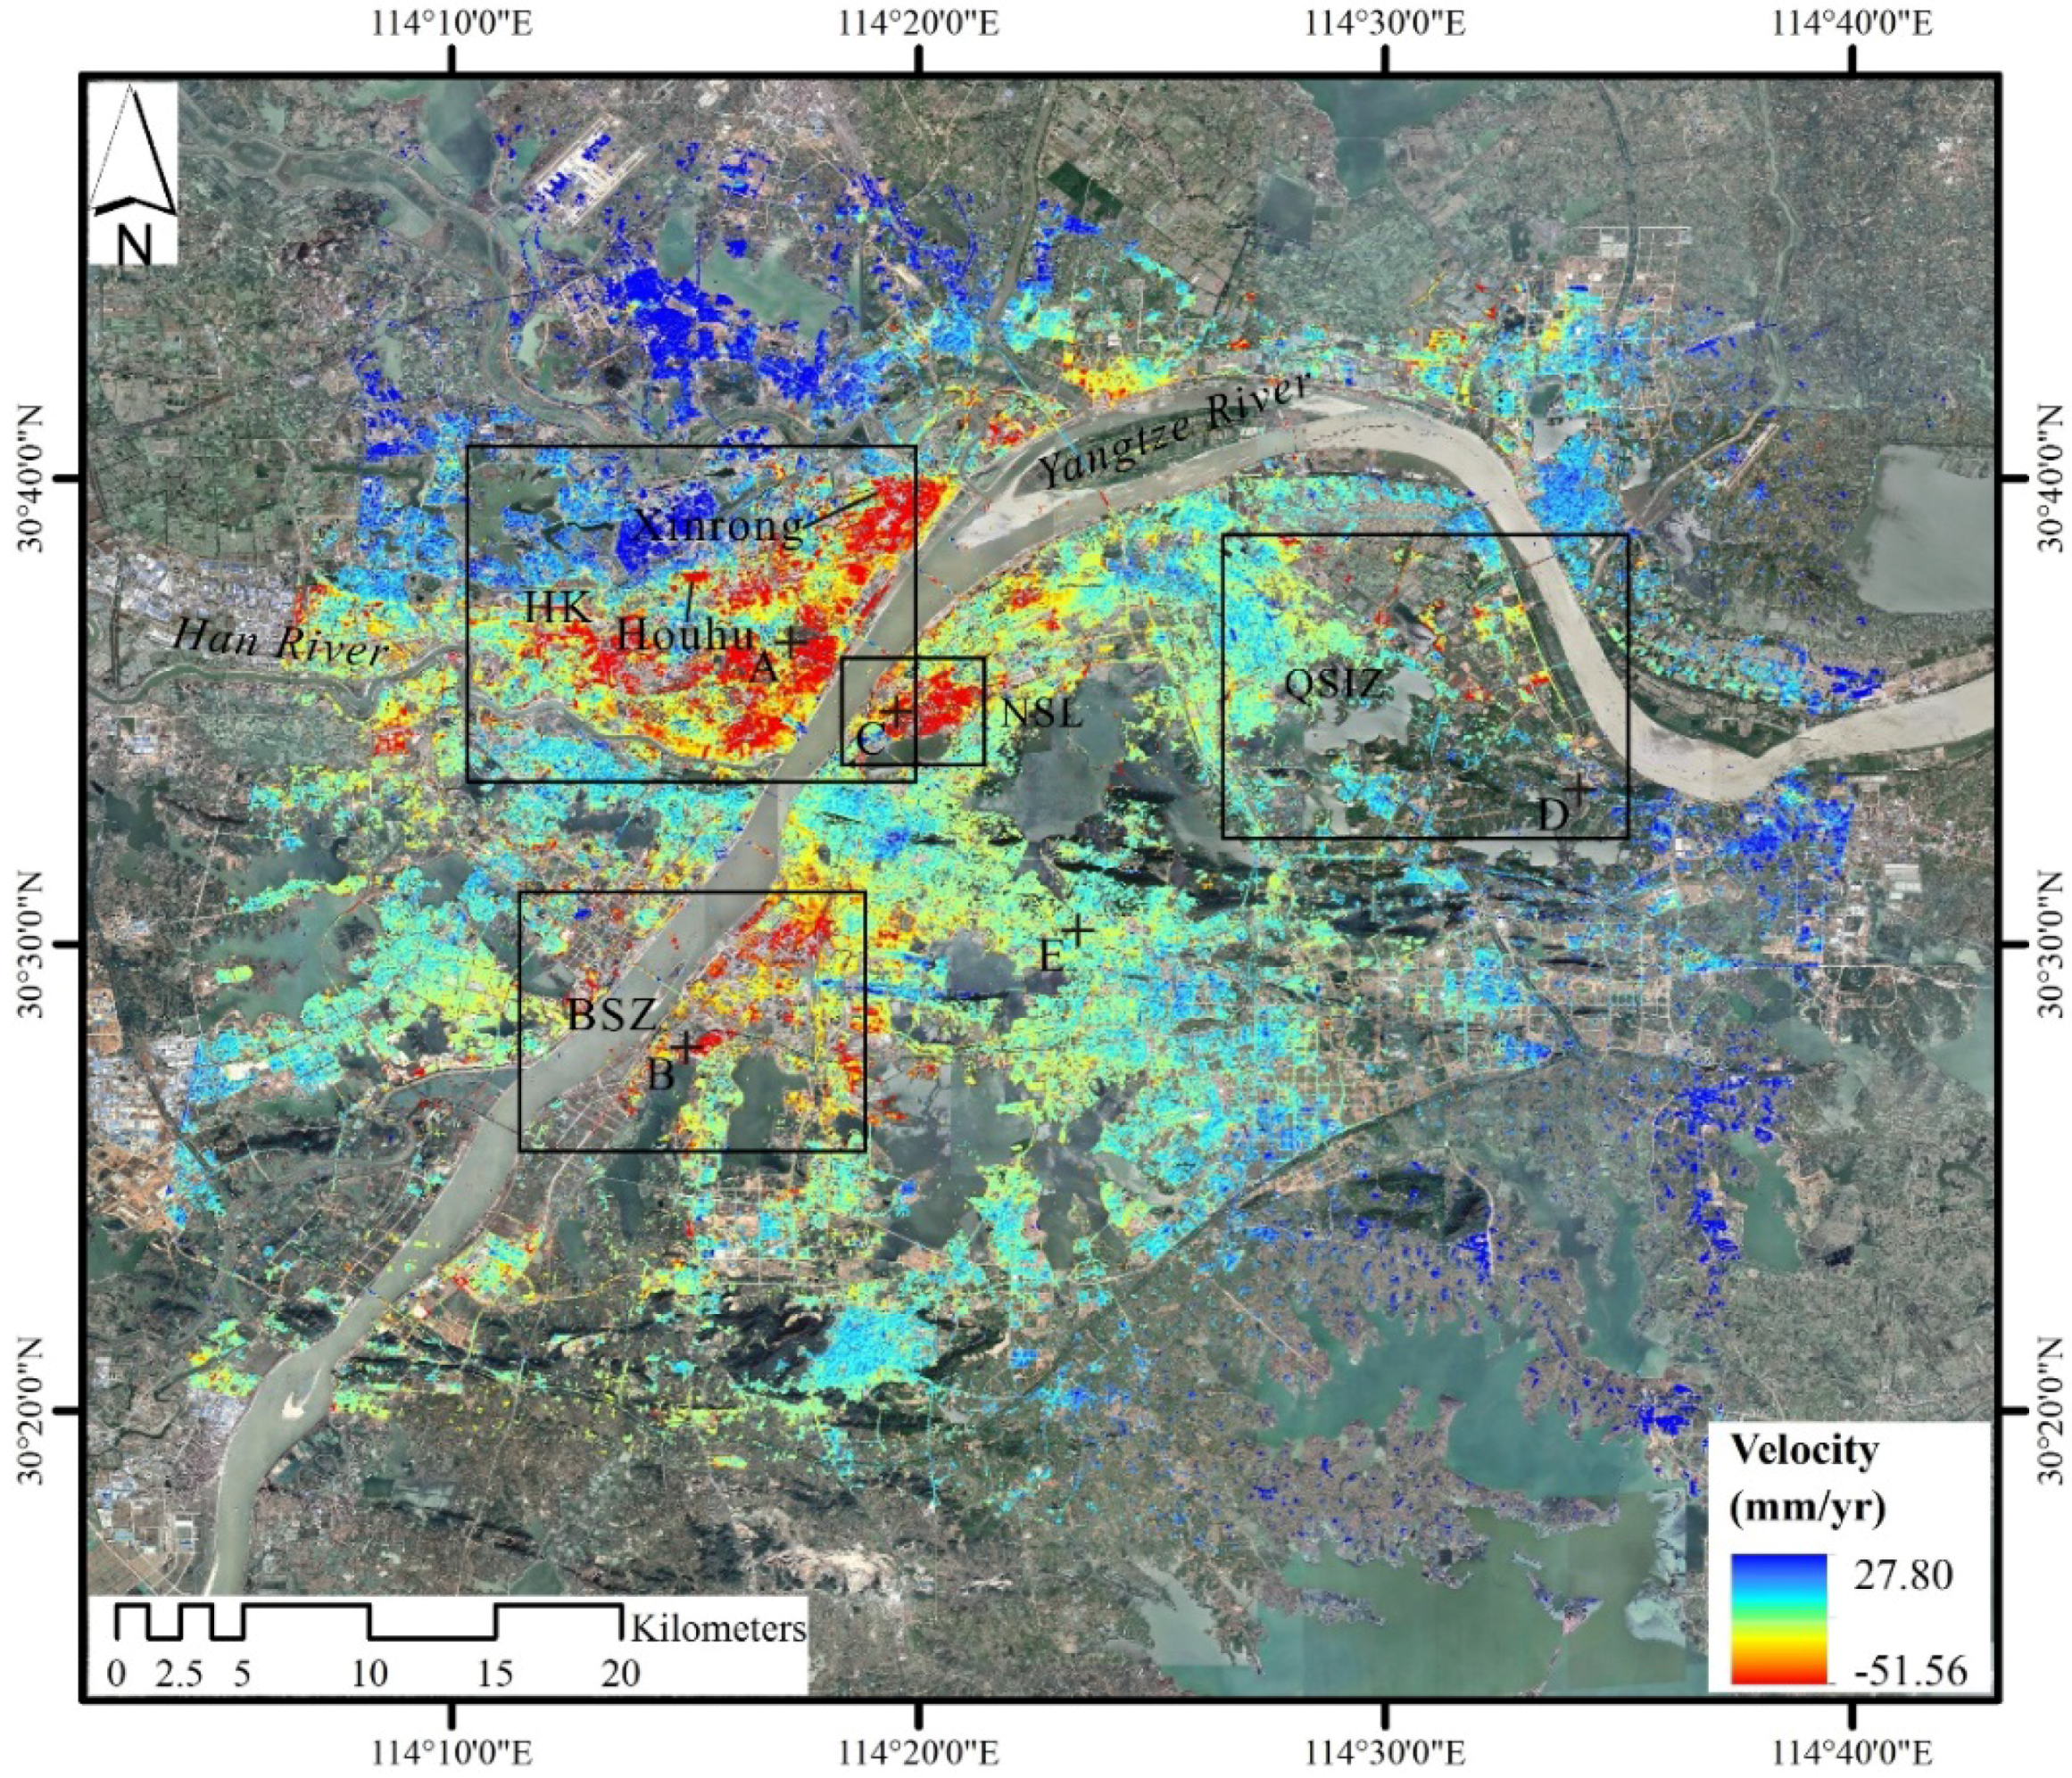
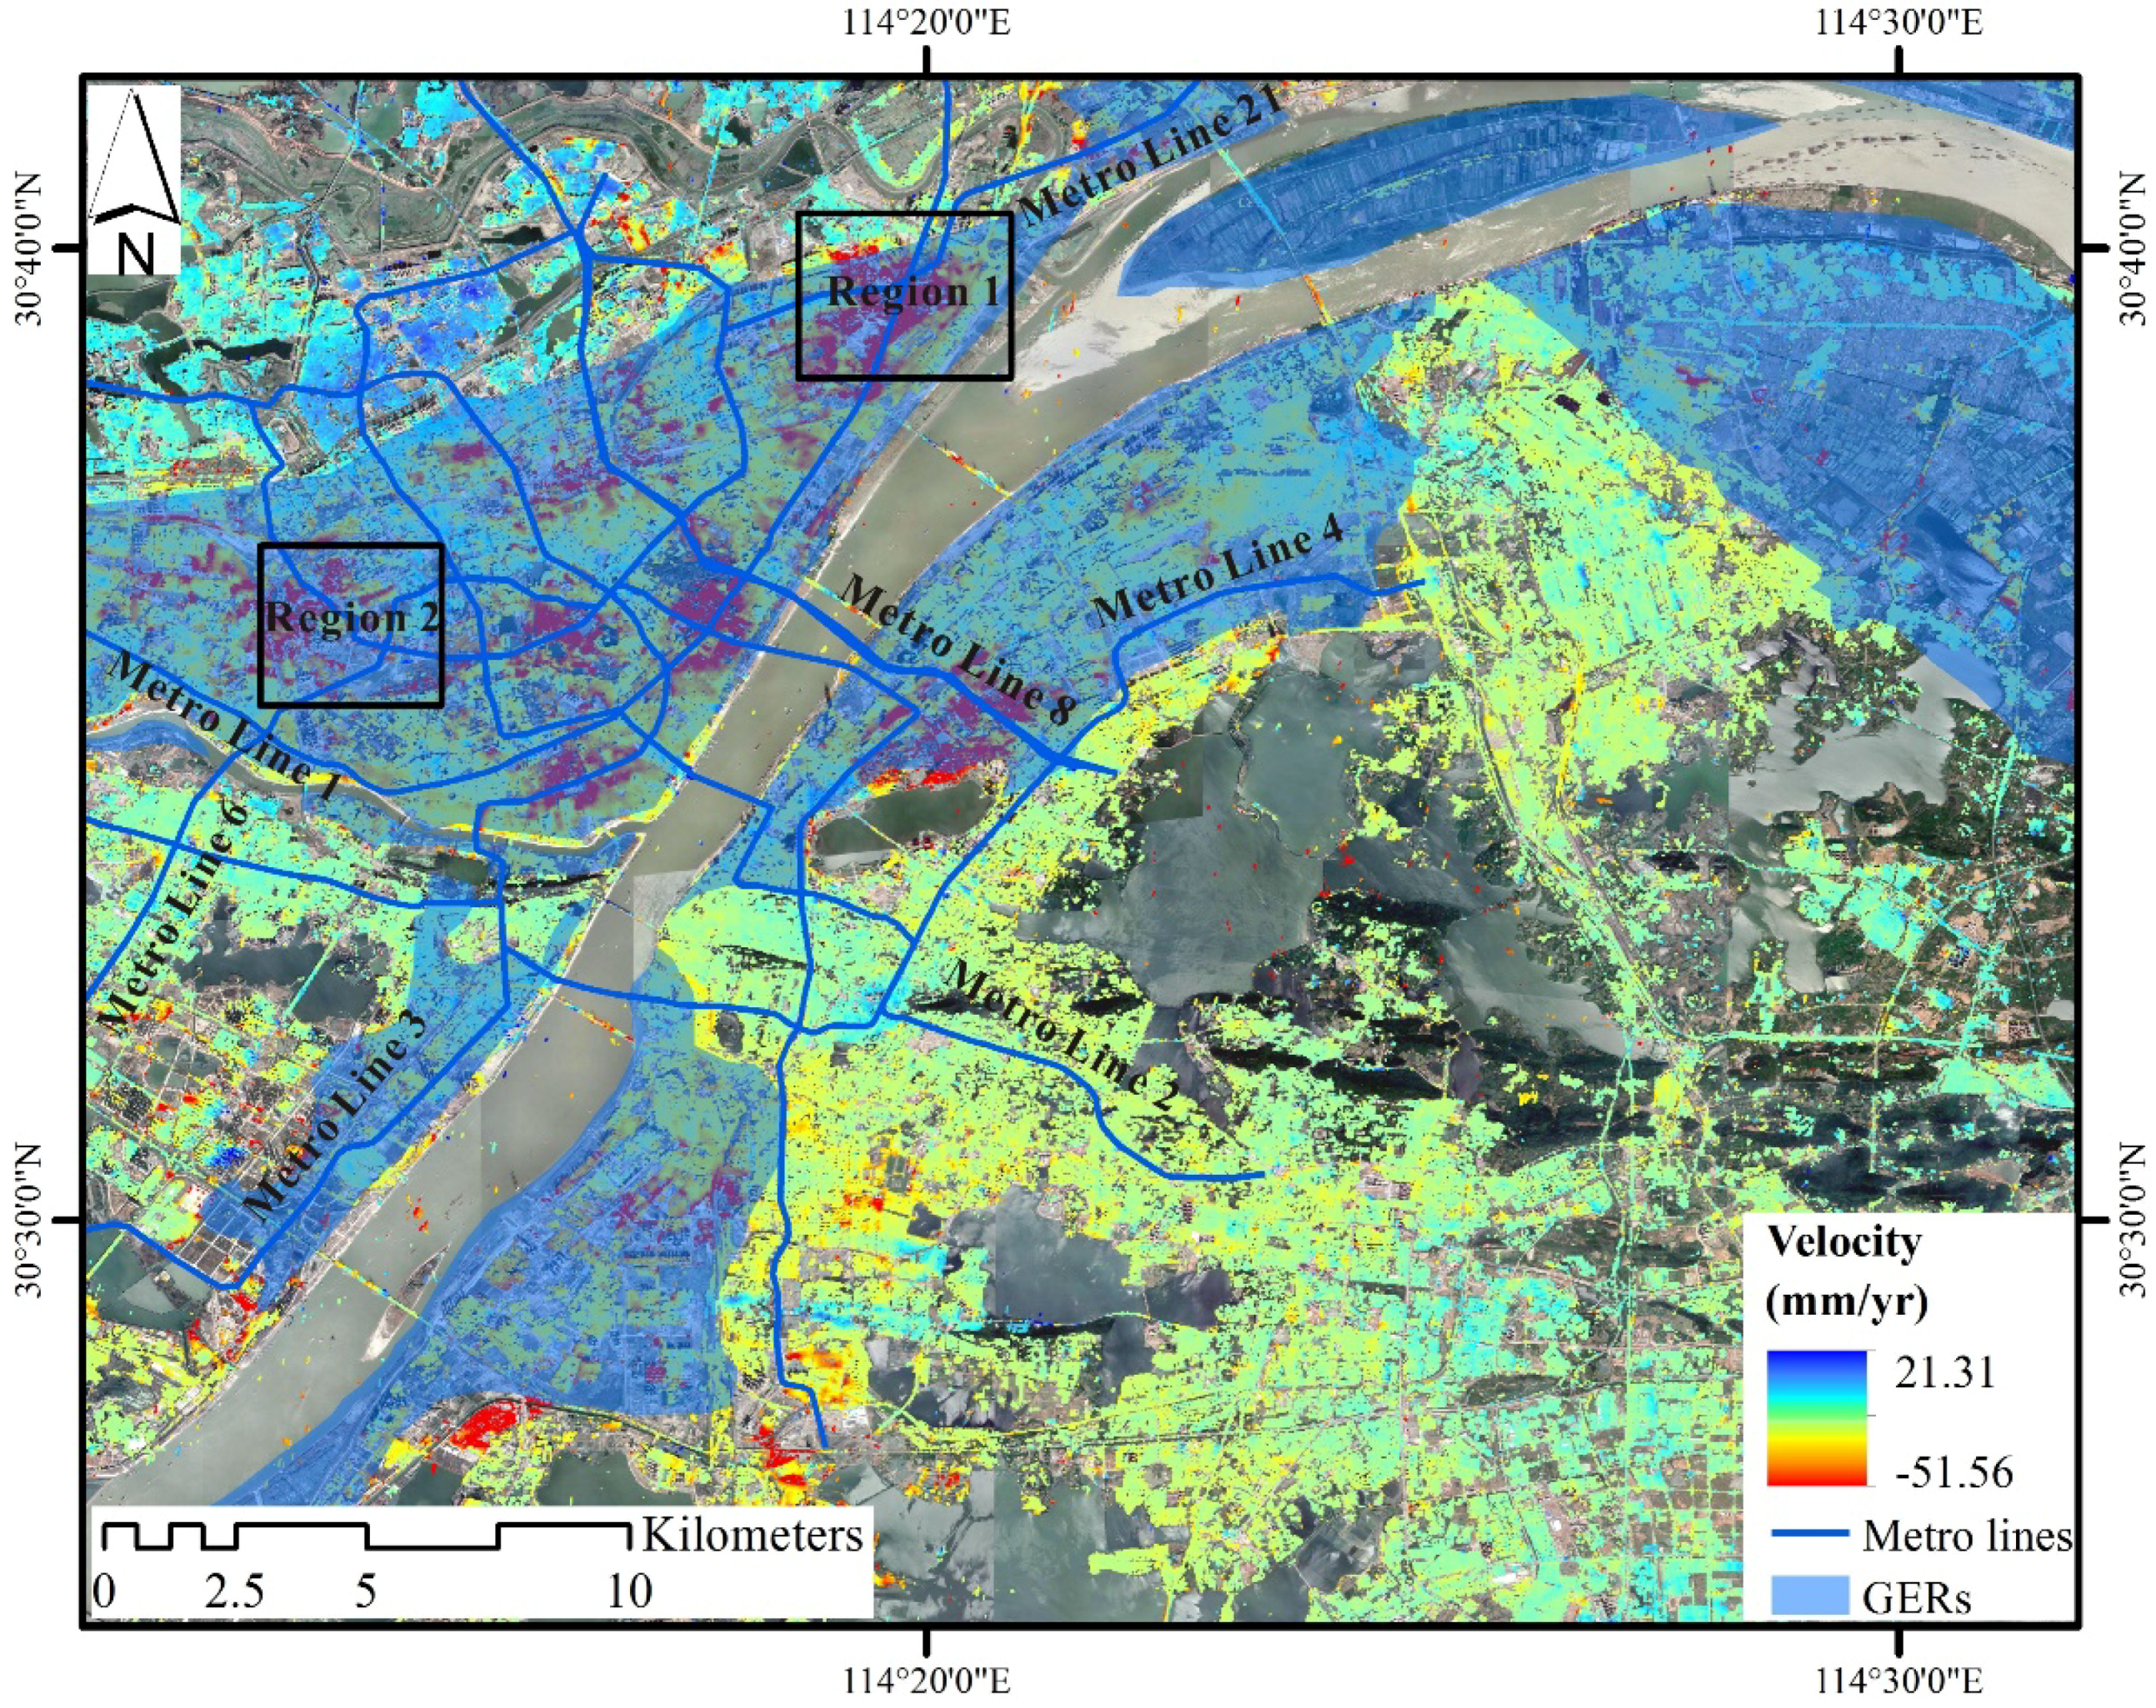
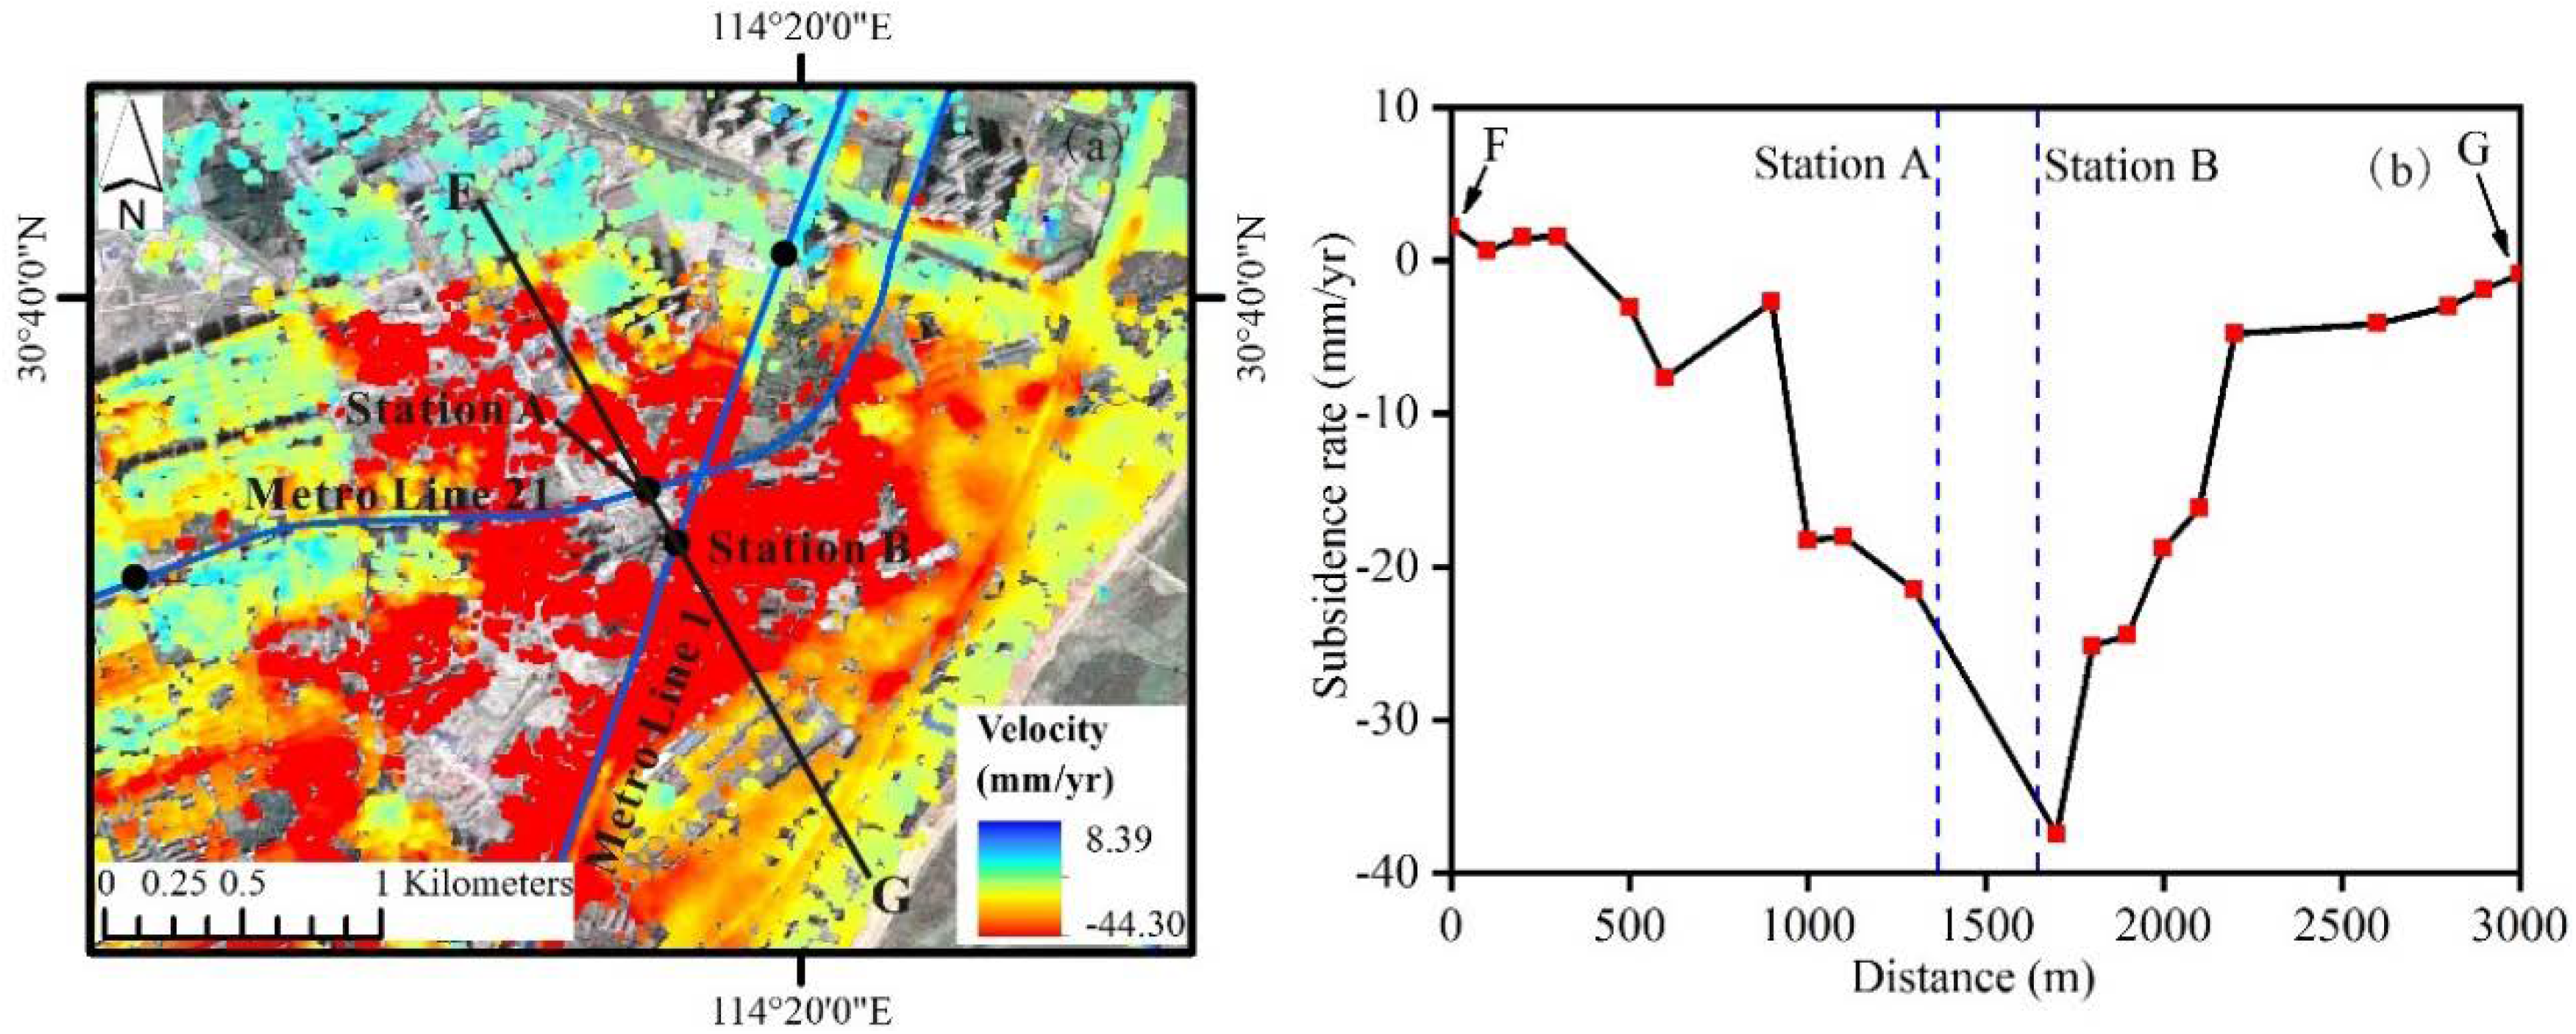
4.1. Rates of Land Subsidence
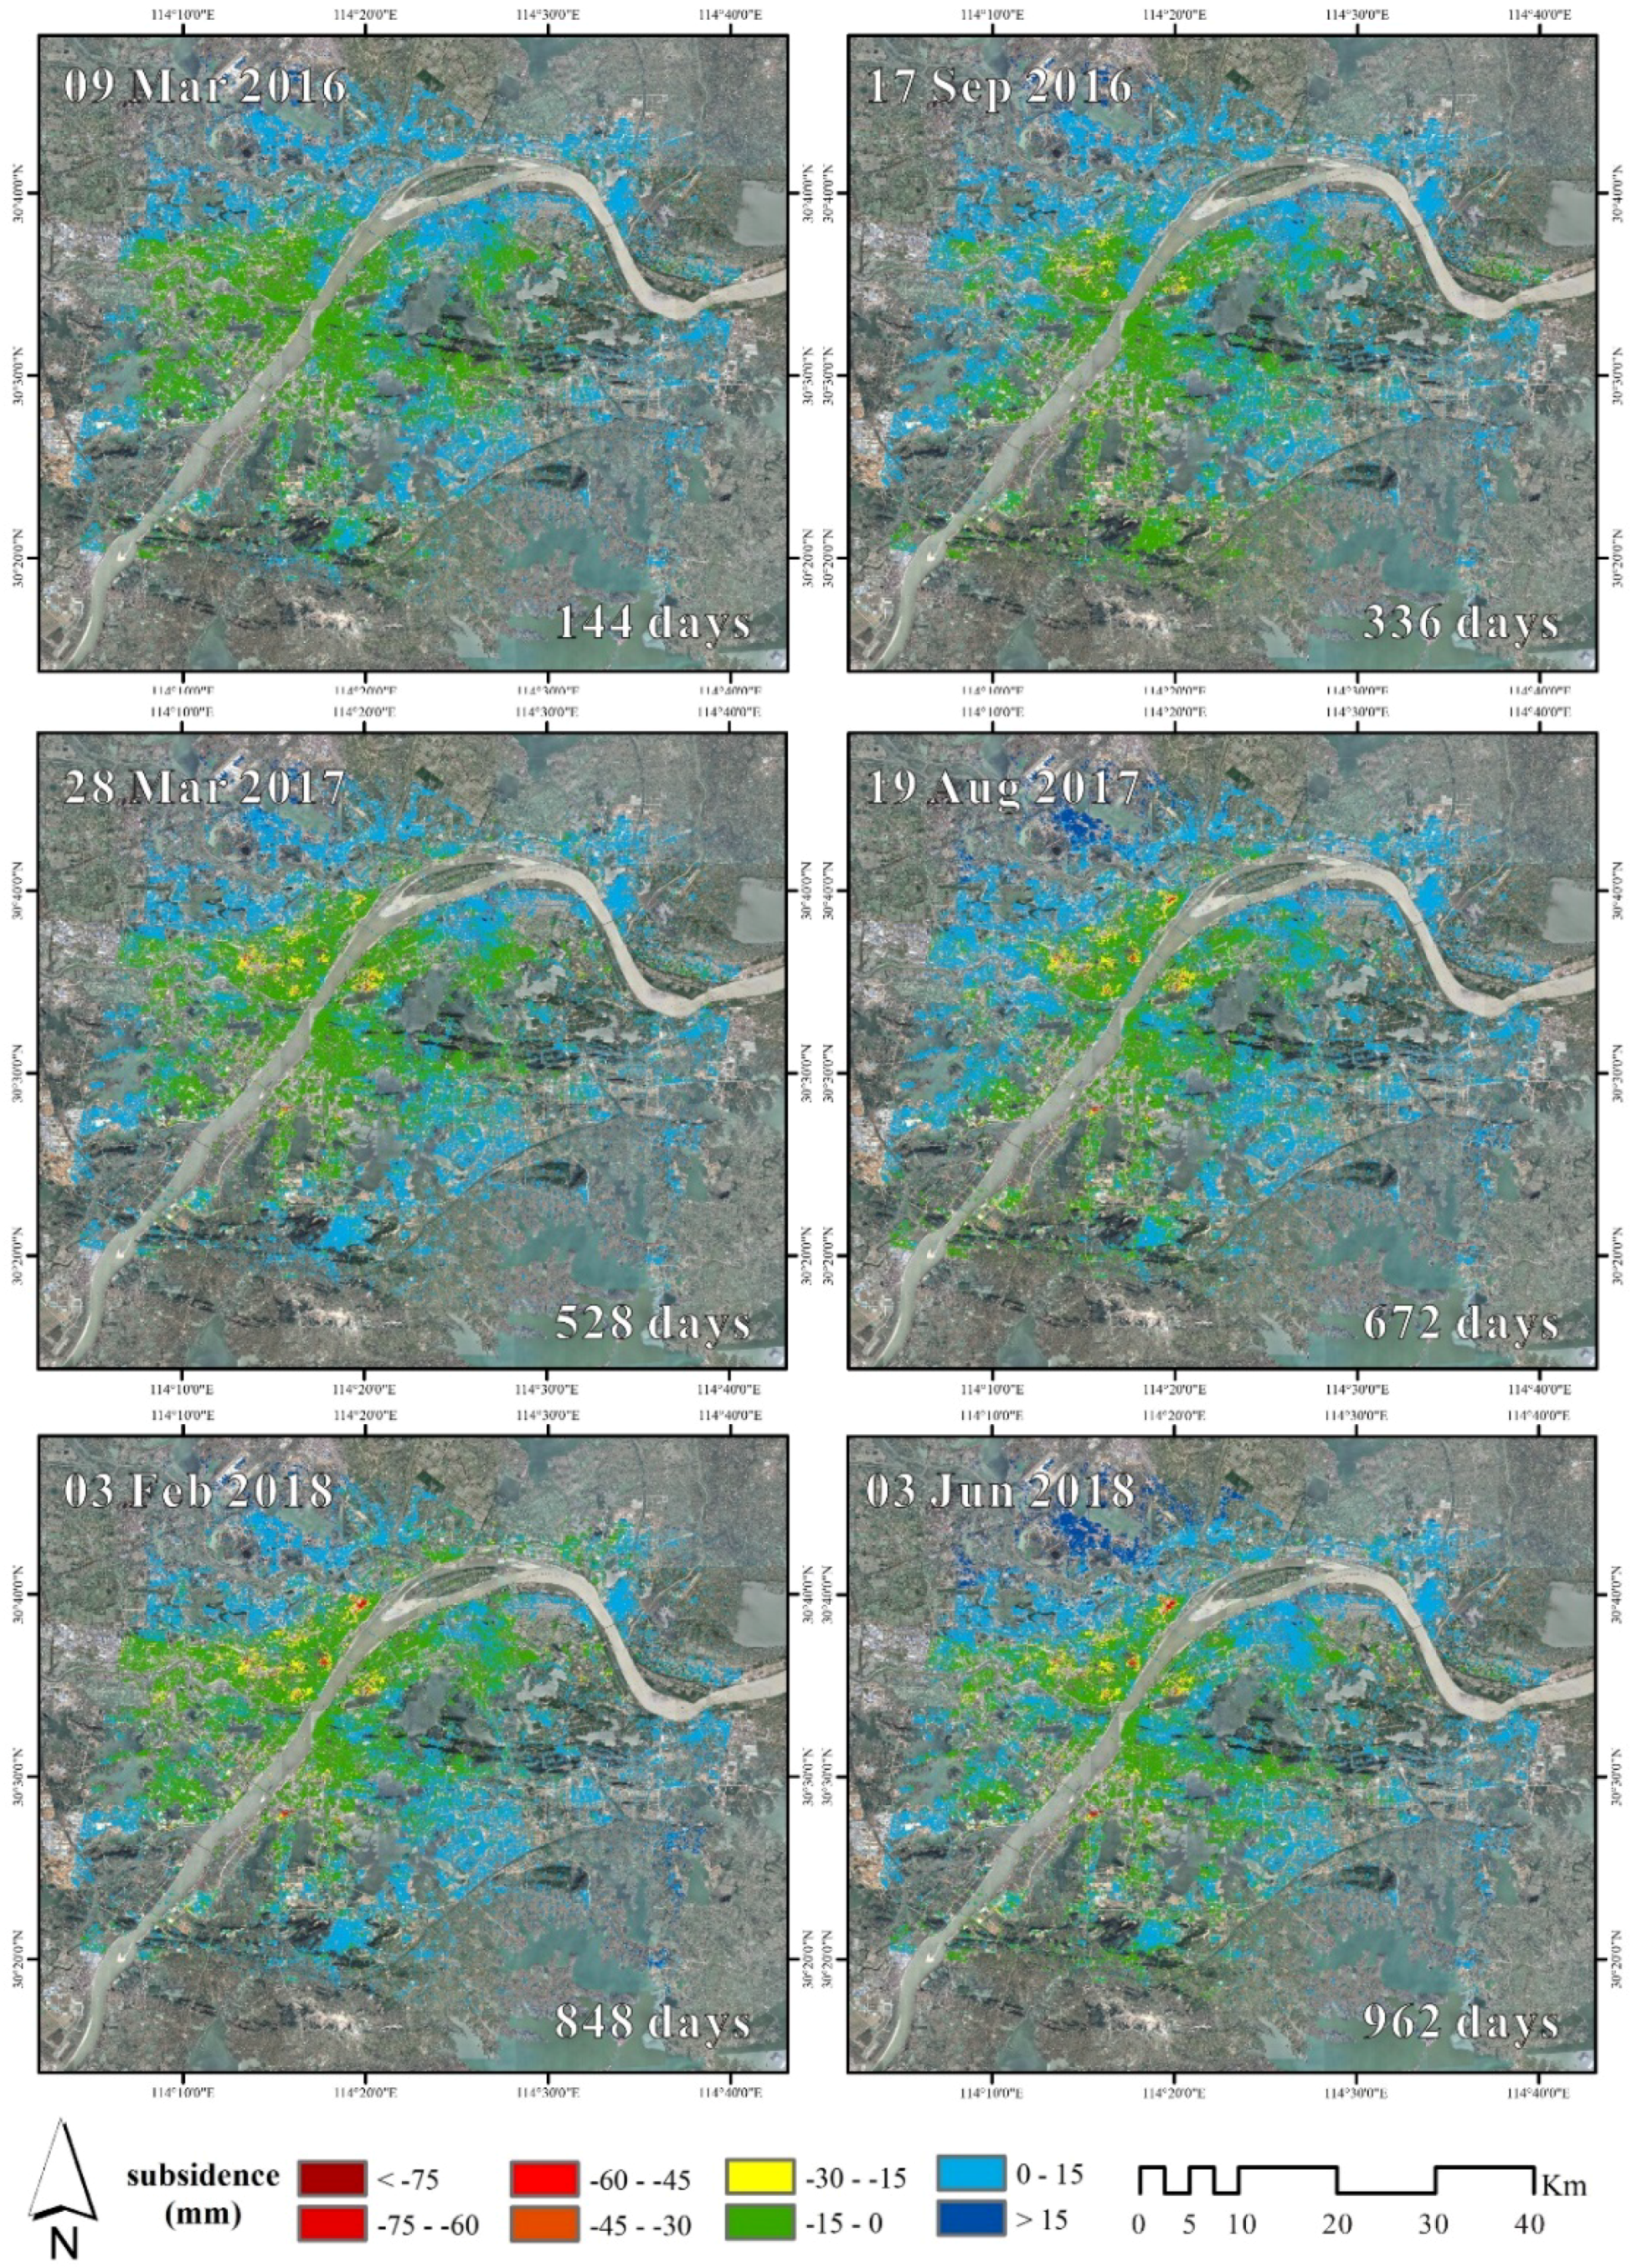
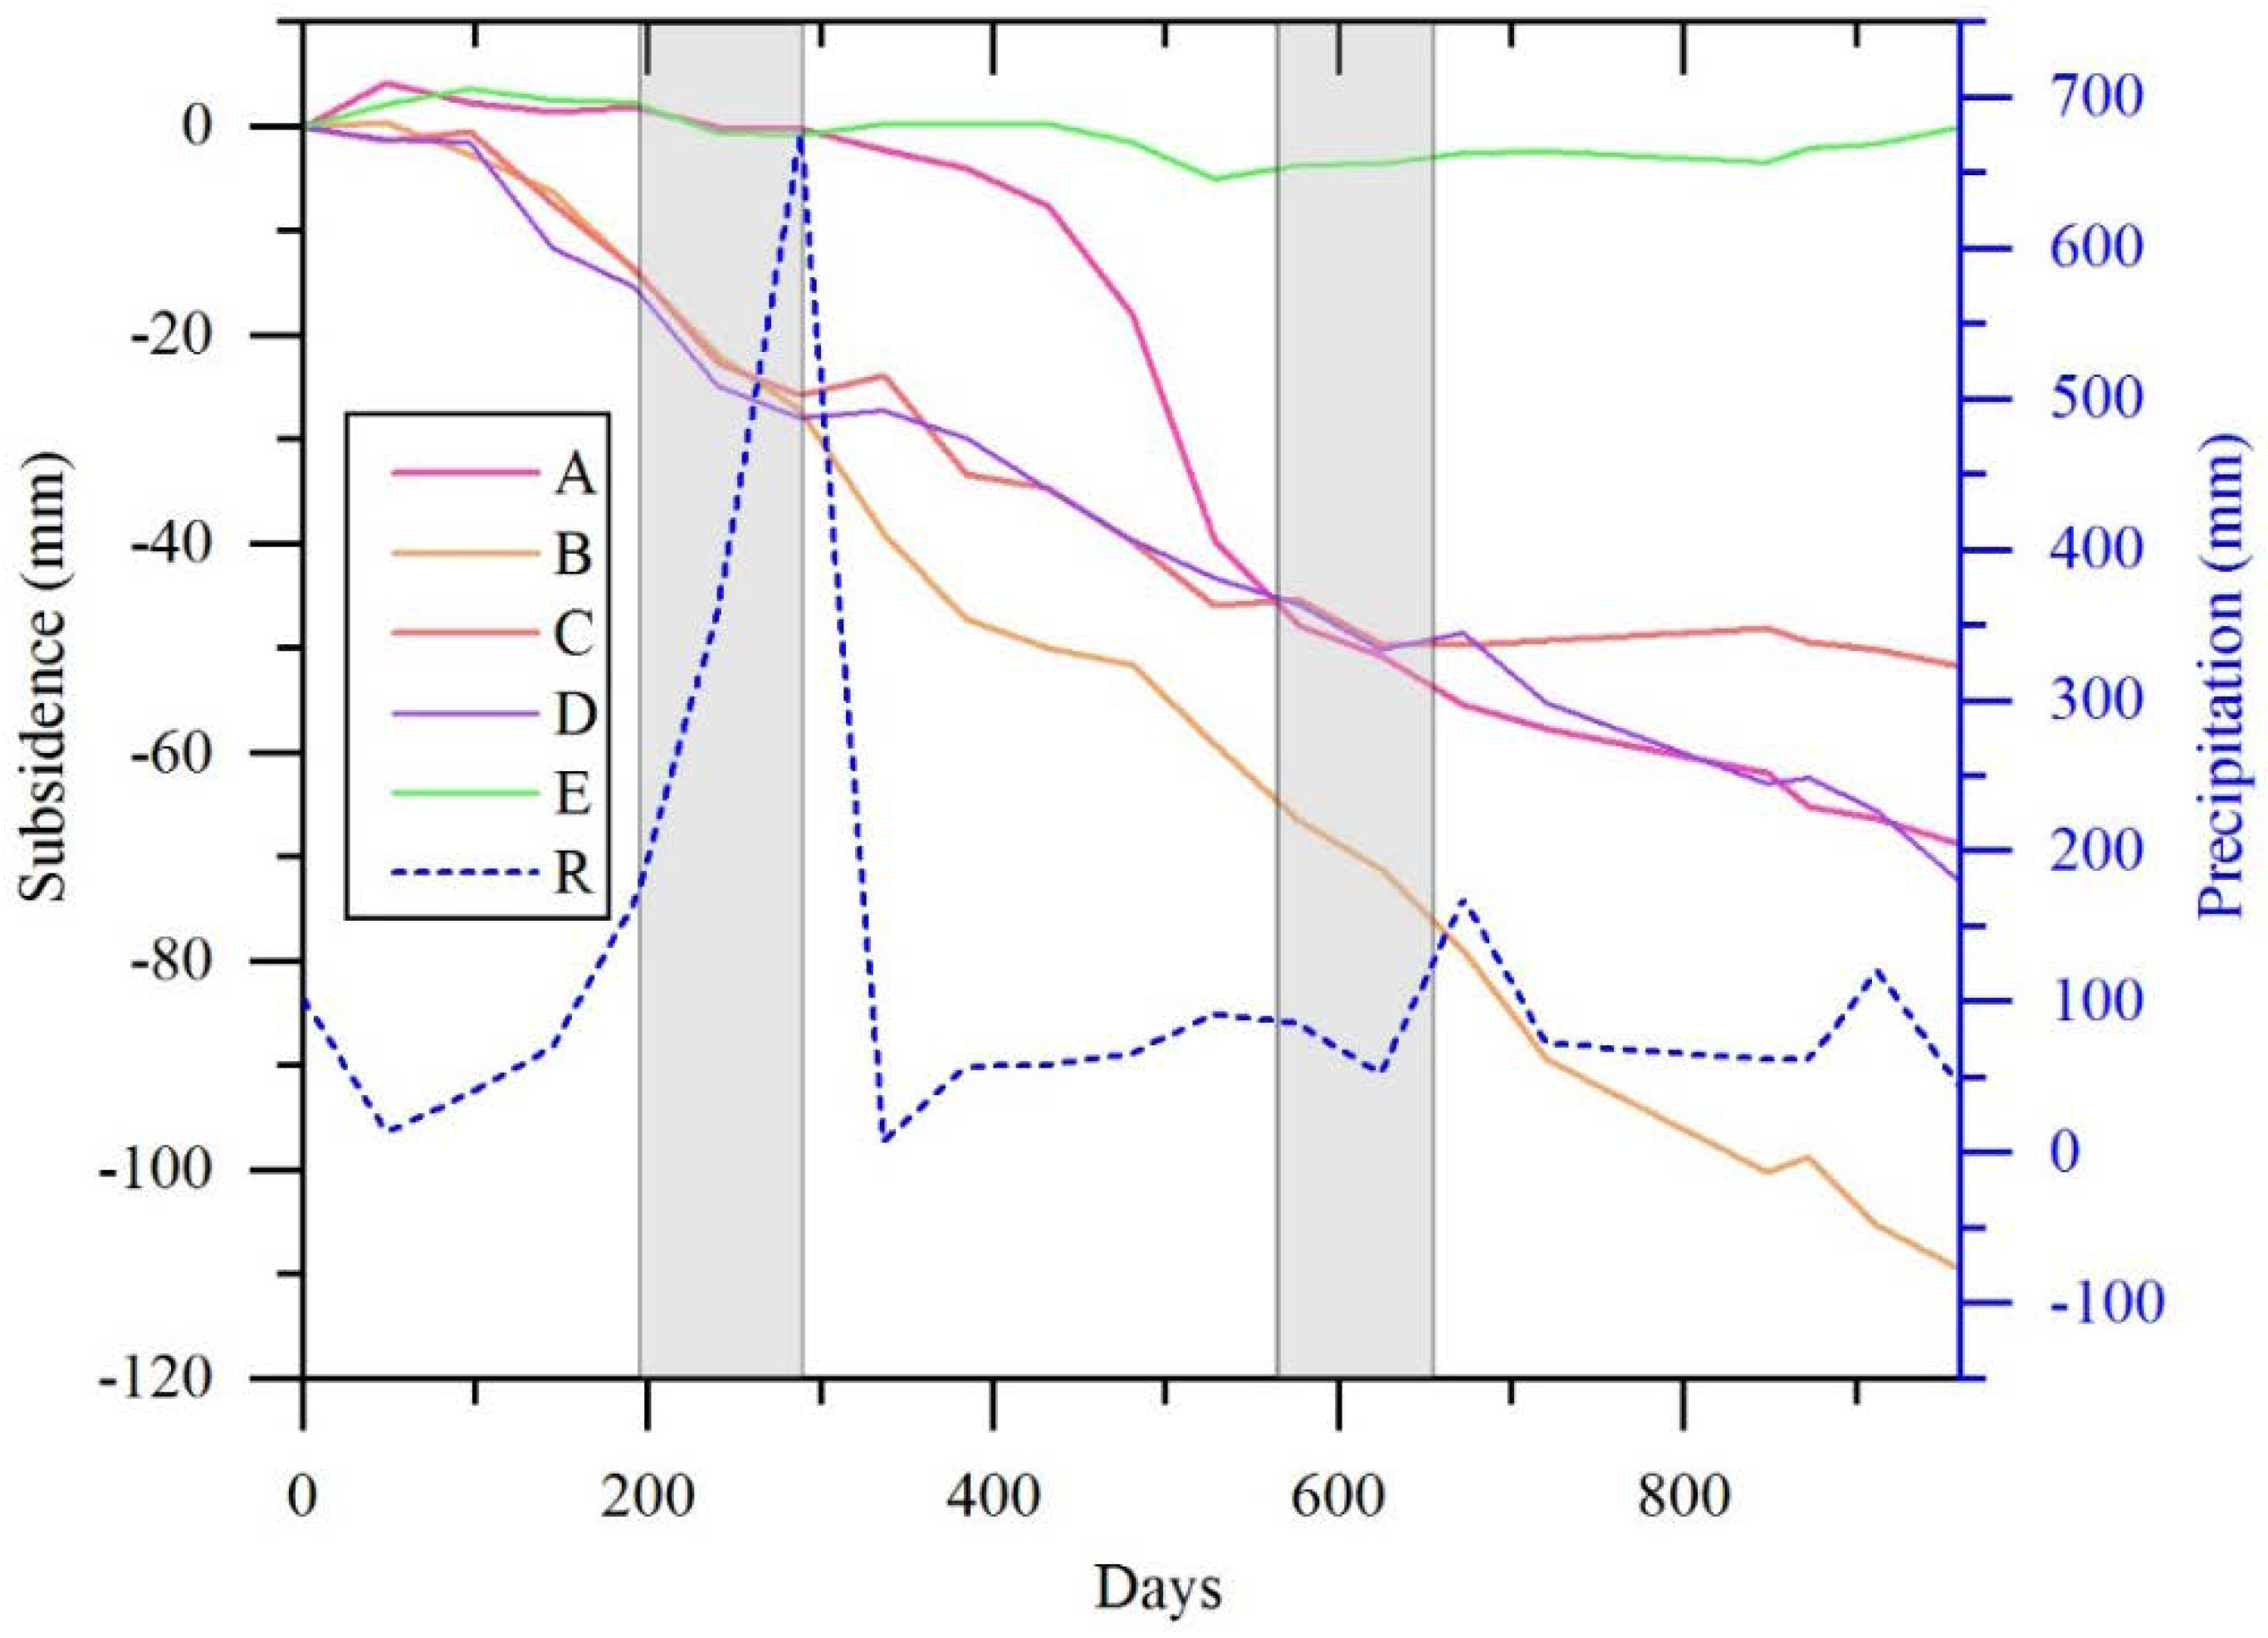
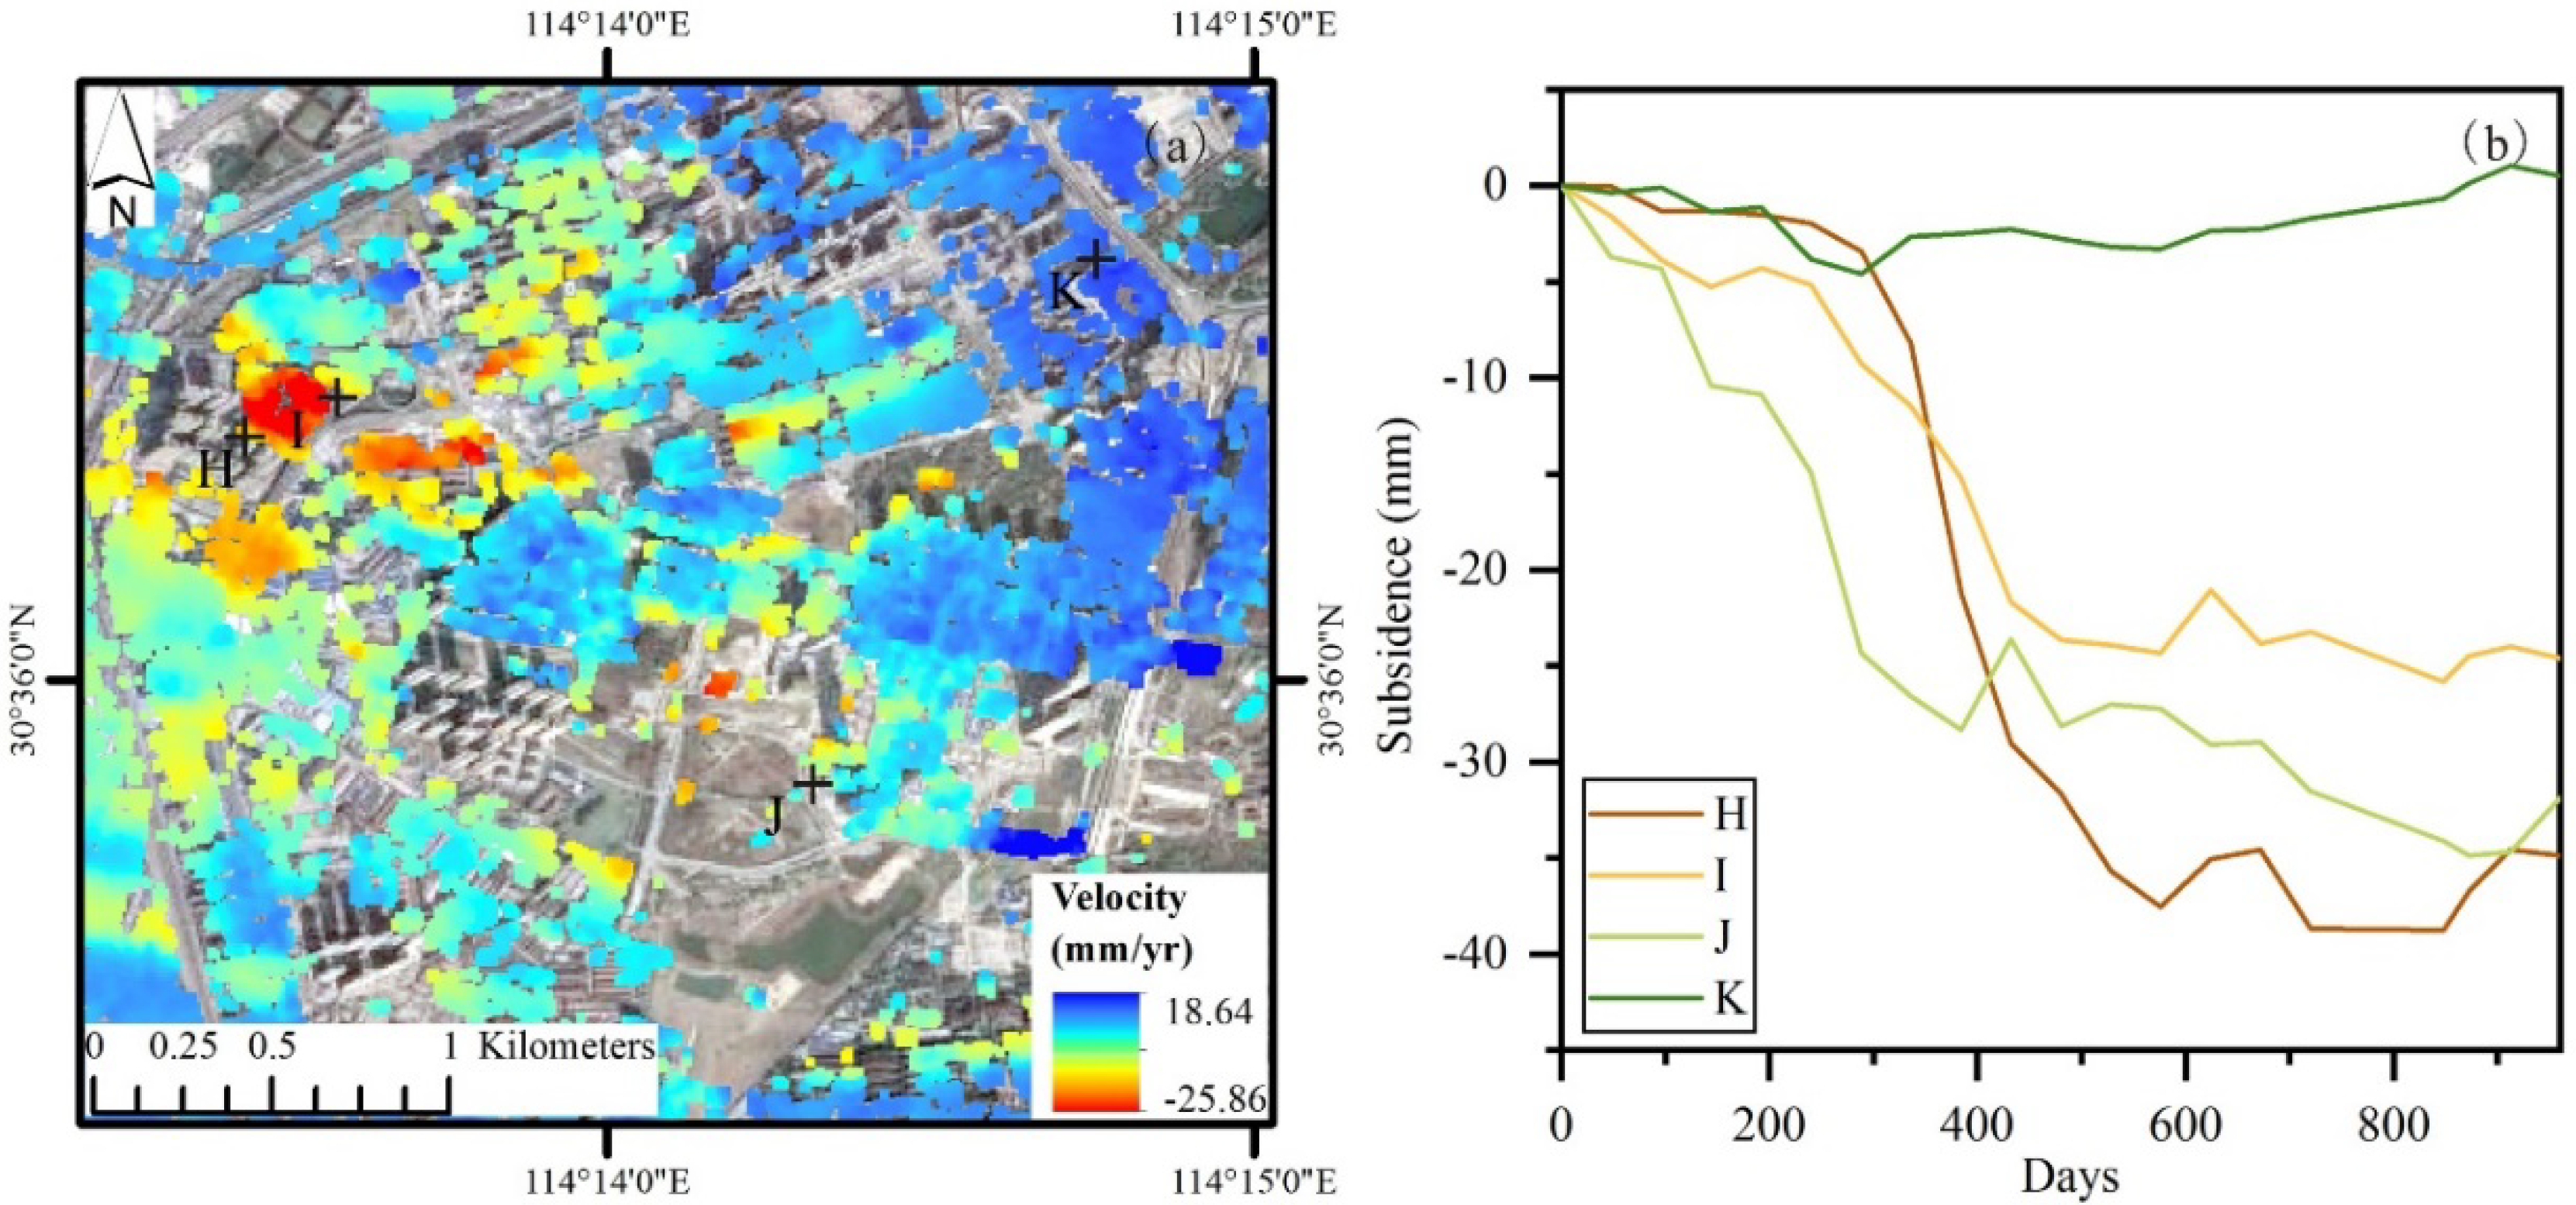
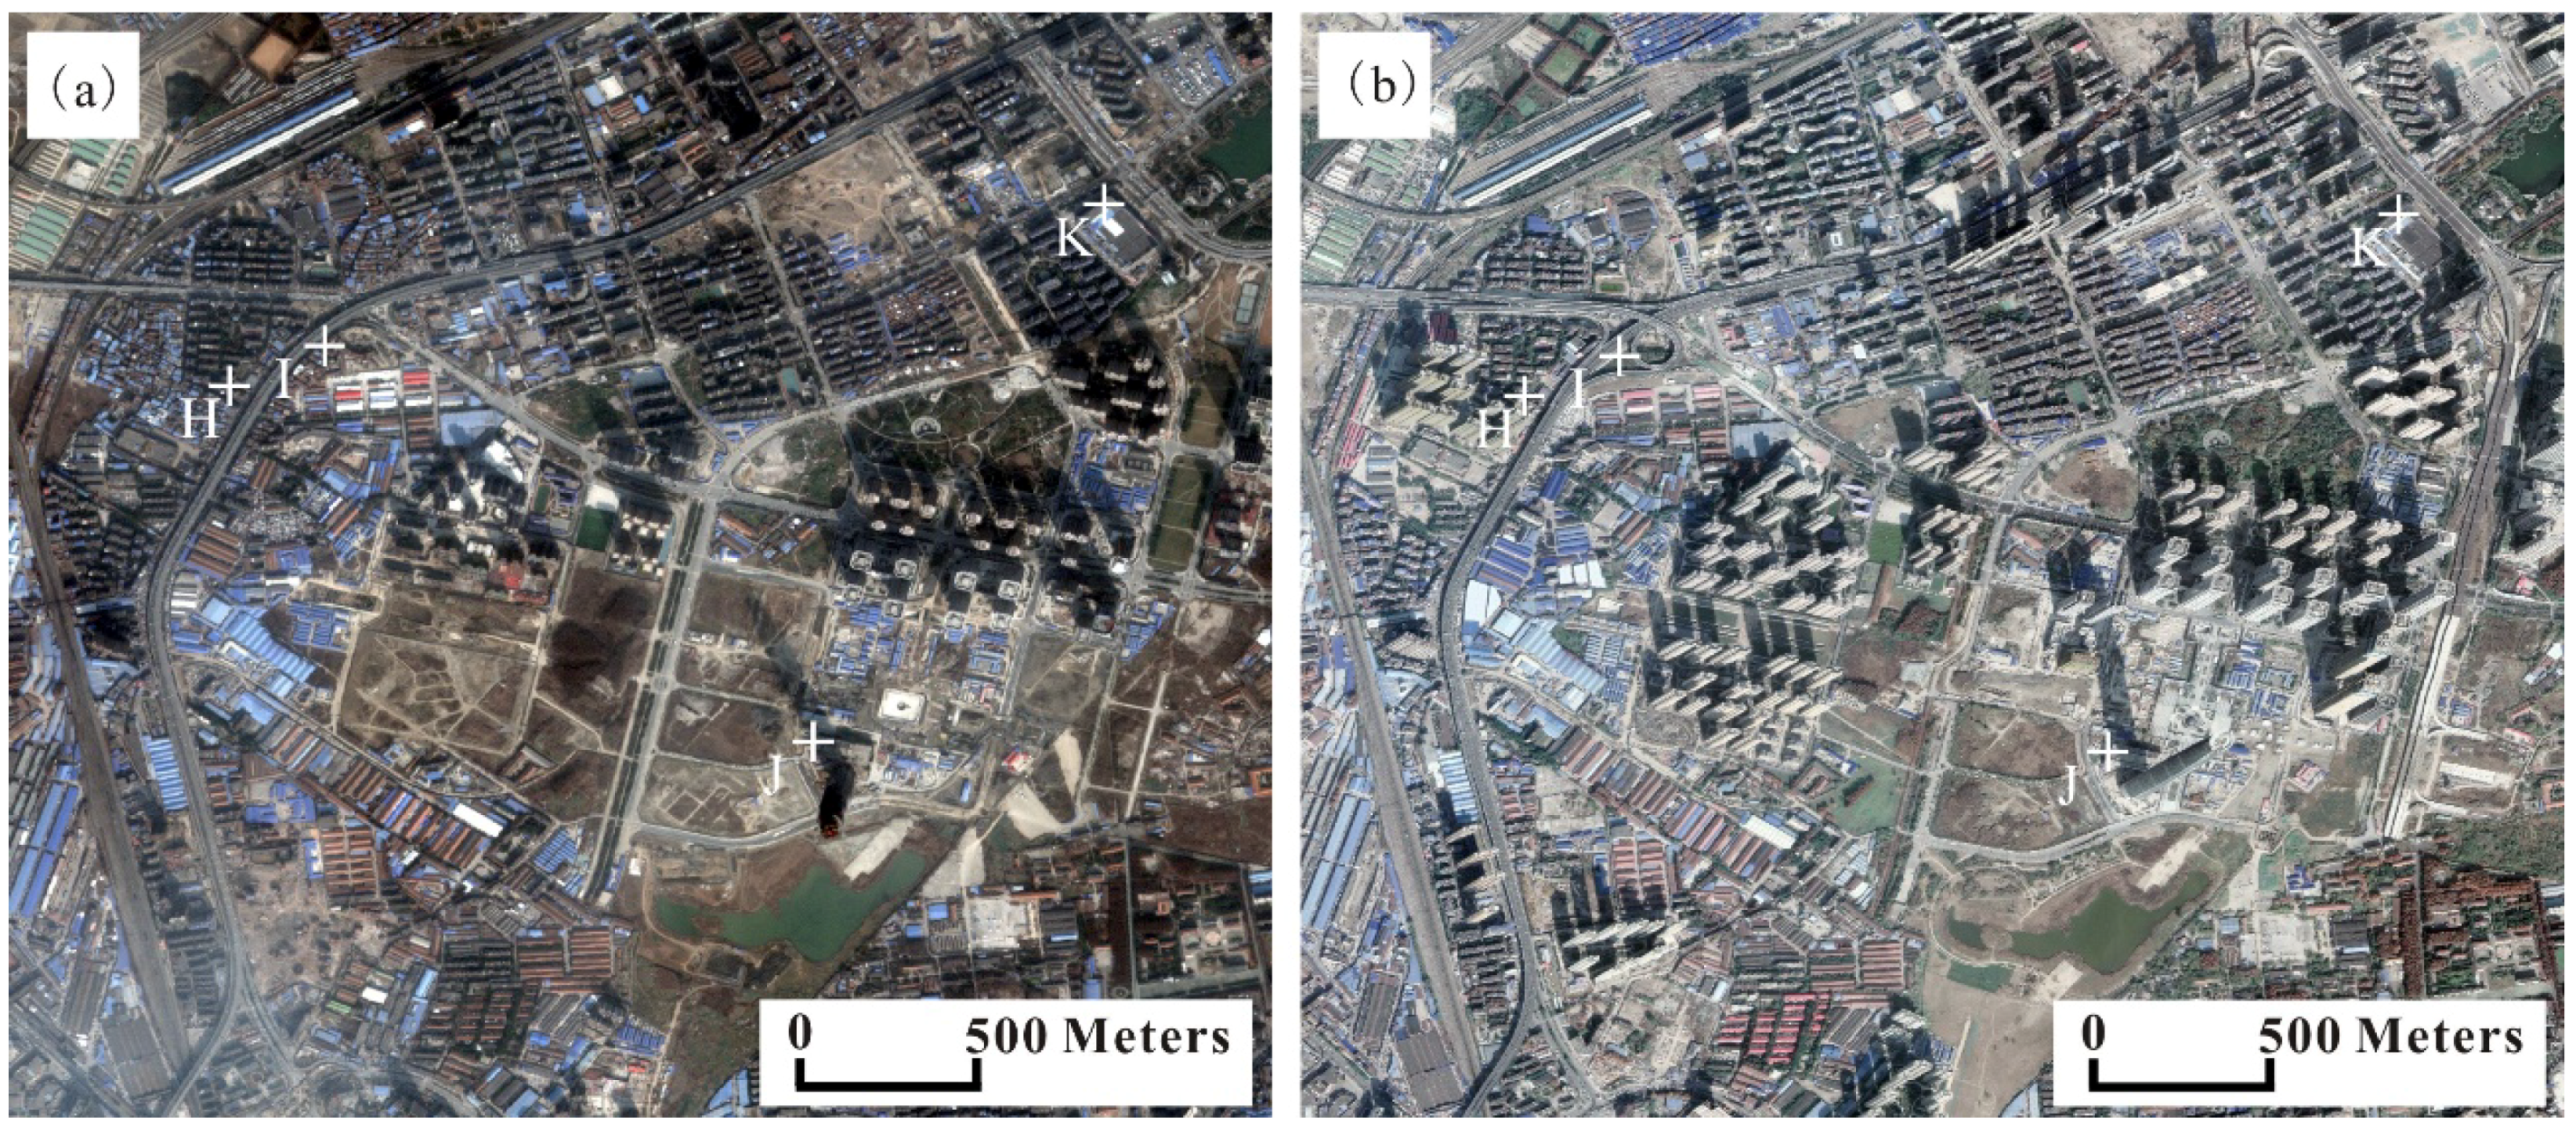
4.2. Evolution of Land Subsidence
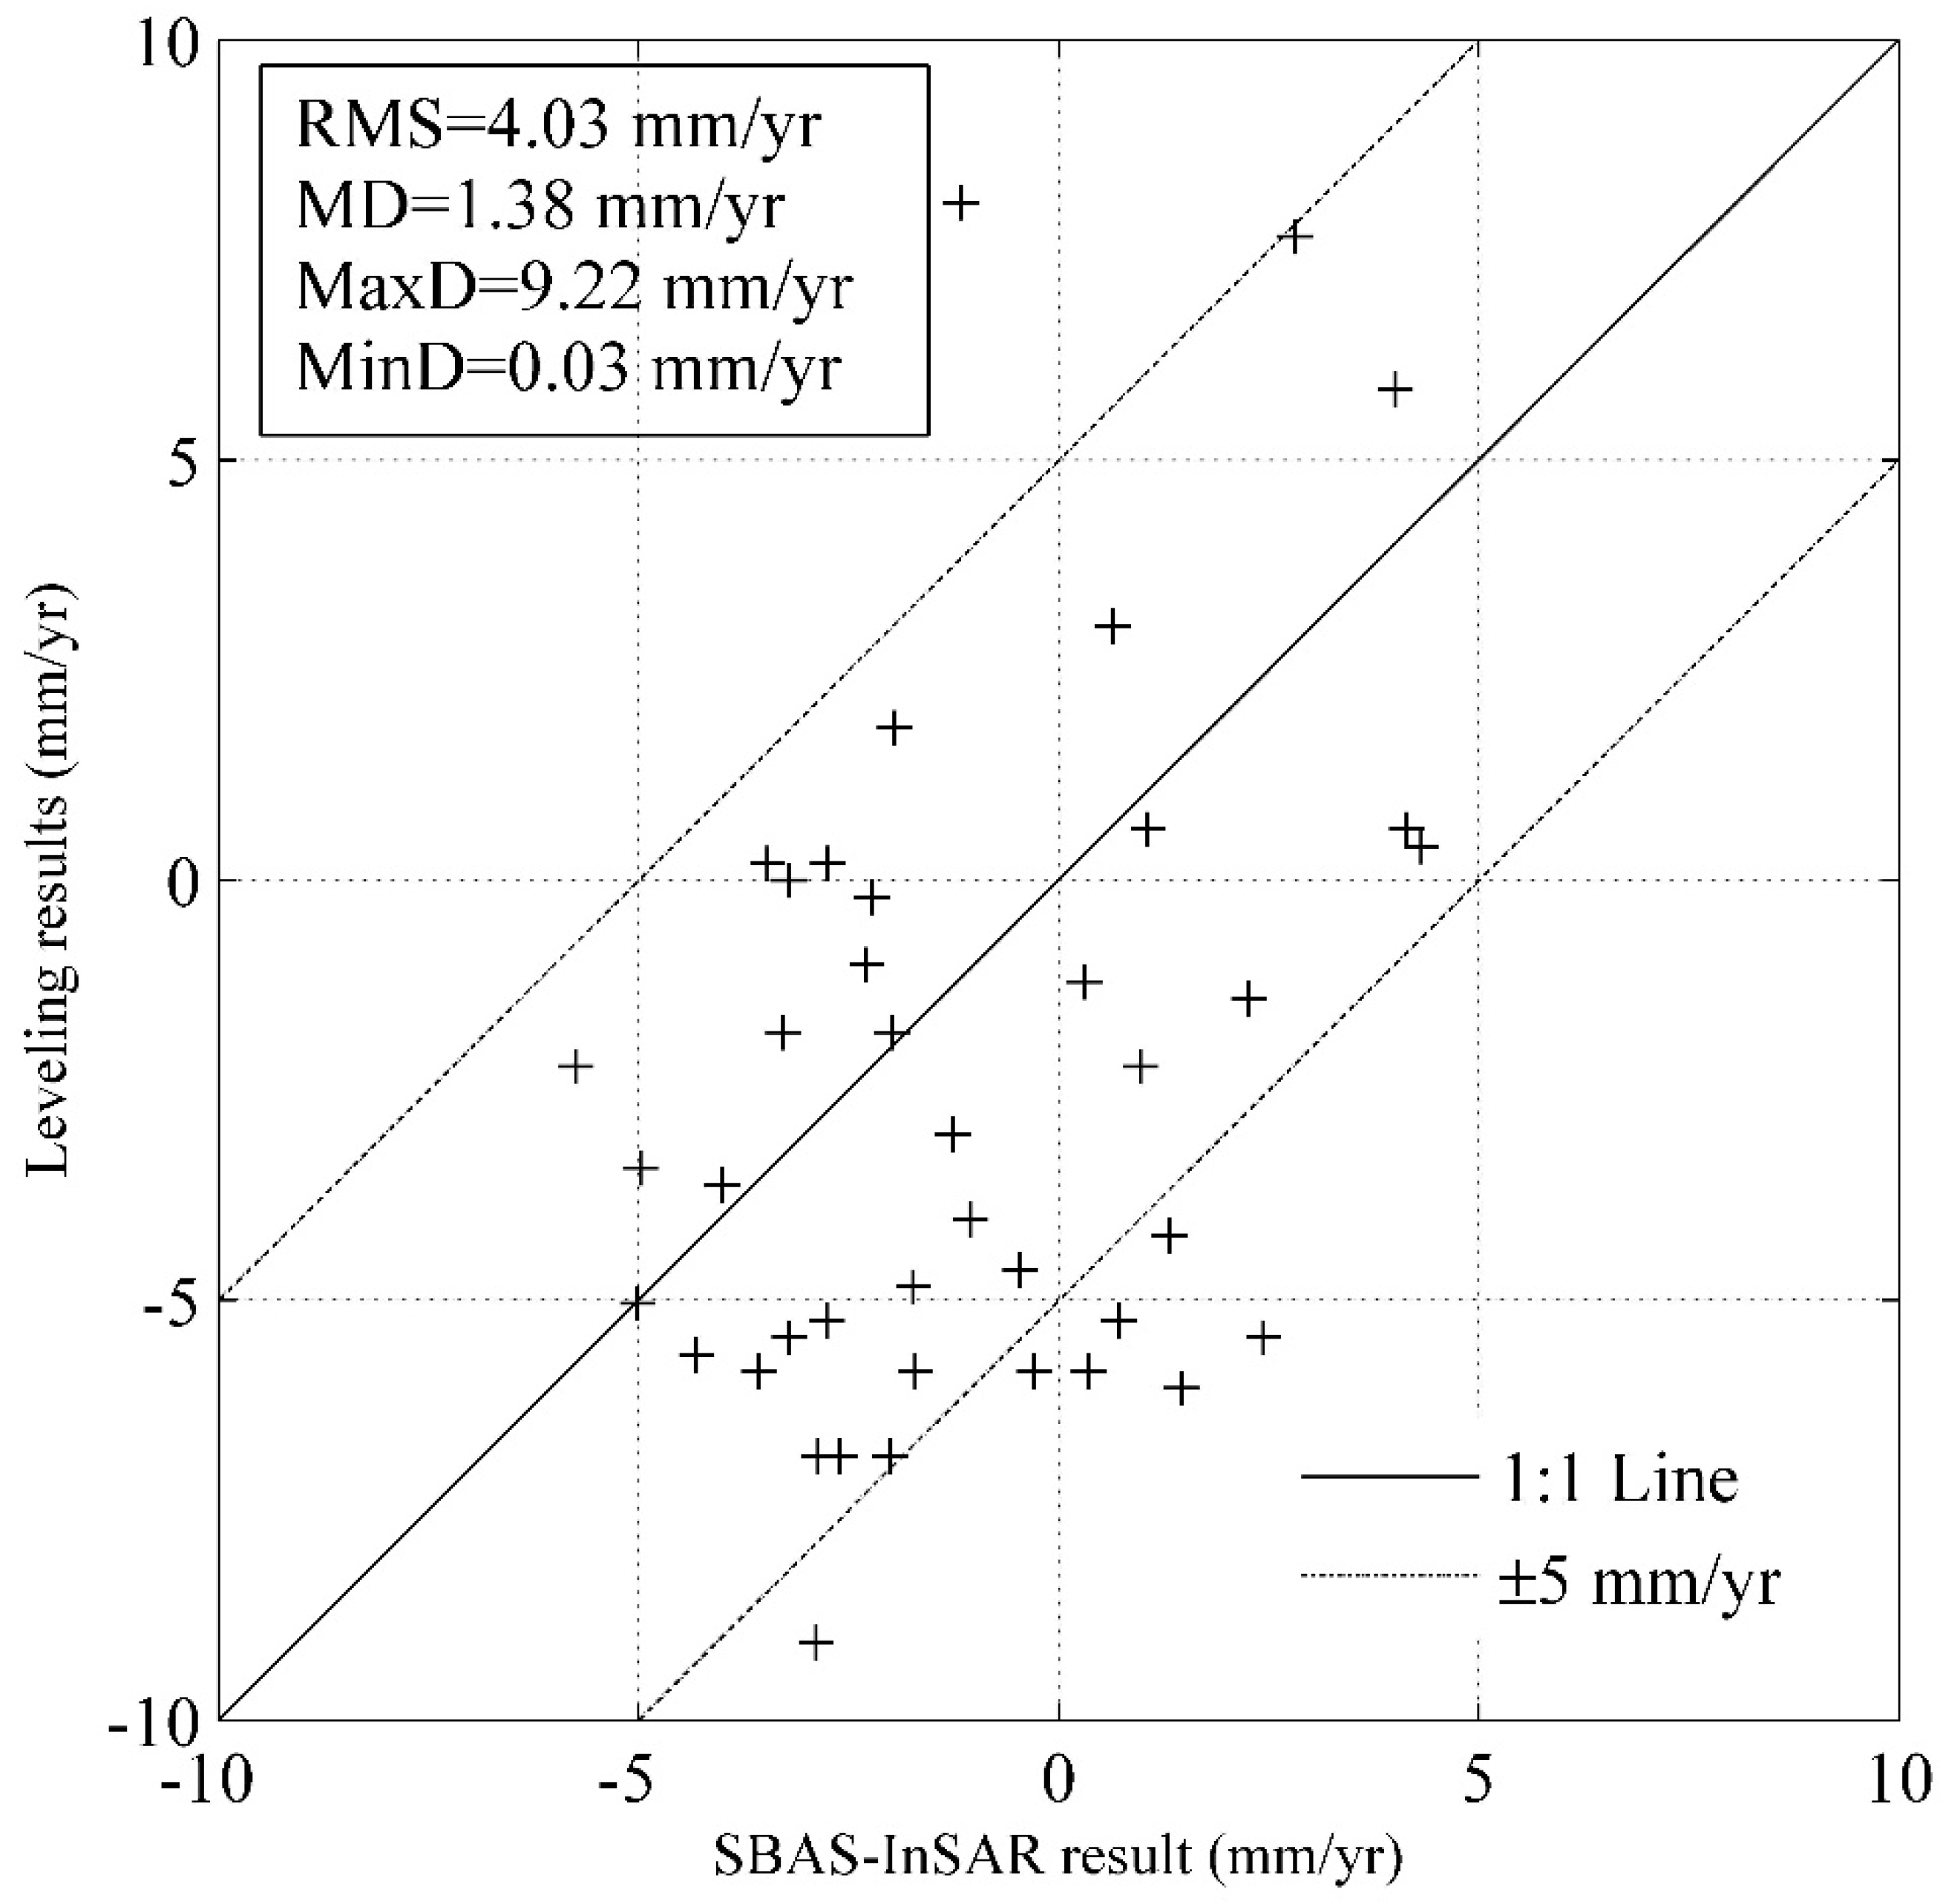
4.3. InSAR Data Validation
5. Discussion
5.1. Comparison with Previous Studies
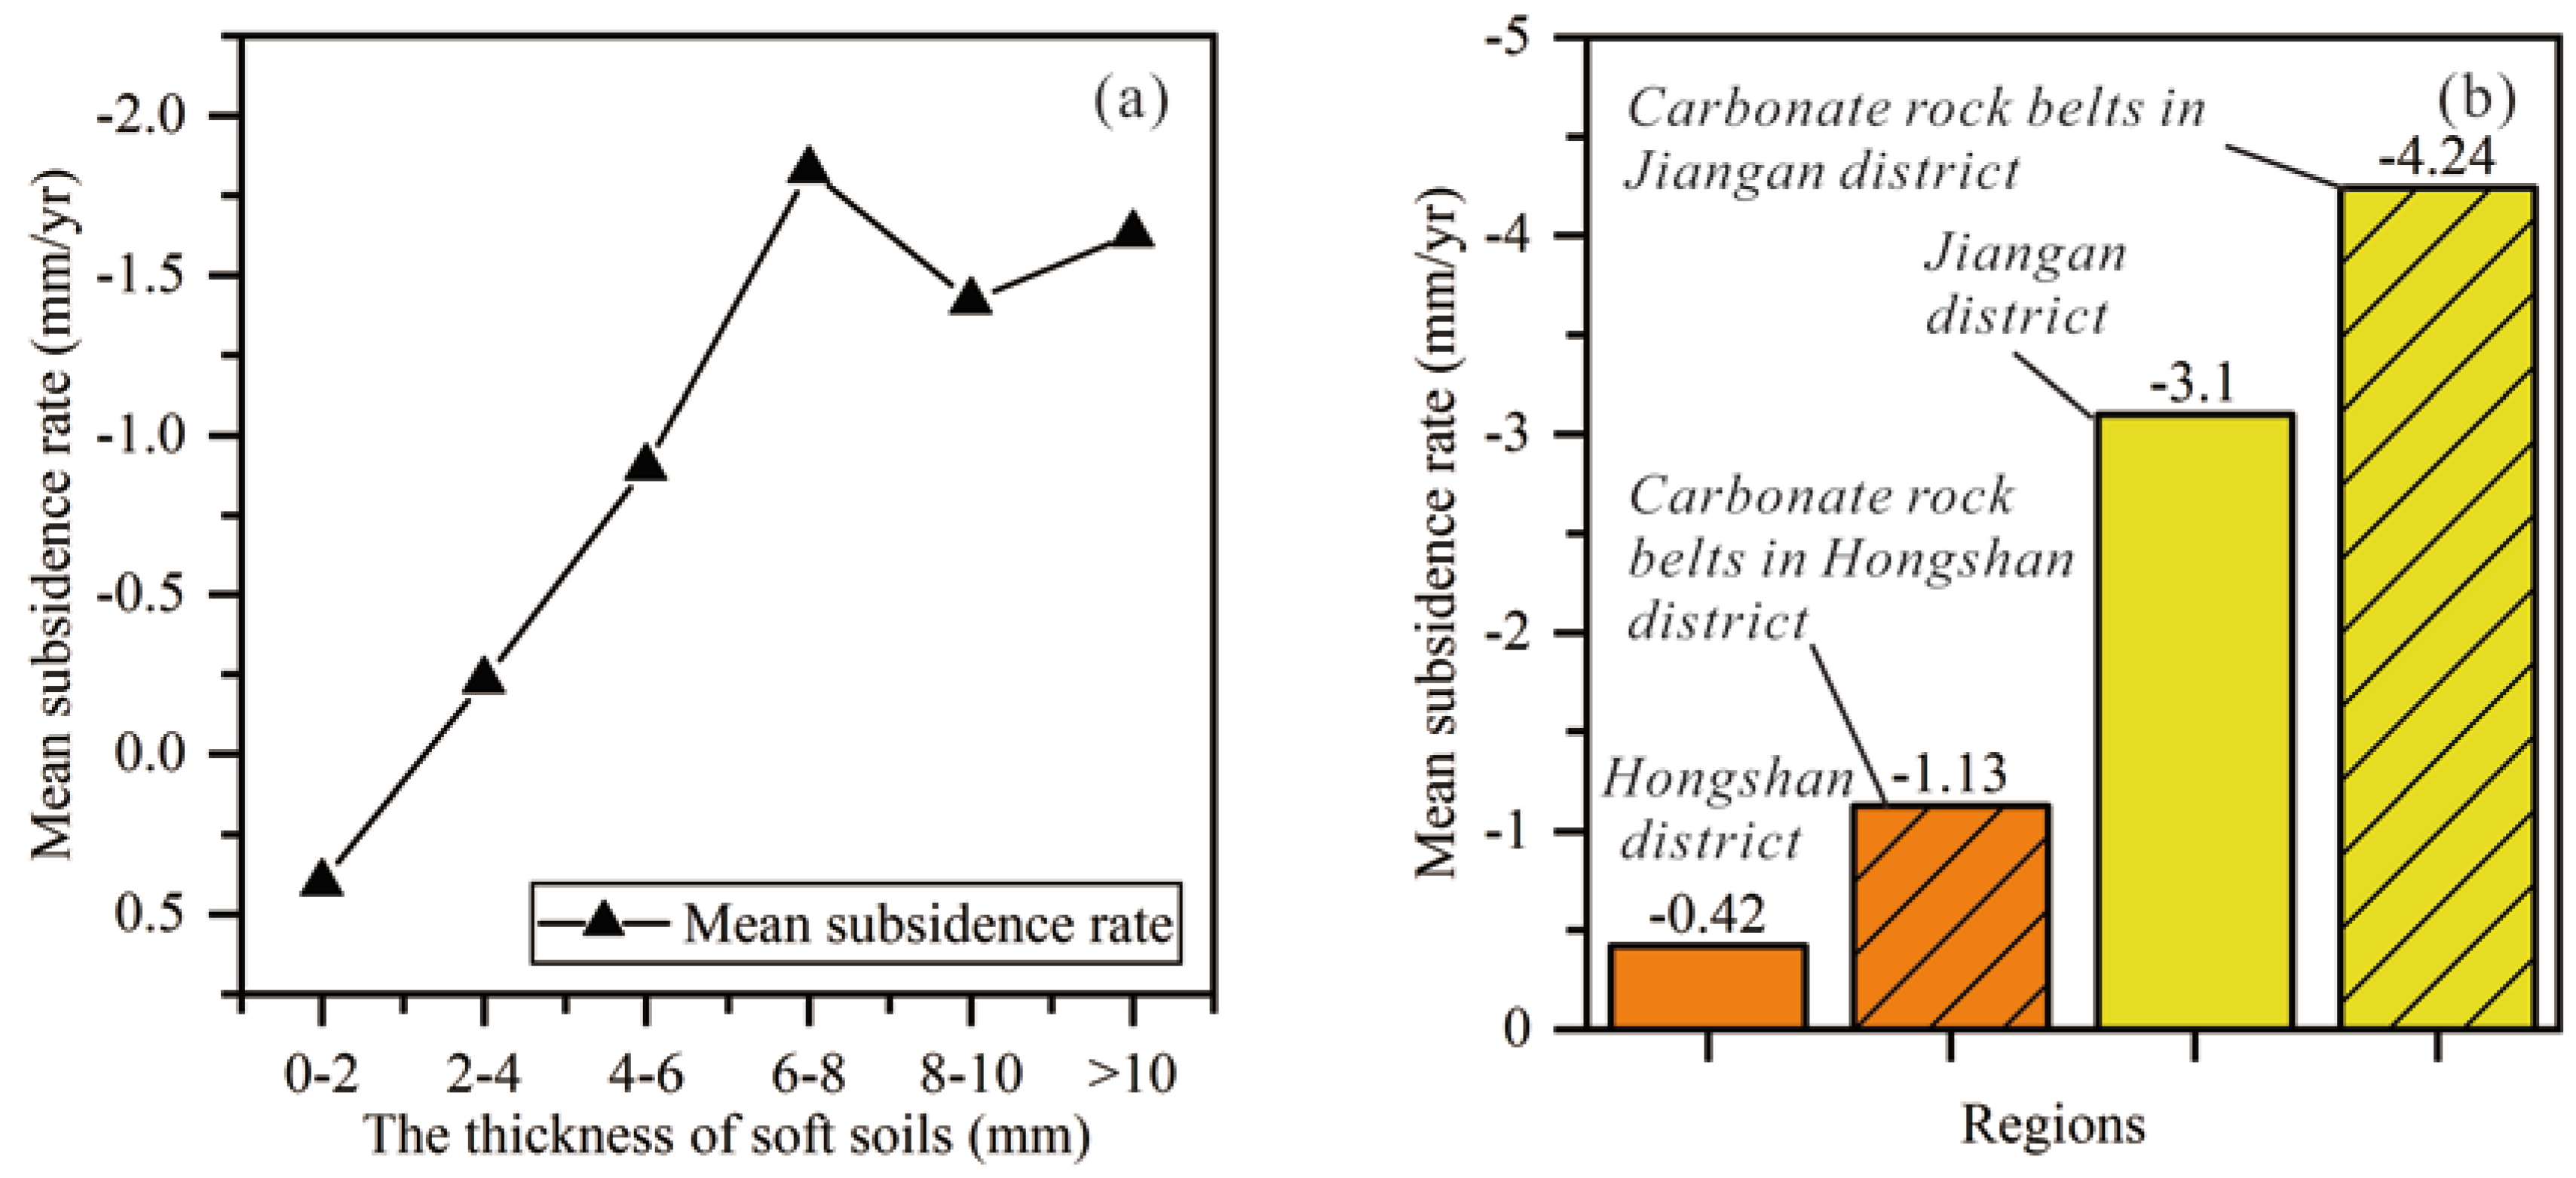
5.2. Causes of Subsidence in Wuhan City
5.2.1. Natural Factors
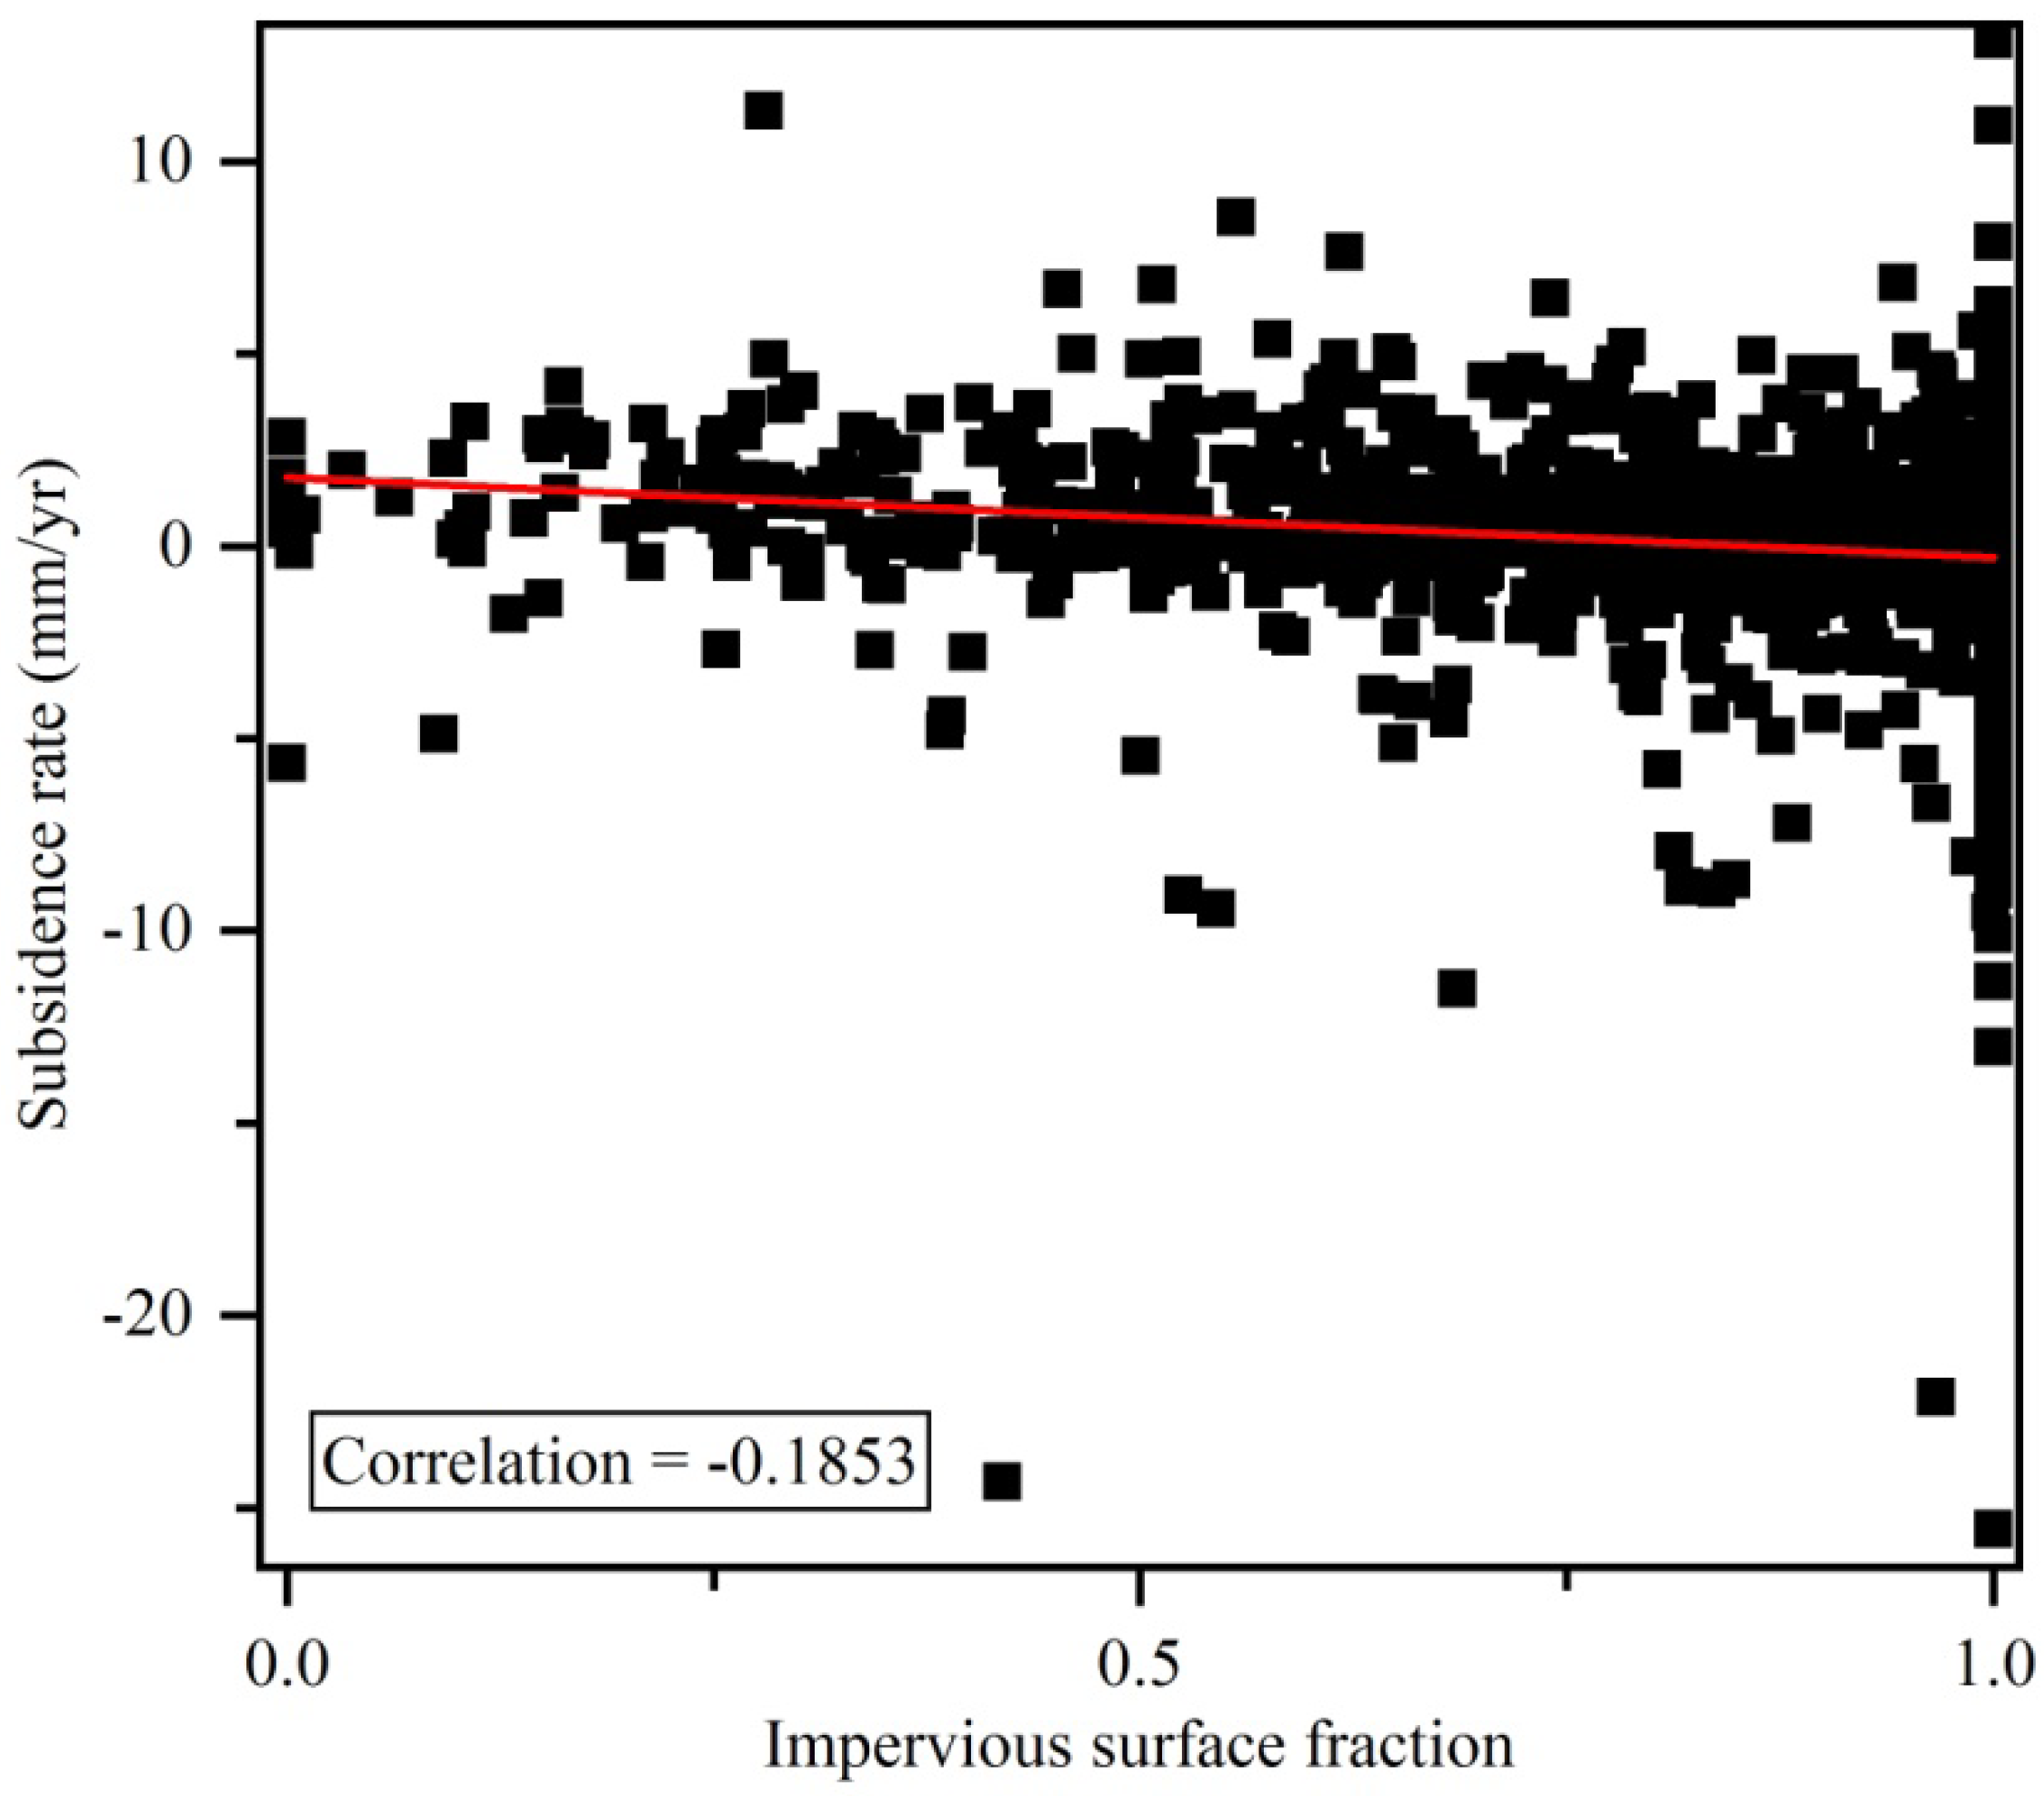
5.2.2. Human Activities
6. Conclusions and Future Work
Author Contributions
Acknowledgments
Conflicts of Interest
References
- Bianchini, S.; Moretti, S. Analysis of recent ground subsidence in the sibari plain (Italy) by means of satellite sar interferometry-based methods. Int. J. Remote Sens. 2015, 36, 4550–4569. [Google Scholar] [CrossRef]
- Du, Z.Y.; Ge, L.L.; Ng, A.H.M.; Zhu, Q.G.Z.; Yang, X.H.; Li, L.Y. Correlating the subsidence pattern and land use in bandung, indonesia with both sentinel-1/2 and alos-2 satellite images. Int. J. Appl. Earth Obs. Géoinf. 2018, 67, 54–68. [Google Scholar] [CrossRef]
- Deng, Z.; Ke, Y.H.; Gong, H.L.; Li, X.J.; Li, Z.H. Land subsidence prediction in beijing based on ps-insar technique and improved grey-markov model. Giscience Remote Sens. 2017, 54, 797–818. [Google Scholar] [CrossRef]
- Zhu, L.; Gong, H.L.; Li, X.J.; Wang, R.; Chen, B.B.; Dai, Z.X.; Teatini, P. Land subsidence due to groundwater withdrawal in the northern Beijing plain, China. Eng. Geol. 2015, 193, 243–255. [Google Scholar] [CrossRef]
- Zhou, L.; Guo, J.M.; Hu, J.Y.; Li, J.W.; Xu, Y.F.; Pan, Y.J.; Shi, M. Wuhan surface subsidence analysis in 2015–2016 based on sentinel-1a data by sbas-insar. Remote Sens. 2017, 9, 982. [Google Scholar] [CrossRef]
- Liu, Y.Y.; Zhao, C.Y.; Zhang, Q.; Yang, C.S. Complex surface deformation monitoring and mechanism inversion over Qingxu-Jiaocheng, China with multi-sensor sar images. J. Geodyn. 2018, 114, 41–52. [Google Scholar] [CrossRef]
- Hwang, C.; Yang, Y.D.; Kao, R.; Han, J.C.; Shum, C.K.; Galloway, D.L.; Sneed, M.; Hung, W.C.; Cheng, Y.S.; Li, F. Time-varying land subsidence detected by radar altimetry: California, Taiwan and north China. Sci. Rep. 2016, 6, 28160. [Google Scholar] [CrossRef] [PubMed] [Green Version]
- Gao, M.L.; Gong, H.L.; Chen, B.B.; Zhou, C.F.; Chen, W.F.; Liang, Y.; Shi, M.; Si, Y. Insar time-series investigation of long-term ground displacement at Beijing capital international airport, China. Tectonophysics 2016, 691, 271–281. [Google Scholar] [CrossRef]
- Garcia, A.J.; Bakon, M.; Martinez, R.; Marchamalo, M. Evolution of urban monitoring with radar interferometry in madrid city: Performance of ers-1/ers-2, envisat, cosmo-skymed, and sentinel-1 products. Int. J. Remote Sens. 2018, 39, 2969–2990. [Google Scholar] [CrossRef]
- Ghazifard, A.; Akbari, E.; Shirani, K.; Safaei, H. Evaluating land subsidence by field survey and d-insar technique in Damaneh city, Iran. J. Arid Land 2017, 9, 778–789. [Google Scholar] [CrossRef]
- Pratesi, F.; Tapete, D.; Del Ventisette, C.; Moretti, S. Mapping interactions between geology, subsurface resource exploitation and urban development in transforming cities using insar persistent scatterers: Two decades of change in Florence, Italy. Appl. Geogr. 2016, 77, 20–37. [Google Scholar]
- Qu, F.F.; Zhang, Q.; Lu, Z.; Zhao, C.Y.; Yang, C.S.; Zhang, J. Land subsidence and ground fissures in Xi’an, China 2005–2012 revealed by multi-band insar time-series analysis. Remote Sens. Environ. 2014, 155, 366–376. [Google Scholar] [CrossRef]
- Sowter, A.; Amat, M.B.; Cigna, F.; Marsh, S.; Athab, A.; Alshammari, L. Mexico city land subsidence in 2014–2015 with sentinel-1 iw tops: Results using the intermittent sbas (isbas) technique. Int. J. Appl. Earth Obs. Géoinf. 2016, 52, 230–242. [Google Scholar] [CrossRef]
- Gao, M.L.; Gong, H.L.; Chen, B.B.; Li, X.J.; Zhou, C.F.; Shi, M.; Si, Y.; Chen, Z.; Duan, G.Y. Regional land subsidence analysis in eastern beijing plain by insar time series and wavelet transforms. Remote Sens. 2018, 10, 365. [Google Scholar] [CrossRef]
- Ge, L.L.; Ng, A.H.M.; Du, Z.Y.; Chen, H.Y.; Li, X.J. Integrated space geodesy for mapping land deformation over choushui river fluvial plain, Taiwan. Int. J. Remote Sens. 2017, 38, 6319–6345. [Google Scholar] [CrossRef]
- Luo, X.G.; Wang, J.J.; Xu, Z.Y.; Zhu, S.; Meng, L.S.; Liu, J.K.; Cui, Y. Dynamic analysis of urban ground subsidence in Beijing based on the permanent scattering insar technology. J. Appl. Remote Sens. 2018, 12, 026001. [Google Scholar] [CrossRef]
- Ng, A.H.M.; Ge, L.L.; Li, X.J.; Zhang, K. Monitoring ground deformation in Beijing, China with persistent scatterer sar interferometry. J. Geod. 2012, 86, 375–392. [Google Scholar] [CrossRef]
- Yin, J.; Yu, D.P.; Wilby, R. Modelling the impact of land subsidence on urban pluvial flooding: A case study of downtown Shanghai, China. Sci. Total Environ. 2016, 544, 744–753. [Google Scholar] [CrossRef] [Green Version]
- Luo, Q.L.; Perissin, D.; Lin, H.; Zhang, Y.Z.; Wang, W. Subsidence monitoring of tianjin suburbs by terrasar-x persistent scatterers interferometry. IEEE J. Sel. Top. Appl. Earth Obs. Remote Sens. 2014, 7, 1642–1650. [Google Scholar] [CrossRef]
- Guo, J.M.; Zhou, L.; Yao, C.L.; Hu, J.Y. Surface subsidence analysis by multi-temporal insar and grace: A case study in Beijing. Sensors 2016, 16, 1495. [Google Scholar] [CrossRef]
- Yan, S.Y.; Liu, G.; Deng, K.Z.; Wang, Y.J.; Zhang, S.B.; Zhao, F. Large deformation monitoring over a coal mining region using pixel-tracking method with high-resolution radarsat-2 imagery. Remote Sens. Lett. 2016, 7, 219–228. [Google Scholar] [CrossRef]
- Ge, L.; Chang, H.-C.; Rizos, C. Mine subsidence monitoring using multi-source satellite sar images. Photogramm. Eng. Remote Sens. 2007, 73, 259–266. [Google Scholar] [CrossRef]
- Jiang, L.M.; Lin, H.; Cheng, S.L. Monitoring and assessing reclamation settlement in coastal areas with advanced insar techniques: Macao city (China) case study. Int. J. Remote Sens. 2011, 32, 3565–3588. [Google Scholar] [CrossRef]
- Samsonov, S.; d’Oreye, N.; Smets, B. Ground deformation associated with post-mining activity at the french-german border revealed by novel insar time series method. Int. J. Appl. Earth Obs. Géoinf. 2013, 23, 142–154. [Google Scholar] [CrossRef]
- Le, T.S.; Chang, C.P.; Nguyen, X.T.; Yhokha, A. Terrasar-x data for high-precision land subsidence monitoring: A case study in the historical centre of Hanoi, Vietnam. Remote Sens. 2016, 8, 338. [Google Scholar] [CrossRef]
- Nikos, S.; Ioannis, P.; Constantinos, L.; Paraskevas, T.; Anastasia, K.; Charalambos, K. Land subsidence rebound detected via multi-temporal insar and ground truth data in kalochori and sindos regions, northern Greece. Eng. Geol. 2016, 209, 175–186. [Google Scholar] [CrossRef]
- Zhang, Z.; Wang, C.; Wang, M.; Wang, Z.; Zhang, H. Surface deformation monitoring in Zhengzhou city from 2014 to 2016 using time-series insar. Remote Sens. 2018, 10, 1731. [Google Scholar] [CrossRef]
- Zhou, C.F.; Gong, H.L.; Chen, B.B.; Zhu, F.; Duan, G.Y.; Gao, M.L.; Lu, W. Land subsidence under different land use in the eastern Beijing plain, China 2005–2013 revealed by insar timeseries analysis. Gisci. Remote Sens. 2016, 53, 671–688. [Google Scholar]
- Liu, Y.Y.; Zhao, C.Y.; Zhang, Q.; Yang, C.S.; Zhang, J. Land subsidence in Taiyuan, China, monitored by insar technique with multisensor sar datasets from 1992 to 2015. IEEE J. Sel. Top. Appl. Earth Obs. Remote Sens. 2018, 11, 1509–1519. [Google Scholar] [CrossRef]
- Aimaiti, Y.; Yamazaki, F.; Liu, W. Multi-sensor insar analysis of progressive land subsidence over the coastal city of Urayasu, Japan. Remote Sens. 2018, 10, 1304. [Google Scholar] [CrossRef]
- Castellazzi, P.; Arroyo-Dominguez, N.; Martel, R.; Calderhead, A.I.; Normand, J.C.L.; Garfias, J.; Rivera, A. Land subsidence in major cities of central Mexico: Interpreting insar-derived land subsidence mapping with hydrogeological data. Int. J. Appl. Earth Obs. Géoinf. 2016, 47, 102–111. [Google Scholar] [CrossRef]
- Perissin, D.; Wang, Z.Y.; Lin, H. Shanghai subway tunnels and highways monitoring through cosmo-skymed persistent scatterers. Isprs J. Photogramm. Remote Sens. 2012, 73, 58–67. [Google Scholar] [CrossRef]
- Liu, P.; Li, Q.Q.; Li, Z.H.; Hoey, T.; Liu, Y.X.; Wang, C.S. Land subsidence over oilfields in the yellow river delta. Remote Sens. 2015, 7, 1540–1564. [Google Scholar] [CrossRef]
- Liu, X.T.; Cao, Q.X.; Xiong, Z.G.; Yin, H.T.; Xiao, G.R. Application of small baseline subsets d-insar technique to estimate time series land deformation of Jinan area, China. J. Appl. Remote Sens. 2016, 10. [Google Scholar] [CrossRef]
- Aimaiti, Y.; Yamazaki, F.; Liu, W.; Kasimu, A. Monitoring of land-surface deformation in the karamay oilfield, Xinjiang, China, using sar interferometry. Appl. Sci. 2017, 7, 772. [Google Scholar] [CrossRef]
- Chen, G.; Zhang, Y.; Zeng, R.Q.; Yang, Z.K.; Chen, X.; Zhao, F.M.; Meng, X.M. Detection of land subsidence associated with land creation and rapid urbanization in the chinese loess plateau using time series insar: A case study of Lanzhou new district. Remote Sens. 2018, 10, 270. [Google Scholar] [CrossRef]
- Zhao, Q.; Lin, H.; Jiang, L.M.; Chen, F.L.; Cheng, S.L. A study of ground deformation in the guangzhou urban area with persistent scatterer interferometry. Sensors 2009, 9, 503–518. [Google Scholar] [CrossRef] [PubMed]
- Gutierrez, F.; Parise, M.; De Waele, J.; Jourde, H. A review on natural and human-induced geohazards and impacts in karst. Earth-Sci. Rev. 2014, 138, 61–88. [Google Scholar] [CrossRef]
- Erten, E.; Rossi, C. The worsening impacts of land reclamation assessed with sentinel-1: The rize (Turkey) test case. Int. J. Appl. Earth Obs. Géoinf. 2019, 74, 57–64. [Google Scholar] [CrossRef]
- Chen, B.B.; Gong, H.L.; Lei, K.C.; Li, J.W.; Zhou, C.F.; Gao, M.L.; Guan, H.L.; Lv, W. Land subsidence lagging quantification in the main exploration aquifer layers in Beijing plain, China. Int. J. Appl. Earth Obs. Géoinf. 2019, 75, 54–67. [Google Scholar] [CrossRef]
- Bai, L.; Jiang, L.M.; Wang, H.S.; Sun, Q.S. Spatiotemporal characterization of land subsidence and uplift (2009–2010) over wuhan in central China revealed by terrasar-x insar analysis. Remote Sens. 2016, 8, 350. [Google Scholar] [CrossRef]
- Costantini, M.; Bai, J.; Malvarosa, F.; Minati, F.; Vecchioli, F.; Wang, R.L.; Hu, Q.; Xiao, J.H.; Li, J.P. Ground deformations and building stability monitoring by cosmo-skymed psp sar interferometry: Results and validation with field measurements and surveys. In Proceedings of the 2016 IEEE International Geoscience and Remote Sensing Symposium, Beijing, China, 10–15 July 2016. [Google Scholar]
- Zhen, L.; Tan, Y.; Lin, L.; Yu, Z.; Lan, H. Study of land surface composition of Wuhan city based on linear spectral mixture analysis. Remote Sens. Technol. Appl. 2013, 28, 780–784. [Google Scholar]
- Wang, Y.; Jun-Ling, W.U.; Wang, H.L.; Zhao, D.F. The statistical analysis of rainfall in wuhan in the past 50 years. J. Hubei Univ. Technol. 2006, 21, 98–100. [Google Scholar]
- Luo, X.J.; Survey, C. Features of the shallow karst development and control of karst collapse in Wuhan. Carsologica Sin. 2013, 32, 419–432. [Google Scholar]
- Guan, S.; Tao, L.; Xie, J.; Xia, D. The developmental characteristics of karst in Wuhan urban development area. Urban Geotech. Investig. Surv. 2017, 41, 157–162. [Google Scholar]
- Luo, X.J.; Survey, C. Division of “six belts and five types” of carbonate region and control of karst geological disaster in Wuhan. J. Hydraulic Eng. 2014, 45, 171–179. [Google Scholar]
- Zheng, X.C.; Tang, H.M.; Qin, Z.M. Study on the imperilments of soft foundation and land subsidence in Wuhan. Geol. Sci. Technol. Inf. 2003, 22, 95–99. [Google Scholar]
- Chen, Z.; Chen, S.; Lisheng, W.U. Experimental analysis of soft soil characteristics in Wuhan. Resour. Environ. Eng. 2015, 12, 974–977. [Google Scholar]
- Yang, Z; Yanfang, L.; Yi, L. Spatial and Temporal Patterns Analysis of Impervious Surface in Wuhan City. Sci. Geogr. Sin. 2017, 37, 1917–1924. [Google Scholar]
- Liu, Y.L.; Huang, H.J.; Liu, Y.X.; Bi, H.B. Linking land subsidence over the yellow river delta, China, to hydrocarbon exploitation using multi-temporal insar. Nat. Hazards 2016, 84, 271–291. [Google Scholar] [CrossRef]
- Berardino, P.; Fornaro, G.; Lanari, R.; Sansosti, E. A new algorithm for surface deformation monitoring based on small baseline differential sar interferograms. IEEE Trans. Geosci. Remote Sens. 2002, 40, 2375–2383. [Google Scholar] [CrossRef]
- Benattou, M.M.; Balz, T.; Liao, M. Measuring surface subsidence in Wuhan, China with sentinel-1 data using psinsar. In Proceedings of the 2018 ISPRS TC III Mid-term Symposium Developments, Technologies and Applications in Remote Sensing, Beijing, China, 7–10 May 2018. [Google Scholar]


| Parameters | Description |
|---|---|
| Product type | Radarsat-2 WUF SLC |
| Track no. | 226 |
| Band | C |
| Wavelength (cm) | 5.5 |
| Revisit frequency (day) | 24 |
| Incidence angle (degree) | 30–50 |
| Range resolution (m) | 1.6 |
| Azimuth resolution (m) | 2.8 |
| Orbit direction | Descending |
| Previous Studies | Data | Method | Subsidence Rate | Reference |
|---|---|---|---|---|
| Zhou et al. | 15 C-band Sentinel-1A images, interferometric wide TOPS acquisition mode, VV polarization, ascending orbit, covering most of Wuhan city | SBAS-InSAR | −82–18 mm/yr | [5] |
| Bai et al. | 12 X-band TerraSAR-X images, stripmap acquisition mode, HH polarization, ascending orbit, covering major urban areas of Wuhan city | PS-InSAR | −63.7–17.5 mm/yr | [41] |
| Costantini et al. | 45 X-band COSMO-SkyMed images, stripmap acquisition mode, HH polarization, covering most of HK | PS Pair InSAR | −80–40 mm/yr | [42] |
| Benattou et al. | 36 C-band Sentinel-1A images, interferometric wide TOPS acquisition mode, VV polarization, ascending orbit, covering major urban areas of Wuhan city | PS-InSAR | −127–23 mm/yr | [53] |
© 2019 by the authors. Licensee MDPI, Basel, Switzerland. This article is an open access article distributed under the terms and conditions of the Creative Commons Attribution (CC BY) license (http://creativecommons.org/licenses/by/4.0/).
Share and Cite
Zhang, Y.; Liu, Y.; Jin, M.; Jing, Y.; Liu, Y.; Liu, Y.; Sun, W.; Wei, J.; Chen, Y. Monitoring Land Subsidence in Wuhan City (China) using the SBAS-InSAR Method with Radarsat-2 Imagery Data. Sensors 2019, 19, 743. https://doi.org/10.3390/s19030743
Zhang Y, Liu Y, Jin M, Jing Y, Liu Y, Liu Y, Sun W, Wei J, Chen Y. Monitoring Land Subsidence in Wuhan City (China) using the SBAS-InSAR Method with Radarsat-2 Imagery Data. Sensors. 2019; 19(3):743. https://doi.org/10.3390/s19030743
Chicago/Turabian StyleZhang, Yang, Yaolin Liu, Manqi Jin, Ying Jing, Yi Liu, Yanfang Liu, Wei Sun, Junqing Wei, and Yiyun Chen. 2019. "Monitoring Land Subsidence in Wuhan City (China) using the SBAS-InSAR Method with Radarsat-2 Imagery Data" Sensors 19, no. 3: 743. https://doi.org/10.3390/s19030743