Effects of Gait Strategy and Speed on Regularity of Locomotion Assessed in Healthy Subjects Using a Multi-Sensor Method


Abstract
1. Introduction
2. Materials and Methods
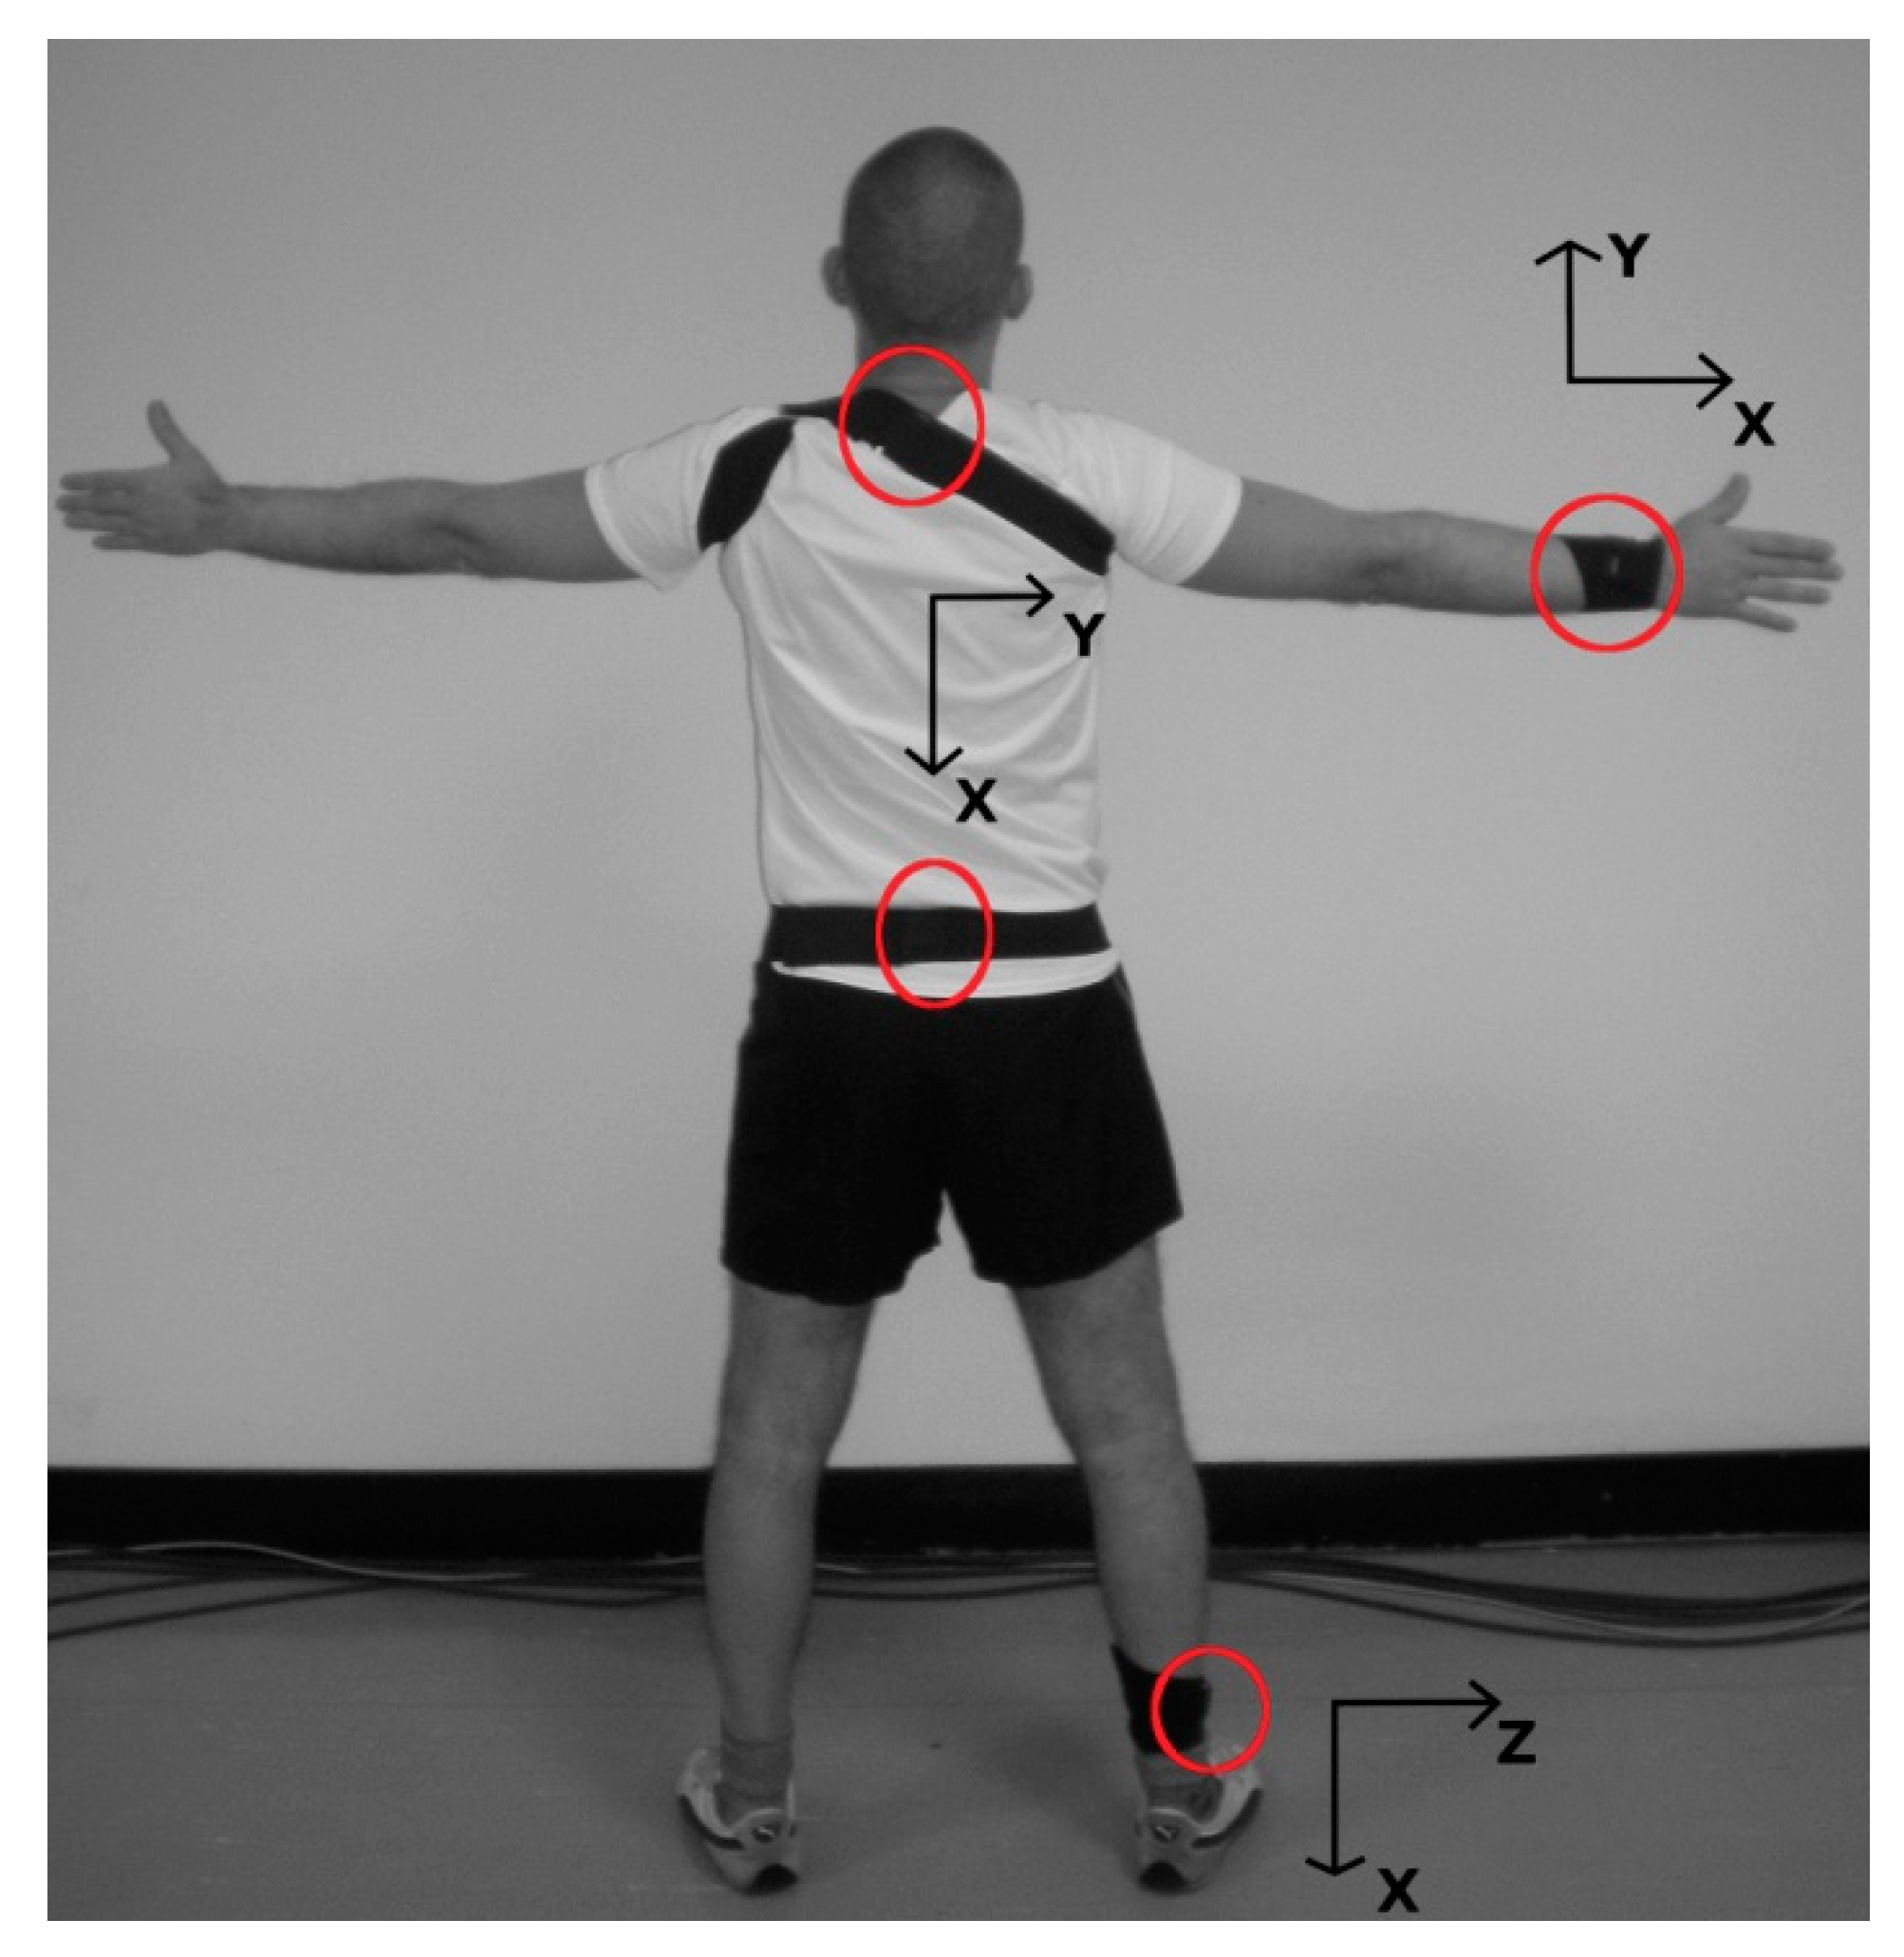
2.1. Measurement System
2.2. Participants, Motor Tasks, and Raw Data
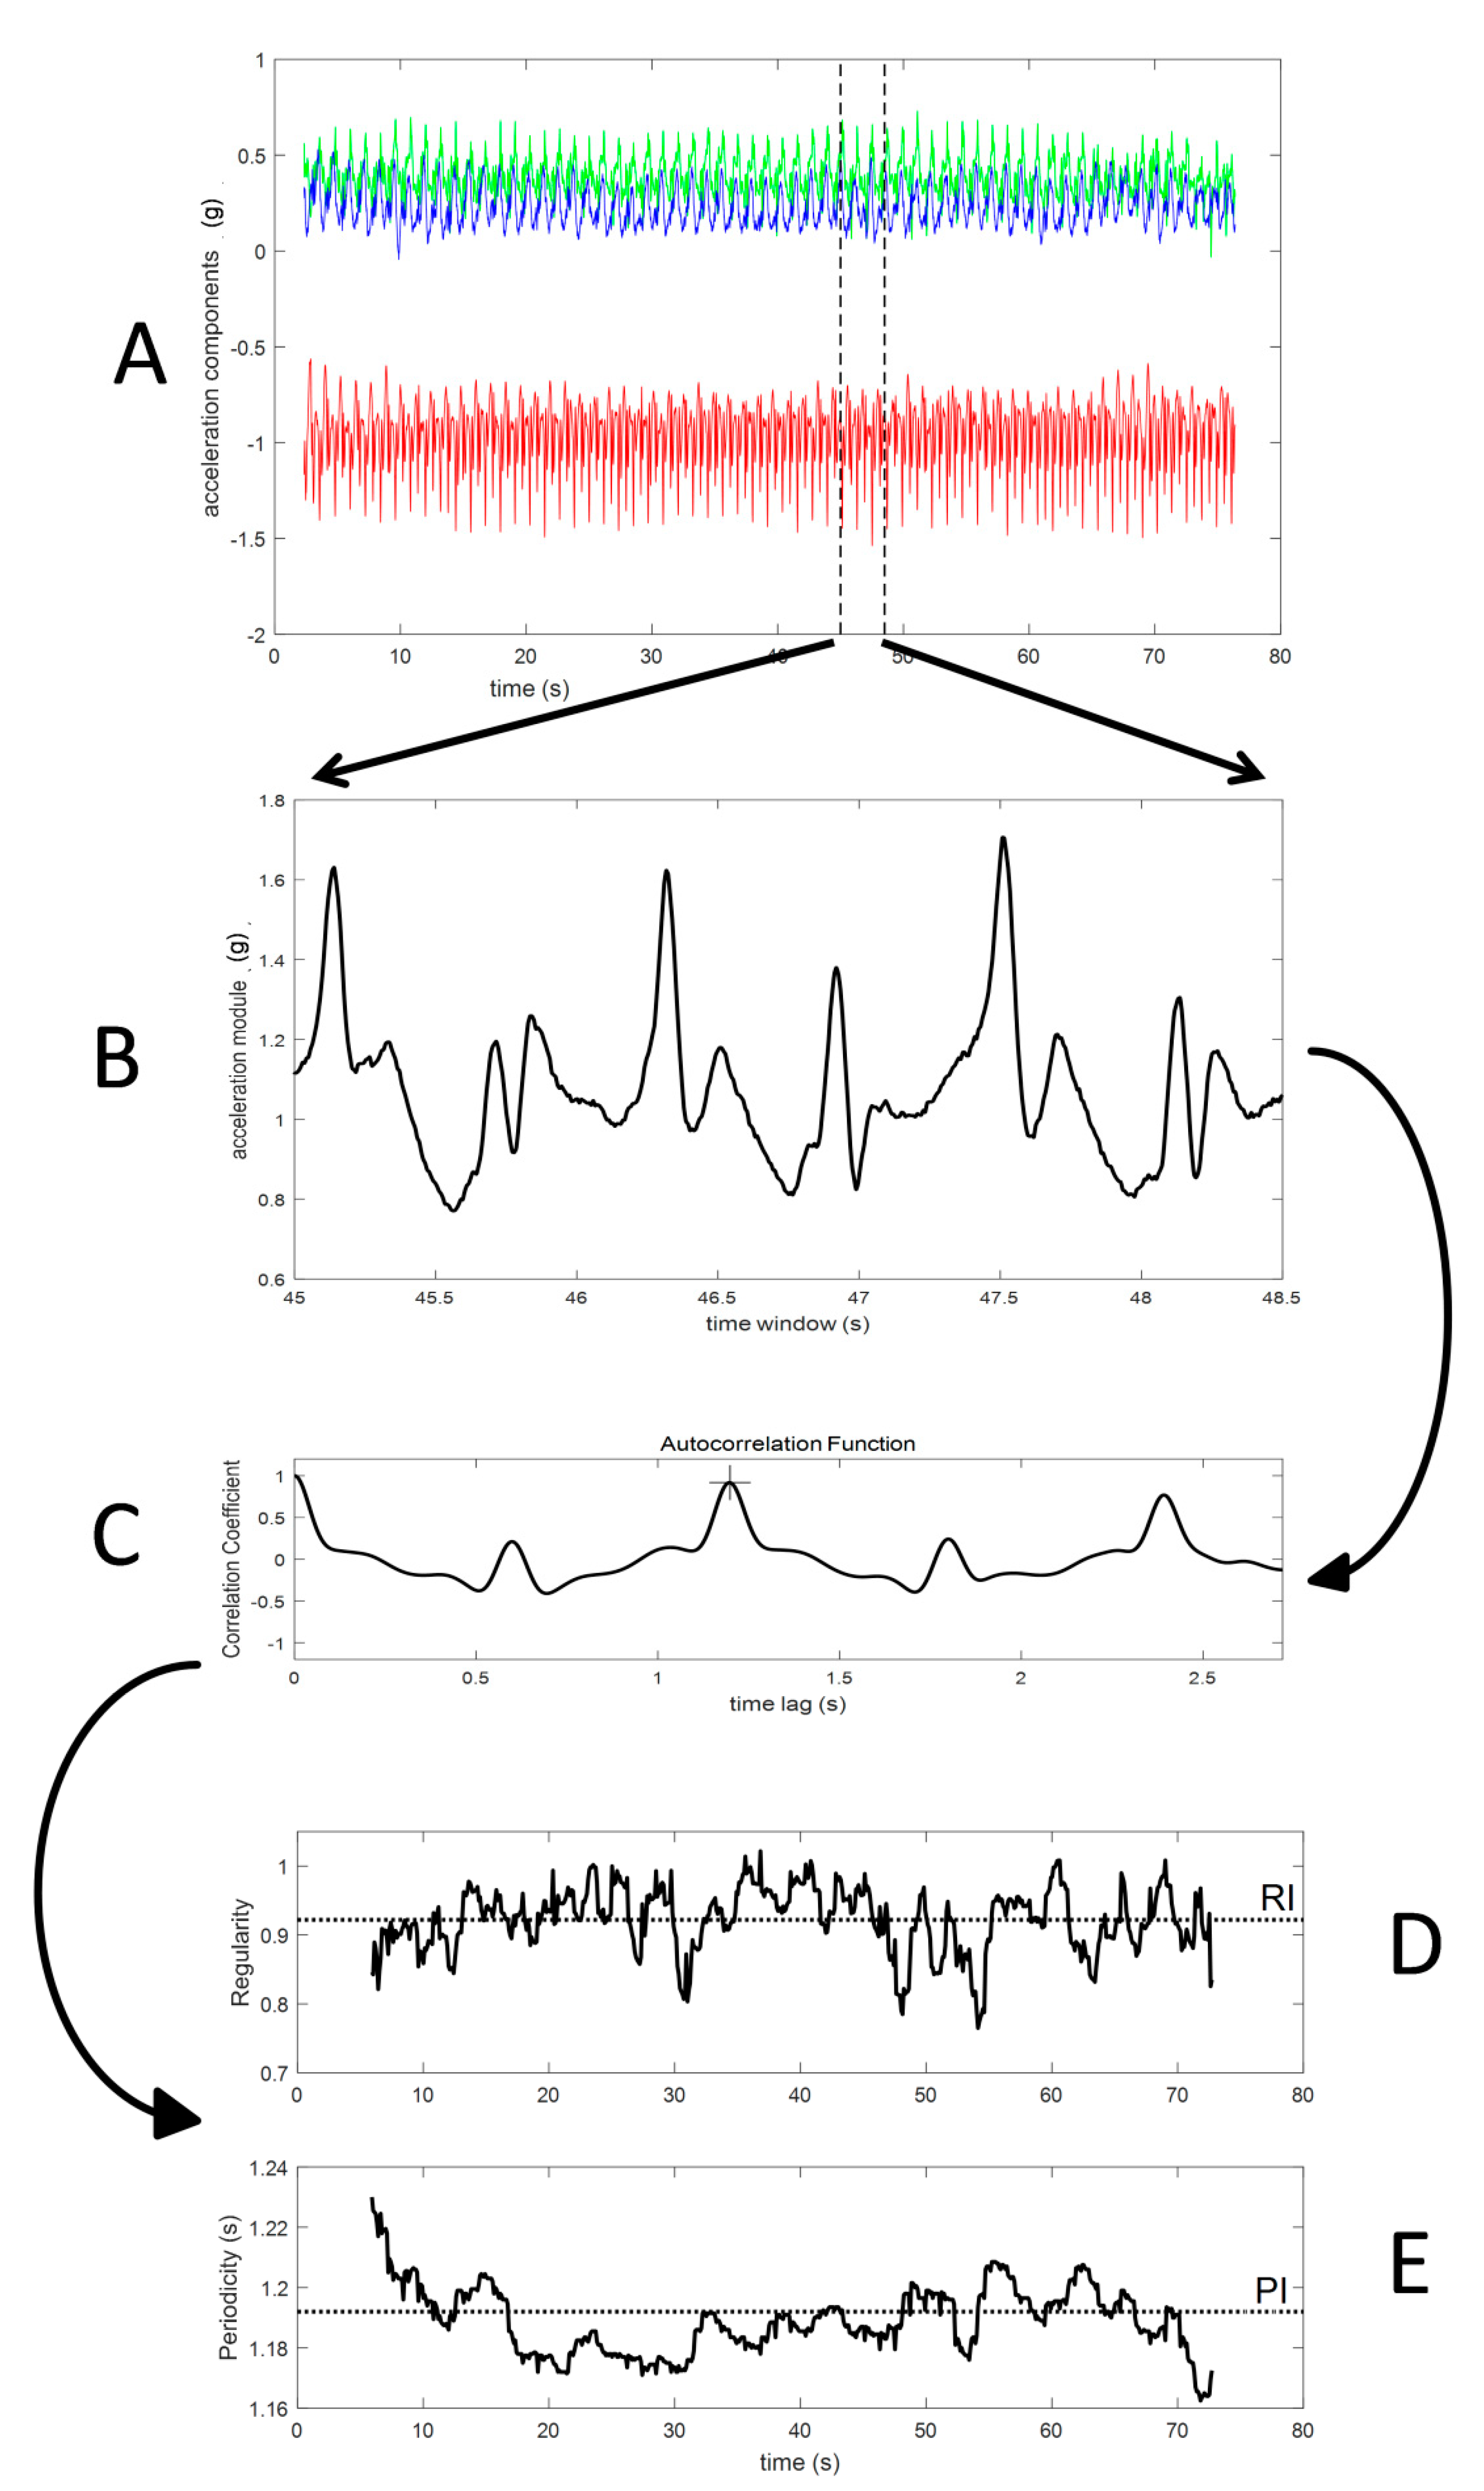
2.3. Algorithm
2.4. Statistical Analysis
3. Results
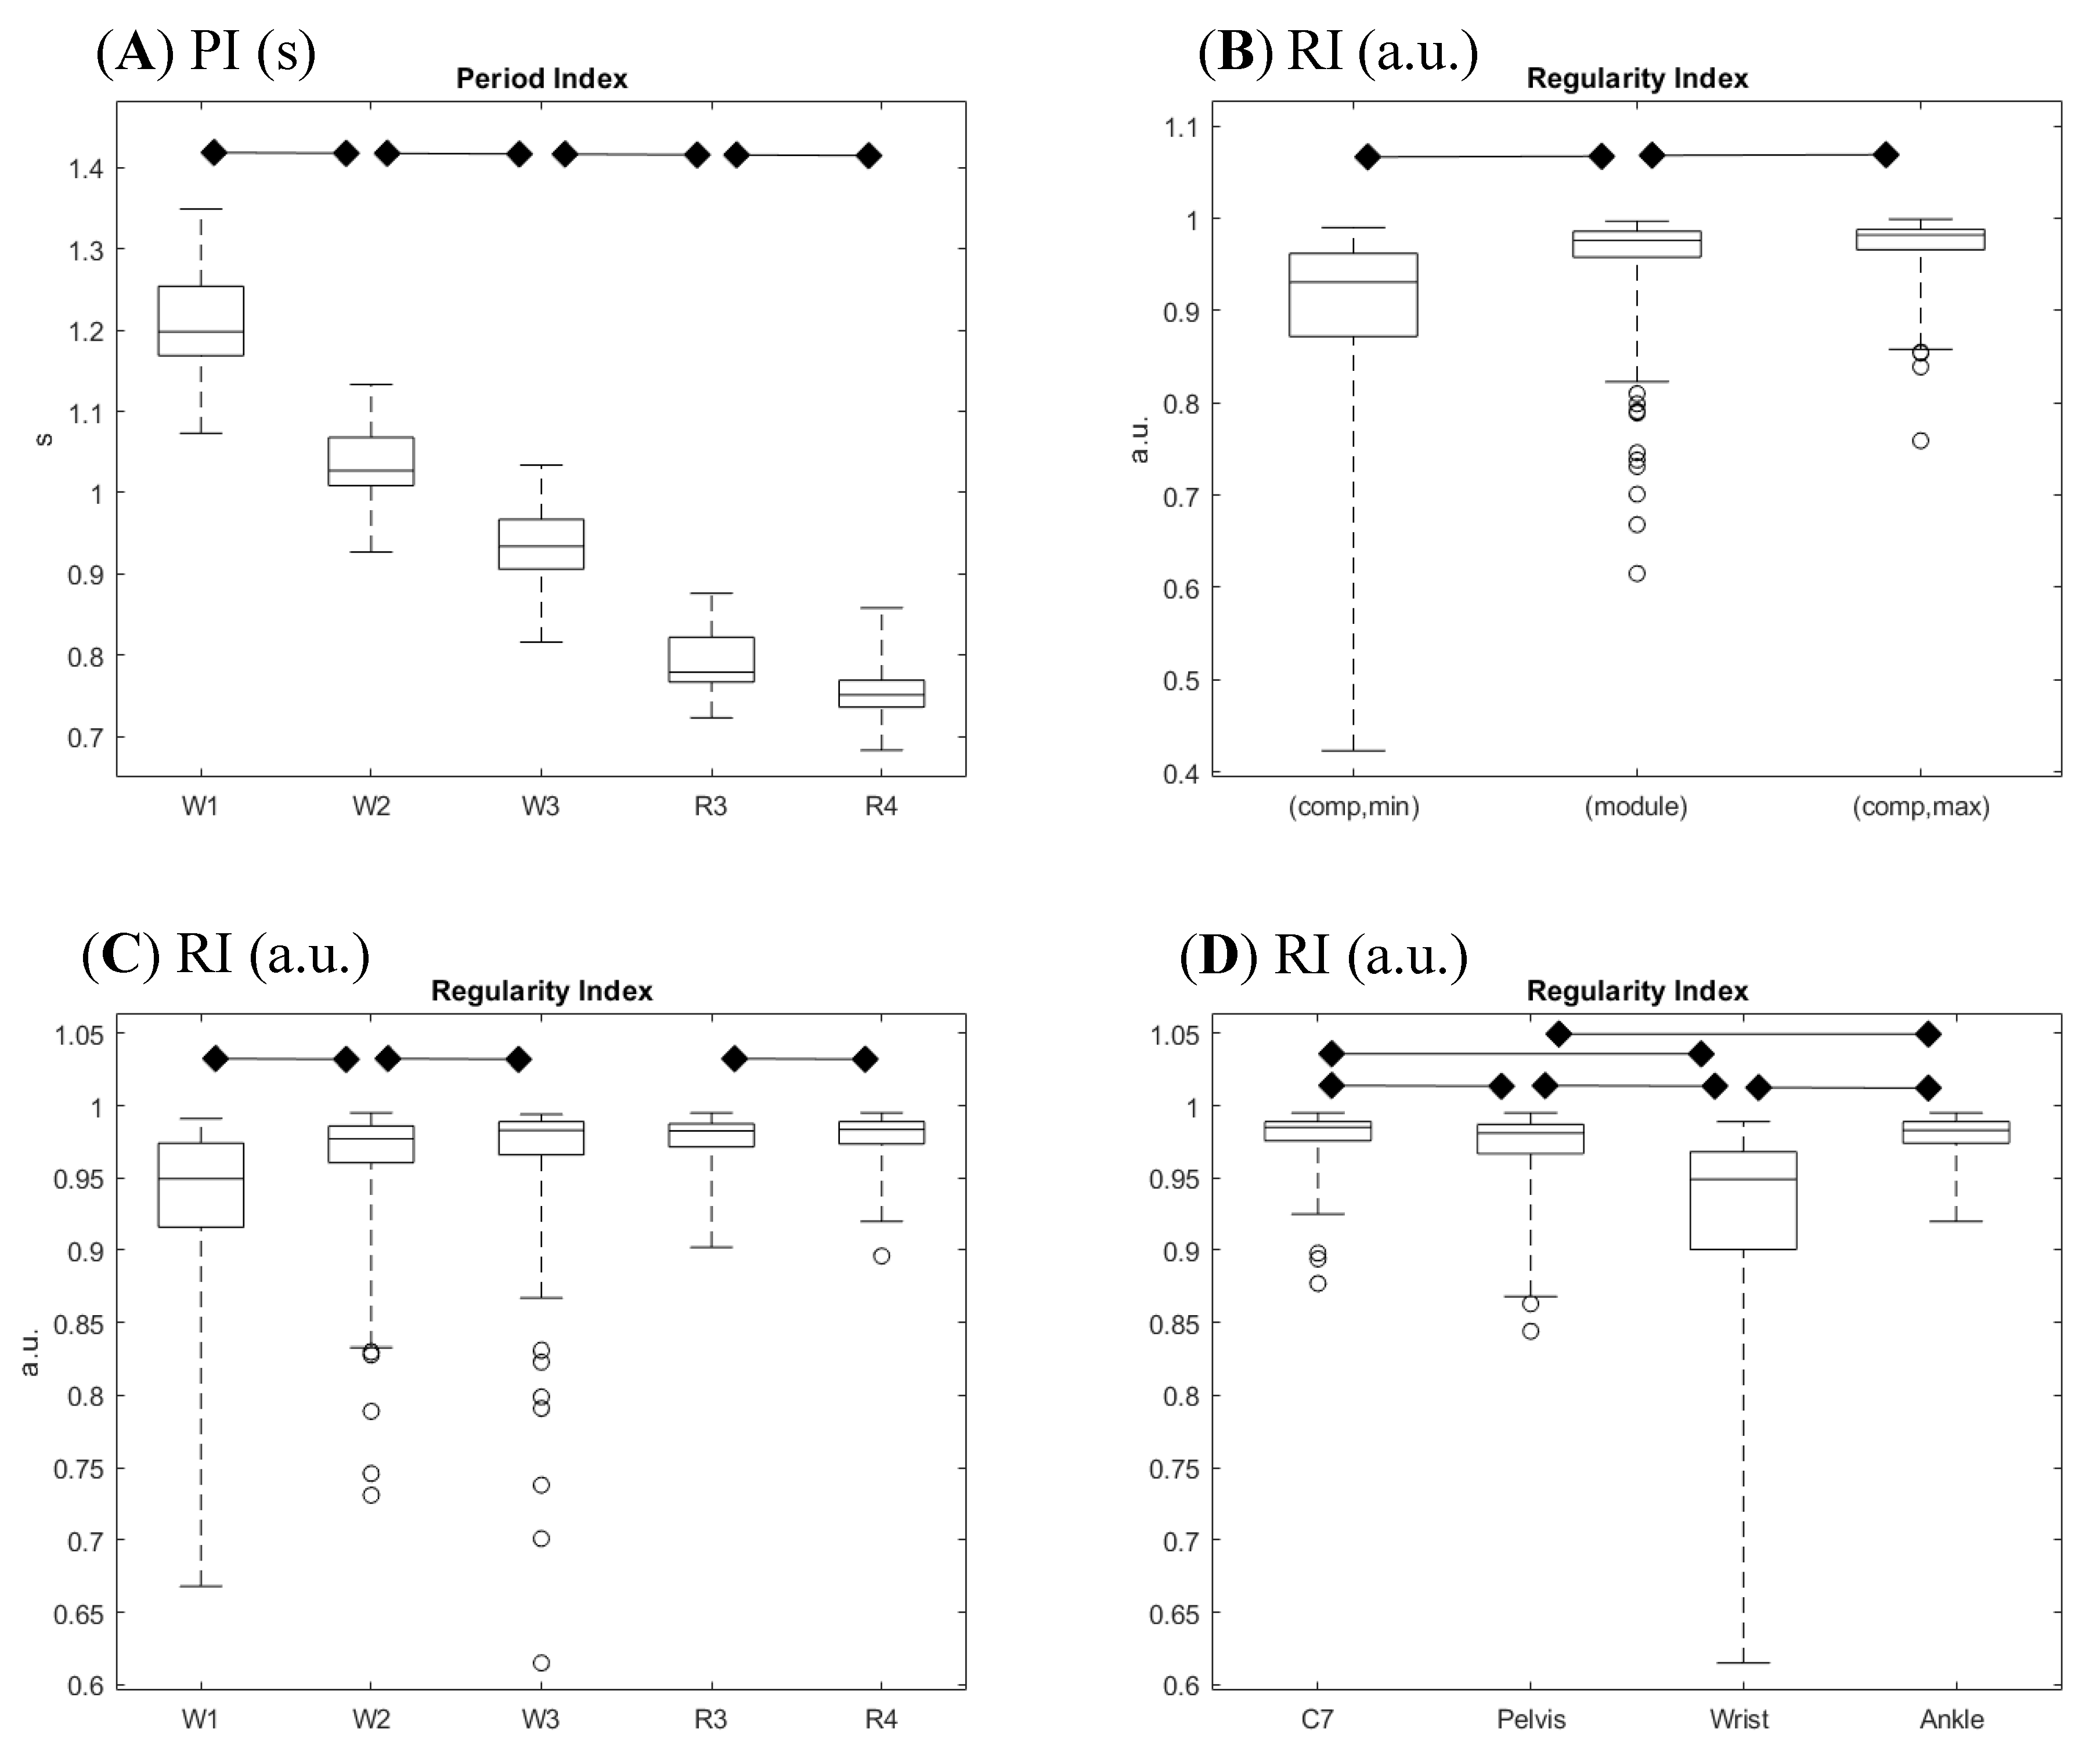
3.1. Period Index
3.2. Regularity Index: Comparison of Module-Based and Component-Based Analyses
3.3. Regularity Index: Effect of Locomotion Speed
3.4. Regularity Index: Effect of Locomotor Strategy
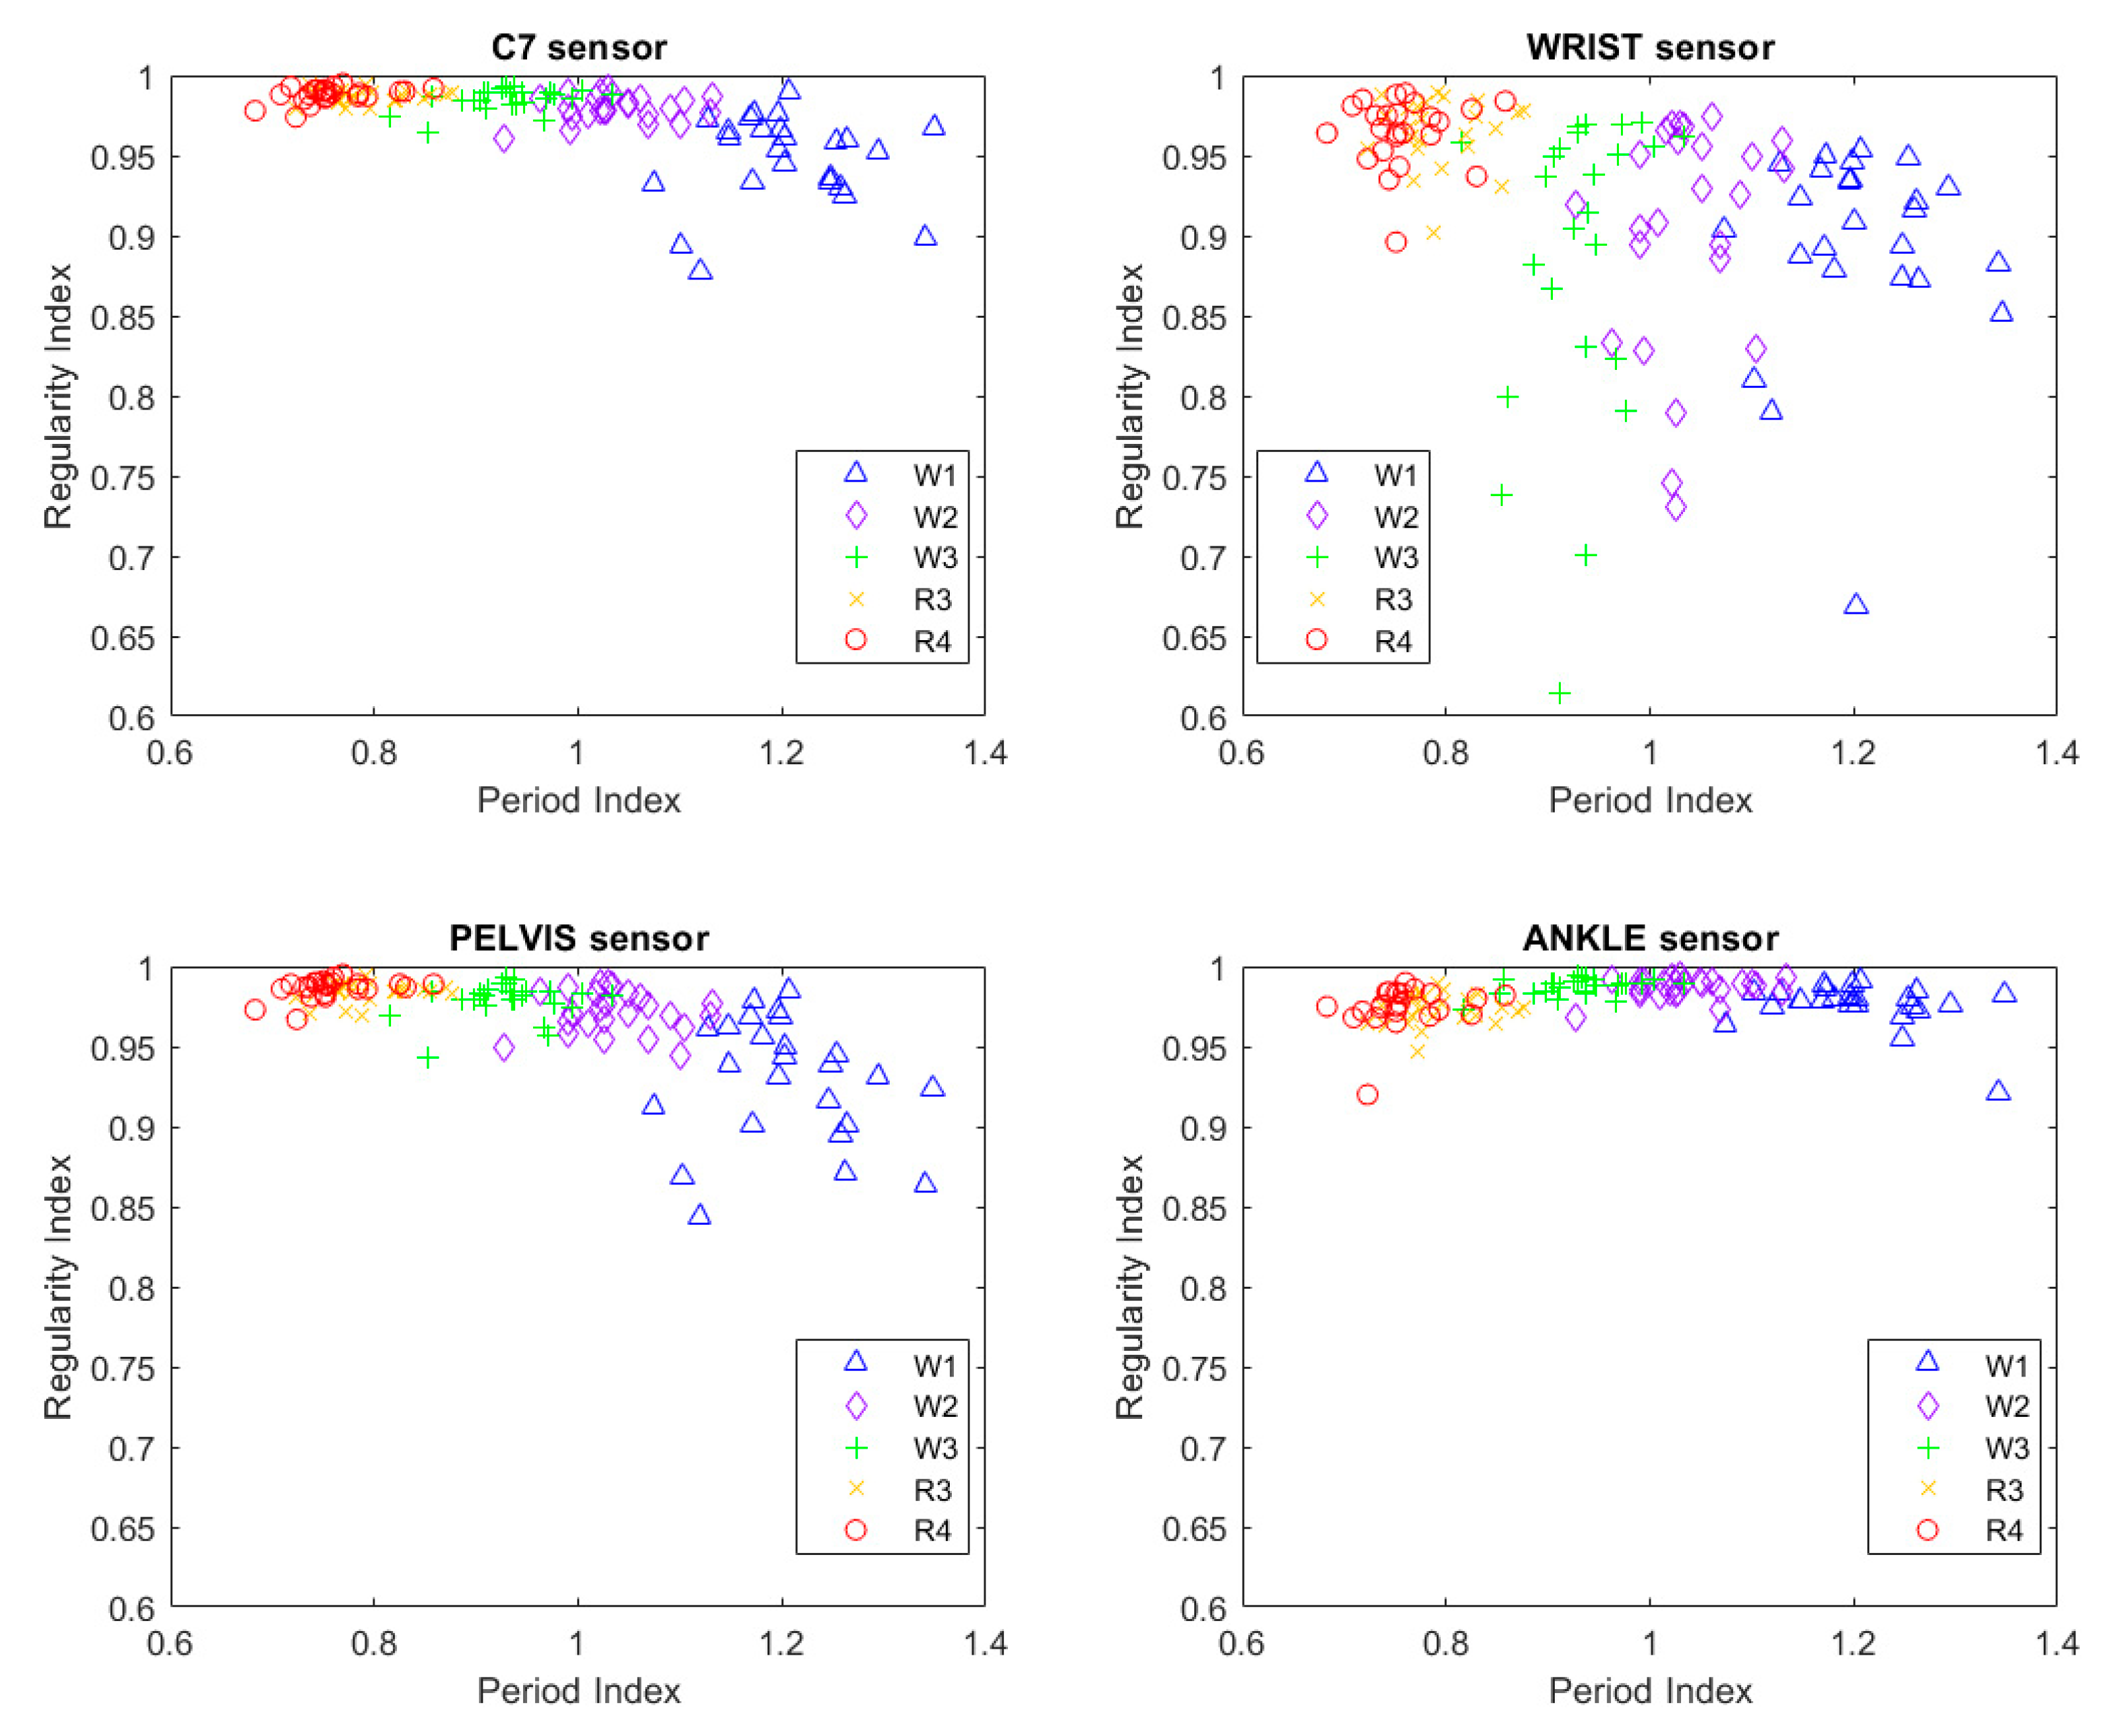
3.5. Regularity Index: Effect of Sensor Location
4. Discussion
5. Conclusions
Author Contributions
Funding
Acknowledgments
Conflicts of Interest
References
- Bovi, G.; Rabuffetti, M.; Mazzoleni, P.; Ferrarin, M. A multiple-task gait analysis approach: Kinematic, kinetic and EMG reference data for healthy young and adult subjects. Gait Posture 2011, 33, 6–13. [Google Scholar] [CrossRef] [PubMed]
- Demos, A.P.; Lisboa, T.; Chaffin, R. Flexibility of Expressive Timing in Repeated Musical Performances. Front. Psychol. 2016, 7, 1490. [Google Scholar] [CrossRef] [PubMed]
- Deuschl, G.; Bain, P.; Brin, M. Consensus statement of the Movement Disorder Society on Tremor. Ad Hoc Scientific Committee. Mov. Disord. 1998, 13 (Suppl. 3), 2–23. [Google Scholar] [CrossRef] [PubMed]
- Albanese, A.; Bhatia, K.; Bressman, S.B.; Delong, M.R.; Fahn, S.; Fung, V.S.C.; Hallett, M.; Jankovic, J.; Jinnah, H.A.; Klein, C.; et al. Phenomenology and classification of dystonia: A consensus update. Mov. Disord. 2013, 28, 863–873. [Google Scholar] [CrossRef] [PubMed]
- Crenna, P.; Carpinella, I.; Lopiano, L.; Marzegan, A.; Rabuffetti, M.; Rizzone, M.; Lanotte, M.; Ferrarin, M. Influence of basal ganglia on upper limb locomotor synergies. Evidence from deep brain stimulation and L-DOPA treatment in Parkinson’s disease. Brain 2008, 131, 3410–3420. [Google Scholar] [CrossRef] [PubMed]
- Usherwood, J.R.; Channon, A.J.; Myatt, J.P.; Rankin, J.W.; Hubel, T.Y. The human foot and heel-sole-toe walking strategy: A mechanism enabling an inverted pendular gait with low isometric muscle force? J. R. Soc. Interface 2012, 9, 2396–2402. [Google Scholar] [CrossRef] [PubMed]
- Pecoraro, F.; Mazzà, C.; Zok, M.; Cappozzo, A. Assessment of level-walking aperiodicity. J. Neuroeng. Rehabil. 2006, 3, 28. [Google Scholar] [CrossRef] [PubMed]
- Hausdorff, J.M. Gait variability: Methods, modeling and meaning. J. Neuroeng. Rehabil. 2005, 2, 19. [Google Scholar] [CrossRef]
- Jordan, K.; Challis, J.H.; Newell, K.M. Walking speed influences on gait cycle variability. Gait Posture 2007, 26, 128–134. [Google Scholar] [CrossRef]
- Hausdorff, J.M. Gait dynamics in Parkinson’s disease: Common and distinct behavior among stride length, gait variability, and fractal-like scaling. Chaos 2009, 19, 026113. [Google Scholar] [CrossRef]
- Stergiou, N.; Decker, L.M. Human movement variability, nonlinear dynamics, and pathology: Is there a connection? Hum. Mov. Sci. 2011, 30, 869–888. [Google Scholar] [CrossRef] [PubMed]
- Parker, K.; Hanada, E.; Adderson, J. Gait variability and regularity of people with transtibial amputations. Gait Posture 2013, 37, 269–273. [Google Scholar] [CrossRef] [PubMed]
- Magnani, R.M.; Lehnen, G.C.; Rodrigues, F.B.; de Sá E Souza, G.S.; de Oliveira Andrade, A.; Vieira, M.F. Local dynamic stability and gait variability during attentional tasks in young adults. Gait Posture 2017, 55, 105–108. [Google Scholar] [CrossRef] [PubMed]
- Bisi, M.C.; Riva, F.; Stagni, R. Measures of gait stability: Performance on adults and toddlers at the beginning of independent walking. J. Neuroeng. Rehabil. 2014, 11, 131. [Google Scholar] [CrossRef] [PubMed]
- Kobsar, D.; Olson, C.; Paranjape, R.; Hadjistavropoulos, T.; Barden, J.M. Evaluation of age-related differences in the stride-to-stride fluctuations, regularity and symmetry of gait using a waist-mounted tri-axial accelerometer. Gait Posture 2014, 39, 553–557. [Google Scholar] [CrossRef] [PubMed]
- Terrier, P.; Dériaz, O.; Meichtry, A.; Luthi, F. Prescription footwear for severe injuries of foot and ankle: Effect on regularity and symmetry of the gait assessed by trunk accelerometry. Gait Posture 2009, 30, 492–496. [Google Scholar] [CrossRef]
- Tura, A.; Raggi, M.; Rocchi, L.; Cutti, A.G.; Chiari, L. Gait symmetry and regularity in transfemoral amputees assessed by trunk accelerations. J. Neuroeng. Rehabil. 2010, 7, 4. [Google Scholar] [CrossRef]
- Kurz, M.J.; Hou, J.G. Levodopa influences the regularity of the ankle joint kinematics in individuals with Parkinson’s disease. J. Comput. Neurosci. 2010, 28, 131–136. [Google Scholar] [CrossRef]
- Kobayashi, H.; Kakihana, W.; Kimura, T. Combined effects of age and gender on gait symmetry and regularity assessed by autocorrelation of trunk acceleration. J. Neuroeng. Rehabil. 2014, 11, 109. [Google Scholar] [CrossRef]
- Schaefer, S.; Jagenow, D.; Verrel, J.; Lindenberger, U. The influence of cognitive load and walking speed on gait regularity in children and young adults. Gait Posture 2015, 41, 258–262. [Google Scholar] [CrossRef]
- Barden, J.M.; Clermont, C.A.; Kobsar, D.; Beauchet, O. Accelerometer-Based Step Regularity Is Lower in Older Adults with Bilateral Knee Osteoarthritis. Front. Hum. Neurosci. 2016, 10, 625. [Google Scholar] [CrossRef]
- Cuzzolin, F.; Sapienza, M.; Esser, P.; Saha, S.; Franssen, M.M.; Collett, J.; Dawes, H. Metric learning for Parkinsonian identification from IMU gait measurements. Gait Posture 2017, 54, 127–132. [Google Scholar] [CrossRef]
- Dingwell, J.B.; Bohnsack-McLagan, N.K.; Cusumano, J.P. Humans control stride-to-stride stepping movements differently for walking and running, independent of speed. J. Biomech. 2018, 76, 144–151. [Google Scholar] [CrossRef] [PubMed]
- Mortaza, N.; Abu Osman, N.A.; Mehdikhani, N. Are the spatio-temporal parameters of gait capable of distinguishing a faller from a non-faller elderly? Eur. J. Phys. Rehabil. Med. 2014, 50, 677–691. [Google Scholar]
- Sánchez, M.C.; Bussmann, J.; Janssen, W.; Horemans, H.; Chastin, S.; Heijenbrok, M.; Stam, H. Accelerometric assessment of different dimensions of natural walking during the first year after stroke: Recovery of amount, distribution, quality and speed of walking. J. Rehabil. Med. 2015, 47, 714–721. [Google Scholar] [CrossRef] [PubMed]
- Muro-de-la-Herran, A.; Garcia-Zapirain, B.; Mendez-Zorrilla, A. Gait Analysis Methods: An Overview of Wearable and Non-Wearable Systems, Highlighting Clinical Applications. Sensors 2014, 14, 3362–3394. [Google Scholar] [CrossRef] [PubMed]
- Kim, Y.-K.; Joo, J.-Y.; Jeong, S.-H.; Jeon, J.-H.; Jung, D.-Y. Effects of walking speed and age on the directional stride regularity and gait variability in treadmill walking. J. Mech. Sci. Technol. 2016, 30, 2899–2906. [Google Scholar] [CrossRef]
- Auvinet, B.; Berrut, G.; Touzard, C.; Moutel, L.; Collet, N.; Chaleil, D.; Barrey, E. Reference data for normal subjects obtained with an accelerometric device. Gait Posture 2002, 16, 124–134. [Google Scholar] [CrossRef]
- Moe-Nilssen, R.; Helbostad, J.L. Estimation of gait cycle characteristics by trunk accelerometry. J. Biomech. 2004, 37, 121–126. [Google Scholar] [CrossRef]
- Gillain, S.; Boutaayamou, M.; Dardenne, N.; Schwartz, C.; Demonceau, M.; Gerontitis, C.; Depierreux, F.; Salmon, E.; Garraux, G.; Bruyère, O.; et al. Data set of healthy old people assessed for three walking conditions using accelerometric and opto-electronic methods. Aging Clin. Exp. Res. 2017, 29, 1201–1209. [Google Scholar] [CrossRef] [PubMed]
- Tura, A.; Rocchi, L.; Raggi, M.; Cutti, A.G.; Chiari, L. Recommended number of strides for automatic assessment of gait symmetry and regularity in above-knee amputees by means of accelerometry and autocorrelation analysis. J. Neuroeng. Rehabil. 2012, 9, 11. [Google Scholar] [CrossRef]
- Yang, C.-C.; Hsu, Y.-L.; Shih, K.-S.; Lu, J.-M. Real-time gait cycle parameter recognition using a wearable accelerometry system. Sensors 2011, 11, 7314–7326. [Google Scholar] [CrossRef]
- Demonceau, M.; Donneau, A.-F.; Croisier, J.-L.; Skawiniak, E.; Boutaayamou, M.; Maquet, D.; Garraux, G. Contribution of a Trunk Accelerometer System to the Characterization of Gait in Patients with Mild-to-Moderate Parkinson’s Disease. IEEE J. Biomed. Health Inf. 2015, 19, 1803–1808. [Google Scholar] [CrossRef]
- Schütte, K.H.; Maas, E.A.; Exadaktylos, V.; Berckmans, D.; Venter, R.E.; Vanwanseele, B. Wireless Tri-Axial Trunk Accelerometry Detects Deviations in Dynamic Center of Mass Motion Due to Running-Induced Fatigue. PLoS ONE 2015, 10, e0141957. [Google Scholar] [CrossRef]
- Menz, H.B.; Lord, S.R.; Fitzpatrick, R.C. Acceleration patterns of the head and pelvis when walking on level and irregular surfaces. Gait Posture 2003, 18, 35–46. [Google Scholar] [CrossRef]
- Rispens, S.M.; Pijnappels, M.; van Schooten, K.S.; Beek, P.J.; Daffertshofer, A.; van Dieën, J.H. Consistency of gait characteristics as determined from acceleration data collected at different trunk locations. Gait Posture 2014, 40, 187–192. [Google Scholar] [CrossRef]
- Jin, L.; Hahn, M.E. Modulation of lower extremity joint stiffness, work and power at different walking and running speeds. Hum. Mov. Sci. 2018, 58, 1–9. [Google Scholar] [CrossRef]
- Della Croce, U.; Leardini, A.; Chiari, L.; Cappozzo, A. Human movement analysis using stereophotogrammetry. Part 4: Assessment of anatomical landmark misplacement and its effects on joint kinematics. Gait Posture 2005, 21, 226–237. [Google Scholar] [CrossRef]
- Fortune, E.; Lugade, V.; Morrow, M.; Kaufman, K. Validity of using tri-axial accelerometers to measure human movement—Part II: Step counts at a wide range of gait velocities. Med. Eng. Phys. 2014, 36, 659–669. [Google Scholar] [CrossRef]
- Hansen, E.A.; Kristensen, L.A.R.; Nielsen, A.M.; Voigt, M.; Madeleine, P. The role of stride frequency for walk-to-run transition in humans. Sci. Rep. 2017, 7, 2010. [Google Scholar] [CrossRef]
- Wu, Y.; Li, Y.; Liu, A.-M.; Xiao, F.; Wang, Y.-Z.; Hu, F.; Chen, J.-L.; Dai, K.-R.; Gu, D.-Y. Effect of active arm swing to local dynamic stability during walking. Hum. Mov. Sci. 2016, 45, 102–109. [Google Scholar] [CrossRef]
- Carpinella, I.; Crenna, P.; Rabuffetti, M.; Ferrarin, M. Coordination between upper- and lower-limb movements is different during overground and treadmill walking. Eur. J. Appl. Physiol. 2010, 108, 71–82. [Google Scholar] [CrossRef]
- Lamberg, E.M.; Muratori, L.M. Cell phones change the way we walk. Gait Posture 2012, 35, 688–690. [Google Scholar] [CrossRef]
- Lafortune, M.A. Three-dimensional acceleration of the tibia during walking and running. J. Biomech. 1991, 24, 877–886. [Google Scholar] [CrossRef]
- Arellano, C.J.; Kram, R. The metabolic cost of human running: Is swinging the arms worth it? J. Exp. Biol. 2014, 217, 2456–2461. [Google Scholar] [CrossRef]
- Scalera, G.M.; Rabuffetti, M.; Marzegan, A.; Frigo, C.; Ferrarin, M. Regularity assessment of cyclic human movements: An innovative method based on wearable sensors. In Proceedings of the 2017 E-Health and Bioengineering Conference (EHB), Sinaia, Romania, 22–24 June 2017; pp. 454–457. [Google Scholar]
- Jonsdottir, J.; Cattaneo, D.; Recalcati, M.; Regola, A.; Rabuffetti, M.; Ferrarin, M.; Casiraghi, A. Task-oriented biofeedback to improve gait in individuals with chronic stroke: Motor learning approach. Neurorehabil. Neural Repair 2010, 24, 478–485. [Google Scholar] [CrossRef]
- Erdmann, W.S.; Lipinska, P. Kinematics of marathon running tactics. Hum. Mov. Sci. 2013, 32, 1379–1392. [Google Scholar] [CrossRef]
- Rabuffetti, M.; Meriggi, P.; Pagliari, C.; Bartolomeo, P.; Ferrarin, M. Differential actigraphy for monitoring asymmetry in upper limb motor activities. Physiol. Meas. 2016, 37, 1798–1812. [Google Scholar] [CrossRef]


| Sex | Age (years) | Body Height (m) | Body Weight (kg) |
|---|---|---|---|
| M | 31 | 1.62 | 52 |
| M | 26 | 1.76 | 85 |
| F | 22 | 1.61 | 45 |
| F | 29 | 1.60 | 49 |
| M | 32 | 1.88 | 86 |
| M | 40 | 1.62 | 48 |
| F | 27 | 1.67 | 53 |
| M | 30 | 1.70 | 61 |
| M | 24 | 1.81 | 75 |
| F | 28 | 1.85 | 73 |
| M | 35 | 1.75 | 75 |
| M | 26 | 1.70 | 57 |
| F | 20 | 1.74 | 59 |
| F | 23 | 1.79 | 65 |
| M | 24 | 1.70 | 70 |
| M | 25 | 1.89 | 83 |
| M | 26 | 1.80 | 74 |
| M | 25 | 1.70 | 75 |
| F | 22 | 1.62 | 46 |
| M | 29 | 1.74 | 75 |
| F | 26 | 1.61 | 45 |
| F | 23 | 1.60 | 51 |
| F | 23 | 1.60 | 55 |
| M | 24 | 1.80 | 79 |
| F | 23 | 1.70 | 55 |
© 2019 by the authors. Licensee MDPI, Basel, Switzerland. This article is an open access article distributed under the terms and conditions of the Creative Commons Attribution (CC BY) license (http://creativecommons.org/licenses/by/4.0/).
Share and Cite
Rabuffetti, M.; Scalera, G.M.; Ferrarin, M. Effects of Gait Strategy and Speed on Regularity of Locomotion Assessed in Healthy Subjects Using a Multi-Sensor Method. Sensors 2019, 19, 513. https://doi.org/10.3390/s19030513
Rabuffetti M, Scalera GM, Ferrarin M. Effects of Gait Strategy and Speed on Regularity of Locomotion Assessed in Healthy Subjects Using a Multi-Sensor Method. Sensors. 2019; 19(3):513. https://doi.org/10.3390/s19030513
Chicago/Turabian StyleRabuffetti, Marco, Giovanni Marco Scalera, and Maurizio Ferrarin. 2019. "Effects of Gait Strategy and Speed on Regularity of Locomotion Assessed in Healthy Subjects Using a Multi-Sensor Method" Sensors 19, no. 3: 513. https://doi.org/10.3390/s19030513
APA StyleRabuffetti, M., Scalera, G. M., & Ferrarin, M. (2019). Effects of Gait Strategy and Speed on Regularity of Locomotion Assessed in Healthy Subjects Using a Multi-Sensor Method. Sensors, 19(3), 513. https://doi.org/10.3390/s19030513