Cadmium-Sensitive Measurement Using a Nano-Copper-Enhanced Carbon Fiber Electrode
by

Jian Wu
1,†, 
Zhipeng Xu
2,†,
Xian Wang
3,
Li Wang
1,*,
Huadong Qiu
1,
Kechao Lu
1,
Wenhong Zhang
1,
Qing Feng
4, 
Jun Chen
1,* and
Lei Yang
5,* 1
School of Mechanical & Automotive Engineering, Qilu University of Technology (Shandong Academy of Sciences), Jinan 250353, China
2
Jinan Foreign Language School, Jinan 250014, China
3
Department of Mechanical & Industrial Engineering, University of Toronto, 5 King’s College Rd, Toronto, Ontario M5S 3G8, Canada
4
School of Environmental Science & Engineering, Qilu University of Technology (Shandong Academy of Sciences), Jinan 250353, China
5
College of information science and engineering, Shandong Agricultural University, Tai’an 271018, China
*
Authors to whom correspondence should be addressed.
†
Authors are equally contributed.
Sensors 2019, 19(22), 4901; https://doi.org/10.3390/s19224901
Submission received: 4 October 2019
/
Revised: 5 November 2019
/
Accepted: 7 November 2019
/
Published: 9 November 2019
(This article belongs to the Special Issue Advanced Electrochemical Sensors and Environmental Monitoring)
Abstract
:Enrichment of cadmium ion (Cd2+) from the environment may lead to kidney disease and weakened immunity in the body. Current techniques are not convenient enough to measure Cd2+ concentration in the environment due to low sensitivity and poor linear range. In this paper, a new measurement technique is proposed using a new sensing electrode made of nano-copper-enhanced carbon fiber. Nano-copper was deposited onto the surface of carbon fiber to enhance the current concentration and mass transfer rate of Cd2+ during measurement, which improved the electrochemical detection sensitivity significantly (by up to 3.7 × 10⁸ nA/nM) and broadened the linear range to 10~105 nM. This device provides a low-cost solution for measuring Cd2+ concentration in the environment.

1. Introduction
Heavy metal ions such as cadmium ions (Cd2+) are highly toxic to human beings [1]. Cd2+ enrichment in human organs like kidney and bone can cause malfunctions in the metabolism of calcium and urine protein, and possibly lead to osteocarcinoma and kidney failure. In addition, cadmium is one of the major environmental pollutants in agricultural production and sanitation [2,3,4,5].
In the 1940s, serious cadmium-pollution-induced osteocarcinoma in Japan raised public awareness of cadmium’s toxic effects for the first time [6,7]. Recently, another cadmium contamination event in the Longjiang River caused 2.8 million fish deaths and serious threats to human health nearby [8]. If a large number of people in an area get sick or die due to the contamination of cadmium, it is necessary to consider whether the cadmium concentration in the area is over the acceptable limit. Accordingly, a convenient method for measuring cadmium concentration is in great need.
To achieve this goal, many measuring methods for heavy metal ions have been developed [9]. Terahertz spectroscopy is one of the advanced techniques used. The sample is scanned by terahertz spectroscopy using electromagnetic radiation (0.1 THz to 10 THz) and characteristic absorption peaks appear at corresponding frequencies in the spectrum [10,11,12]. However, this technique is often used to measure caesium ions [13]. In fact, many different kinds of metal ions, including Cd2+, can cause a detrimental effect on the human body, which is out of the detectable range of elements in terahertz spectroscopy [14,15]. D’Auria’s group invented a protein-bounded biosensor for cadmium detection. It achieved a high sensitivity of 2.5 µg/mL ~ 10 µg/mL and a lower detection limit of 0.5 µM. However, its performance highly depends on the temperature and pH conditions because the sensing part is a protein, i.e., metallothionein (MT) [16].
In recent years, electrochemical methods have become popular in detection of heavy metal ions due to advantages such as high sensitivity, simple procedures, and short analysis time [17]. Aswathi developed a sensor by depositing MoS2 onto a glassy carbon electrode (GCE) substrate, which achieved a detection performance of Cd2+ of 1.0 × 10⁻¹² mol/L [18]. However, the contact area of the GCE (diameter = 3~5 mm) was much larger than that of the micro-electrode, which was made of carbon fiber and had a diameter of 8 μm [19]. This issue may reduce the analyte diffusion rate of the electrodes. As a result, GCE is not suitable for fast measurement of transient electrochemical reactions [20].
Recently, microelectrodes have been used for measuring heavy metal ions including Cd2+ [21]. For example, a gold-based microelectrode fabricated by microelectromechanical systems (MEMS) technology was used to measure Cd2+ in serum and achieved a sensitivity of 3.93 μA/nM [22]. A 64-microelectrode array can simultaneously measure Cd2+ and Hg2+ and reach a sensitivity of 28 nA/nM [23]. A new hybrid nanocomposite microelectrode was composed of one-dimensional multi-walled carbon nanotubes (MWCNTs) and two-dimensional graphene oxide flakes. This microelectrode improved the linear calibration range for Pb2+ and Cd2+ to 0.5–30 μg/L and the detection limits for Cd2+ to 0.61 nM (signal-to-noise ratio = 3, which is a threshold for evaluating effectiveness of the measured signal) [24]. Nanocomposite modification on electrode may improve the response time, sensitivity, and especially the linear sensing range and detection limit in Cd2+ measurement. Because the number of active electrons on the surface of the microelectrode could be increased and more chances to contact analytes would be created for electrochemical reactions [25].
In this paper, a carbon fiber modified with nano-copper deposition is used for Cd2+ detection. Optimal deposition times were tested experimentally and the results showed that a deposition time of 80 s could achieve the best sensitivity. In addition, the influence of pH was explored. The detection limit of the microelectrode after modification with nano-copper was improved to 10 nM. The sensitivity of the microelectrode was improved to 3.7 × 10⁸ nA/nM. Finally, the proposed sensor was used to test water samples from a river, lake, and running water.
2. Experimental Methods
2.1. Fabrication of the Carbon Fiber Electrode
The preparation process of carbon fiber electrode is described as follows (Figure 1A): (1) A copper wire with a diameter of 100 μm and a length of 70 mm was inserted into a glass tube (inner diameter = 1.1 mm). (2) The glass tube was fixed by a holding device in the micromanipulator and the copper wire was welded to the carbon fiber using an electric soldering iron. The welded copper wire and carbon fiber were then moved to the centre of the glass tube. (3) The glass tube was calcined by the outer flame of the alcohol lamp. When the tube centre was melted by the flame, the glass tube broke up into two parts due to a preload force applied on its two terminals. (4) The carbon fiber was surrounded in the glass tube and formed a carbon fiber electrode.
2.2. Nano-Copper Deposition and Electrochemical Measurements
To enhance the electrochemical performance (e.g., sensitivity) of the carbon fiber microelectrode, nano-copper was deposited onto the surface of the carbon fibers by a potentiostatic method under different reaction conditions. First, a carbon fiber was sequentially washed using acetone, isopropanol and distilled water. After drying at 80 °C, the carbon fiber was cleaned using plasma for 30 s at the power of 50 W. CuSO4 (0.3 g) was dissolved in 20 mL of supporting electrolyte (0.9% NaCl). The potentiostatic method was applied on an electrochemical work station (Metrohm-Autolab PGSTAT302N, Metrohm Autolab B.V., Utrecht, The Netherlands). A potential of 7.5 V was applied to the carbon fiber at room temperature. Six groups of reaction conditions (depositing time = 40 s, 80 s, 120 s, 160 s, and 200 s) were performed for the same type of carbon fibers, which aims to locate the proper depositing time for the optimal sensitivity of carbon fiber. After electrodeposition, the modified carbon fibers were washed with ethanol and distilled water in sequence to remove all loosely-bound nano-copper particles, and then dried in a vacuum at room temperature.
During measurement, the prepared electrode was placed in an electrochemical cell containing the analyte solution. The performance of the prepared electrochemical sensors was tested using analytical grade chemicals including CdCl2, CuSO4, KCl, HCl, and NaOH, etc. Differential pulse voltammetry (DPV) and electrochemical impedance spectroscopy (EIS) were carried out on the electrochemical workstation (Metrohm-Autolab PGSTAT302N). The data were processed by using the softwares FRA and NOVA 1.11. The three-electrode system was used in all electrochemical experiments. NaCl solution (0.9%) was used as the supporting solution. Two groups of electrodes including carbon fiber modified with and without nano-copper were used as the working electrode. Ag/AgCl and platinum wires were used as the reference electrode and the counter electrode, respectively. Before each test, the surface of the carbon fiber was washed by cyclic voltammetry (CV) scanning for 300 cycles in a 0.9% NaCl solution.
3. Results and Discussion
3.1. Exploration of Nano-Copper Modification Conditions on the Surface of Carbon Fiber
3.1.1. Modification of Nano-Copper on Carbon Fiber
To observe the optimal performance of nano-copper, different depositing times (including 40 s, 80 s, 120 s, 160 s, and 200 s) were explored. The anode current with different depositing times were recorded and plotted in Figure 1B, which showed that the anode current decreased from 150 μA to 20 μA at the end of each group. This indicates that the resistance decreased during the process of electrodeposition due to the accumulation of free electrons [26].
To determine the optimal electrodeposition condition, six groups of carbon fiber electrodes including a control group (the carbon fiber without nano-copper) were immersed in [Fe(CN)6]3− to test their DPV response. [Fe(CN)6]3− is commonly used as a bentchmark for evaluating the performance of electrochemical sensors. Figure 2a shows the DPV response of carbon fiber with and without nano-copper for [Fe(CN)6]3−. The oxidation peak of the carbon fiber without nano-copper occurs at a potential of 35 mV and its oxidation peak current is 1.96 nA. The difference between the peak current and background current is defined as ΔI, which refers to the first point of Figure 2b. The oxidation peak current dramatically increases to 4.1 nA for the carbon fiber with nano-copper that was deposited under 40 s, and the oxidation peak shifts to 7 mV. When the deposition time is increased to 80 s, the oxidation peak current changes to 4.3 nA. However, the oxidation peak current decreases with the increase in deposition time, and its value decreases to 2.5 nA (ΔI is 0.92 nA, shown in the sixth point of Figure 2b). From the DPV responses in the [Fe(CN)6]3− experiment, 80 s was selected as the deposition time for nano-copper modification.
3.1.2. Characterization of Charge Transferability
Electrochemical impedance spectroscopy (EIS) was adopted to verify the difference in charge transferability between the carbon fibers with and without nano-copper. Figure 2c shows Nyquist plots of the carbon fibers that were scanned in 5 mM [Fe(CN)6]3+. The appearance of a semicircle in a Nyquist plot indicates that in the impedance model (see the inset in Figure 2c) there is a parallel connection between the resistor Rct (charge transfer resistance) and the capacitor Cdel (double electric layer). The calculated Rct in carbon fiber without nano-copper was 17.3 kΩ and that for carbon fiber with nano-copper was 6.5 kΩ. A significant decrease (62.4%) in Rct reveals that the nano-copper deposition is able to increase the electron transfer speed and enhance diffusion of reactive chemical species.
3.1.3. Morphologies of Carbon Fibers with and without Nano-Copper
To determine the mechanism of how the nano-copper deposition is able to enhance electrochemical sensing performance, the morphology change of carbon fiber before and after nano-copper modification was studied by SEM (S4800 microscope, Hitachi, Ltd. Hitachi, Japan). The inset in Figure 2b shows that carbon fiber without nano-copper has a smooth cylindrical surface, and its diameter is 7 μm. After depositing for 80 s, rough nano-copper was evenly grown onto the surface of the carbon fiber and the diameter of the modified carbon fiber increased to 8.5 μm. The increased diameter and the roughness of the surface improved the specific surface area significantly, which provided more reaction sites for the bounding of the electrode and Cd2+.
3.2. DPV Response Comparison of the Carbon Fiber Electrode with and without Nano-Copper
To compare the redox response of Cd2+ for the carbon fiber electrodes with and without nano-copper, DPV was employed to test a 100 μM Cd2+ solution group and another control group of solution without Cd2+. There was no oxidation peak (redox response did not occur) when carbon fiber electrodes were tested in the control group of solution without Cd2+. For the carbon fiber electrode without nano-copper, there was an oxidation peak at a potential of –751 mV with a value of 0.82 nA. However, the oxidation peak current increased to 5.6 nA for the carbon fiber electrode with nano-copper and the potential of the oxidation peak shifted to –696 mV. The significant improvement of the DPV response may be attributed to the enlarged specific surface area and more reaction contacting spots after nano-copper deposition [27].
In addition, the DPV measurement for the carbon fiber with nano-copper was repeated for five times to test its stability. It can be seen from Figure 2d that the peak current stabilized around 5.6 nA. This indicates that the electrode can achieve a steady response output for Cd2+ detection.
3.3. The Influence of pH
It is well accepted that the pH of the aqueous solution would affect the electrocatalytic reaction in the electrochemical redox process [28]. Thus, the influence of pH on detecting Cd2+ was investigated for the carbon-fiber-modified electrode (Figure 3a). The pH changed from 2.7 to 6.6 and the ΔI was used to compare the influence of pH. The ΔI slowly increased when the pH changed from 2.7 to 5.9. When the pH achieved a value of 6.1, the ΔI increased to the maximum level (3.25 nA). After this, the ΔI started to decrease. Therefore, pH = 6.1 was selected for testing Cd2+.
3.4. Determination of the Sensitivity, Detection Limit, and Linear Range for Cd2+ Measurement
To evaluate the performance including the linear range, sensitivity and detection limit of the proposed carbon fiber electrode, Cd2+ solutions from 10 nM to 100 μM was used as the testing sample. Figure 3b shows that the oxidation current increases with the concentration of Cd2+. When Cd2+ concentration is less than 1 nM and 5 nM in the supporting solution, there is no detectable current response. When the Cd2+ concentration is increased to 10 nM, an oxidation peak was detected (signal-to-noise ratio > 3) which is referred as the detection limit of the carbon fiber electrode for Cd2+. The specific values of oxidized peak currents were evaluated and were linear fitted with the log concentration of Cd2+ in the form ΔI = k lg(C) + b. The fitting result (see Figure 3c) shows that the sensitivity of carbon fiber with nano-copper for Cd2+ is 0.3997 nA/nM and that the linear range is the whole detection range (10 nM to 100 μM). In addition, the Cd2+ sensing performance of our nano-copper-modified carbon fiber electrode and other electrodes in the literature are compared in Table 1, which shows that the proposed electrodes have superiority in the detection limit and the linear range.
3.5. The Selectivity of the Carbon Fiber Electrode with Nano-Copper
To determine the selectivity of our electrode, the DPV response was tested in the supporting solution with foreign ions, including 500 μM K+, Na+, Cu2+, Hg2+, Al3+, (SO4)2–, and (NO3)–. The amount of foreign ions was five-fold to 50,000-fold that of Cd2+. Figure 3d shows the DPV response for the mixed solutions. During the voltage scanning range (from –1.1 V to 0.5 V), obvious oxidation peaks occur around a potential of 224 mV. This is probably due to the presence of Hg2+, according to the reported results in the literature [26,40].
There is also an inconspicuous peak around the potential of –300 mV, which may be the response of Cu2+. However, the peak is mostly covered by the DPV response of Cd2+. The results reveal that foreign ions have little effect on Cd2+ detection.
In addition, it was evaluated whether the foreign ions affect the linear range, sensitivity, and detection limit of the proposed carbon fiber electrode. The curve between Cd2+ concentration and DPV peak current was fitted (see Figure 3e). This indicated that the linear range and the detection limit did not change when the interference was presented while the sensitivity was slightly decreased by 7.28%.
3.6. Analytical Application to Water Samples Collected from Water Sources
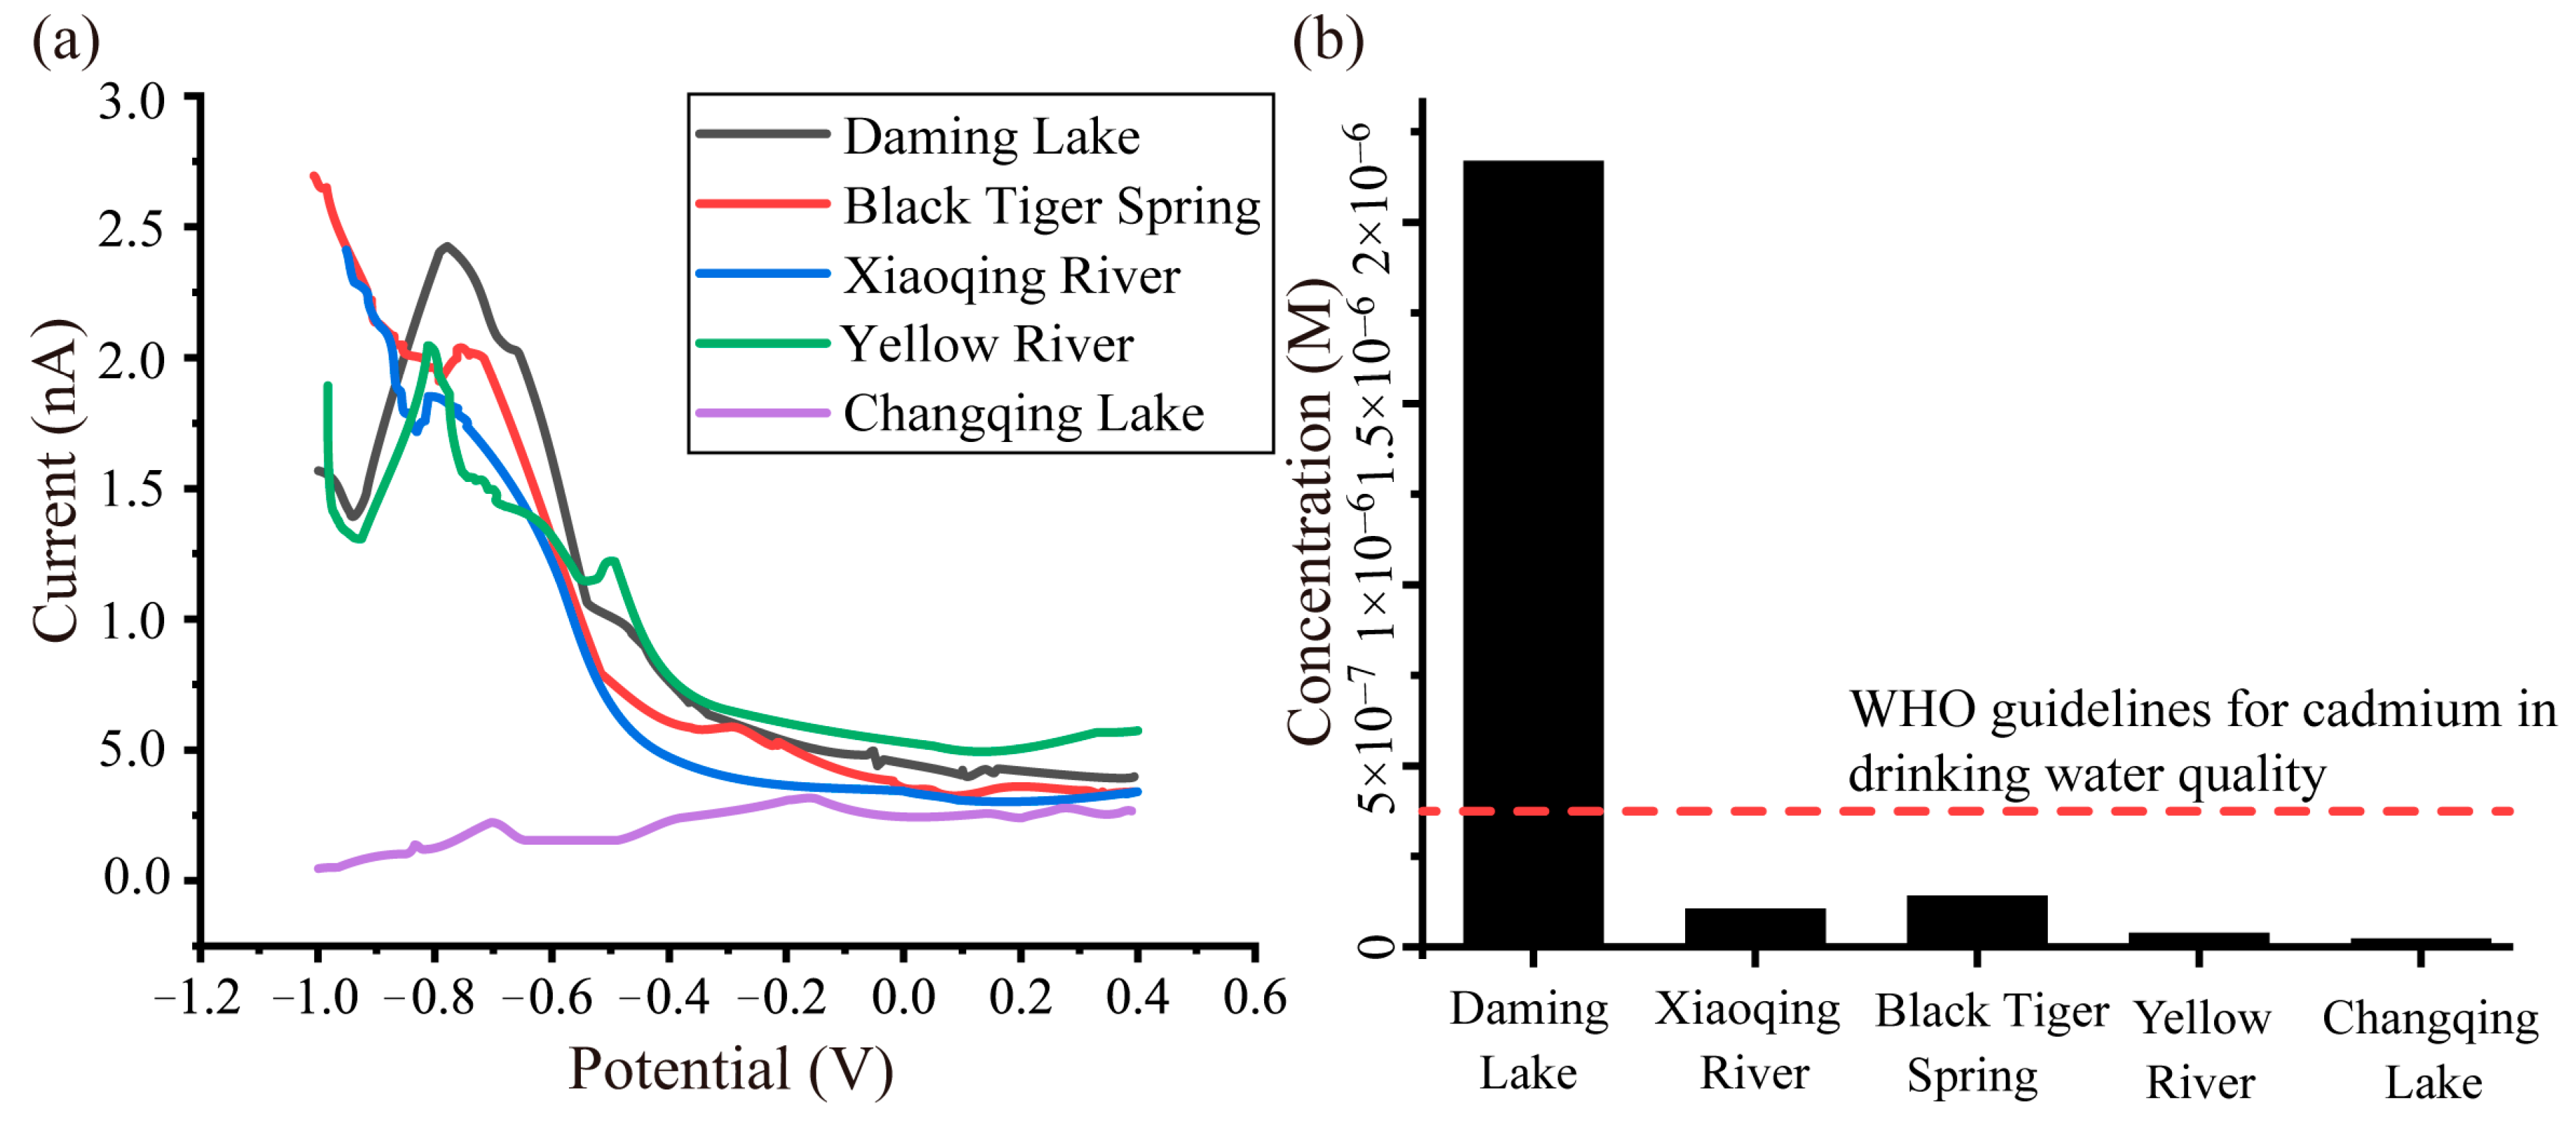
To verify the performance of our carbon fiber electrode sensor for Cd2+ detection, water samples collected from water sources around Jinan city, including the Daming Lake, the Black Tiger Spring, the Xioaqing River, the Yellow River, and the Changqing Lake. Figure 4 shows the DPV responses of these water samples with pH = 6.1. Their corresponding Cd2+ concentrations are shown in the diagram in Figure 4b, which was obtained from the curve fitting result in Section 3.5. According to the World Health Organization (WHO) guidelines for drinking water quality, cadmium ion concentration must be less than 0.005 mg/L (0.3 μM). Otherwise, the cadmium ion would be a threat to the health of the kidneys and other organs. The results revealed that the water in Daming Lake was not suitable for drinking directly.
4. Conclusions
In this study, a nano-copper-modified carbon fiber electrode was proposed and applied for Cd2+ inspection in drinking water. The detection limit, linear range, sensitivity and selectivity of the proposed sensor were justified. DPV technology was used to record the currents generated by the metal ions. The performance of the proposed carbon fiber electrode was also verified by measuring Cd2+ concentrations of water samples collected from water sources. The experiment results indicated that nano-copper deposition played a crucial rule in the improvement of the sensitivity of the electrode and the attraction ability for Cd2+ ions.
Based on the results from this study, the next step for this sensor would be to integrate it into a portable device and apply it to the monitoring of the enrichment of heavy metal ions in the human body. The measuring results of Cd2+ concentrations could be sent to mobile phones by Bluetooth.
Author Contributions
Conceptualization, J.W. and Z.X.; methodology, K.L. and Q.F.; software, H.Q. and X.W.; validation, L.W., J.C. and L.Y.; formal analysis, J.W.; investigation, Z.X.; resources, L.W., J.C. and L.Y.; data curation, W.Z.; writing—original draft preparation, J.W. and Z.X.; writing—review and editing, L.W., J.C. and L.Y.; project administration, L.W., J.C. and L.Y.; funding acquisition, L.W., J.C. and L.Y.
Acknowledgments
The authors acknowledge the financial support of the National Natural Science Fund of China (grant nos. 31971781 and 61901239) and the Taishan Scholars Young Expert (no. tsqn201812087). Li Wang thanks the guidance of his postdoctoral advisor Professor Yu Sun (University of Toronto) and his Ph.D advisor Professor Xinxia Cai (Institute of Electronics, Chinese Academy of Sciences).
Conflicts of Interest
The authors declare no conflict of interest.
References
- Tchounwou, P.B.; Yedjou, C.G.; Patlolla, A.K.; Sutton, D.J. Heavy Metal Toxicity and the Environment, Chapter in: Molecular, Clinical and Environmental Toxicology; Luch, A., Ed.; Springer: Berlin/Heidelberg, Germany, 2012; Volume 3, pp. 133–164. [Google Scholar]
- Singh, R.; Gautam, N.; Mishra, A.; Gupta, R. Heavy metals and living systems: An overview. Indian J. Pharmacol. 2011, 43, 246–253. [Google Scholar] [CrossRef] [PubMed]
- Rather, I.A.; Koh, W.Y.; Paek, W.K.; Lim, J. The sources of chemical contaminants in food and their health implications. Front. Pharmacol. 2017, 8, 830. [Google Scholar] [CrossRef] [PubMed]
- Li, X.F. Technical solutions for the safe utilization of heavy metal-contaminated farmland in China: A critical review. Land Degrad. Dev. 2019, 30, 1773–1784. [Google Scholar] [CrossRef]
- Wang, L.; Cui, X.; Cheng, H.; Chen, F.; Wang, J.; Zhao, X.; Lin, C.; Pu, X. A review of soil cadmium contamination in China including a health risk assessment. Environ. Sci. Pollut. Res. 2015, 22, 16441. [Google Scholar] [CrossRef]
- Rahimzadeh, M.R.; Rahimzadeh, M.R.; Kazemi, S.; Moghadamnia, A.A. Cadmium toxicity and treatment: An update. Casp. J. Intern. Med. 2017, 8, 135–145. [Google Scholar]
- Huff, J.; Lunn, R.M.; Waalkes, M.P.; Tomatis, L.; Infante, P.F. Cadmium-induced cancers in animals and in humans. Int. J. Occup. Environ. Health 2007, 13, 202–212. [Google Scholar] [CrossRef]
- Ahmed, F.E.; Taylor, S.L.; Committee on Evaluation of the Safety of Fishery Products. Seafood Safety; National Academy Press: Washington, DC, USA, 1991. [Google Scholar]
- Gumpu, M.B.; Sethuraman, S.; Krishnan, U.M.; Rayappan, J.B.B. A review on detection of heavy metal ions in water—An electrochemical approach. Sens. Actuators B Chem. 2015, 213, 515–533. [Google Scholar] [CrossRef]
- Dhillon, S.S.; Vitiello, M.S.; Linfield, E.H.; Davies, A.G.; Hoffmann, M.C.; Booske, J.; Paoloni, C.; Gensch, M.; Weightman, P.; Williams, G.P.; et al. The 2017 terahertz science and technology roadmap. J. Phys. D Appl. Phys. 2017, 50, 043001. [Google Scholar] [CrossRef]
- Yasui, T.; Ichikawa, R.; Hsieh, Y.D.; Hayashi, K.; Cahyadi, H.; Hindle, F.; Sakaguchi, Y.; Iwata, T.; Mizutani, Y.; Yamamoto, H.; et al. Adaptive sampling dual terahertz comb spectroscopy using dual free-running femtosecond lasers. Sci. Rep. 2015, 5, 1–10. [Google Scholar] [CrossRef]
- Yeo, W.G. Terahertz Spectroscopic Characterization and Imaging for Biomedical Applications. Ph.D. Thesis, Ohio State University, Columbus, OH, USA, 2015. [Google Scholar]
- ATSDR. Toxicological Profile for Cesium; Case Studies in Environmental Medicine; Agency for Toxic Substances and Disease Registry: Atlanta, GA, USA, 2004.
- Ganrot, P. Metabolism and possible health effects of aluminum biochemistry and metabolism of A13+ and similar ions: A Review. Environ. Health Perspect. 1986, 65, 363–441. [Google Scholar]
- Peterson, J.; MacDonell, M.; Haroun, L.; Monette, F.; Hildebrand, R.D.; Taboas, A. Radiological and Chemical Fact Sheets to Support Health Risk Analyses for Contaminated Areas; Argonne National Laboratory Environmental Science Division: Washington, DC, USA, 2007; Volume 133.
- Varriale, A.; Staiano, M.; Rossi, M.; D’Auria, S. High-affinity binding of cadmium ions by mouse metallothionein prompting the design of a reversed-displacement protein-based fluorescence biosensor for cadmium detection. Anal. Chem. 2007, 79, 5760–5762. [Google Scholar] [CrossRef] [PubMed]
- Zhu, C.; Yang, G.; Li, H.; Du, D.; Lin, Y. Electrochemical sensors and biosensors based on nanomaterials and nanostructures. Anal. Chem. 2015, 87, 230–249. [Google Scholar] [CrossRef] [PubMed]
- Aswathi, R.; Sandhya, K.Y. Ultrasensitive and selective electrochemical sensing of Hg (II) ions in normal and sea water using solvent exfoliated MoS2: Affinity matters. J. Mater. Chem. A 2018, 6, 14602–14613. [Google Scholar] [CrossRef]
- Sapountzi, E.; Braiek, M.; Chateaux, J.F.; Jaffrezic-Renault, N.; Lagarde, F. Recent advances in electrospun nanofibre interfaces for biosensing devices. Sensors. 2017, 17, 1887. [Google Scholar] [CrossRef]
- Lohse, K.R.; Lang, C.E.; Boyd, L.A. Is more better? Using metadata to explore dose-response relationships in stroke rehabilitation. Stroke 2014, 45, 2053–2058. [Google Scholar] [CrossRef]
- Piñeros, M.A.; Shaff, J.E.; Kochian, L.V. Development, characterization, and application of a cadmium-selective microelectrode for the measurement of cadmium fluxes in roots of thlaspi species and wheat. Plant Physiol. 1998, 116, 1393–1401. [Google Scholar] [CrossRef]
- Xuan, X.; Park, J.Y. A miniaturized and flexible cadmium and lead ion detection sensor based on micro-patterned reduced graphene oxide/carbon nanotube/bismuth composite electrodes. Sens. Actuators B Chem. 2018, 255, 1220–1227. [Google Scholar] [CrossRef]
- Mastouri, A.; Peulon, S.; Farcage, D.; Bellakhal, N.; Chaussé, A. Perfect additivity of microinterface arrays for liquid-liquid measurements: Application to cadmium ions quantification. Electrochim. Acta 2014, 120, 212–218. [Google Scholar] [CrossRef]
- Huang, H. Electrochemical Application and AFM Characterization of Nanocomposites: Focus on Interphase Properties. Ph.D. Thesis, Shandong University, Jinan, China, 2017. [Google Scholar]
- Yang, D.; Wang, L.; Chen, Z.; Megharaj, M.; Naidu, R. Voltammetric determination of lead (II) and cadmium (II) using a bismuth film electrode modified with mesoporous silica nanoparticles. Electrochim. Acta 2014, 132, 223–229. [Google Scholar] [CrossRef]
- Shah, A.; Sultan, S.; Zahid, A.; Aftab, S.; Nisar, J.; Nayab, S.; Qureshi, R.; Khan, G.S.; Hussain, H.; Ozkan, S.A. Highly sensitive and selective electrochemical sensor for the trace level detection of mercury and cadmium. Electrochim. Acta 2017, 258, 1397–1403. [Google Scholar] [CrossRef]
- Rahbar, N.; Parham, H. Carbon paste electrode modified with cuo-nanoparticles as a probe for square wave voltammetric determination of atrazine. Jundishapur J. Nat. Pharm. Prod. 2013, 8, 118–124. [Google Scholar] [CrossRef] [PubMed]
- Wang, J.; Yang, B.; Gao, F.; Song, P.; Li, L.; Zhang, Y.; Lu, C.; Goh, M.C.; Du, Y. Ultra-stable electrochemical sensor for detection of caffeic acid based on platinum and nickel jagged-like nanowires. Nanoscale Res. Lett. 2019, 14, 11. [Google Scholar] [CrossRef] [PubMed]
- Chamjangali, M.A.; Kouhestani, H.; Masdarolomoor, F.; Daneshinejad, H. A voltammetric sensor based on the glassy carbon electrode modified with multi-walled carbon nanotube/poly (pyrocatechol violet)/bismuth film for determination of cadmium and lead as environmental pollutants. Sens. Actuators B Chem. 2015, 216, 384–393. [Google Scholar] [CrossRef]
- Li, L.; Liu, D.; Shi, A.; You, T. Simultaneous stripping determination of cadmium and lead ions based on the N-doped carbon quantum dots-graphene oxide hybrid. Sens. Actuators B Chem. 2018, 255, 1762–1770. [Google Scholar] [CrossRef]
- Li, L.; Liu, B.; Chen, Z. Colorimetric and dark-field microscopic determination of cadmium(II) using unmodified gold nanoparticles and based on the formation of glutathione-cadmium(II) complexes. Microchim. Acta 2019, 186, 7–13. [Google Scholar] [CrossRef] [PubMed]
- Lin, H.; Li, M.; Mihailovič, D. Simultaneous determination of copper, lead, and cadmium ions at a Mo6S9-xIx nanowires modified glassy carbon electrode using differential pulse anodic stripping voltammetry. Electrochim. Acta 2015, 154, 184–189. [Google Scholar] [CrossRef]
- Wu, L.; Fu, X.; Liu, H.; Li, J.; Song, Y. Comparative study of graphene nanosheet-and multiwall carbon nanotube-based electrochemical sensor for the sensitive detection of cadmium. Anal. Chim. Acta 2014, 851, 43–48. [Google Scholar] [CrossRef]
- Cui, L.; Wu, J.; Ju, H. Nitrogen-doped porous carbon derived from metal-organic gel for electrochemical analysis of heavy-metal ion. ACS Appl. Mater. Interfaces 2014, 6, 16210–16216. [Google Scholar] [CrossRef]
- Fort, C.I.; Cotet, L.C.; Vulpoi, A.; Turdean, G.L.; Danciu, V.; Baia, L.; Popescu, I.C. Bismuth doped carbon xerogel nanocomposite incorporated in chitosan matrix for ultrasensitive voltammetric detection of Pb (II) and Cd (II). Sens. Actuators B Chem. 2015, 220, 712–719. [Google Scholar] [CrossRef]
- Wardak, C. Solid contact cadmium ion-selective electrode based on ionic liquid and carbon nanotubes. Sens. Actuators B Chem. 2015, 209, 131–137. [Google Scholar] [CrossRef]
- Devasenathipathy, R.; Karthik, R.; Chen, S.M.; Mani, V.; Vasantha, V.S.; Ali, M.A.; Elshikh, M.S.; Lou, B.S.; Al-Hemaid, F.M.A. Potentiostatic electrochemical preparation of bismuth nanoribbons and its application in biologically poisoning lead and cadmium heavy metal ions detection. Electroanalysis 2015, 27, 2341–2346. [Google Scholar] [CrossRef]
- Liu, G.; Zhang, Y.; Qi, M.; Chen, F. Covalent anchoring of multifunctionized gold nanoparticles on electrodes towards an electrochemical sensor for the detection of cadmium ions. Anal. Methods 2015, 7, 5619–5626. [Google Scholar] [CrossRef]
- Niu, P.; Fernández-Sánchez, C.; Gich, M.; Ayora, C.; Roig, A. Electroanalytical assessment of heavy metals in waters with bismuth nanoparticle-porous carbon paste electrodes. Electrochim. Acta 2015, 165, 155–161. [Google Scholar] [CrossRef]
- Budnikova, Y.H.; Krasnov, S.A.; Magdeev, I.M.; Sinyashin, O.G. Laws of chloride-ions oxidation on various electrodes and “Green” electrochemical method of higher α-Olefins processing. ECS Trans. 2010, 25, 7–15. [Google Scholar]
Figure 1.
(A) A schematic for demonstrating each step during the fabrication process of the carbon fiber electrode. The digital images show a fabricated carbon fiber electrode and its tip shape. (B) The current change during the deposition of the nano-copper onto the surface of the carbon fiber.
Figure 1.
(A) A schematic for demonstrating each step during the fabrication process of the carbon fiber electrode. The digital images show a fabricated carbon fiber electrode and its tip shape. (B) The current change during the deposition of the nano-copper onto the surface of the carbon fiber.
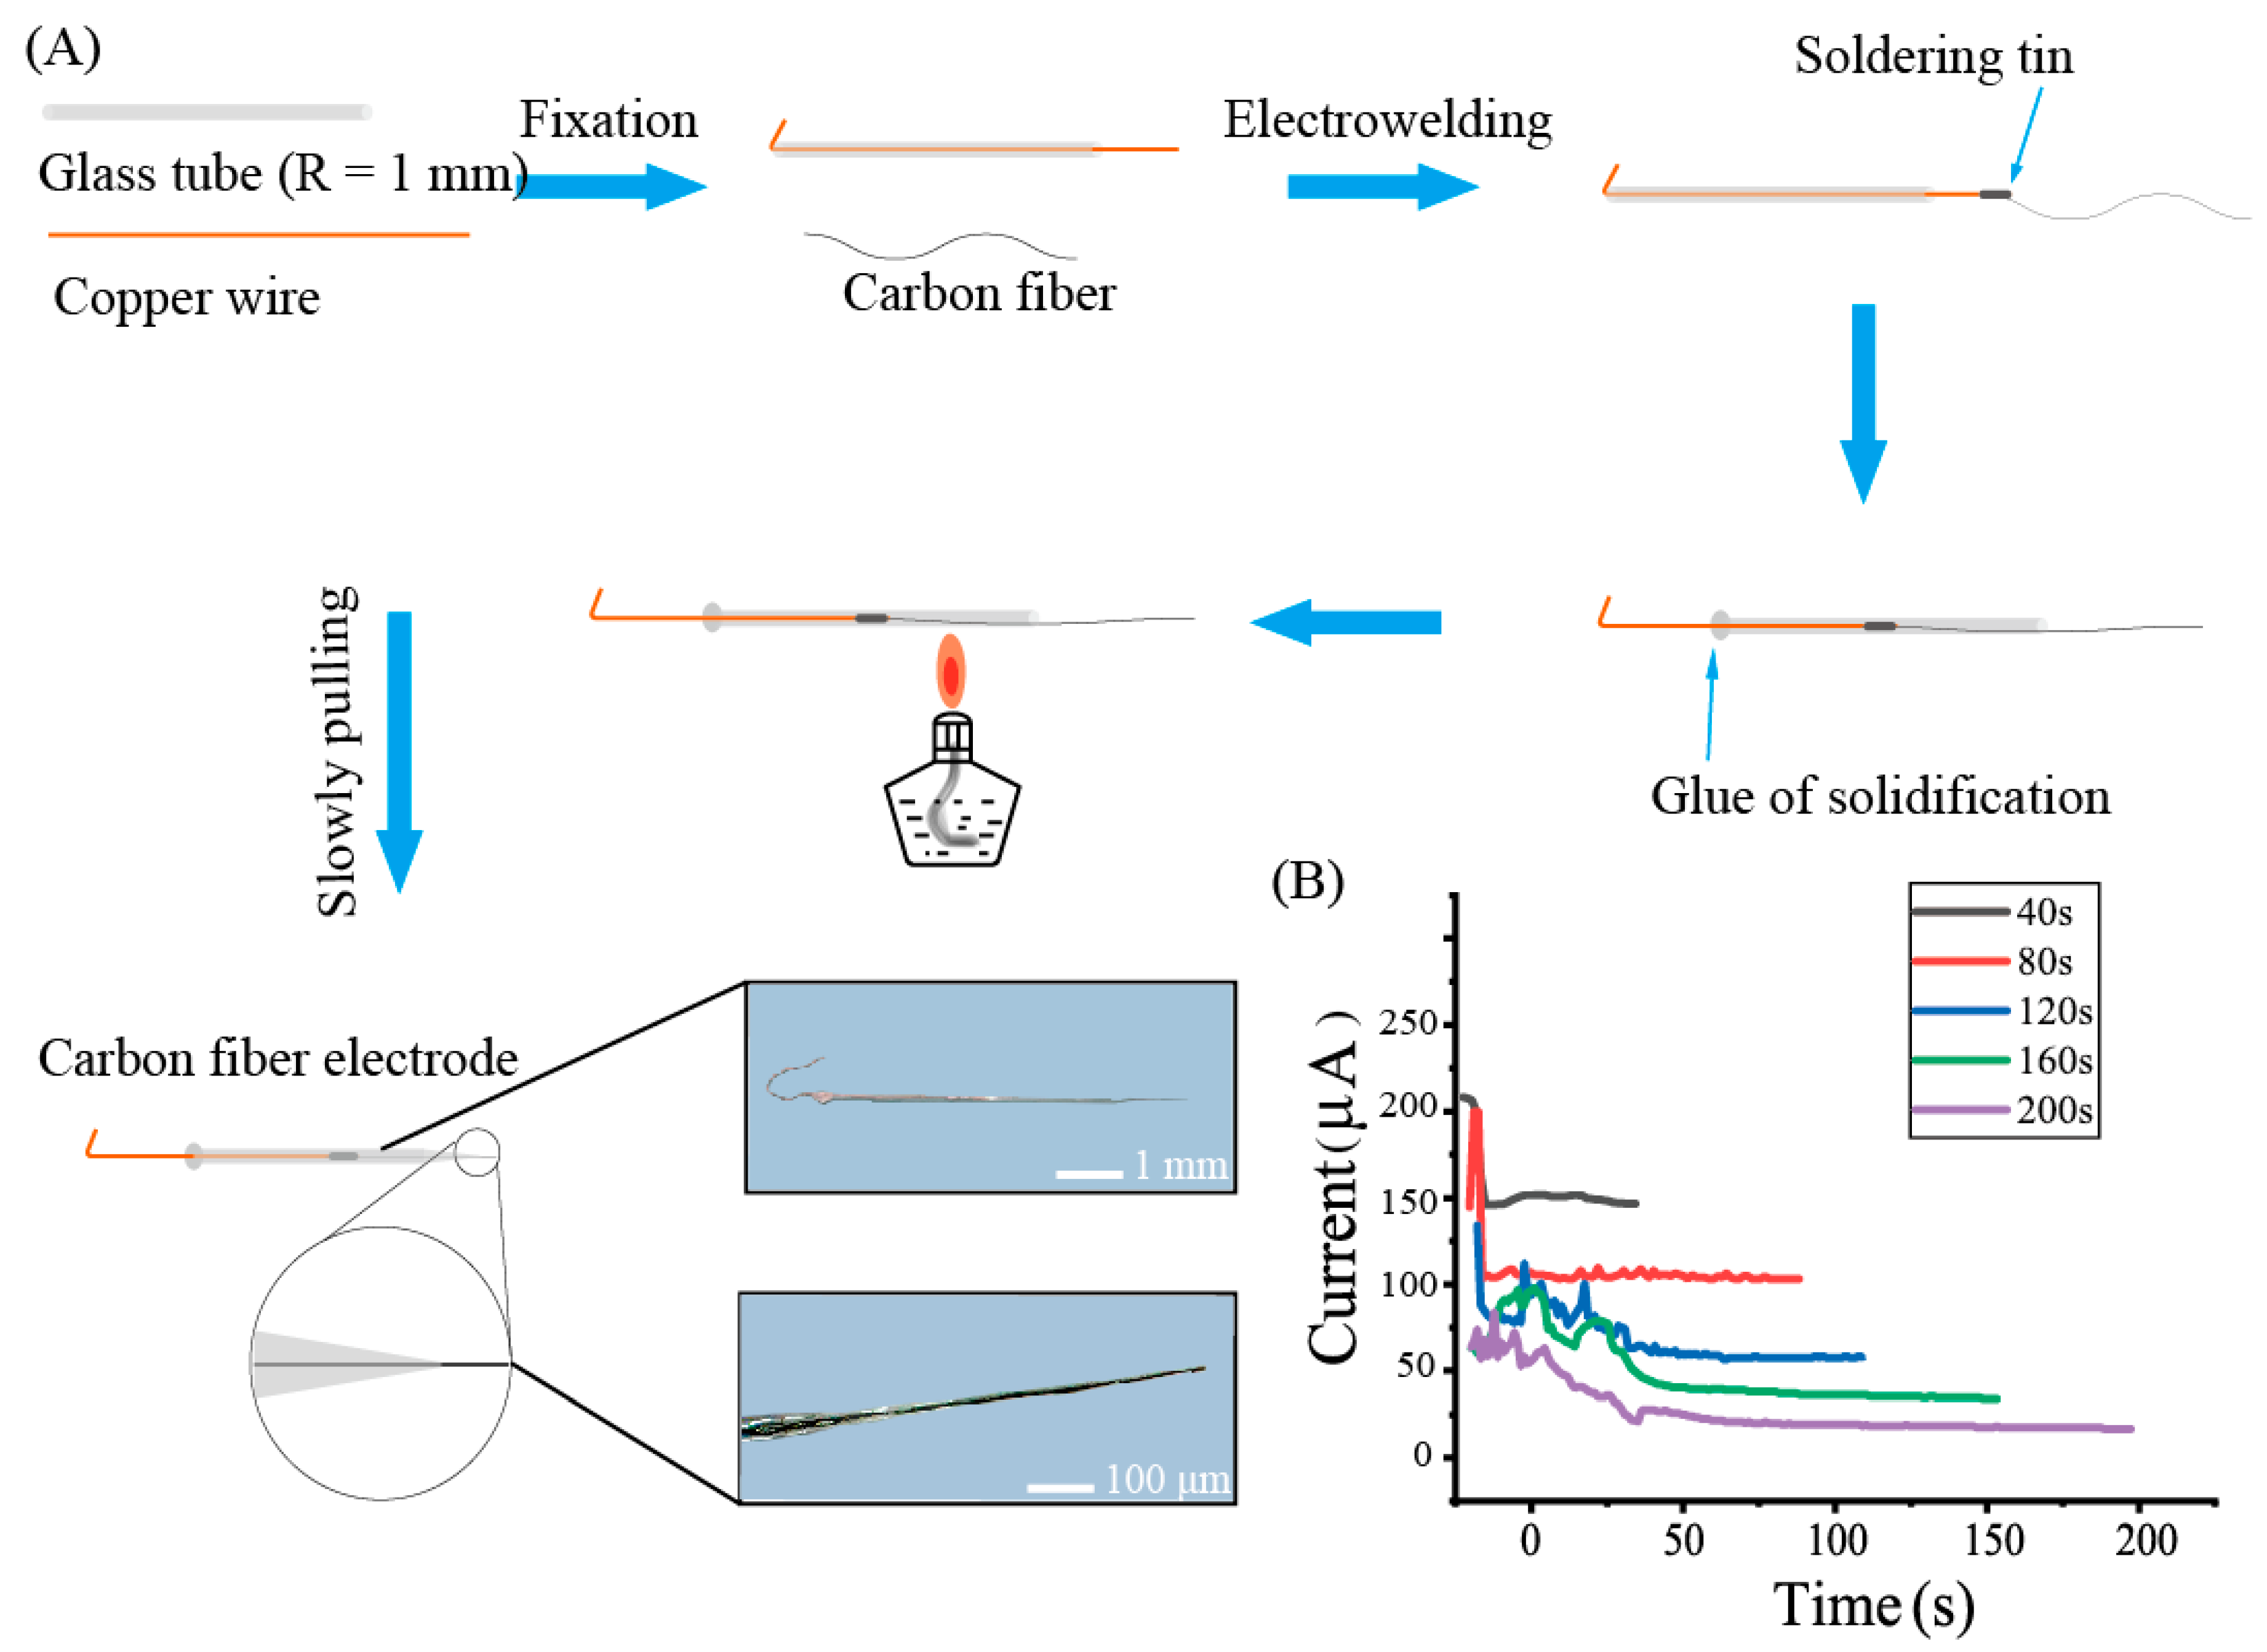
Figure 2.
(a) Exploration of nano-copper modification conditions. Differential pulse voltammetry (DPV) responses of 5 mM using carbon fibers modified with different deposition times. (b) The measured ΔI for different deposition times (ΔI was the largest with a deposition time of 80 s). The SEM images of carbon fiber with and without nano-copper show significant surface morphology changes. (c) Verification of charge transferability by the electrochemical impedance spectroscopy (EIS) response for the carbon fibers with and without nano-copper (80 s and 0 s, respectively). (d) DPV responses for 100 μM Cd2+ solution and supporting solution without Cd2+.

Figure 3.
(a) The influence of pH in the DPV response for Cd2+. The pH was changed from 2.7 to 6.6. (b) DPV responses of nano-copper-modified carbon fiber with different concentrations of Cd2+ from 10 nM to 100 μM. (c) The fitting result between ΔI (the difference between the peak current and background current) and the concentration of Cd2+; ΔI = k lg(C) + b. (d) The DPV responses for the mixing of foreign ions including K+, Na+, Cu2+, Hg2+, Al3+, (SO4)2-, and (NO3)-. (e) The fitting result between ΔI and the concentration of Cd2+ in the presence of foreign ions.

Figure 4.
Water samples collected from several typical water sources around Jinan city (including the Daming Lake, the Black Tiger Spring, the Xiaoqing River, the Yellow River, and the Changqing Lake) were measured using the proposed carbon fiber electrode with nano-copper. (a) The DPV responses of the water samples. (b) The diagram for the Cd2+ concentration results of the water samples and their comparison with the suggested concentration given by the World Health Organization (WHO).

Table 1.
Comparison of Cd2+ sensing performance among our nano-copper-modified carbon fiber electrode and other electrodes in the literature.
Table 1.
Comparison of Cd2+ sensing performance among our nano-copper-modified carbon fiber electrode and other electrodes in the literature.
| Electrode Type | Detection Limit (nM) | Sensitivity (nA/nM) | Linear Range (nM) | Detection Method | Reference |
|---|---|---|---|---|---|
| GCE modified with CNT/poly pyrocatechol violet/bismuth | 1.22 | 1.7 | 6.08~1820 | ASV | [29] |
| N-doped carbon quantum dots-graphene oxide (NCQDs-Go)/GCE | 45.3 | 0.16 | 0.67~683.6 | ASV | [30] |
| GCE modified with gold nanoparticles(AuNPs) | 0.045 | / | 0.0017~16.7 | Colorimetri | [31] |
| Mo6S9 /GCE | 0.61 | 260 | 3.04~912 | DPASV | [32] |
| Nanocomposite based on nanographene | 0.023 | 405 | 1.52~30.4 | DPASV | [33] |
| Covalent anchoring of aryldiazonium salt | 2.2 | 8.83 × 10⁶ | 25~500 | SWASV | [34] |
| Bi doped mesoporous carbonxerogel/(GCE) | 308 | 2.67 × 10⁶ | 6810~7540 | SWASV | [35] |
| GCE modified with MWCNT | 2.3 | / | / | EIS | [36] |
| Bismuth nanorib bons(BiNRs) sensor | 0.88 | 1.2 × 10⁶ | 6.08~304 | DPASV | [37] |
| Au-Ph-AuNP-glutathione(GSH) electrode | 0.01 | 9.17 × 10⁷ | 0.1~10 | OSWV | [38] |
| Bismuthnanoparticle-porous/carbon paste electrode(CPE) | 4.93 | 1.22 × 10⁶ | 6.08~608 | SWASV | [39] |
| Carbon fibre electrode modified with nano-copper | 10 | 3.7 × 10⁸ | 10~105 | DPV | This work |
© 2019 by the authors. Licensee MDPI, Basel, Switzerland. This article is an open access article distributed under the terms and conditions of the Creative Commons Attribution (CC BY) license (http://creativecommons.org/licenses/by/4.0/).
Share and Cite
MDPI and ACS Style
Wu, J.; Xu, Z.; Wang, X.; Wang, L.; Qiu, H.; Lu, K.; Zhang, W.; Feng, Q.; Chen, J.; Yang, L. Cadmium-Sensitive Measurement Using a Nano-Copper-Enhanced Carbon Fiber Electrode. Sensors 2019, 19, 4901. https://doi.org/10.3390/s19224901
AMA Style
Wu J, Xu Z, Wang X, Wang L, Qiu H, Lu K, Zhang W, Feng Q, Chen J, Yang L. Cadmium-Sensitive Measurement Using a Nano-Copper-Enhanced Carbon Fiber Electrode. Sensors. 2019; 19(22):4901. https://doi.org/10.3390/s19224901
Chicago/Turabian StyleWu, Jian, Zhipeng Xu, Xian Wang, Li Wang, Huadong Qiu, Kechao Lu, Wenhong Zhang, Qing Feng, Jun Chen, and Lei Yang. 2019. "Cadmium-Sensitive Measurement Using a Nano-Copper-Enhanced Carbon Fiber Electrode" Sensors 19, no. 22: 4901. https://doi.org/10.3390/s19224901
Note that from the first issue of 2016, this journal uses article numbers instead of page numbers. See further details here.