Article

Monitoring of Carbon Dioxide Using Hollow-Core Photonic Crystal Fiber Mach–Zehnder Interferometer

1
Multi-Scale Additive Manufacturing Laboratory, Department of Mechanical and Mechatronics Engineering, University of Waterloo, Waterloo, ON N2L3G1, Canada
2
Department of Mechanical Engineering, University of Victoria, Victoria, BC V8W2Y2, Canada
3
School of Mechanical Engineering, Purdue University, West Lafayette, IN 47907, USA
*
Author to whom correspondence should be addressed.
Sensors 2019, 19(15), 3357; https://doi.org/10.3390/s19153357
Submission received: 10 July 2019 / Revised: 25 July 2019 / Accepted: 29 July 2019 / Published: 31 July 2019

Abstract

:
Monitoring of greenhouse gases is essential to understand the present state and predict the future behavior of greenhouse gas emissions. Carbon dioxide (CO2) is the greenhouse gas of most immediate concern, because of its high atmospheric concentration and long lifetime. A fiber-optic Mach–Zehnder interferometer (MZI) is proposed and demonstrated for the laboratory-scale monitoring of carbon dioxide concentration. The interferometric sensor was constructed using a small stub of hollow-core photonic crystal fiber between a lead-in and lead-out standard single mode fiber, with air-gaps at both interfaces. At room temperature and atmospheric pressure, the sensor shows the sensitivity of 4.3 pm/% CO2. The device was packaged to demonstrate the laboratory-scale leakage detection and measurement of CO2 concentration in both subsurface and aqueous environments. The experimental study of this work reveals the great potential of the fiber-optic approach for environmental monitoring of CO2.

1. Introduction

Carbon dioxide (CO2) has been identified as the primary heat-trapping gas to adversely affect our climate between 1750 and 2011 [1]. As our planet is likely to face greater future challenges, in recent years considerable carbon mitigation research has been undertaken in an effort to fight global warming caused by CO2. Deployment of carbon capture and storage (CCS) technologies have been proposed for a drastic reduction of CO2 emission [2]. As of September 2012, 75 large-scale global CCS projects (at least 400,000 tons of CO2 per year) and a number of projects under advanced stages of development have been identified by the Global CCS Institute [3]. While CCS has a vital role in controlling greenhouse gas emissions, CO2 leakage at sequestration sites is the primary concern because of its adverse environmental impacts [4,5]. Research models predict that in an event of leakage, CO2 escape rate above 0.1% may jeopardize the effectiveness of a geological storage site [6]. Hence, early detection of CO2 leakage is essential to re-establish the efficiency of a CCS operation and minimize its ecological damages. Monitoring of CO2 leakage has been investigated using diverse approaches including seismic [7], geoelectrical [8], geochemical [9], gravimetric [10], temperature logs [11], and soil gas composition [12]. There are many challenges inherent to monitoring a CCS project, most notably: prolonged periods (i.e., several decades), long transmission lengths, extreme physical and chemical conditions, and capital and operating costs. Most of the techniques mentioned above have a low sensing resolution or do not meet the challenges associated with monitoring CCS projects.
Fiber optic sensors have unique properties that make them ideal for CCS site monitoring, for example: compact size; immunity to electromagnetic radiation; superior aging characteristics; long-haul monitoring capabilities; and, the ability for high-resolution CO2 detection. Fiber optic sensors are very efficient in gas detection and monitoring applications [13,14,15] as compared to conventional sensors. Various fiber-optic sensor configurations have been exploited for monitoring CO2 concentration, including long period grating [16], Bragg grating [17], evanescent filed [18], and fluorescent based [19,20]. Fiber fluorescence sensor has also been employed to demonstrate monitoring of environmental CO2 [21]. Use of fluorescent dyes, nanoparticle coatings, or extensive etching of the fibers in the reported studies are likely to affect the aging behavior and robustness of the sensors. There has been a constant effort to develop highly sensitive all-fiber sensors using suitable fiber type and device configuration [13,14,22]. The evanescent field in the cladding air holes of photonic crystal fibers reveals new opportunities to exploit light interaction with gasses for sensing applications [23,24]. Hollow-core photonic crystal fibers (HC-PCFs) have air holes running along the fiber propagation axis in both the core and cladding regions. These structures have been introduced to improve the light interaction with the sample gas leading to superior sensitivity [25,26]. Various mechanisms have been explored for HC-PCF-based gas sensing, including tunable modal interference [27], Fabry–Pérot interference [28], photothermal phase modulation [29], surface-enhanced Raman scattering [30], and a gas absorption spectroscopy [25,31]. However, these sensing devices require an extended length of HC-PCF, drilling side micro-holes on HC-PCF, or filling the air holes of HC-PCF with a Raman scattering substrate such as nanoparticle colloids. The reported fiber-optic gas sensors to date either display insufficient sensitivity/reliability or require complex fabrication and/or packaging processes.
In this study, a HC-PCF-based Mach–Zehnder interferometer (MZI) is proposed for the detection and measurement of CO2 concentration in subsurface soil and aqueous environments. As shown in Figure 1, the device was fabricated by placing a small stub of HC-PCF between a lead-in and lead-out standard single mode fiber (SMF) with air gaps at both interfaces. The air holes in HC-PCF provides a large area of interaction with the gas leading to high-sensitive detection and measurement of CO2.

2. Working Principle

The schematic of the sensor configuration is shown in Figure 2. It is a common MZI structure where the fringe pattern appears at the transmission end because of interference between the core mode and dominant cladding mode. The transmission fringe of a fiber-optic MZI can be expressed as [32,33]:
I = I c o r e + I c l a d + 2 I c o r e I c l a d cos ϕ ,
where I c o r e   and I c l a d are the intensities of light in the core and cladding, respectively. The phase difference between core and cladding mode can be expressed as ϕ = 2 π Δ n e f f L / λ , where n e f f is the difference of effective refractive indices between core and cladding modes, L is the length of the MZI, and λ is the wavelength. For ϕ = ( 2 m + 1 ) π in Equation (1), the mth order attenuation peak is maximum and its associated wavelength can be expressed as λ m = 2 Δ n e f f L / ( 2 m + 1 ) . Therefore, any change in Δ n e f f or L due to an ambient refractive index or temperature variation results in a shift of attenuation peak. Such spectral shifts can be utilized to measure the ambient gas concentration.

3. Sensor Fabrication and Packaging

As shown in Figure 1, SMF (SMF-28, ThorLabs, Newton, NJ, USA) and HC-PCF (HC-1500, NKT Photonics, Birkerød, Denmark) were used to fabricate the sensor. The core diameter, cladding pitch, diameter of PCF region, and cladding diameter of the HC-PCF were 10 ± 1 µm, 3.8 ± 0.1 µm, 70 ± 5 µm, and 120 ± 2 µm, respectively. The design wavelength and numerical aperture of the HC-PCF were 1550 nm and ~0.2, respectively. The small stub of HC-PCF (4.30 mm) was placed between a lead-in and lead-out SMFs with suitable air gaps (air gap 1:2.24 mm and air gap 2:1.83 mm in Figure 2) at both interfaces. The fiber assembly was first aligned and fixed on V-groove of a glass slide (25 × 5 × 1 mm) using a waterproof adhesive. Suitable packaging of a fiber-optic sensor is crucial for its reliable sensing operation and longer life span. Therefore, the device was packaged to make it operational in the subsurface and aqueous environment. Figure 3a,b show the schematic of the packaged configuration, and the steps involved in packaging the sensor, respectively. The glass slide holding the fiber assembly was first secured in a stainless steel mesh tube to provide mechanical strength to the fiber assembly and allow easy handling of the device. The sensor was then wrapped with two water-impermeable membranes that allow gas flow in the chamber. The scanning electron microscope (SEM) images shown in Figure 4 reveal the morphologies of both front and rear surfaces of the inner (TRAKETCH, Sabeu GmbH & Co. KG, Northeim, Germany) and outer (SQ-S GASKET SHEET, Inertech Inc., Monterey Park, CA, USA) membranes. Figure 4a–c shows the front, rear, and magnified images of TRAKETCH membrane capturing both surfaces, respectively. The capillary pores (pore size: 1.37 ± 0.02 µm, pore density: ~13.7 × 10⁶/cm2, thickness: 170 ± 20 µm, water entry pressure ≥0.6 bar) of this micro filtration membrane work as hydrophobic surface and allow CO2 gas flow. Figure 4d–f shows the front, rear, and magnified surfaces of the INERTEX SQ-S membrane. The gasket sheet is made of polytetrafluoroethylene (PTFE) that can operate in full vacuum to 200 bar pressure, and it does not support any bacterial growth. The two membranes were assembled to achieve a good balance of CO2 permeability and water resistance. To protect the device from dirt and dripping water, it was finally wrapped with Tyvek, a commercially-available building water-insulation membrane.

4. Results and Discussion

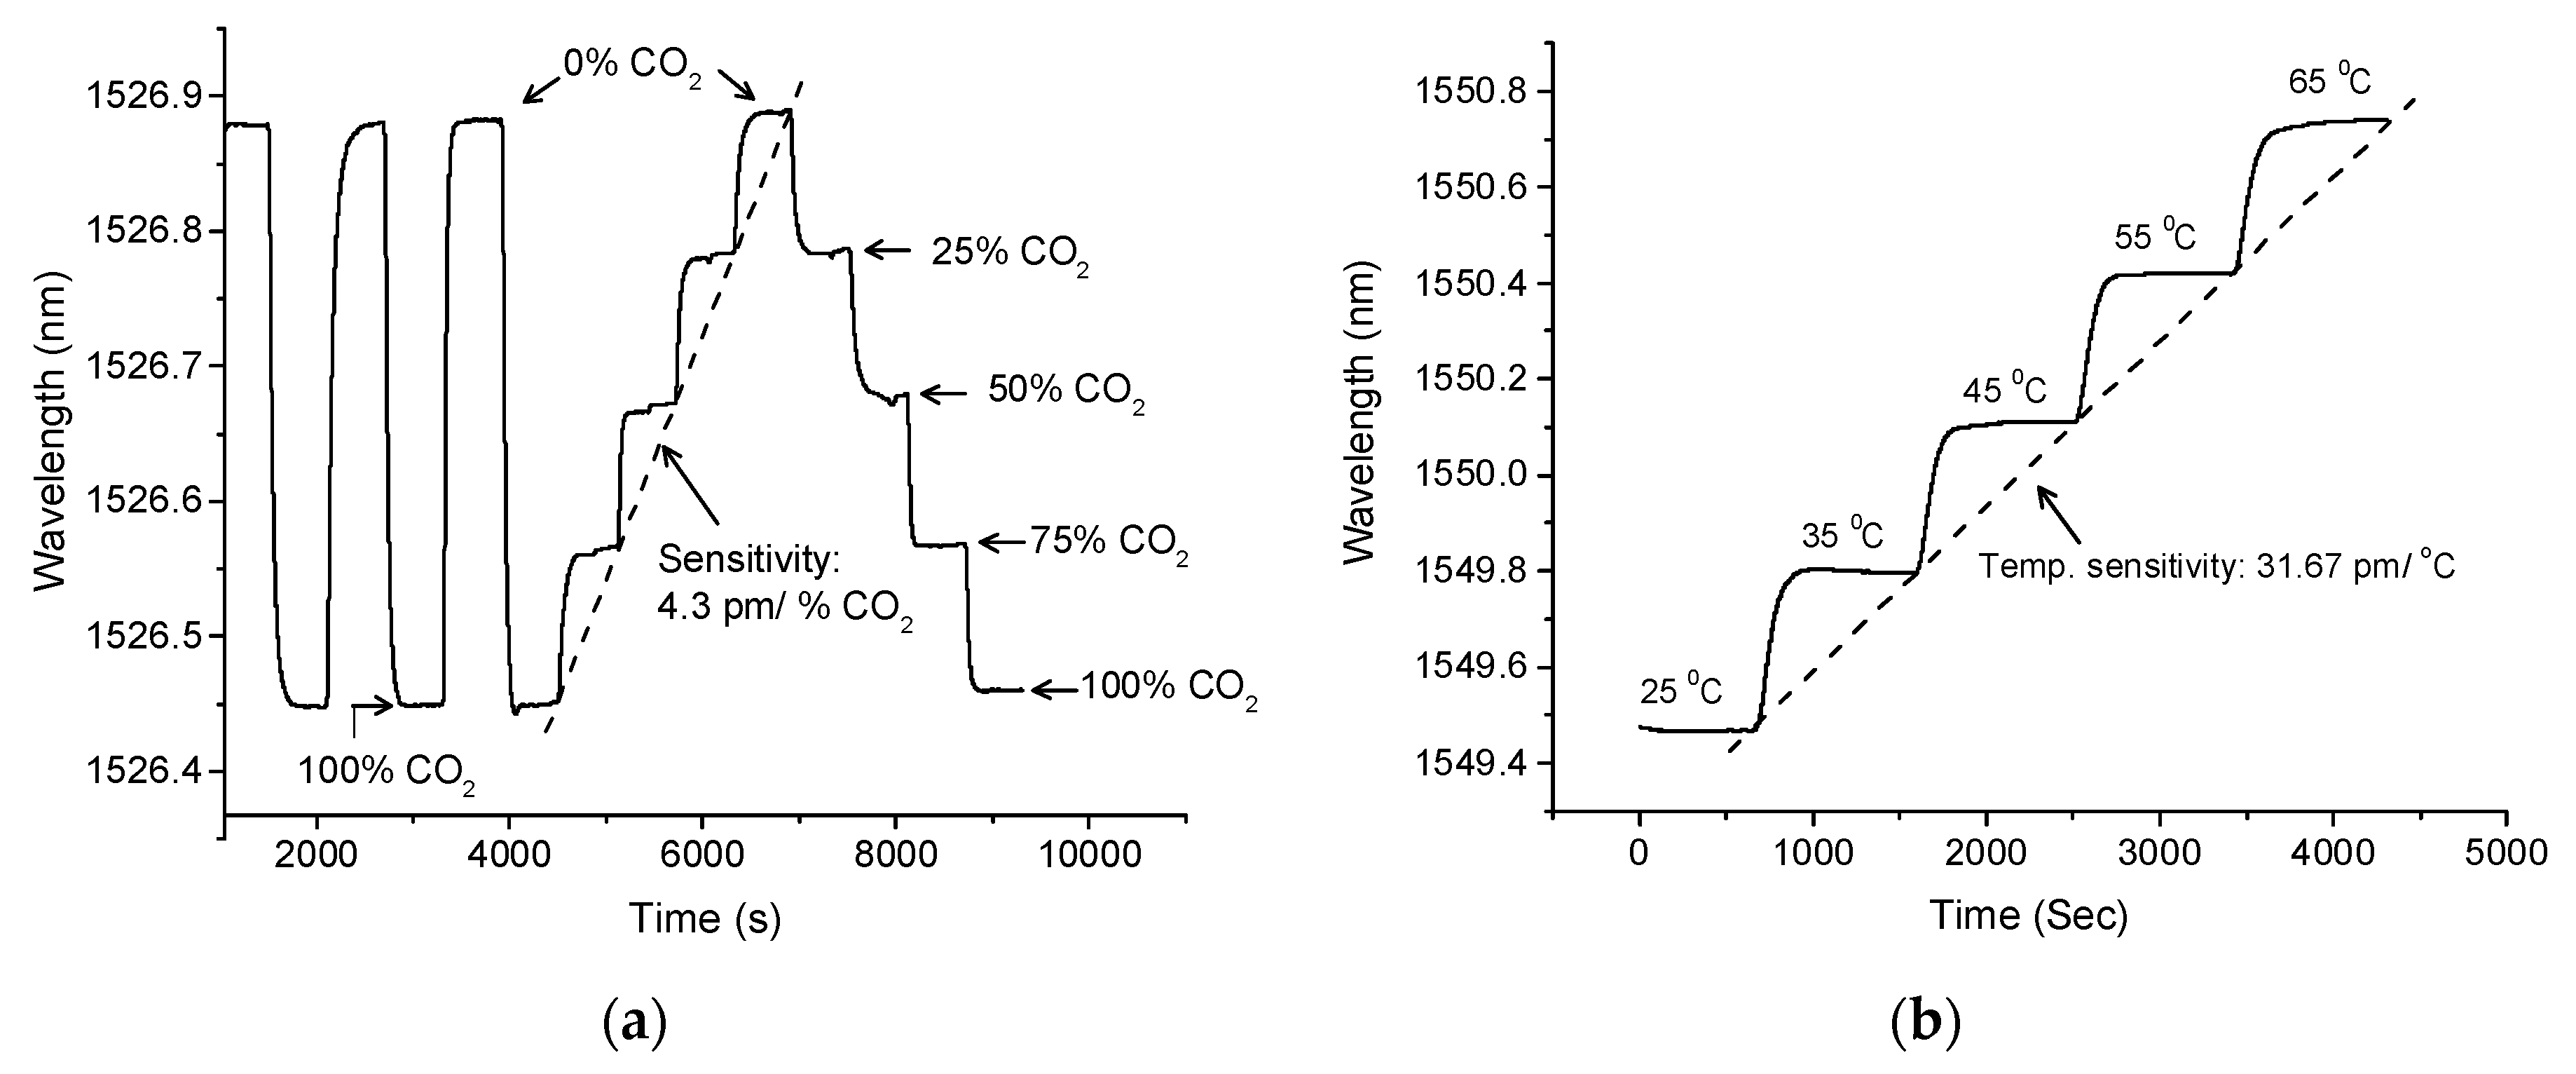
4.1. Sensor Characterization

The schematic shown in Figure 5 was used to characterize CO2 concentration in near atmospheric pressure. The dimension of the test chamber used in this experiment was 14.5 × 11.2 × 4.4 cm. The sensor was interrogated with different known concentrations (25%, 50%, 75%, and 100%) of CO2 gases. A 99.99% pure nitrogen (N2) was used as a reference gas and the discharge tube with a bubbler was used to keep near atmospheric pressure in the test chamber. A circulator was used to connect the MZI sensor to the micron optics interrogator (SM125). The chamber was also equipped with a fiber Bragg grating (FBG) to monitor any temperature variation during the experiments. As shown in Figure 6a, the sensor shows a consistent trend of shifts as it is subjected to different concentration of CO2 gas. As calculated from the slope of Figure 6a, the sensor has a sensitivity of 4.33 pm/% CO2. Considering the sensitivity of the sensor and wavelength stability of the interrogator (1 pm), it exhibits a measurement resolution of ~0.2% CO2, which is 10 times better compared to a recently-reported all-optical sensor constructed using HC-PCF [34]. Figure 6b shows the sensor response to the ambient temperature change in the range of 25 to 65 °C. The sensor shows a linear spectral shift with temperature change with a sensitivity of 31.67 pm/°C.
Reliable operation is essential in any sensing application. Hence, repeatable sensing capability is crucial in particular for effective gas monitoring applications. To examine the sensing reliability of the device, a cyclic test was performed for four different known concentration of CO2 gasses such as 25% CO2, 50% CO2, 75% CO2, and 100% CO2, as shown in Figure 7. Nitrogen was used as a reference gas for this test. The cyclic test started with injecting atmospheric N2 gas into the test chamber for 10 min. Once the injection of N2 stopped, the 25% CO2 gas was injected into the chamber for 10 min. This two-step process was repeated two more times to finish the cyclic test for 25% CO2. For the higher concentration of CO2 gases, the same two-step process was repeated three times. An FBG sensor with a temperature sensitivity of 10 pm/°C was placed in the test chamber to monitor any temperature change during this experiment. The sensor shows good repeatability in the measurement of CO2 concentration. A maximum of 40 pm spectral deviation was observed for the entire experiment as shown in Figure 7, which is largely because of temperature change in the chamber. The FBG shows 1 °C increase of temperature (that corresponds to 10 pm FBG spectral shift) in the test chamber by the end of the experiment. Since the temperature sensitivity of the proposed MZI sensor (31.67 pm/°C) is about three times more than that of FBG (10 pm/°C), ~32 pm spectral shift appeared due to 1 °C temperature raise in the test chamber. The remaining 8 pm spectral shift may appear due to a pressure change in the chamber or measurement errors. The sensor showed good measurement repeatability, as shown in Figure 7.
Response and recovery times are widely used to characterize gas sensors, which are essentially the times taken by a sensor to reach 90% of final and initial indications, respectively. For the given test chamber, Figure 8 reports the response and recover times for four different concentration of CO2 gases. The response times of the sensor for 25%, 50%, 75%, and 100% CO2 are 64, 76, 88, and 111 s, respectively. The recovery times of the sensor for 25%, 50%, 75%, and 100% CO2 are 69, 83, 95, and 118 s, respectively. Since the sensor sits on the floor of the test chamber and the CO2 gases used in this experiment are heavier than the reference gas (N2), response times are shorter than the recovery times. The main limiting factor for both response and recovery times is the delivery of gasses to the air gaps and air holes. Therefore, both the response and recovery times can be improved by reducing the volume of the test chamber.

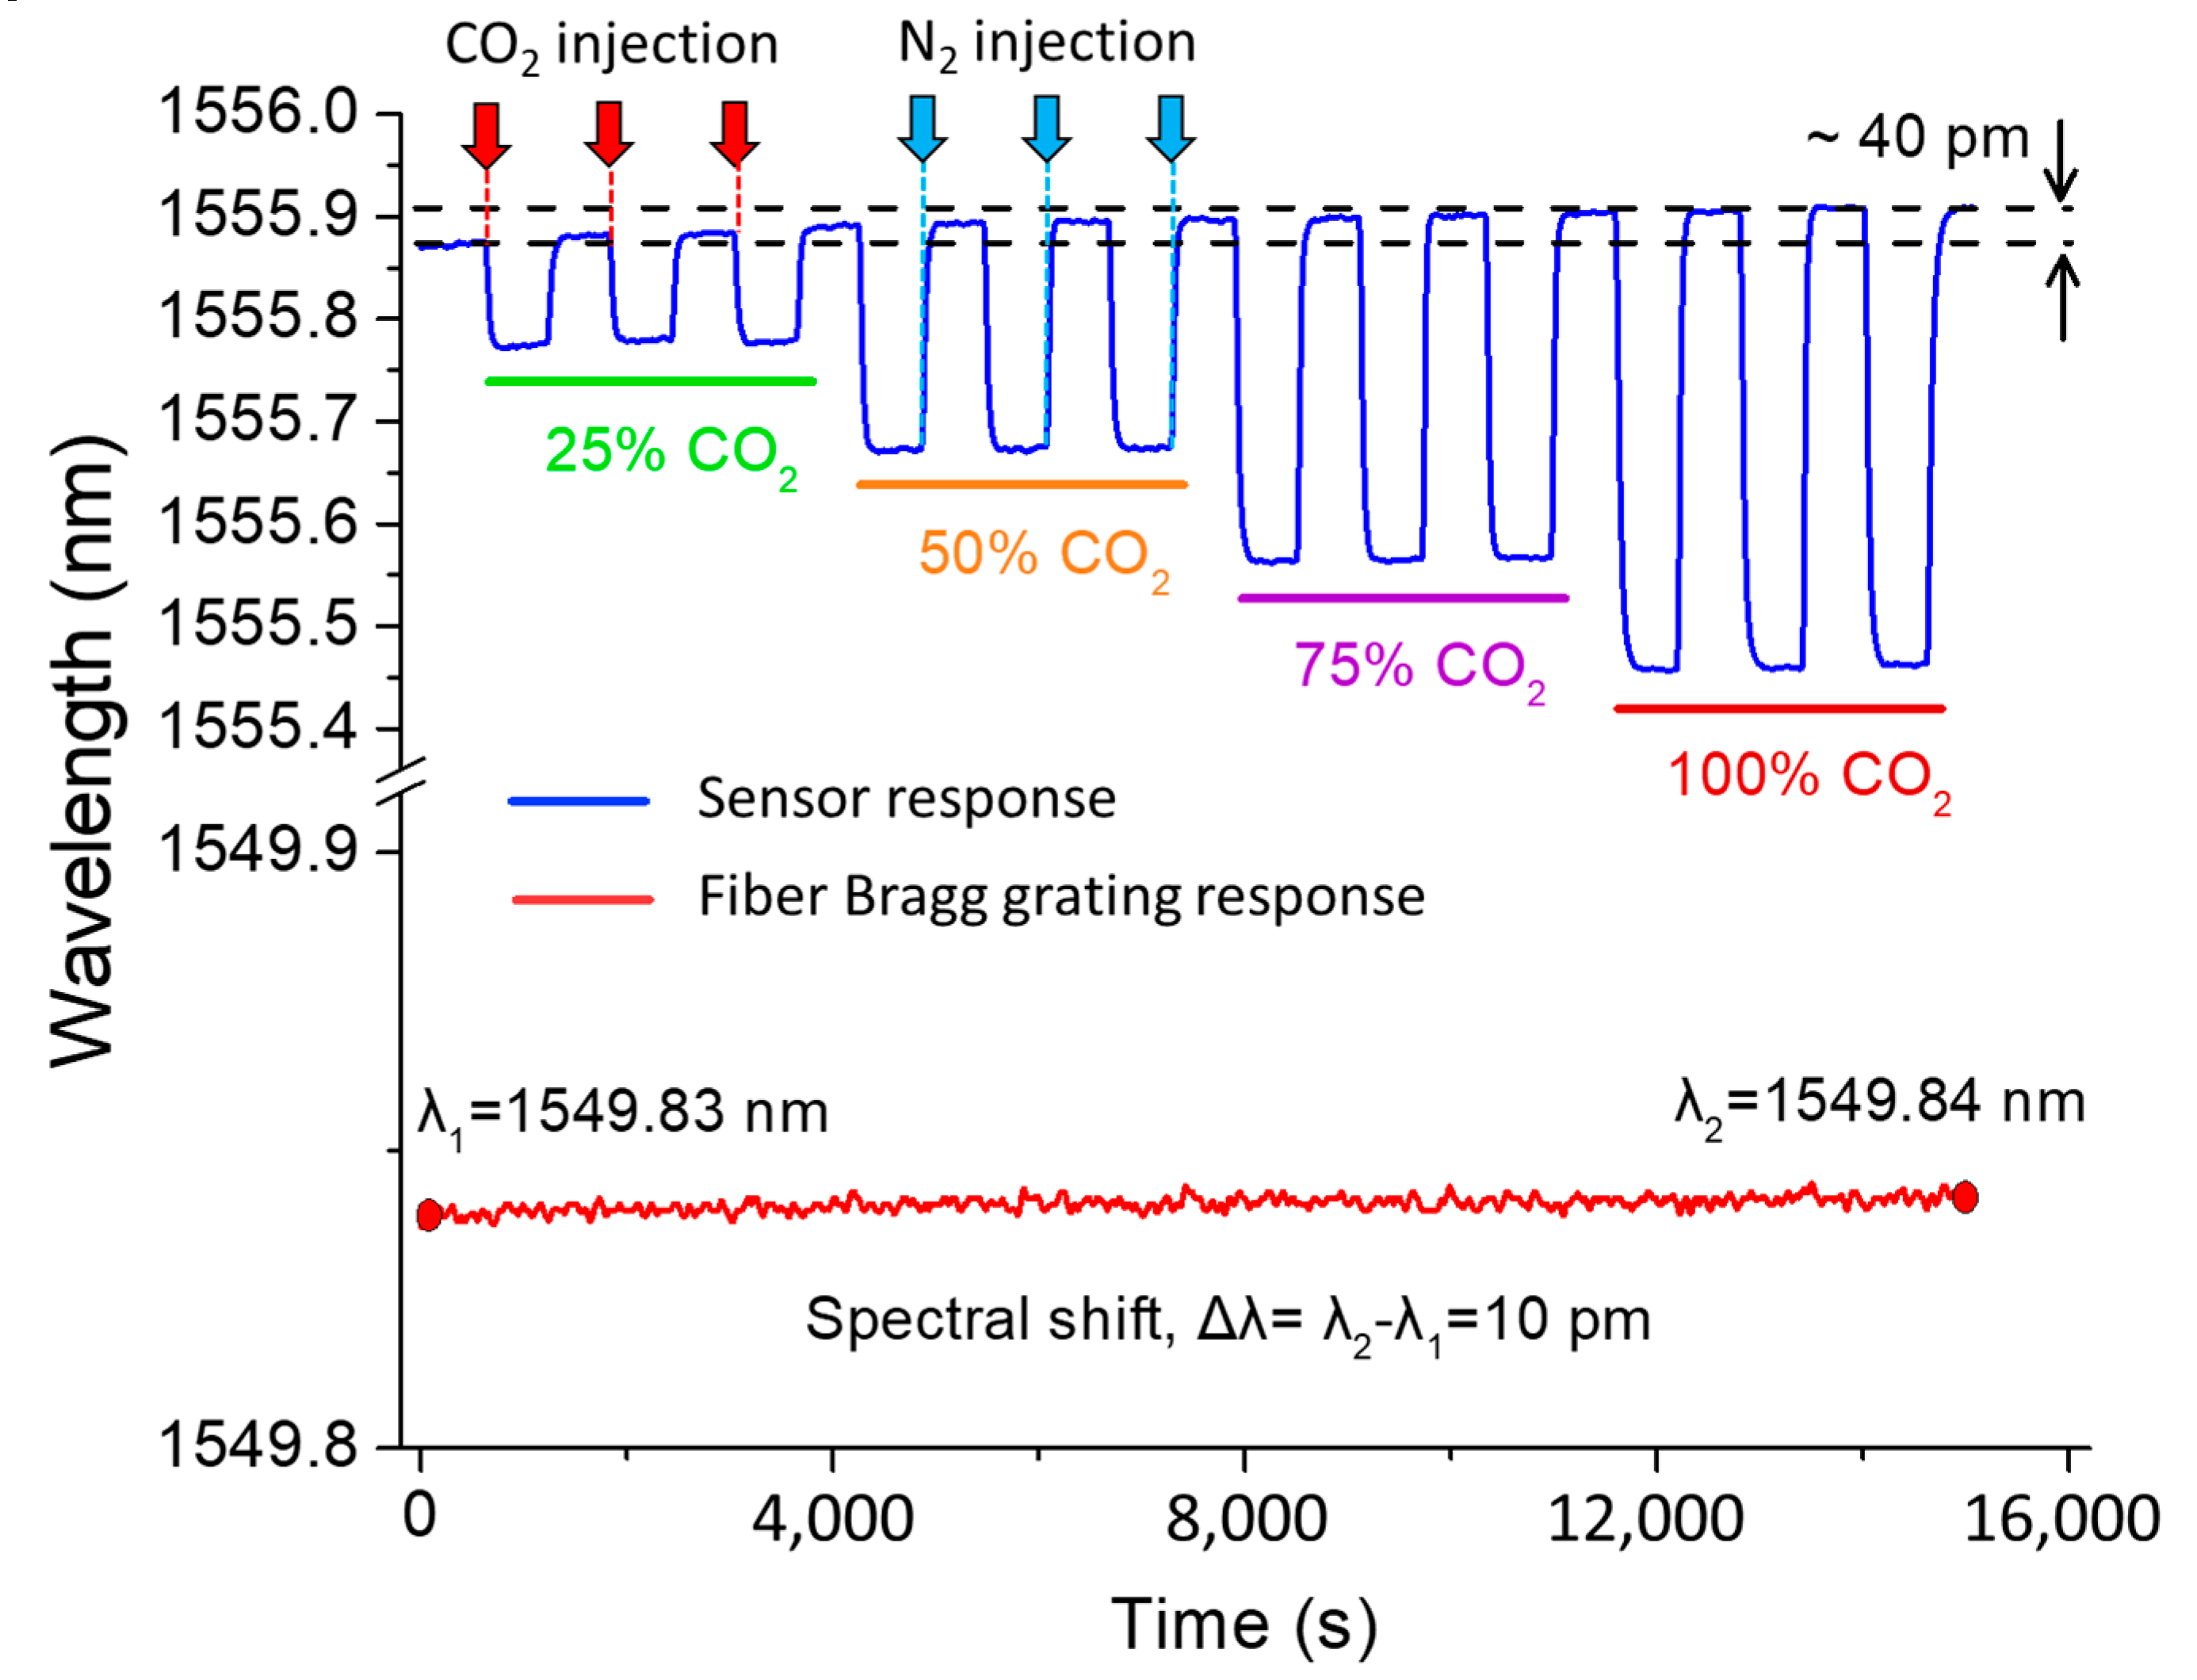
4.2. Subsurface CO2 Measurement

The sensor was tested to measure CO2 concentration in soil column in room temperature and atmospheric pressure. As shown in the schematic of Figure 9a, the sensor was buried 20 cm under the 50 cm-deep soil column. The radius and height of the cylindrical soil column are 30 and 60 cm, respectively. The CO2 and N2 were injected into the soil column from the bottom. The transmission spectrum of the interferometer was first monitored for 10 min in the air, followed by injection of N2 for next 10 min, as shown in Figure 9b. The 100% CO2 was then injected into the soil column for 10 min followed by injecting reference N2 gas for another 10 min. The percentage of CO2 injection was then gradually increased up to 100% as shown in Figure 9b. A reverse trend was then followed to return the sensor spectrum to the initial level. The 100% CO2 gas was then injected for 10 min for the last time followed by injection of the reference gas. The purpose of this test was to understand the response of the sensor in the sub-surface environment. With a larger surface area of the soil column exposed to the atmosphere and increased volume of sensing environment, the sensor shows longer response and recovery times (with reference to Figure 6a). At the end of the experiment, the overall spectrum also followed a red shift, which may be attributed to the rise in temperature as also noticed in Figure 7.

4.3. Aqueous CO2 Measurement

Figure 10a shows the experimental setup for the measurement of CO2 concentration in an aqueous environment. To investigate the performance of water-resistant membranes used packaging, the sensor was first immersed in water for 24 h and its transmission spectrum was saved for every 12 h. As shown in Figure 10b, the spectrum of the sensor did not show any significant degradation over the period of 24 h, except small spectral shift which is likely due to temperature change during the experiment.
A funnel was used for guiding the CO2 bubbles to the sensor vicinity that helps the diffusion of gas into the packaged sensor. The response of the sensor to CO2 concentration changes in the aqueous environment is shown in Figure 11a. Each of the 25%, 50%, 75%, and 100% CO2 gases were successively injected for 30 min. The sensor shows spectral blue shifts with a gradual increase in CO2 concentration. Unlike the experiments in test chamber or soil column, the sensor showed irregular spectral shifts, which may appear due to the turbulence created by the CO2 bubbles. Once immersed in the water, the ambient humidity was considered stable during the experiment. Detailed effects of humidity in the aqueous environment will be conducted in the future, which may also explain the anomalies in the spectral shift during the experiment. After injecting 100% CO2 for 30 min, the injection was stopped to let CO2 gradually diffuse out of the packaged sensor. As shown in Figure 11b, diffusion of CO2 out of the packaged sensor is very slow. An injection of reference gas to the sensing chamber may significantly improve the recovery time for such monitoring applications.

5. Conclusions

In this study, an HC-PCF-based MZI is introduced that can measure ambient CO2 concentration for environmental monitoring applications. The device was constructed by placing a stub of HC-PCF between a lead-in and lead-out SMF. The sensor was packaged and characterized for known concentrations of CO2 gases. At room temperature and atmospheric pressure, the sensor shows a linear response to CO2 concentration with the sensitivity of 4.3 pm/% CO2. Considering the measurement device used in this study had a wavelength stability of 1 pm, the resolution of the sensor is ~0.2% CO2. For the test chamber dimension of 14.5 × 11.2 × 4.4 cm, the sensor shows fast response and recovery times of 64 and 69 s, respectively. Water-resistant but gas-permeable membranes were used to package the sensor. The sensing device demonstrated the laboratory-scale leakage detection and measurement of CO2 concentration in both subsurface and aqueous environments. The sensor showed a stable and reliable measurement of CO2 concentrations with a considerably short response and recovery times. The experimental study of this work reveals the potential of the fiber-optic approach for environmental monitoring of CO2 leakage and concentration.

Author Contributions

F.A. proposed the idea and designed the set of experiments; F.A., V.A. and K.N. performed the experiments; F.A., V.A., K.N. and E.M. analyzed the experimental results, F.A. wrote the original draft of the manuscript; F.A., E.M., C.B., E.T. and M.B.G.J. reviewed the manuscript; M.B.G.J., E.T. and C.B. supervised the project.

Funding

This research received no external funding.

Acknowledgments

The authors acknowledge the support of the Natural Sciences and Engineering Research Council of Canada, and Korea Carbon Capture and Sequestration Research and Development Center for this work.

Conflicts of Interest

The authors declare no conflicts of interest.

References

  1. Ciais, P.; Sabine, C.; Bala, G.; Bopp, L.; Brovkin, V.; Canadell, J.; Chhabra, A.; DeFries, R.; Galloway, J.; Heimann, M.; et al. The physical science basis. Contribution of working group I to the fifth assessment report of the intergovernmental panel on climate change. Chang. IPCC Clim. 2013, 465–570. [Google Scholar] [CrossRef]
  2. Cuéllar-Franca, R.M.; Azapagic, A. Carbon capture, storage and utilisation technologies: A critical analysis and comparison of their life cycle environmental impacts. J. CO2 Util. 2015, 9, 82–102. [Google Scholar] [CrossRef]
  3. GCCSI. The Global Status of CCS: 2012; GCCSI: Canberra, Australia, 2012; ISBN 9780987186317. [Google Scholar]
  4. Smith, K.L.; Steven, M.D.; Jones, D.G.; West, J.M.; Coombs, P.; Green, K.A.; Barlow, T.S.; Breward, N.; Gwosdz, S.; Krüger, M.; et al. Environmental impacts of CO2 leakage: Recent results from the ASGARD facility, UK. Energy Procedia 2013, 37, 791–799. [Google Scholar] [CrossRef]
  5. Zhao, X.; Deng, H.; Wang, W.; Han, F.; Li, C.; Zhang, H.; Dai, Z. Impact of naturally leaking carbon dioxide on soil properties and ecosystems in the Qinghai-Tibet plateau. Sci. Rep. 2017, 7, 1–11. [Google Scholar] [CrossRef] [PubMed]
  6. Leung, D.Y.C.; Caramanna, G.; Maroto-Valer, M.M. An overview of current status of carbon dioxide capture and storage technologies. Renew. Sustain. Energy Rev. 2014, 39, 426–443. [Google Scholar] [CrossRef] [Green Version]
  7. Arts, R.; Eiken, O.; Chadwick, A.; Zweigel, P.; van der Meer, L.; Zinszner, B. Monitoring of CO2 injected at Sleipner using time-lapse seismic data. Energy 2004, 29, 1383–1392. [Google Scholar] [CrossRef]
  8. Kiessling, D.; Schmidt-Hattenberger, C.; Schuett, H.; Schilling, F.; Krueger, K.; Schoebel, B.; Danckwardt, E.; Kummerow, J. Geoelectrical methods for monitoring geological CO2 storage: First results from cross-hole and surface-downhole measurements from the CO2SINK test site at Ketzin (Germany). Int. J. Greenh. Gas Control 2010, 4, 816–826. [Google Scholar] [CrossRef]
  9. Riding, J.B.; Rochelle, C.A. The IEA Weyburn CO2 Monitoring and Storage Project-Final Report of the European Research Team; British Geological Survey: Nottingham, UK, 2005; pp. 2075–2078. [Google Scholar] [CrossRef]
  10. Gerstenberger, M.; Nicol, A.; Stenhouse, M.; Allinson, G.; Berryman, K.; Doody, B.; Ho, M.; McCurdy, M.; Neal, P.; Stirling, M.; et al. Opportunities for Underground Geological Storage of CO2 in New Zealand-Report CCS-08/10- Risk Assessment Methodologies; GNS Science Report: Lower Hutt, New Zealand, 2009; ISBN 9780478197273. [Google Scholar]
  11. Bielinski, A.; Kopp, A.; Schütt, H.; Class, H. Monitoring of CO2 plumes during storage in geological formations using temperature signals: Numerical investigation. Int. J. Greenh. Gas Control 2008, 2, 319–328. [Google Scholar] [CrossRef]
  12. Jenkins, C.R.; Cook, P.J.; Ennis-King, J.; Undershultz, J.; Boreham, C.; Dance, T.; de Caritat, P.; Etheridge, D.M.; Freifeld, B.M.; Hortle, A.; et al. Safe storage and effective monitoring of CO2 in depleted gas fields. Proc. Natl. Acad. Sci. USA 2012, 109, E35–E41. [Google Scholar] [CrossRef]
  13. Lee, B. Review of the present status of optical fiber sensors. Opt. Fiber Technol. 2003, 9, 57–79. [Google Scholar] [CrossRef]
  14. Udd, E. An overview of fiber-optic sensors. Rev. Sci. Instrum. 1995, 66, 4015–4030. [Google Scholar] [CrossRef]
  15. Kersey, A.D. A review of recent developments in fiber optic sensor technology. Opt. Fiber Technol. 1996, 2, 291–317. [Google Scholar] [CrossRef]
  16. Hromadka, J.; Tokay, B.; Correia, R.; Morgan, S.P.; Korposh, S. Carbon dioxide measurements using long period grating optical fibre sensor coated with metal organic framework HKUST-1. Sens. Actuators B Chem. 2018, 255, 2483–2494. [Google Scholar] [CrossRef]
  17. Shivananju, B.N.; Yamdagni, S.; Fazuldeen, R.; Sarin Kumar, A.K.; Hegde, G.M.; Varma, M.M.; Asokan, S. CO2 sensing at room temperature using carbon nanotubes coated core fiber Bragg grating. Rev. Sci. Instrum. 2013, 84, 065002. [Google Scholar] [CrossRef]
  18. Chong, X.; Kim, K.J.; Ohodnicki, P.R.; Li, E.; Chang, C.H.; Wang, A.X. Ultrashort Near-Infrared Fiber-Optic Sensors for Carbon Dioxide Detection. IEEE Sens. J. 2015, 15, 5327–5332. [Google Scholar] [CrossRef]
  19. Wolfbeis, O.S.; Weis, L.J.; Ziegler, W.E.; Leiner, M.J.P. Fiber-Optic Fluorosensor for Oxygen and Carbon Dioxide. Anal. Chem. 1988, 60, 2028–2030. [Google Scholar] [CrossRef]
  20. Chu, C.-S.; Lo, Y.-L.; Sung, T.-W. Review on recent developments of fluorescent oxygen and carbon dioxide optical fiber sensors. Photonic Sens. 2011, 1, 234–250. [Google Scholar] [CrossRef] [Green Version]
  21. Wolfbeis, O.S.; Kovacs, B.; Goswami, K.; Klainer, S.M. Fiber-optic fluorescence carbon dioxide sensor for environmental monitoring. Mikrochim. Acta 1998, 129, 181–188. [Google Scholar] [CrossRef]
  22. Lee, B.H.; Kim, Y.H.; Park, K.S.; Eom, J.B.; Kim, M.J.; Rho, B.S.; Choi, H.Y. Interferometric fiber optic sensors. Sensors 2012, 12, 2467–2486. [Google Scholar] [CrossRef]
  23. Villatoro, J.; Kreuzer, M.P.; Jha, R.; Minkovich, V.P.; Finazzi, V.; Badenes, G.; Pruneri, V. Photonic crystal fiber interferometer for chemical vapor detection with high sensitivity. Opt. Express 2009, 17, 1447. [Google Scholar] [CrossRef]
  24. Hoo, Y.L.; Jin, W.; Shi, C.; Ho, H.L.; Wang, D.N.; Ruan, S.C. Design and Modeling of a Photonic Crystal Fiber Gas Sensor. Appl. Opt. 2003, 42, 3509. [Google Scholar] [CrossRef] [PubMed]
  25. Ritari, T.; Tuominen, J.; Ludvigsen, H.; Petersen, J.C.; Sørensen, T.; Hansen, T.P.; Simonsen, H.R. Gas sensing using air-guiding photonic bandgap fibers. Opt. Express 2004, 12, 4080. [Google Scholar] [CrossRef] [PubMed]
  26. Hoo, Y.L.; Jin, W.; Ho, H.L.; Ju, J.; Wang, D.N. Gas diffusion measurement using hollow-core photonic bandgap fiber. Sens. Actuators B Chem. 2005, 105, 183–186. [Google Scholar] [CrossRef]
  27. Yang, F.; Jin, W.; Cao, Y.; Ho, H.L.; Wang, Y. Towards high sensitivity gas detection with hollow-core photonic bandgap fibers. Opt. Express 2014, 22, 24894. [Google Scholar] [CrossRef] [PubMed]
  28. Yang, F.; Tan, Y.; Jin, W.; Lin, Y.; Qi, Y.; Ho, H.L. Hollow-core fiber Fabry–Perot photothermal gas sensor. Opt. Lett. 2016, 41, 3025. [Google Scholar] [CrossRef]
  29. Lin, Y.; Jin, W.; Yang, F.; Tan, Y.; Ho, H.L. Performance optimization of hollow-core fiber photothermal gas sensors. Opt. Lett. 2017, 42, 4712. [Google Scholar] [CrossRef] [PubMed]
  30. Yang, X.; Shi, C.; Wheeler, D.; Newhouse, R.; Chen, B.; Zhang, J.Z.; Gu, C. High-sensitivity molecular sensing using hollow-core photonic crystal fiber and surface-enhanced Raman scattering. J. Opt. Soc. Am. A Opt. Image Sci. Vis. 2010, 27, 977–984. [Google Scholar] [CrossRef]
  31. Cubillas, A.M.; Silva-Lopez, M.; Lazaro, J.M.; Conde, O.M.; Petrovich, M.N.; Lopez-Higuera, J.M. Methane detection at 1670-nm band using a hollow-core photonic bandgap fiber and a multiline algorithm. Opt. Express 2007, 15, 17570–17576. [Google Scholar] [CrossRef]
  32. Ahmed, F.; Ahsani, V.; Melo, L.; Wild, P.; Jun, M.B.G. Miniaturized Tapered Photonic Crystal Fiber Mach–Zehnder Interferometer for Enhanced Refractive Index Sensing. IEEE Sens. J. 2016, 16, 8761–8766. [Google Scholar] [CrossRef]
  33. Li, L.; Xia, L.; Xie, Z.; Liu, D. All-fiber Mach–Zehnder interferometers for sensing applications. Opt. Express 2012, 20, 11109–11120. [Google Scholar] [CrossRef]
  34. Quintero, S.M.M.; Valente, L.C.G.; de Paula Gomes, M.S.; da Silva, H.G.; de Souza, B.C.; Morikawa, S.R.K. All-fiber CO2 sensor using hollow core PCF operating in the 2 µm region. Sensors 2018, 18, 4393. [Google Scholar] [CrossRef] [PubMed]
Figure 1. Schematic of the Mach–Zehnder interferometer (MZI) constructed using a small stub of hollow-core photonic crystal fiber (HC-PCF).
Sensors 19 03357 g001
Figure 2. Working principle based on geometric light propagation in the fiber assembly.
Sensors 19 03357 g002
Figure 3. (a) Schematic of packaging, and (b) sensor packaging.
Sensors 19 03357 g003
Figure 4. SEM images of the two membranes used in packaging of the sensor to make it waterproof: (a) Front surface of the inner membrane, (b) rear surface of the inner membrane, (c) magnified image of the inner membrane showing both fibers and micro-holes on two surfaces, (d) front surface of the outer membrane, (e) rear surface of the outer membrane, and (f) the magnified image if the outer membrane.
Sensors 19 03357 g004
Figure 5. Experimental schematic for sensor characterization and interrogation.
Sensors 19 03357 g005
Figure 6. The response of the sensor to (a) CO2 concentration, and (b) temperature change.
Sensors 19 03357 g006
Figure 7. Cyclic test to examine the measurement reliability of the gas sensor.
Sensors 19 03357 g007
Figure 8. Response and recovery times of the sensor for different concentration of CO2 gases.
Sensors 19 03357 g008
Figure 9. (a) Laboratory setup for CO2 concentration measurement in soil, and (b) measurement of CO2 concentrations in soil (at atmospheric pressure and room temperature).
Sensors 19 03357 g009
Figure 10. (a) Setup for CO2 concentration measurement in an aqueous environment, and (b) spectral stability in water for 24 h.
Sensors 19 03357 g010
Figure 11. (a) The response of the sensor to different concentrations of CO2 in water, and (b) tracking slow diffusion of CO2 gas when injection stopped.
Sensors 19 03357 g011

