Neurophysiological Characterization of a Non-Human Primate Model of Traumatic Spinal Cord Injury Utilizing Fine-Wire EMG Electrodes

 ,
,
Abstract
:1. Introduction
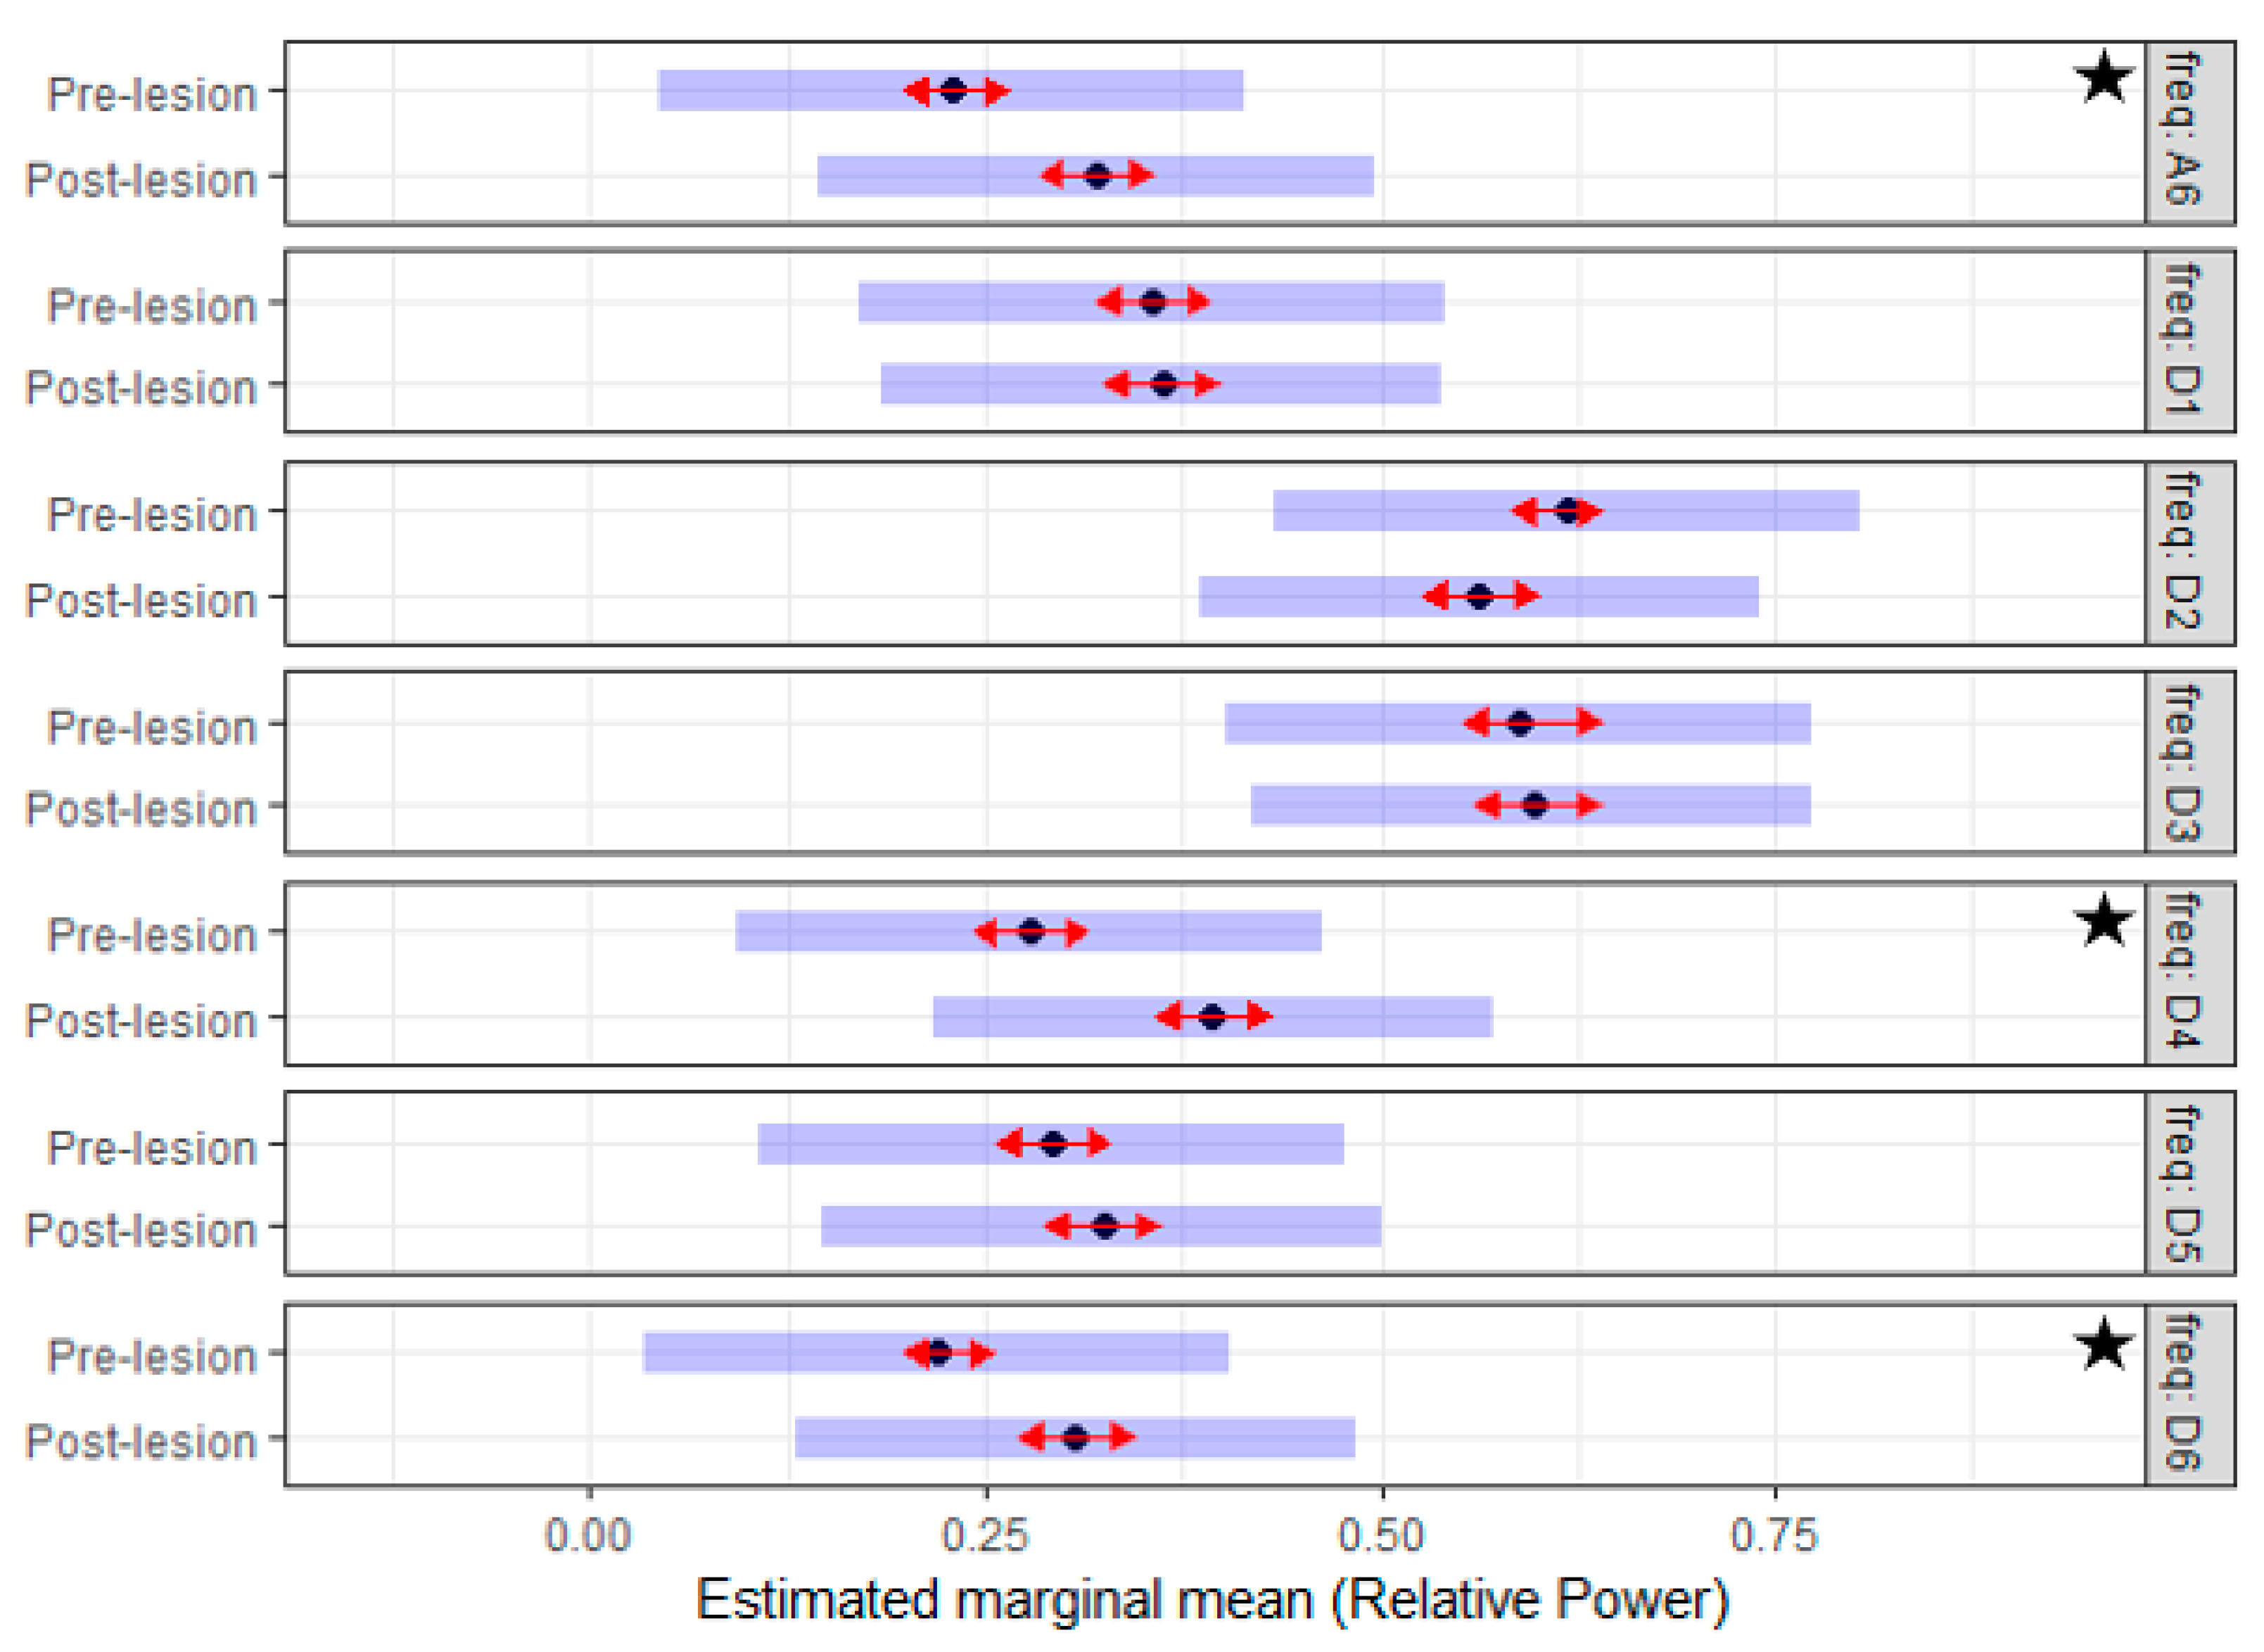
- Is the intramuscular fine-wire electrode pair data capable of detecting limb dominance in the subjects prior to lesion?
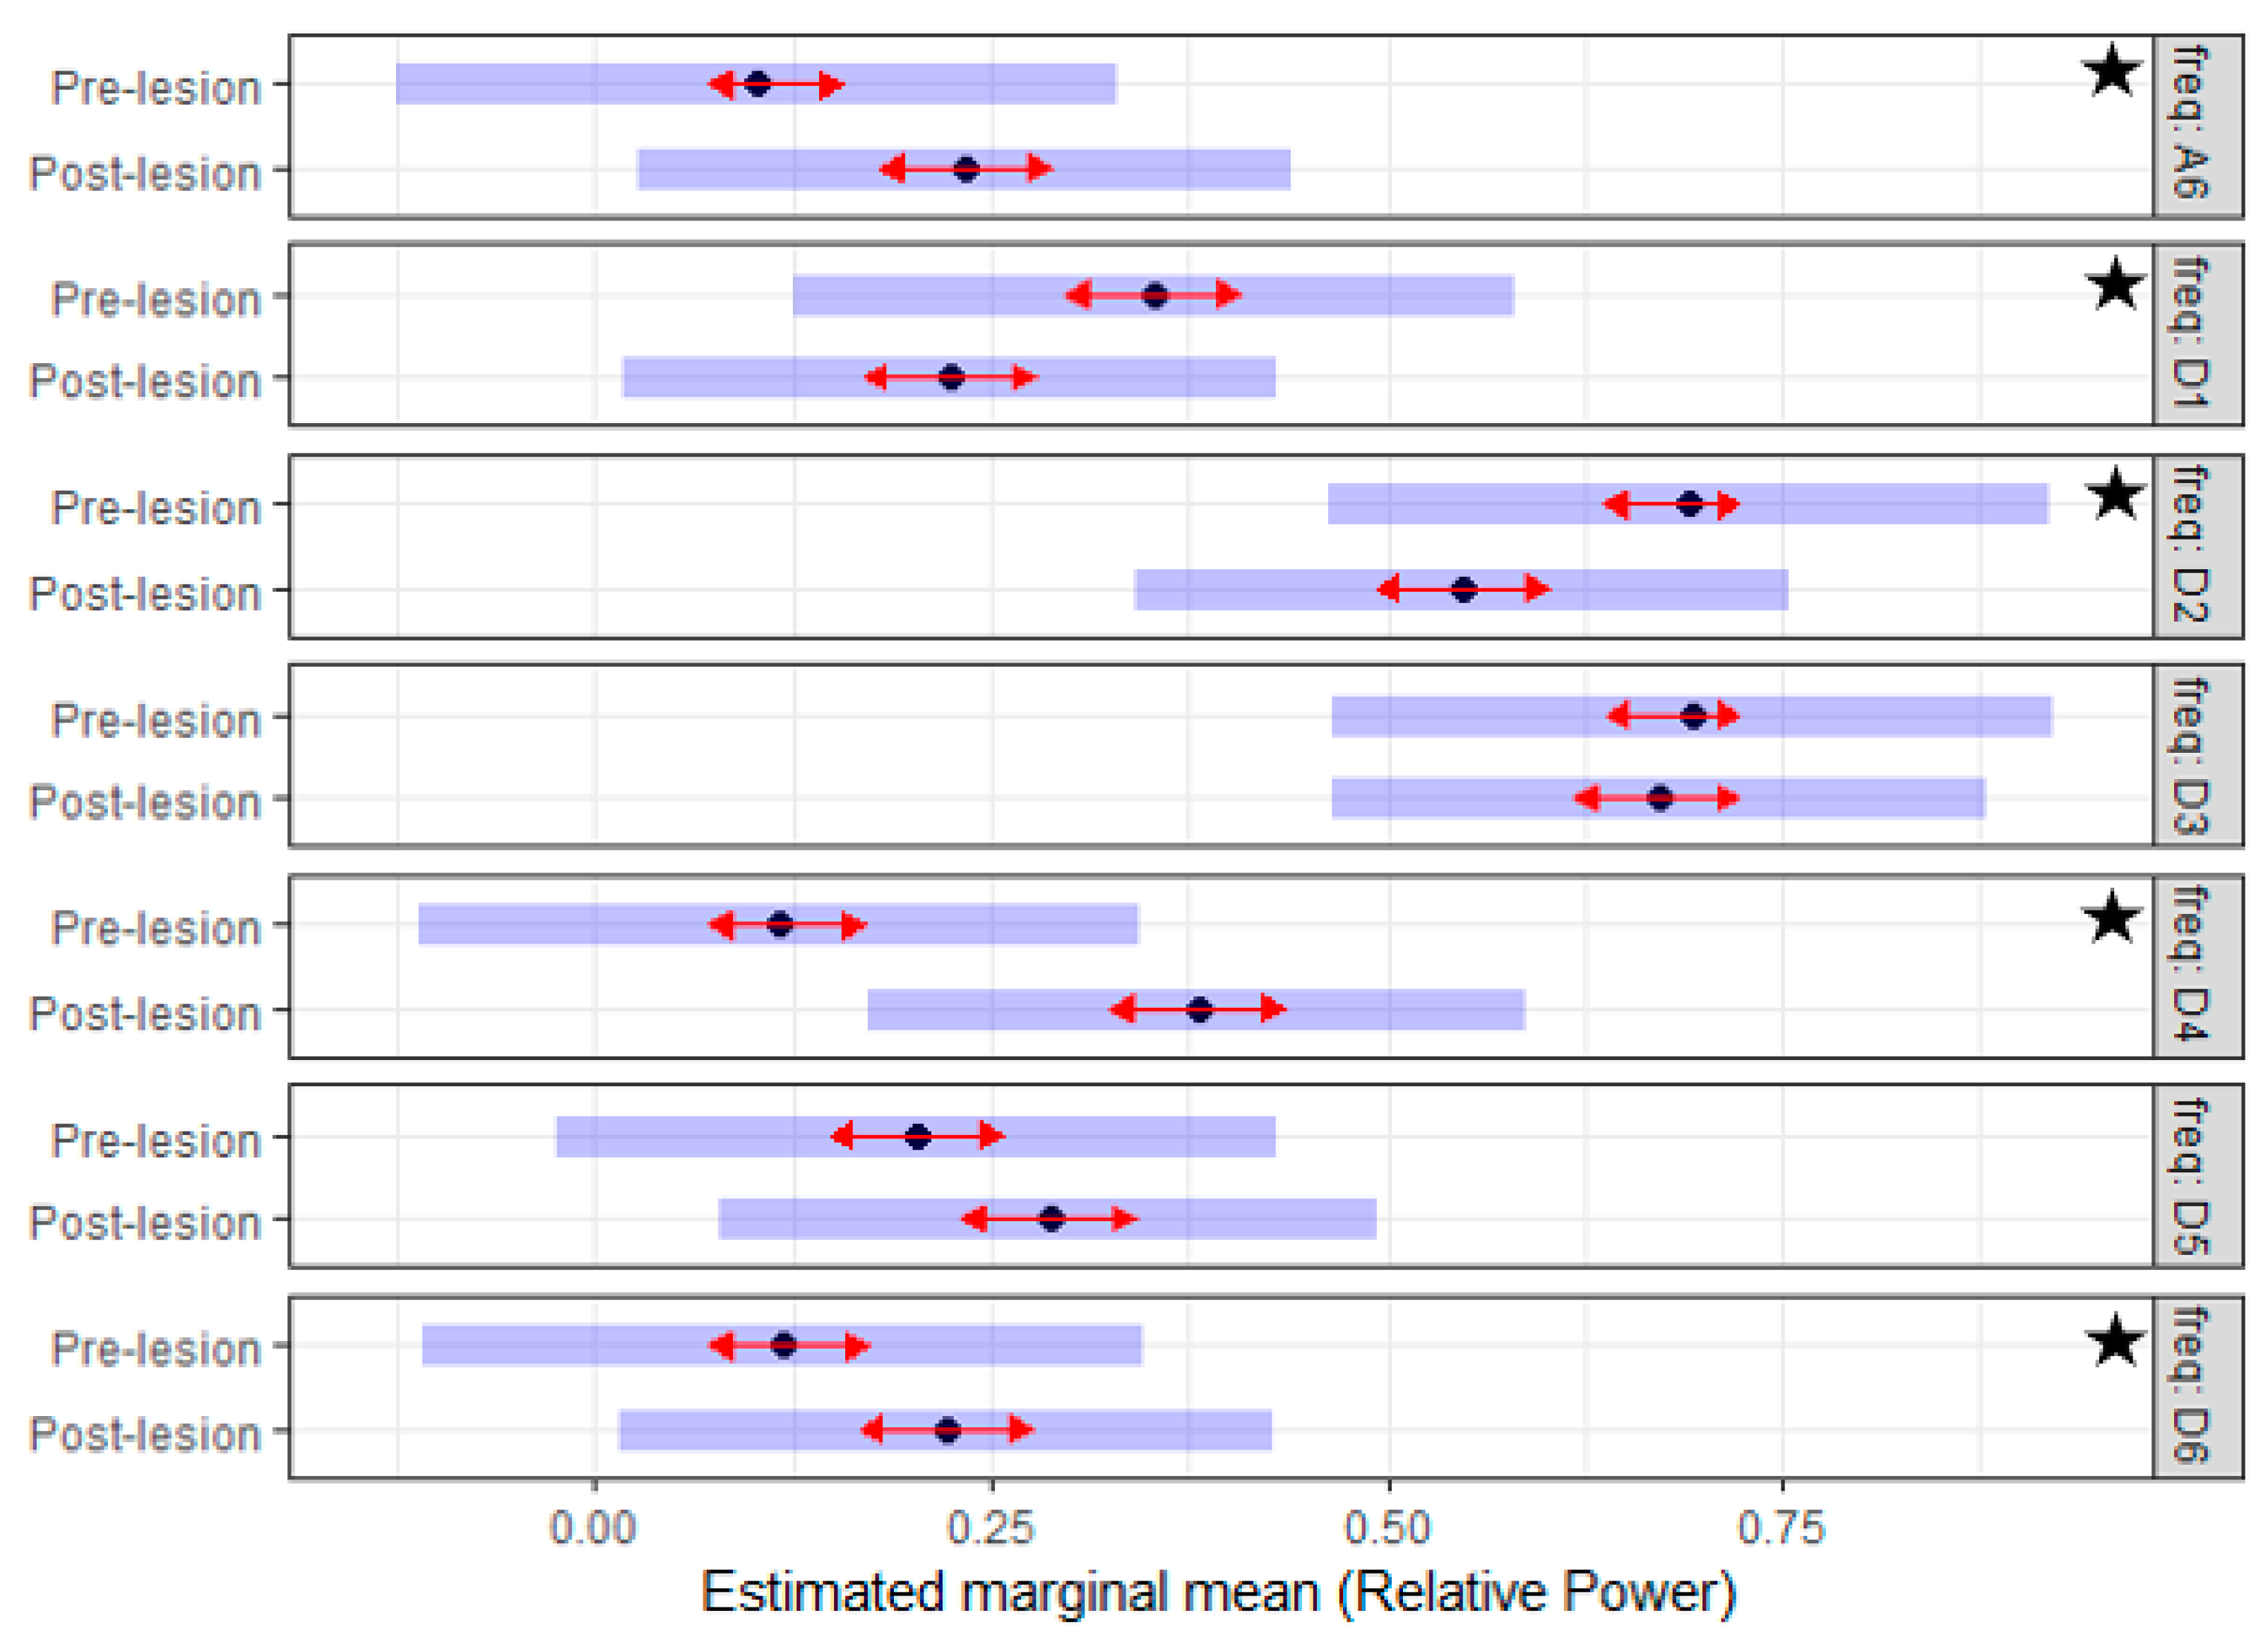
- In the post-lesion period, is there a change in EMG activity attributed to the experimental spinal cord injury and how it could be characterized in term of frequency content?
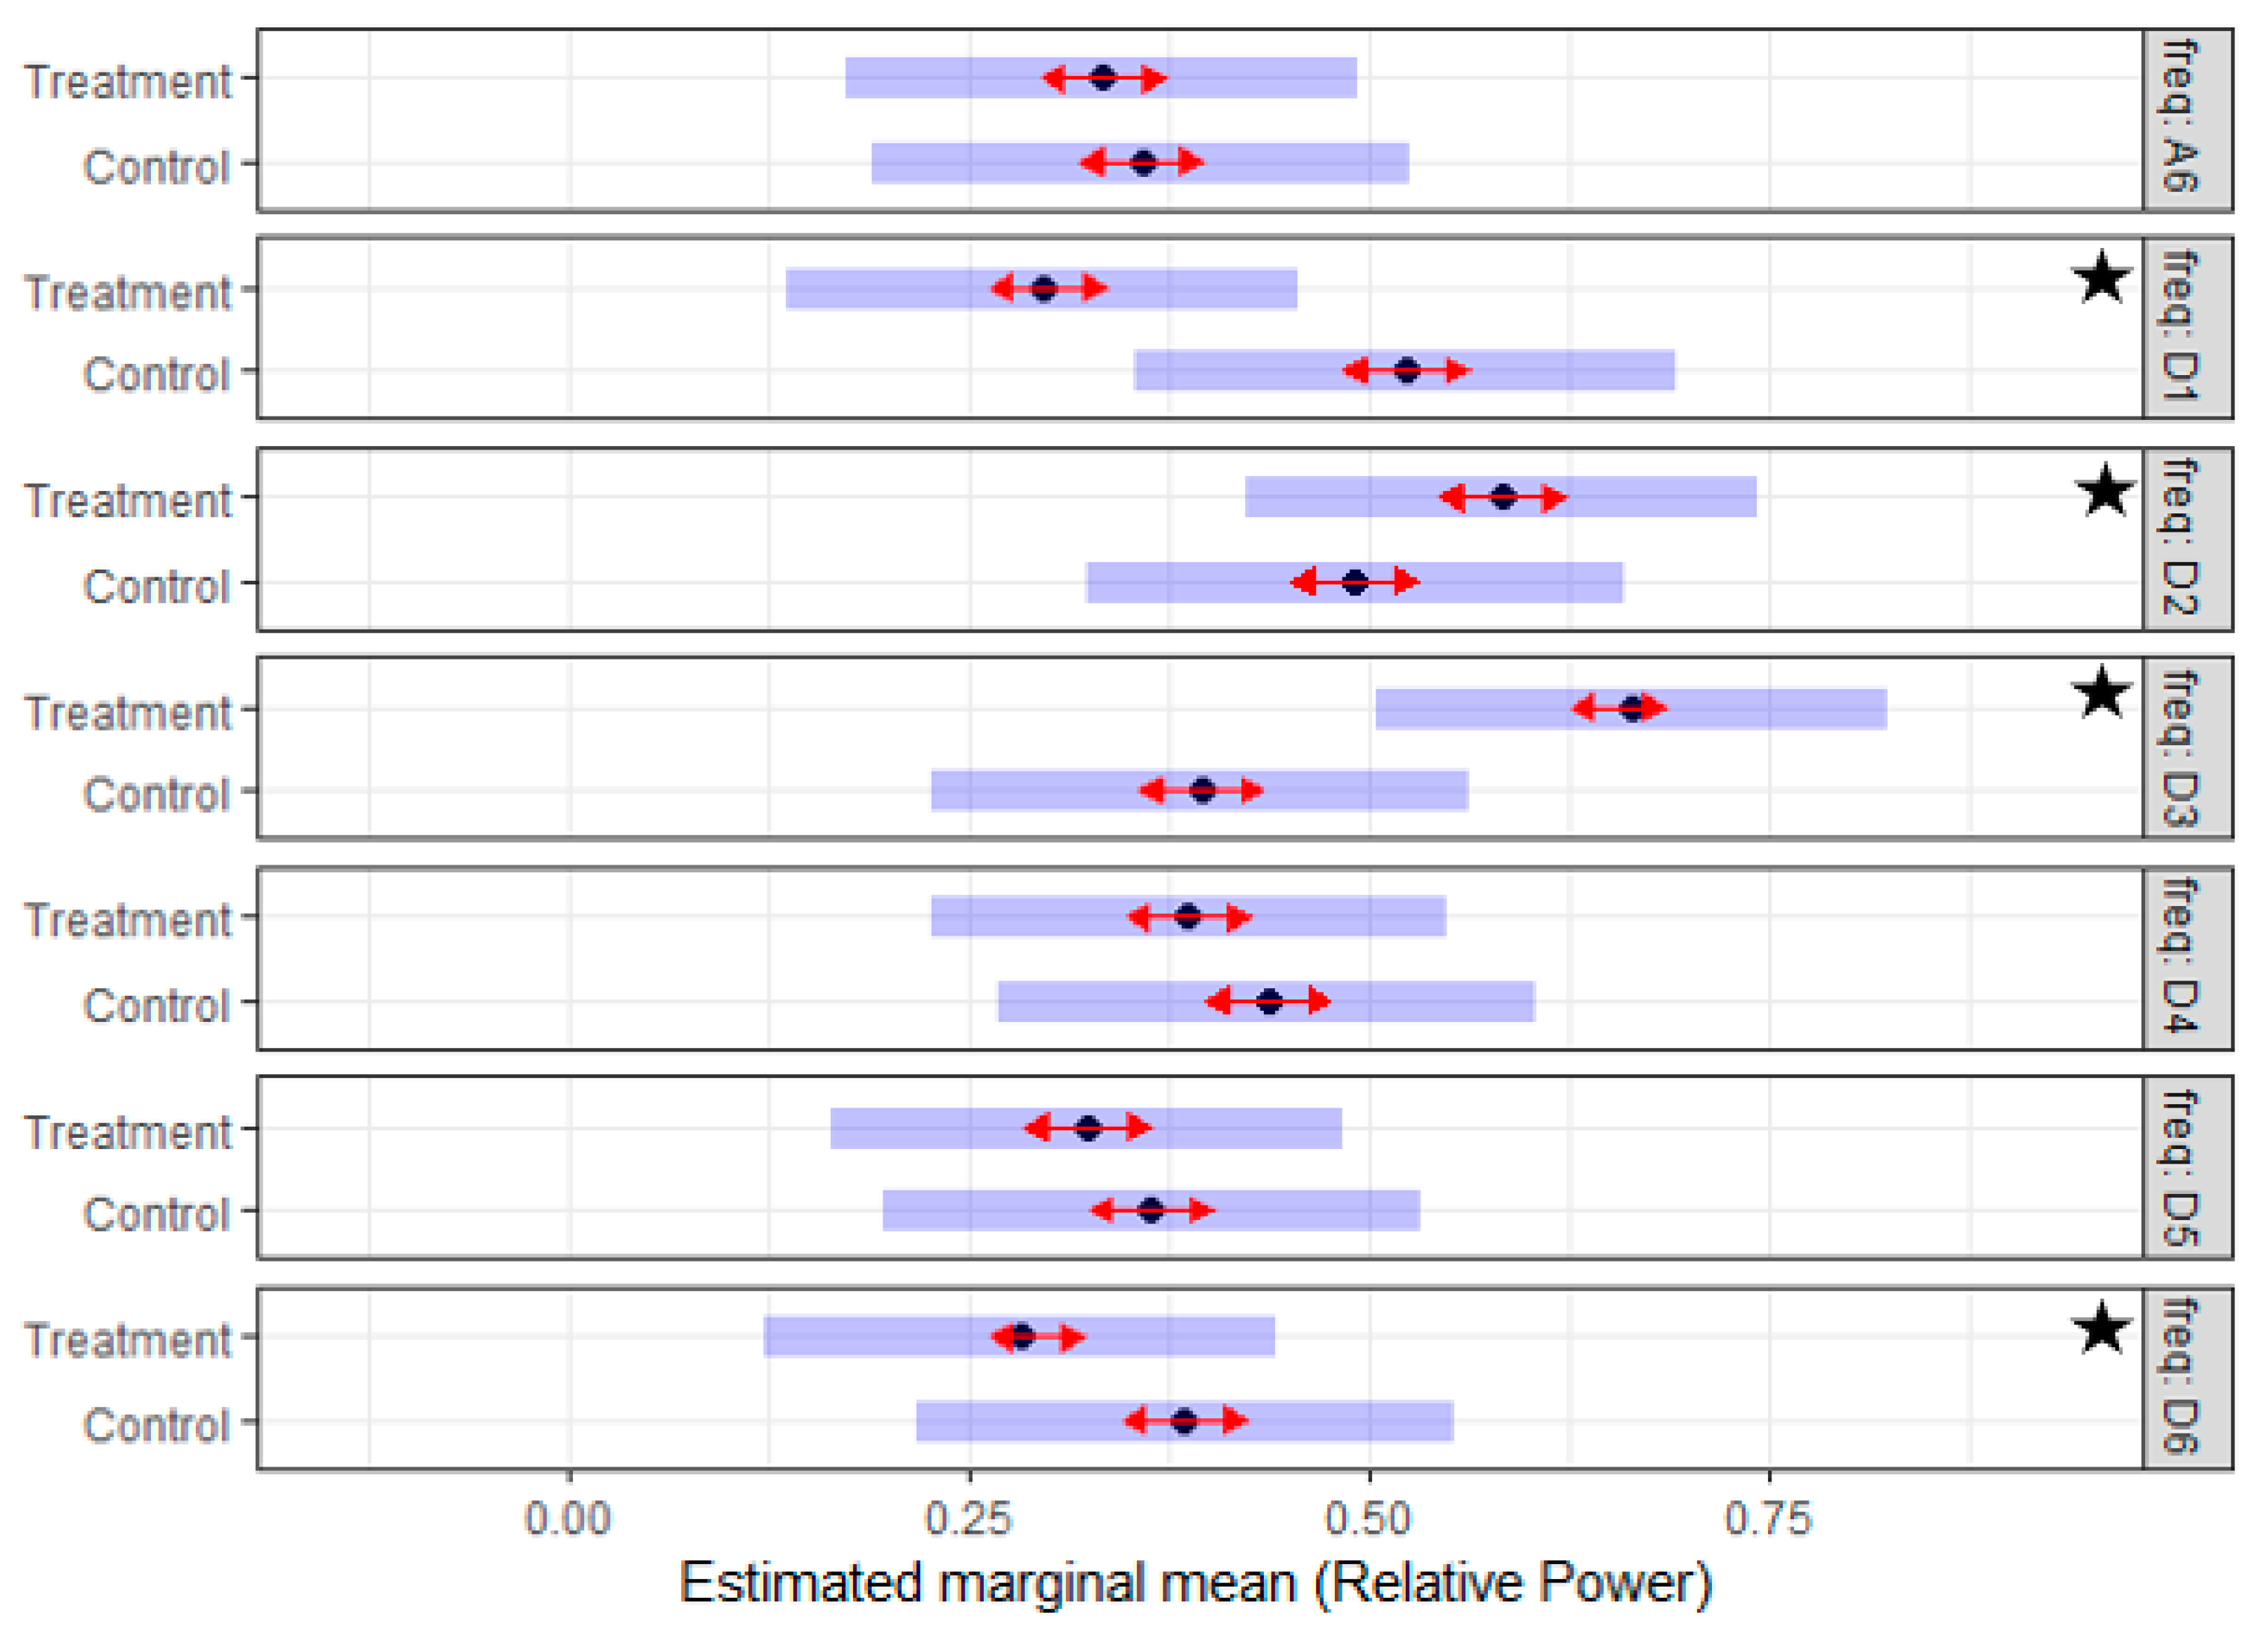
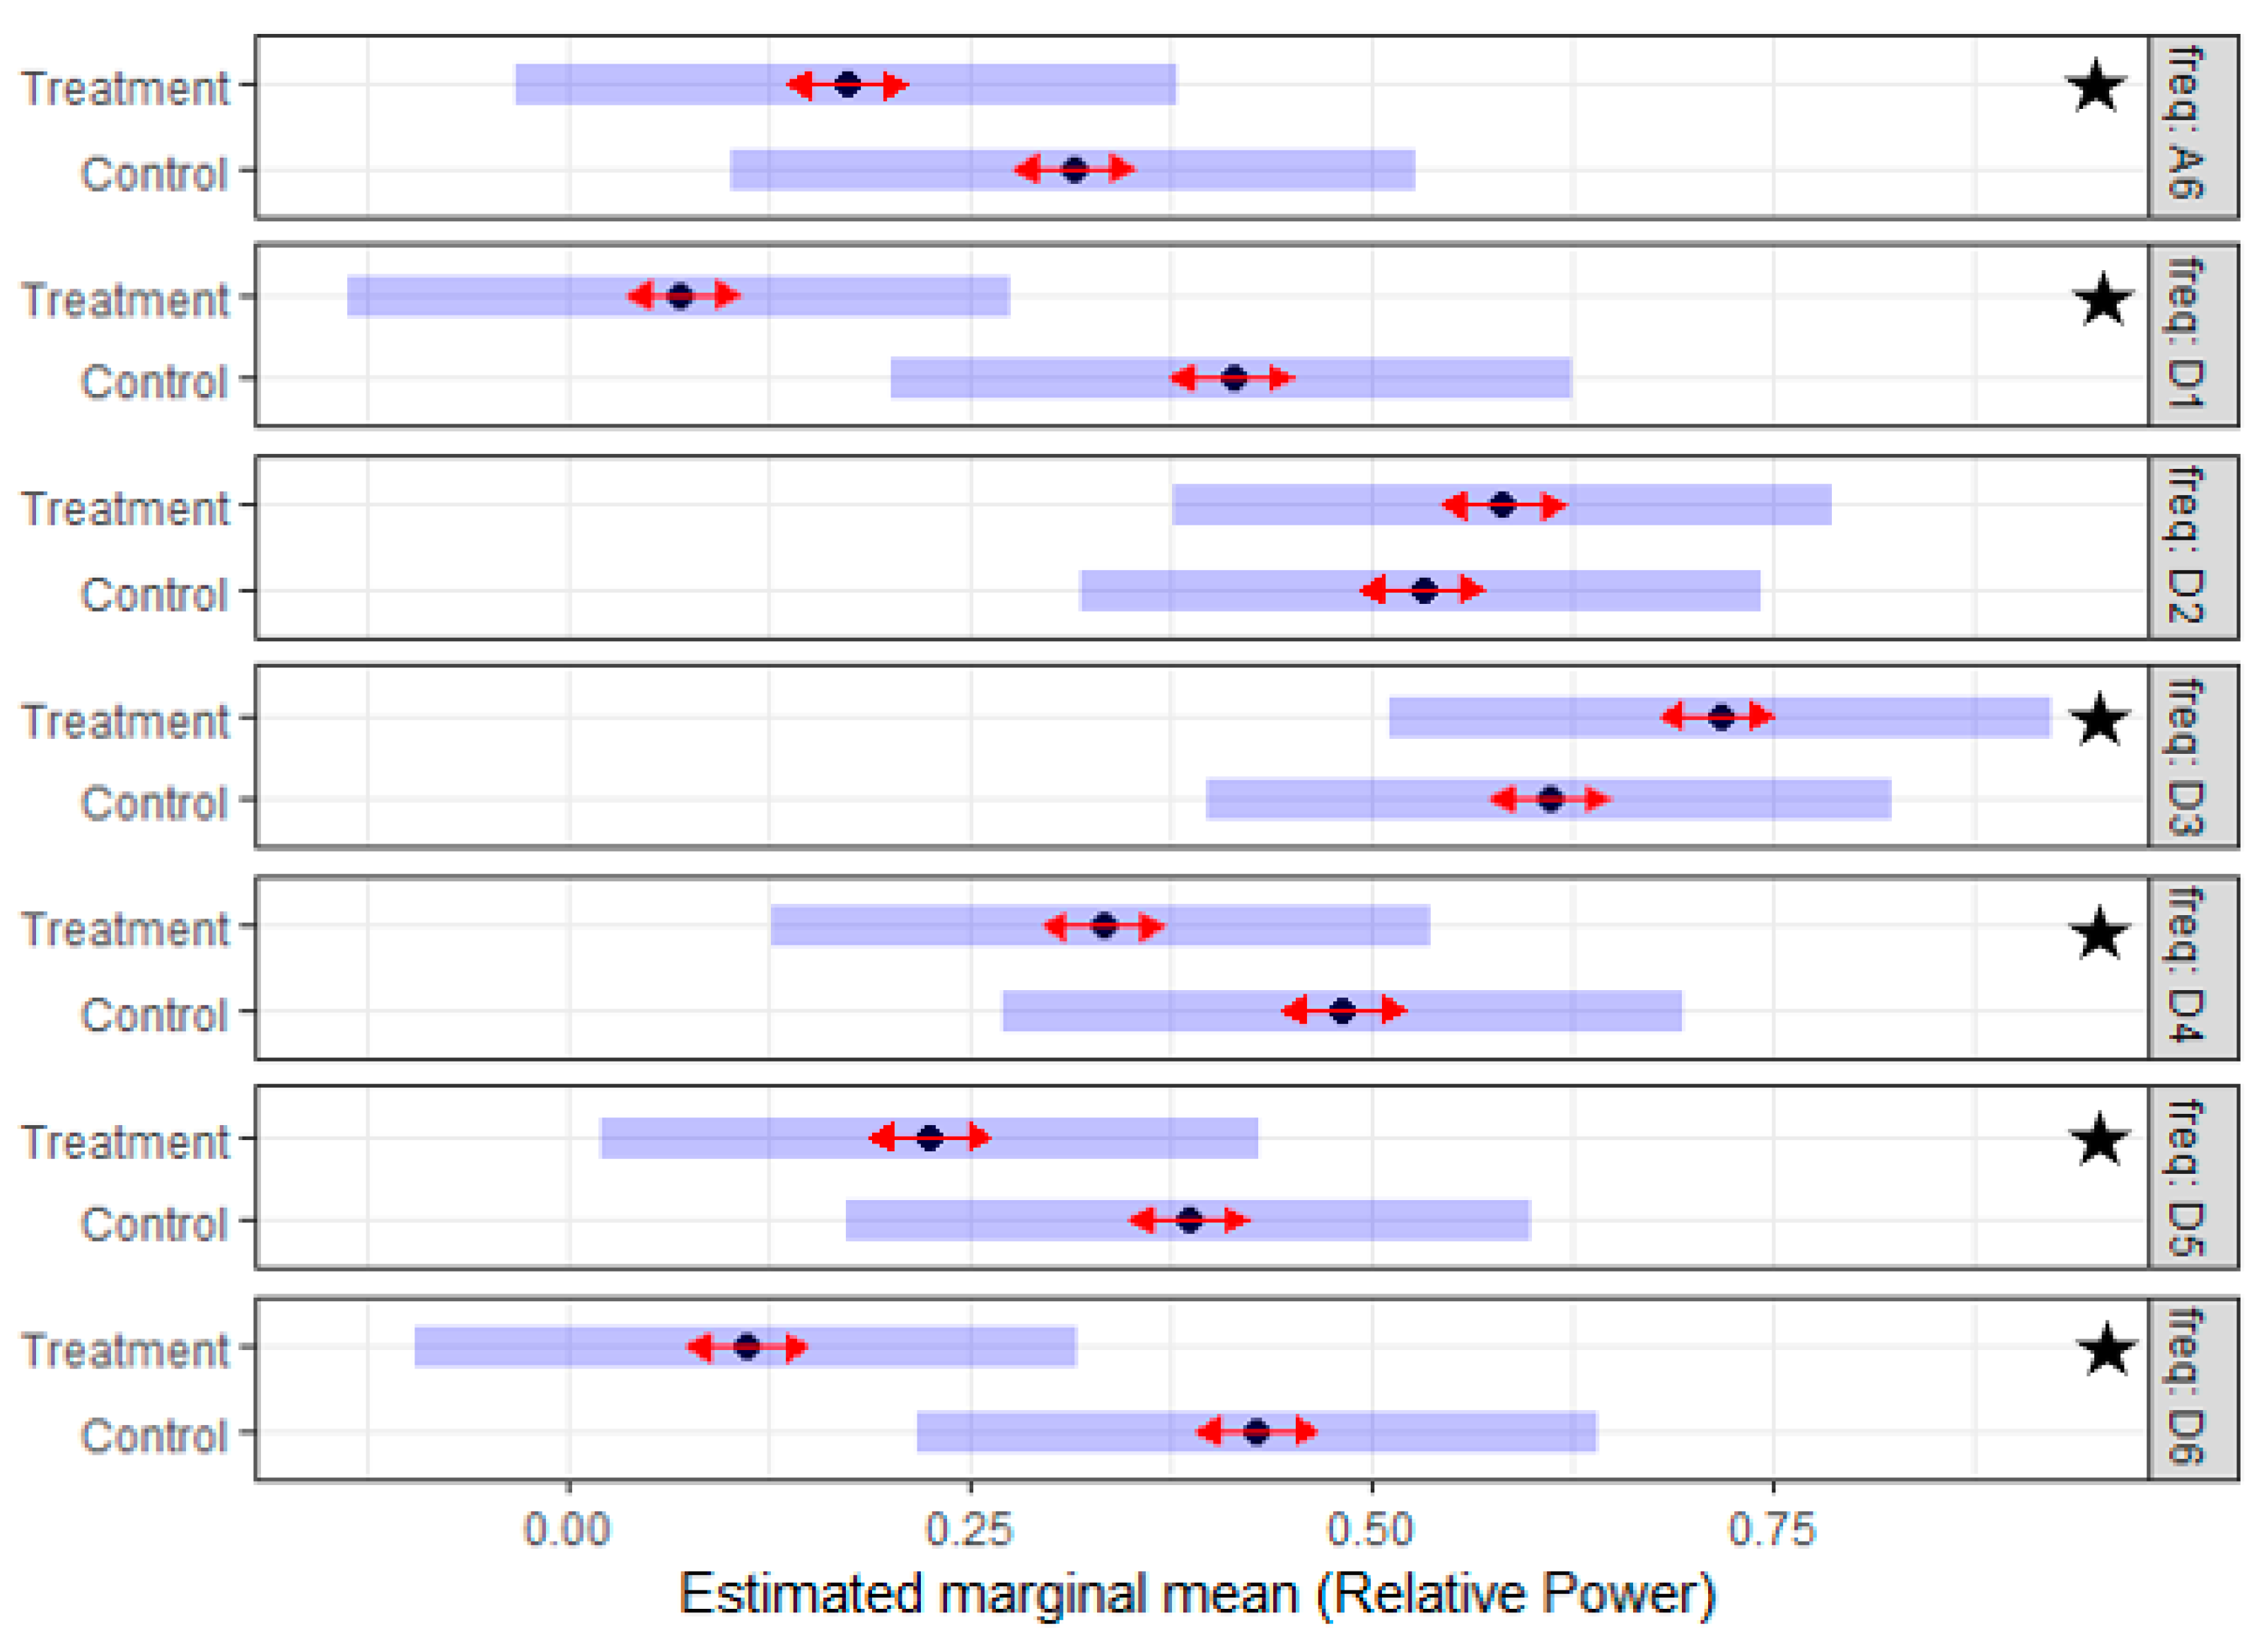
- What is the difference in the EMG activity between the control and the treatment group in the post-lesion period (i.e., is there a treatment effect)?
2. Materials and Methods
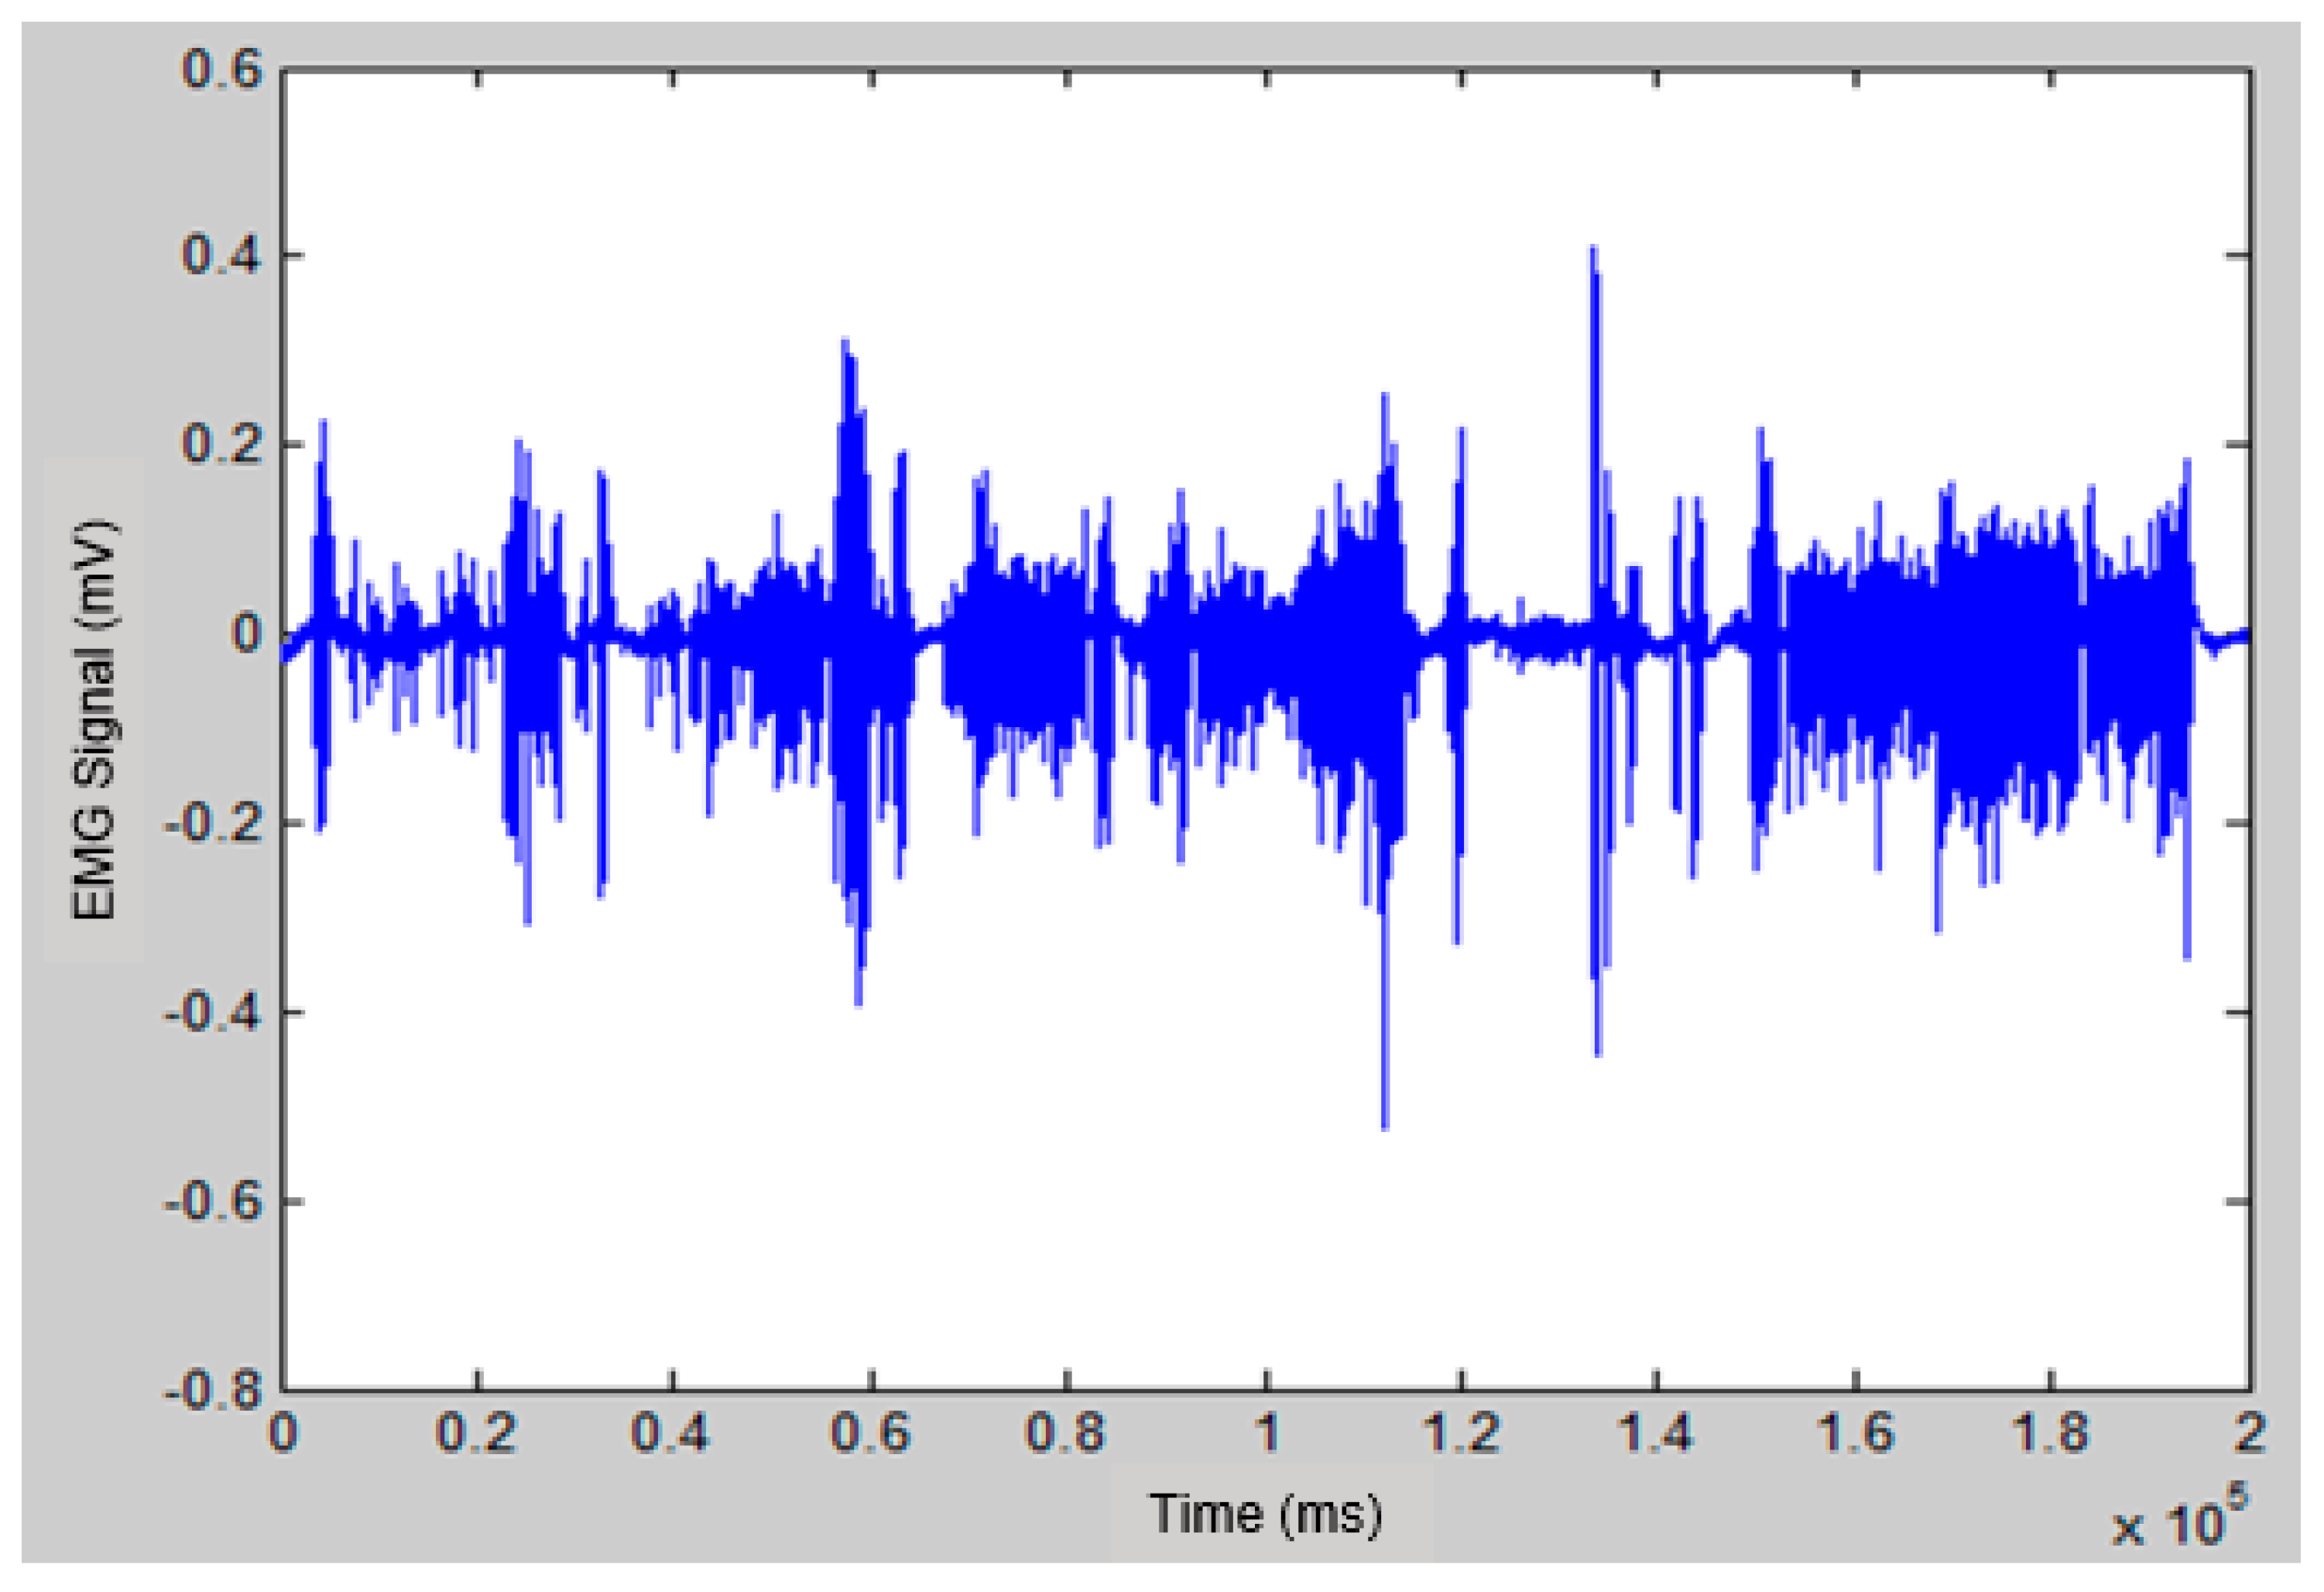
- The raw EMG data obtained from daily recordings were filtered using a bandpass filter (4th order Butterworth filter with a lower and an upper cut off frequency of 10 and 450 Hz respectively). A notch filter with 60 Hz was also applied to eliminate the power line noise, and the input signal was processed forward and backward to solve phase shift problems. The EMG conditioning steps have been implemented using MATLAB software (MathWorks, Natick, MA, USA).
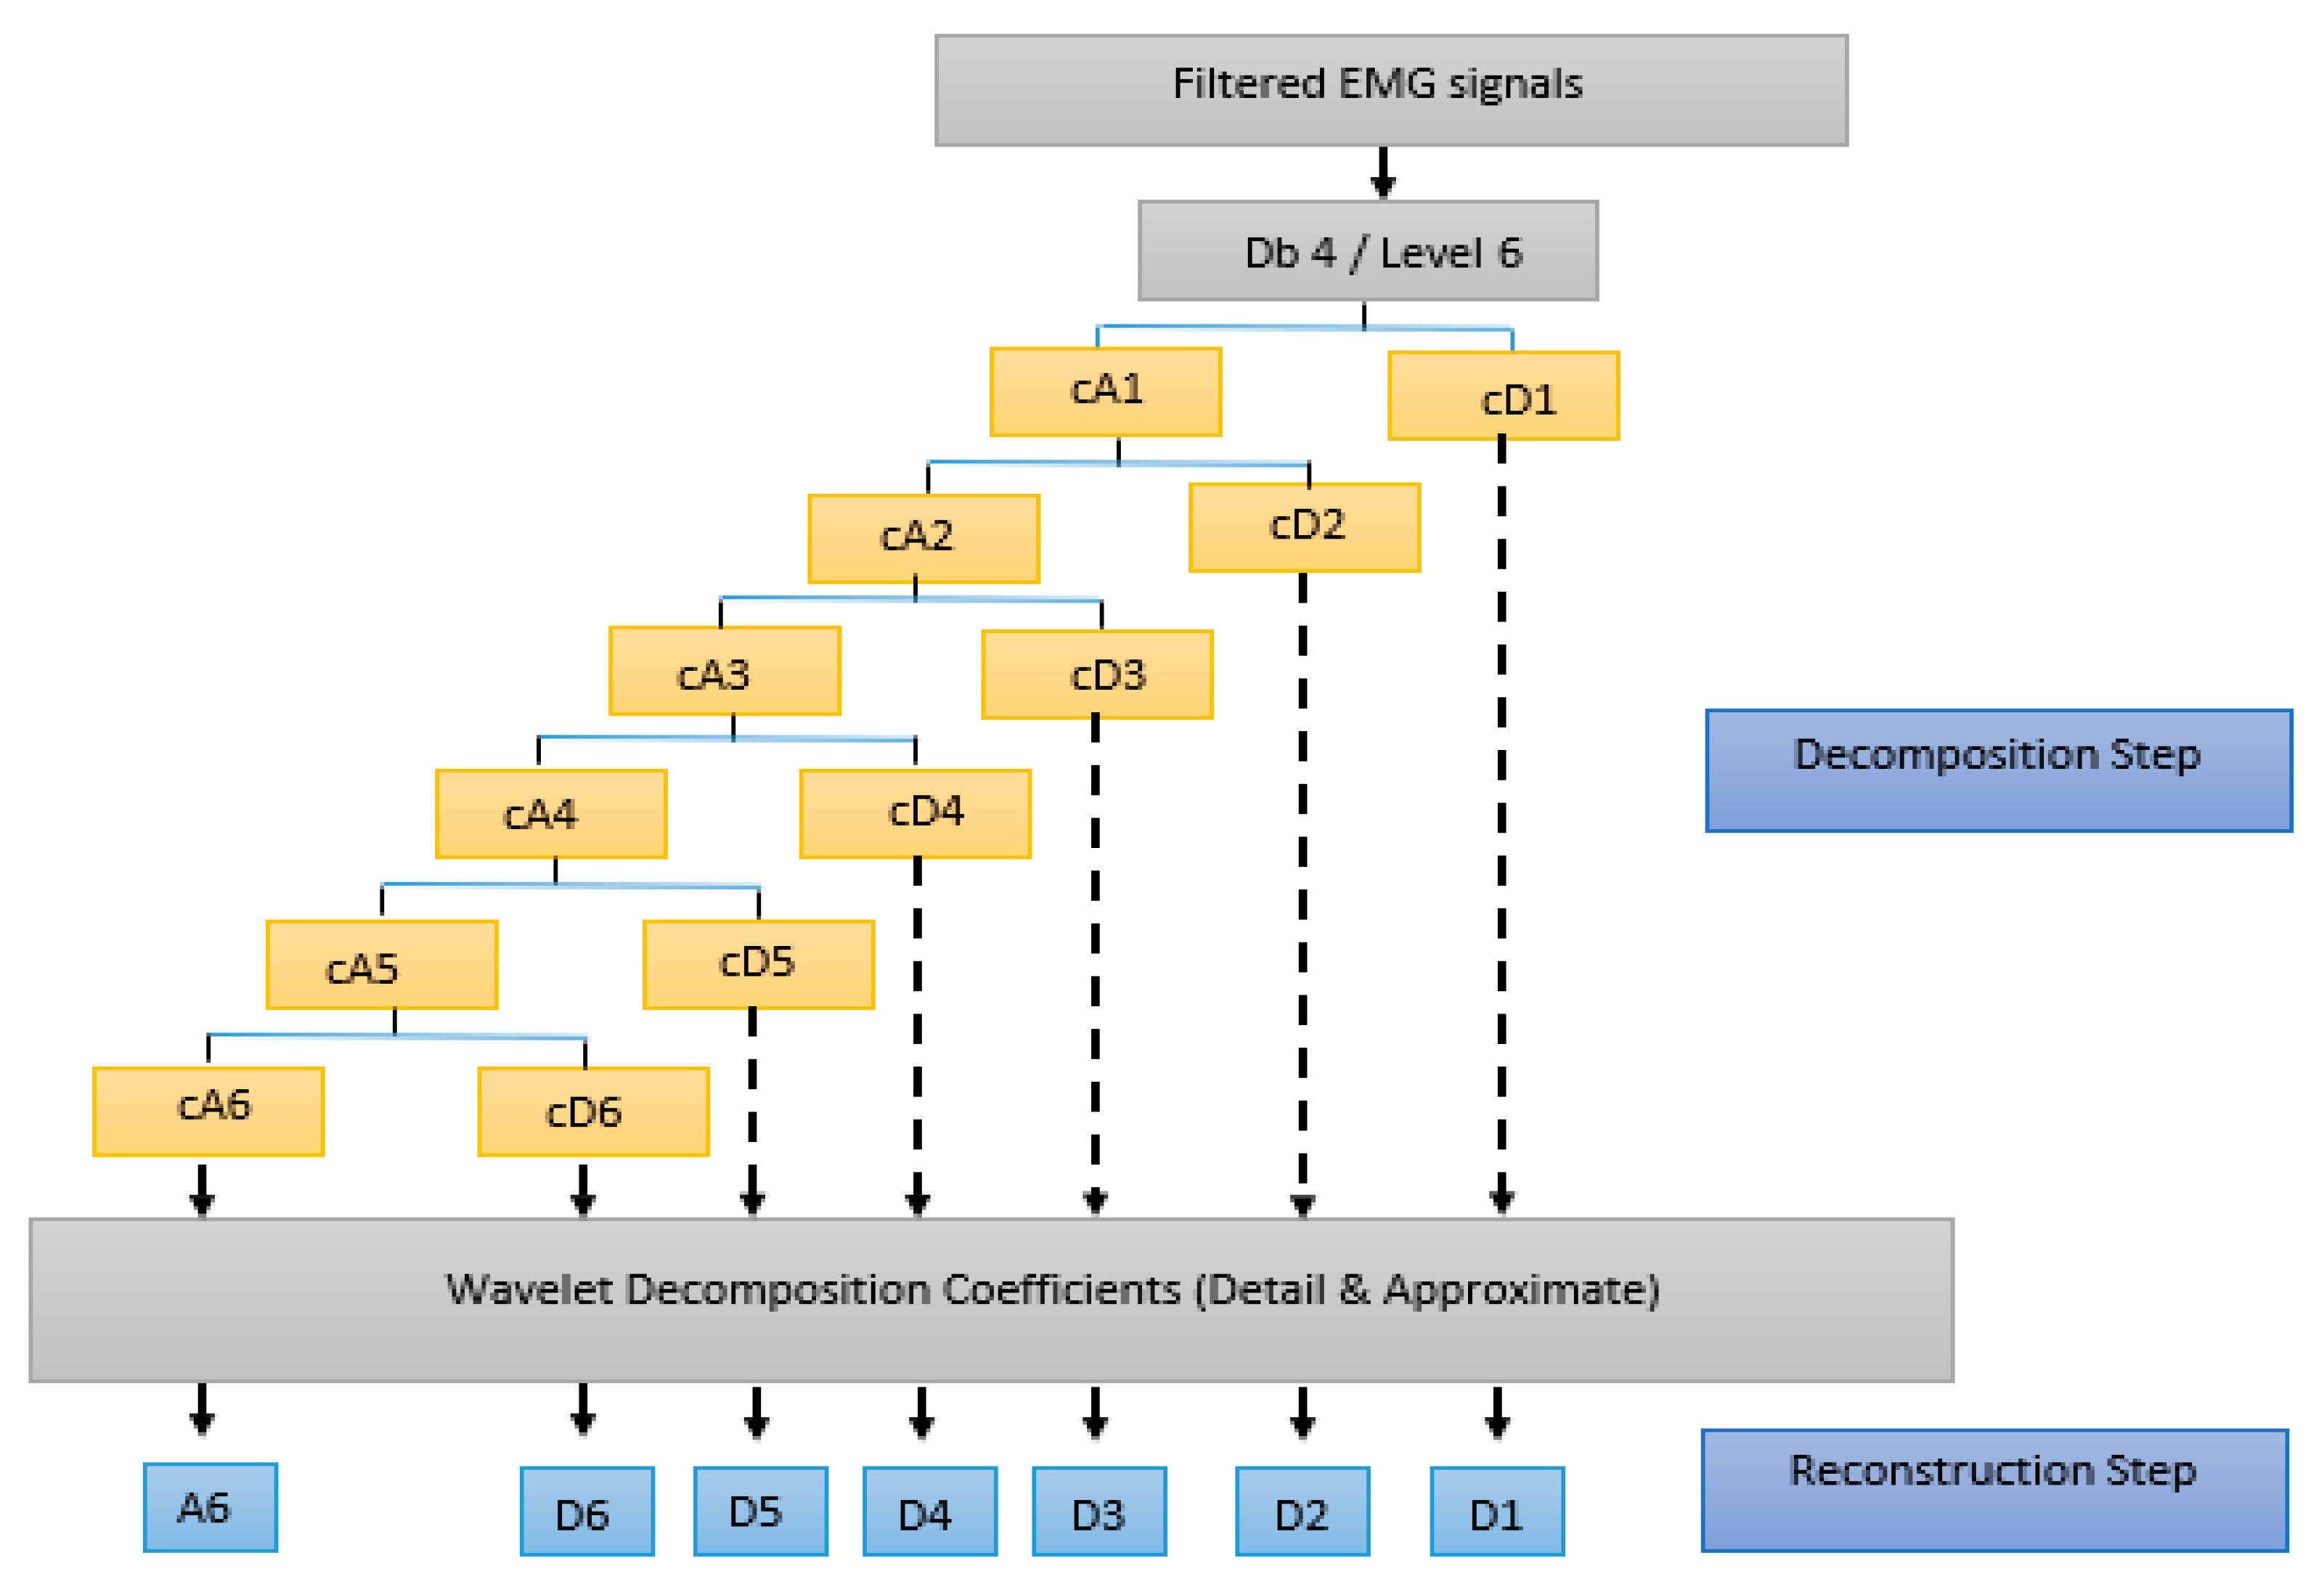
- A decomposition process was applied using wavelet transforms. Each WT sub-band was assumed to represent the firing rate of a group of MUs. Also, it was assumed that the RP of each individual sub-band reflects the level of activity for these MUs. Thus, increases or decreases in RP may characterize the recruitment pattern process of the MUs through different conditions of the experiment. The filtered EMG signals were broken down into seven frequency sub-bands using the WT. The discrete wavelet transforms (DWT) was selected for this work because it has non-redundant results, and it required less computational time and costs [42,43]. A Daubechies mother wavelet of fourth order ‘db4′ was used due to its similarity to the triphasic pattern of the motor unit action potential [44]. Consistent with the analysis of other bio-signals, DWT decomposition was performed using six levels [43,45,46,47,48]. The wavelet analysis was performed in two steps, as presented in Figure 2:
- The EMG signals were decomposed into seven sub-bands, one approximate coefficient (cA6), and six detail coefficients (cD1, …, cD6).
- The EMG signal was then reconstructed at each level using inverse discrete wavelet transform, and seven EMG reconstructed signals (A6, D1, …, D6) were obtained from their coefficients (cA6, cD1, …, cD1). Table 1 shows the frequency ranges of the seven EMG sub-bands.
- To evaluate the changes in EMG sub-bands during different phases of the experiment, these changes were characterized using the RP. The probabilistic distribution of the spectral power was quantified by calculating the relative power of each spectral component [49]. To obtain the RP, firstly the power spectral density was determined for each reconstructed EMG sub-band signal. Then, the RP for each individual sub-band was calculated using the following formula [50]:where:
- RP: the relative power of the desired sub-band.
- SBP: the power of the desired sub-band (e.g., A6, D1, … or D6).
- TP: the total power of all the sub-bands (A6 + D1, …, + D6).
3. Results
- (1)
- Is the intramuscular fine-wire electrode pair capable of detecting limb dominance in the subjects prior to lesion?
- (2)
- In the post-lesion period, is there a change in the EMG activity attributed to the experimental spinal cord injury and how it could be characterized in terms of RP?
- (3)
- What is the difference in the EMG activity between the control and the treatment group in the post-lesion period (Treatment effect)?
4. Discussion
4.1. Non-Human Primates Appear to Exhibit Limb Dominance
4.2. Experimental Traumatic Spinal Cord Injury (TSCI) Causes Perturbation of Electromyographic (EMG) Data
4.3. Combination Treatment Is Associated with Treatment Effect
4.4. Recording of EMG Signals from Surface, Needle and Wire Electrodes
5. Conclusions
Author Contributions
Funding
Conflicts of Interest
References
- Lee, B.B.; Cripps, R.A.; Fitzharris, M.; Wing, P.C. The global map for traumatic spinal cord injury epidemiology: Update 2011, global incidence rate. Spinal Cord 2014, 52, 110–116. [Google Scholar] [CrossRef]
- Nesathurai, S.; Blaustein, D. The Rehabilitation of People with Spinal Cord Injury, 3rd ed.; Arbuckle Academic Publishing: Whitinsville, MA, USA, 2013. [Google Scholar]
- National Spinal Cord Injury Statistical Center, Facts and Figures at a Glance; University of Alabama at Birmingham: Birmingham, AL, USA, 2018.
- Seth, N.; Simmons, H.A.; Masood, F.; Graham, W.A.; Rosene, D.L.; Westmoreland, S.V.; Cummings, S.M.; Gwardjan, B.; Sejdic, E.; Hoggatt, A.F.; et al. Model of Traumatic Spinal Cord Injury for Evaluating Pharmacologic Treatments in Cynomolgus Macaques (Macaca fasicularis). Comp. Med. 2018, 68, 63–73. [Google Scholar]
- Sledge, J.; Graham, W.A.; Westmoreland, S.; Sejdic, E.; Miller, A.; Hoggatt, A.; Nesathurai, S. Spinal cord injury models in non human primates: Are lesions created by sharp instruments relevant to human injuries? Med. Hypotheses 2013, 81, 747–748. [Google Scholar] [CrossRef]
- Graham, W.A.; Rosene, D.L.; Westmoreland, S.; Miller, A.; Sejdic, E.; Nesathurai, S. Humane Non-Human Primate Model of Traumatic Spinal Cord Injury Utilizing Electromyography as a Measure of Impairment and Recovery. Open J. Vet. Med. 2013, 3, 86. [Google Scholar] [CrossRef]
- Nesathurai, S.; Graham, W.A.; Mansfield, K.; Magill, D.; Sehgal, P.; Westmoreland, S.V.; Prusty, S.; Rosene, D.L.; Sledge, J.B. Model of traumatic spinal cord injury in Macaca fascicularis: Similarity of experimental lesions created by epidural catheter to human spinal cord injury. J. Med. Primatol. 2006, 35, 401–404. [Google Scholar] [CrossRef]
- Nout, Y.S.; Rosenzweig, E.S.; Brock, J.H.; Strand, S.C.; Moseanko, R.; Hawbecker, S.; Zdunowski, S.; Nielson, J.L.; Roy, R.R.; Courtine, G.; et al. Animal models of neurologic disorders: A nonhuman primate model of spinal cord injury. Neurotherapeutics 2012, 9, 380–392. [Google Scholar] [CrossRef]
- Rosenzweig, E.S.; Courtine, G.; Jindrich, D.L.; Brock, J.H.; Ferguson, A.R.; Strand, S.C.; Nout, Y.S.; Roy, R.R.; Miller, D.M.; Beattie, M.S.; et al. Extensive spontaneous plasticity of corticospinal projections after primate spinal cord injury. Nat. Neurosci. 2010, 13, 1505. [Google Scholar] [CrossRef]
- Ojha, P.R. Tail Carriage and Dominance in The Rhesus Monkey, Macaca Mulatta. Mammalia 2009, 38, 163–170. [Google Scholar] [CrossRef]
- Sharif-Alhoseini, M.; Khormali, M.; Rezaei, M.; Safdarian, M.; Hajighadery, A.; Khalatbari, M.M.; Meknatkhah, S.; Rezvan, M.; Chalangari, M.; Derakhshan, P.; et al. Animal models of spinal cord injury: A systematic review. Spinal Cord 2017, 55, 714. [Google Scholar] [CrossRef]
- Calancie, B.; Molano, M.R.; Broton, J.G. EMG for assessing the recovery of voluntary movement after acute spinal cord injury in man. Clin. Neurophysiol. 2004, 115, 1748–1759. [Google Scholar] [CrossRef]
- Lewko, J.P. Assessment of muscle electrical activity in spinal cord injury subjects during quiet standing. Paraplegia 1996, 34, 158–163. [Google Scholar] [CrossRef]
- Wiegner, A.W.; Wierzbicka, M.M.; Davies, L.; Young, R.R. Discharge properties of single motor units in patients with spinal cord injuries. Muscle Nerve 1993, 16, 661–671. [Google Scholar] [CrossRef]
- Shahani, B.T.; Wierzbicka, M.M.; Parker, S.W. Abnormal single motor unit behavior in the upper motor neuron syndrome. Muscle Nerve 1991, 14, 64–69. [Google Scholar] [CrossRef]
- Capogrosso, M.; Milekovic, T.; Borton, D.; Wagner, F.; Moraud, E.M.; Mignardot, J.B.; Buse, N.; Gandar, J.; Barraud, Q.; Xing, D.; et al. A brainspine interface alleviating gait deficits after spinal cord injury in primates. Nature 2016, 539, 284–288. [Google Scholar] [CrossRef]
- Karlsson, S.; Akay, M. Time-frequency analysis of myoelectric signals during dynamic contractions: A comparative study. IEEE Trans. Biomed. Eng. 2000, 47, 228–238. [Google Scholar] [CrossRef]
- Phinyomark, A.; Nuidod, A.; Phukpattaranont, P.; Limsakul, C. Feature Extraction and Reduction of Wavelet Transform Coefficients for EMG Pattern Classification. Elektron. Elektrotechnika 2012, 122, 27–32. [Google Scholar] [CrossRef]
- Ranniger, C.U.; Akin, D.L. EMG mean power frequency determination using wavelet analysis. In Proceedings of the 19th Annual International Conference of the IEEE Engineering in Medicine and Biology Society. “Magnificent Milestones and Emerging Opportunities in Medical Engineering” (Cat. No.97CH36136), Chicago, IL, USA, 30 October–2 November 1997; Volume 4, pp. 1589–1592. [Google Scholar]
- Zhou, P.; Rymer, W.Z. MUAP Number Estimates in Surface EMG: Template-Matching Methods and Their Performance Boundaries. Ann. Biomed. Eng. 2004, 32, 1007–1015. [Google Scholar] [CrossRef]
- Hramov, A.E.; Koronovskii, A.A.; Makarov, V.A.; Pavlov, A.N.; Sitnikova, E. Wavelets in Neuroscience; Springer: Berlin/Heidelberg, Germany, 2015. [Google Scholar]
- Wang, G.; Zhang, Y.; Wang, J. The analysis of surface EMG signals with the wavelet-based correlation dimension method. Comput. Math. Methods Med. 2014, 2014, 284308. [Google Scholar] [CrossRef]
- Hostens, I.; Seghers, J.; Spaepen, A.; Ramon, H. Validation of the wavelet spectral estimation technique in biceps brachii and brachioradialis fatigue assessment during prolonged low-level static and dynamic contractions. J. Electromyogr. Kinesiol. 2004, 14, 205–215. [Google Scholar] [CrossRef]
- So, R.C.H.; Ng, J.K.-F.; Lam, R.W.K.; Lo, C.K.K.; Ng, G.Y.F. EMG wavelet analysis of quadriceps muscle during repeated knee extension movement. Med. Sci. Sports Exerc. 2009, 41, 788–796. [Google Scholar] [CrossRef]
- González-Izal, M.; Rodríguez-Carreño, I.; Malanda, A.; Mallor-Giménez, F.; Navarro-Amézqueta, I.; Gorostiaga, E.M.; Izquierdo, M. sEMG wavelet-based indices predicts muscle power loss during dynamic contractions. J. Electromyogr. Kinesiol. 2010, 20, 1097–1106. [Google Scholar] [CrossRef] [Green Version]
- Yamada, R.; Ushiba, J.; Tomita, Y.; Masakado, Y. Decomposition of electromyographic signal by principal component analysis of wavelet coefficients. In Proceedings of the IEEE EMBS Asian-Pacific Conference on Biomedical Engineering, Kyoto, Japan, 20–22 October 2003; pp. 118–119. [Google Scholar]
- Fang, J.; Agarwal, G.C.; Shahani, B.T. Decomposition of EMG signal by wavelet spectrum matching. In Proceedings of the 19th Annual International Conference of the IEEE Engineering in Medicine and Biology Society, Chicago, IL, USA, 30 October–2 November 1997; Volume 3, pp. 1253–1256. [Google Scholar]
- Merlo, A.; Farina, D.; Merletti, R. A fast and reliable technique for muscle activity detection from surface EMG signals. IEEE Trans. Biomed. Eng. 2003, 50, 316–323. [Google Scholar] [CrossRef]
- Sharma, S. Wavelet analysis based feature extraction for pattern classification from Single channel acquired EMG signal. Elixir Online J. 2012, 50, 0320-1. [Google Scholar]
- Phinyomark, A.; Limsakul, C.; Phukpattaranont, P. Application of wavelet analysis in EMG feature extraction for pattern classification. Meas. Sci. Rev. 2011, 11, 45–52. [Google Scholar] [CrossRef]
- Salvador, J. Application of the Wavelet Transform for EMG M-Wave Pattern Recognition. Ph.D. Thesis, McMaster University, Hamilton, ON, Canada, 2006. [Google Scholar]
- Sharma, T.; Veer, K. EMG classification using wavelet functions to determine muscle contraction. J. Med. Eng. Technol. 2016, 40, 99–105. [Google Scholar] [CrossRef]
- Vetter, R.; Schild, J.; Kuhn, A.; Radlinger, L. Discrimination of Healthy and Post-partum Subjects using Wavelet Filterbank and Auto-regressive Modelling. In Proceedings of the International Conference on Bio-inspired Systems and Signal Processing, Lisbon, Portugal, 12–15 January 2015. [Google Scholar]
- Wakeling, J.M.; Lee, S.S.M.; Arnold, A.S.; Miara, M.D.; Biewener, A.A. A Muscle’s Force Depends on the Recruitment Patterns of Its Fibers. Ann. Biomed. Eng. 2012, 40, 1708–1720. [Google Scholar] [CrossRef]
- Parsaei, H. EMG Signal Decomposition Using Motor Unit Potential Train Validity; University of Waterloo: Waterloo, ON, Canada, 2011. [Google Scholar]
- Farina, D.; Crosetti, A.; Merletti, R. A model for the generation of synthetic intramuscular EMG signals to test decomposition algorithms. IEEE Trans. Biomed. Eng. 2001, 48, 66–77. [Google Scholar] [CrossRef]
- Stashuk, D.W.; Farina, D.; Søgaard, K. Decomposition of intramuscular EMG signals. In Electromyography: Physiology, Engineering, and Noninvasive Applications; Wiley-Interscience: Hoboken, NJ, USA; IEEE Press: Piscataway, NJ, USA, 2005; pp. 47–80. [Google Scholar]
- Negro, F.; Muceli, S.; Castronovo, A.M.; Holobar, A.; Farina, D. Multi-channel intramuscular and surface EMG decomposition by convolutive blind source separation. J. Neural Eng. 2016, 13, 026027. [Google Scholar] [CrossRef]
- Nawab, S.H.; Wotiz, R.P.; de Luca, C.J. Decomposition of indwelling EMG signals. J. Appl. Physiol. 2008, 105, 700–710. [Google Scholar] [CrossRef] [Green Version]
- Sledge, J.; Mahadevappa, K.; Stacey, P.; Graham, A.; Nesathurai, S. A Speculative Pharmaceutical Cocktail to Treat Spinal Cord Injury. Am. J. Phys. Med. Rehabil. 2016, 95, e108–e110. [Google Scholar] [CrossRef]
- Luca, C.J.D. Control properties of motor units. J. Exp. Biol. 1985, 115, 125–136. [Google Scholar]
- Messer, S.R.; Agzarian, J.; Abbott, D. Optimal wavelet denoising for phonocardiograms. Microelectron. J. 2001, 32, 931–941. [Google Scholar] [CrossRef]
- Al-Qazzaz, N.K.; Ali, S.H.B.M.; Ahmad, S.A.; Islam, M.S.; Escudero, J. Selection of Mother Wavelet Functions for Multi-Channel EEG Signal Analysis during a Working Memory Task. Sensors 2015, 15, 29015–29035. [Google Scholar] [CrossRef]
- Luca, C.J.D. Physiology and Mathematics of Myoelectric Signals. IEEE Trans. Biomed. Eng. 1979, BME-26, 313–325. [Google Scholar] [CrossRef]
- Al-Qazzaz, N.K.; Ali, S.H.M.; Islam, S.; Ahmad, S.A.; Escudero, J. EEG Wavelet Spectral Analysis During a Working Memory Tasks in Stroke-Related Mild Cognitive Impairment Patients. In International Conference for Innovation in Biomedical Engineering and Life Sciences; Springer: Singapore, 2015; pp. 82–85. [Google Scholar]
- Mammone, N.; Foresta, F.L.; Morabito, F.C. Automatic Artifact Rejection from Multichannel Scalp EEG by Wavelet ICA. IEEE Sens. J. 2012, 12, 533–542. [Google Scholar] [CrossRef]
- Inuso, G.; Foresta, F.L.; Mammone, N.; Morabito, F.C. Wavelet-ICA methodology for efficient artifact removal from Electroencephalographic recordings. In Proceedings of the 2007 International Joint Conference on Neural Networks, Orlando, FL, USA, 12–17 August 2007; pp. 1524–1529. [Google Scholar]
- Burhan, N.; Kasno, M.; Ghazali, R. Feature extraction of surface electromyography (sEMG) and signal processing technique in wavelet transform: A review. In Proceedings of the 2016 IEEE International Conference on Automatic Control and Intelligent Systems (I2CACIS), Selangor, Malaysia, 22 October 2016; pp. 141–146. [Google Scholar]
- Hu, X.; Wang, Z.; Ren, X. Classification of surface EMG signal using relative wavelet packet energy. Comput. Methods Programs Biomed. 2005, 79, 189–195. [Google Scholar] [CrossRef]
- Ko, K.-E.; Yang, H.-C.; Sim, K.-B. Emotion recognition using EEG signals with relative power values and Bayesian network. Int. J. Control Autom. Syst. 2009, 7, 865. [Google Scholar] [CrossRef]
- Sadeghi, H.; Allard, P.; Prince, F.; Labelle, H. Symmetry and limb dominance in able-bodied gait: A review. Gait Posture 2000, 12, 34–45. [Google Scholar] [CrossRef]
- De Carvalho, M.; Eisen, A.; Krieger, C.; Swash, M. Motoneuron firing in amyotrophic lateral sclerosis (ALS). Front. Hum. Neurosci. 2014, 8, 719. [Google Scholar] [CrossRef]


| Wavelet Decomposition Level | Frequency Range/Hz | Reconstructed EMG Sub-Bands |
|---|---|---|
| 1 | 250–500 | D1 |
| 2 | 125–250 | D2 |
| 3 | 62.5–125 | D3 |
| 4 | 31.25–62.5 | D4 |
| 5 | 15.63–31.25 | D5 |
| 6 | 7.81–15.63 | D6 |
| 6 | 0–7.81 | A6 |
| Parameter | Definition |
|---|---|
| response (relative power) | |
| experiment day | |
| frequency sub-band (D1, D2, D3, D4, D4, D6, and A6) | |
| EFFECT | the main effect in the models, so for: |
| Model 1: the side effect (categorical variable with two levels (left and right side)) | |
| Model 2: the lesion effect (categorical variable with two levels (pre- and post-lesion)) | |
| Model 3: the treatment effect (categorical variable with two levels (control and treatment group)) | |
| the fixed effect associated with the (intercept, Day, EFFECT, EFFECT*Day, Freq, Freq*Day, Freq* EFFECT, and Freq* EFFECT*Day) | |
| the subject random effect associated with the intercept and Day slope, respectively | |
| the random effect of a frequency sub-band nested within a subject associated with the intercept and Day slope respectively | |
| random error |
© 2019 by the authors. Licensee MDPI, Basel, Switzerland. This article is an open access article distributed under the terms and conditions of the Creative Commons Attribution (CC BY) license (http://creativecommons.org/licenses/by/4.0/).
Share and Cite
Masood, F.; Abdullah, H.A.; Seth, N.; Simmons, H.; Brunner, K.; Sejdic, E.; Schalk, D.R.; Graham, W.A.; Hoggatt, A.F.; Rosene, D.L.; et al. Neurophysiological Characterization of a Non-Human Primate Model of Traumatic Spinal Cord Injury Utilizing Fine-Wire EMG Electrodes. Sensors 2019, 19, 3303. https://doi.org/10.3390/s19153303
Masood F, Abdullah HA, Seth N, Simmons H, Brunner K, Sejdic E, Schalk DR, Graham WA, Hoggatt AF, Rosene DL, et al. Neurophysiological Characterization of a Non-Human Primate Model of Traumatic Spinal Cord Injury Utilizing Fine-Wire EMG Electrodes. Sensors. 2019; 19(15):3303. https://doi.org/10.3390/s19153303
Chicago/Turabian StyleMasood, Farah, Hussein A. Abdullah, Nitin Seth, Heather Simmons, Kevin Brunner, Ervin Sejdic, Dane R. Schalk, William A. Graham, Amber F. Hoggatt, Douglas L. Rosene, and et al. 2019. "Neurophysiological Characterization of a Non-Human Primate Model of Traumatic Spinal Cord Injury Utilizing Fine-Wire EMG Electrodes" Sensors 19, no. 15: 3303. https://doi.org/10.3390/s19153303