Detecting Variable Resistance by Fluorescence Intensity Ratio Technology


1
College of Electronic and Optical Engineering & College of Microelectronics, Nanjing University of Posts and Telecommunications, Nanjing 210023, China
2
Key Laboratory of Radio Frequency and Micro-Nano Electronics of Jiangsu Province, Nanjing 210023, Jiangsu, China
3
Nanjing RZisources International Trading Co., Ltd., Nanjing 210019, Jiangsu, China
*
Authors to whom correspondence should be addressed.
Sensors 2019, 19(10), 2400; https://doi.org/10.3390/s19102400
Submission received: 24 April 2019
/
Revised: 18 May 2019
/
Accepted: 21 May 2019
/
Published: 26 May 2019
(This article belongs to the Section Optical Sensors)
Abstract
:We report a new method for detecting variable resistance during short time intervals by using an optical method. A novel variable-resistance sensor composed of up-conversion nanoparticles (NaYF4:Yb3+,Er3+) and reduced graphene oxide (RGO) is designed based on characteristics of a negative temperature coefficient (NTC) resistive element. The fluorescence intensity ratio (FIR) technology based on green and red emissions is used to detect variable resistance. Combining the Boltzmann distributing law with Steinhart–Hart equation, the FIR and relative sensitivity SR as a function of resistance can be defined. The maximum value of SR is 1.039 × 10⁻³/Ω. This work reports a new method for measuring variable resistance based on the experimental data from fluorescence spectrum.
1. Introduction
The resistor is a passive two-terminal electrical component with a major physical feature of converting electrical energy into thermal energy [1,2], which implements electrical resistance as a circuit element. The resistance value of an ideal resistive element whose current–voltage characteristic curve is linear is not changed with the voltage or current [3]. Nevertheless, a practical resistor in an electronic circuit exhibits non-linear behavior especially for some special resistive elements such as thermistors, varistors, and sensitive components [3,4,5,6]. Generally, the fixed resistance is easily measured. However, it is very hard to detect resistance with the high-frequency change in electronic devices during a short time interval. It is necessary to explore a new method to detect variable resistance during short time intervals.
Optical temperature sensing based on the fluorescence intensity ratios (FIR) has been reported as a fast-time response approach to detect the temperature in nanometer scale [7,8,9]. The relation between temperature and FIR can be obtained by fitting the FIR of thermally coupled levels at different temperature points [10,11,12]. The heat will be generated when the current flows through the resistance [13]. If this kind of heat can be detected by the FIR technology, and the relation between temperature and resistance can be determined, the variable resistance will be detected by the FIR technology. In this case, it is necessary to design composite materials that can emit luminescence as a resistive element.
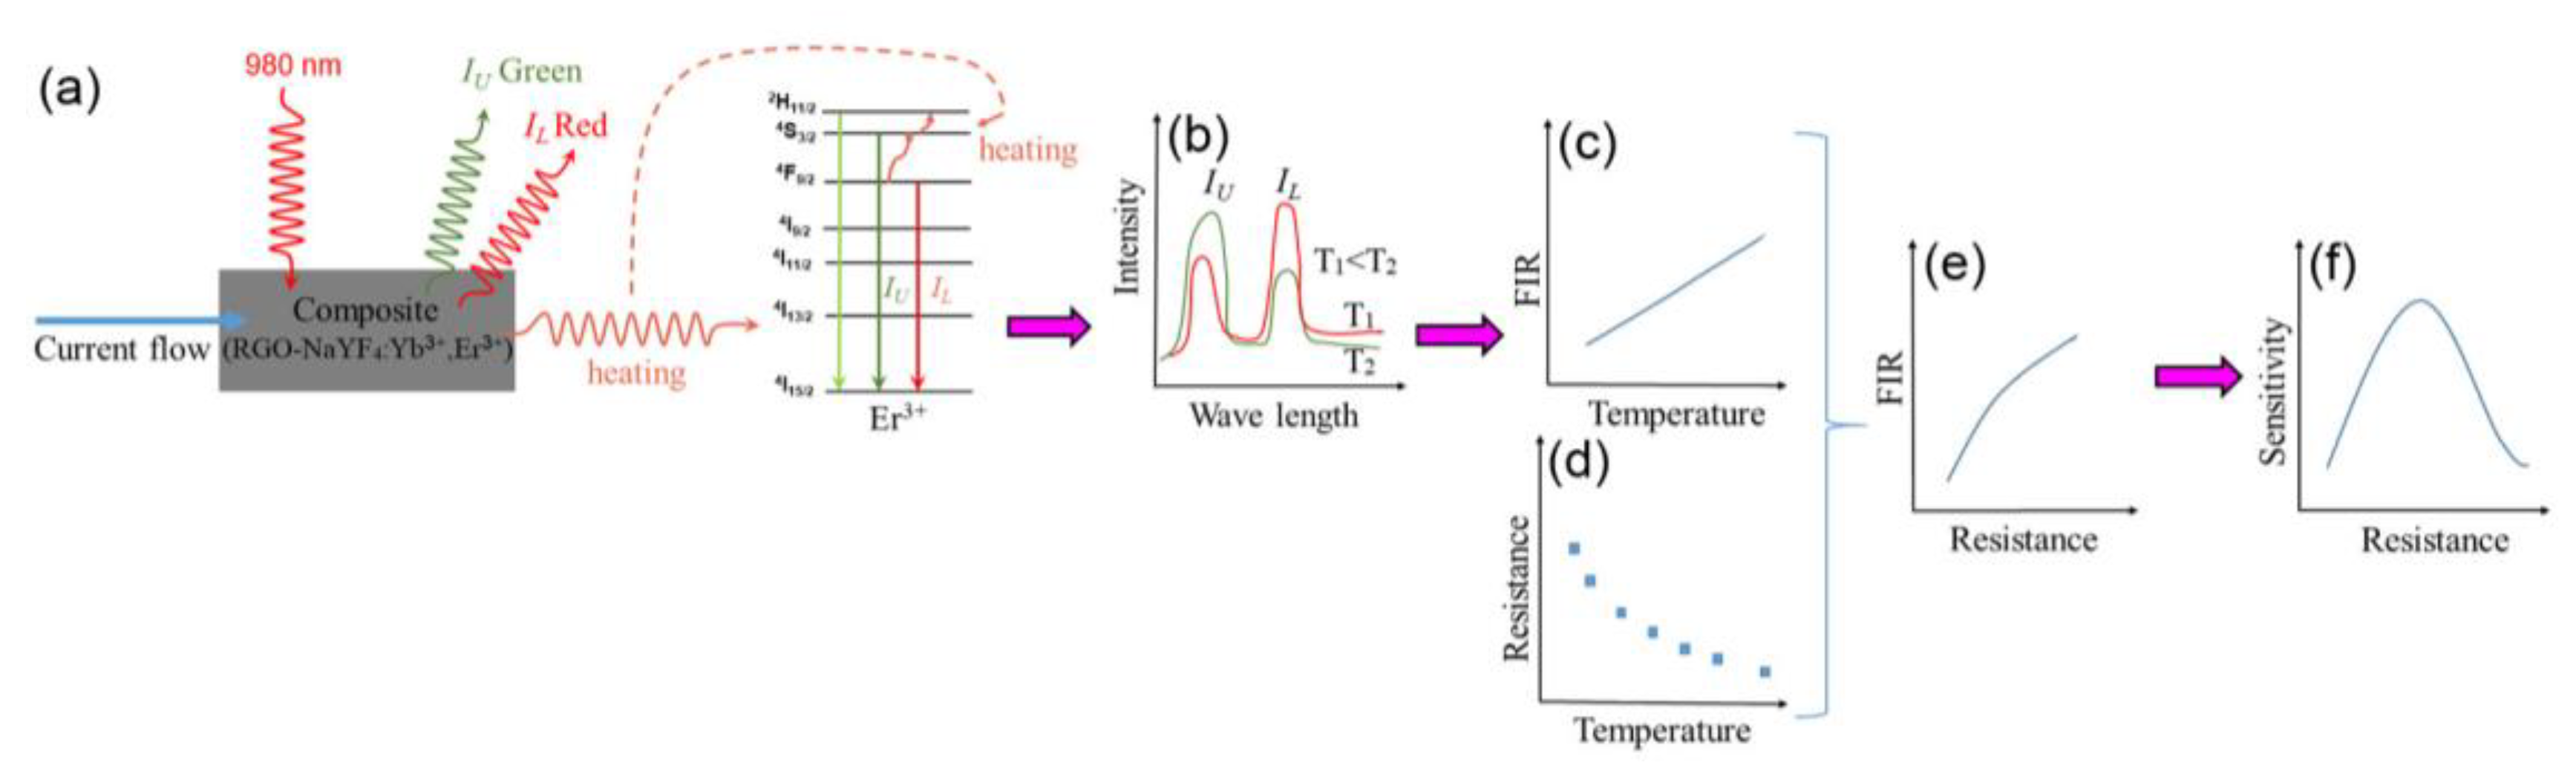
It has been widely reported that the lanthanide-ion doped NaYF4 with low phonon energy is the most commonly used optimal host material in up-conversion applications, since the nonradiative relaxation can be restrained efficiently [14,15]. Recently, the NaYF4:Yb3+,Er3+ fluoride nanomaterials have been reported for applications in biological imaging, solar cells, anti-counterfeiting, and optical sensors as multi-color phosphors [15,16,17,18,19,20]. It was found that reduced graphene oxide (RGO) with outstanding carrier mobility and high surface-to-volume ratio had been applied in material science, energy, and biomedicine [21,22]. The composite material composed of RGO and NaYF4:Yb3+,Er3+ will show bi-functional properties such as fluorescence and negative temperature coefficient (NTC) resistive element [23,24,25]. Since the fluorescence features of NaYF4:Yb3+,Er3+ are various, and the conductive characteristics of RGO can be affected by external disturbance of composite on account of its low density state surrounding the Dirac point [22], the resistance of composite material (RGO-NaYF4:Yb3+,Er3+) will be detected by using the spectrum property of NaYF4:Yb3+,Er3+ nanoparticles. In this paper, we design the composite nanomaterial (RGO-NaYF4:Yb3+,Er3+) as a variable-resistance sensor. The theoretical analysis process for detecting variable resistance by FIR technology is proposed, as shown in Figure 1. Since the current flowing the composite (RGO-NaYF4:Yb3+,Er3+) changes, the generated Joule heat changes and the adjacent energy levels (the upper level and lower level) of Er3+ can be thermally populated and depopulated in the photoluminescence process (Figure 1a). Therefore, the fluorescence intensity of IU and IL will change upon 980 nm excitation (Figure 1b). The FIR between IU and IL will change regularly and the temperature dependent FIR can be obtained according to Boltzmann distributing law [10,11,12], as shown in Figure 2c. The relation between temperature and resistance can be obtained from dependence of resistance on temperature according to Steinhart–Hart formula [23,24,25] in Figure 2d. Based on the above analysis, the FIR and relative sensitivity as a function of resistance can be derived, as shown in Figure 2e,f. Thus the variable resistance can be detected by FIR technology.
It is frequently reported to calibrate parameters such as humidity [26], strain and gas through calculating composites’ changing resistance [27,28,29]. However, the resistance is rarely measured by other parameters not to mention optical parameters. Compared with contact methods for traditional resistance measurement such as voltammetry, wheatstone bridge, and kelvin bridge [30,31], the FIR technology proposed in this study realizes non-contact survey and contributes to detecting fluctuating resistance significantly. Therefore, combining optical properties and measurement of resistance is of extreme significance and value, which contributes to expanding applications of optoelectronic devices.
2. Materials and Methods
Starting materials included hydrochloric acid (AR), Er2O3 (99.99%), Yb2O3 (99.99%), Y2O3 (99.99%), NaF (AR), NaOH (AR), ethanol (AR), oleic acid (AR), and graphene oxide (GO). All the chemicals were used as received without any further purification. RGO-NaYF4:Yb3+,Er3+ composite was synthesized via a typical solvothermal procedure [32,33,34]. The Y2O3, Yb2O3, and Er2O3 were dissolved in hydrochloric acid and then heated to evaporate the water completely, which was dissolved in deionized water to obtain the stock solution of YCl3, YbCl3, and ErCl3 (0.5 mol/L). The homogeneous precursor solution was obtained through dissolving 210 mg of NaOH by 6.5 ml of deionized water, and adding sequentially 13 ml of absolute ethanol and 3.5 ml of oleic acid with continuous stirring for 15 min, then mixing consecutively 1.5 ml of 2 mg/ml GO dispersion solution and 1 ml of aqueous solution (0.5 mol/L) of 78% YCl3, 20% YbCl3, and 2% ErCl3 under agitation for 30 min. Subsequently, 252 mg of NaF was dissolved in 10 ml of deionized water, which was added into the above solution dropwise with vigorous stirring. Following agitating and then ultrasonicating for 30 min respectively to mix thoroughly. The mixed solution was transferred to a 100 ml of Teflon-lined autoclave, sealed, and heated at 200 °C for 10 h. Than the deposited product was collected after cooling to room temperature naturally, and gathered by consecutive washing with ethanol and centrifugation several times, then dried in air at 60 °C. In order to realize high conductivity of the composite, the conductive composite (RGO-NaYF4:Yb3+,Er3+) was achieved through heating under a nitrogen atmosphere at 700 °C for 30 min with heating and cooling rate of 5 °C/min.
The middle part of indium tin oxide (ITO) conductive glass substrate was etched to interrupted circuit, then cleaned with acetone and dried prior to use. The mixed solution of homogeneous dispersion was prepared by dispersing powder of the RGO-NaYF4:Yb3+,Er3+ composite into N-Methyl-2-pyrrolidone (NMP) solution and carrying out ultrasonication for 1 h. The composite sensing film on ITO glass substrate was achieved by drop coating the dispersion with micropipette, then annealed at 80 °C for 1h to remove the solvent. The two leads of copper wires were attached with silver paste on both sides of the film, and annealed at 90 °C for 30 min to obtain curing of electrical contacts. Thus, a resistance element as a sensor device was fabricated.
3. Results and Discussion
3.1. Experimental Device and Spectral Measurement
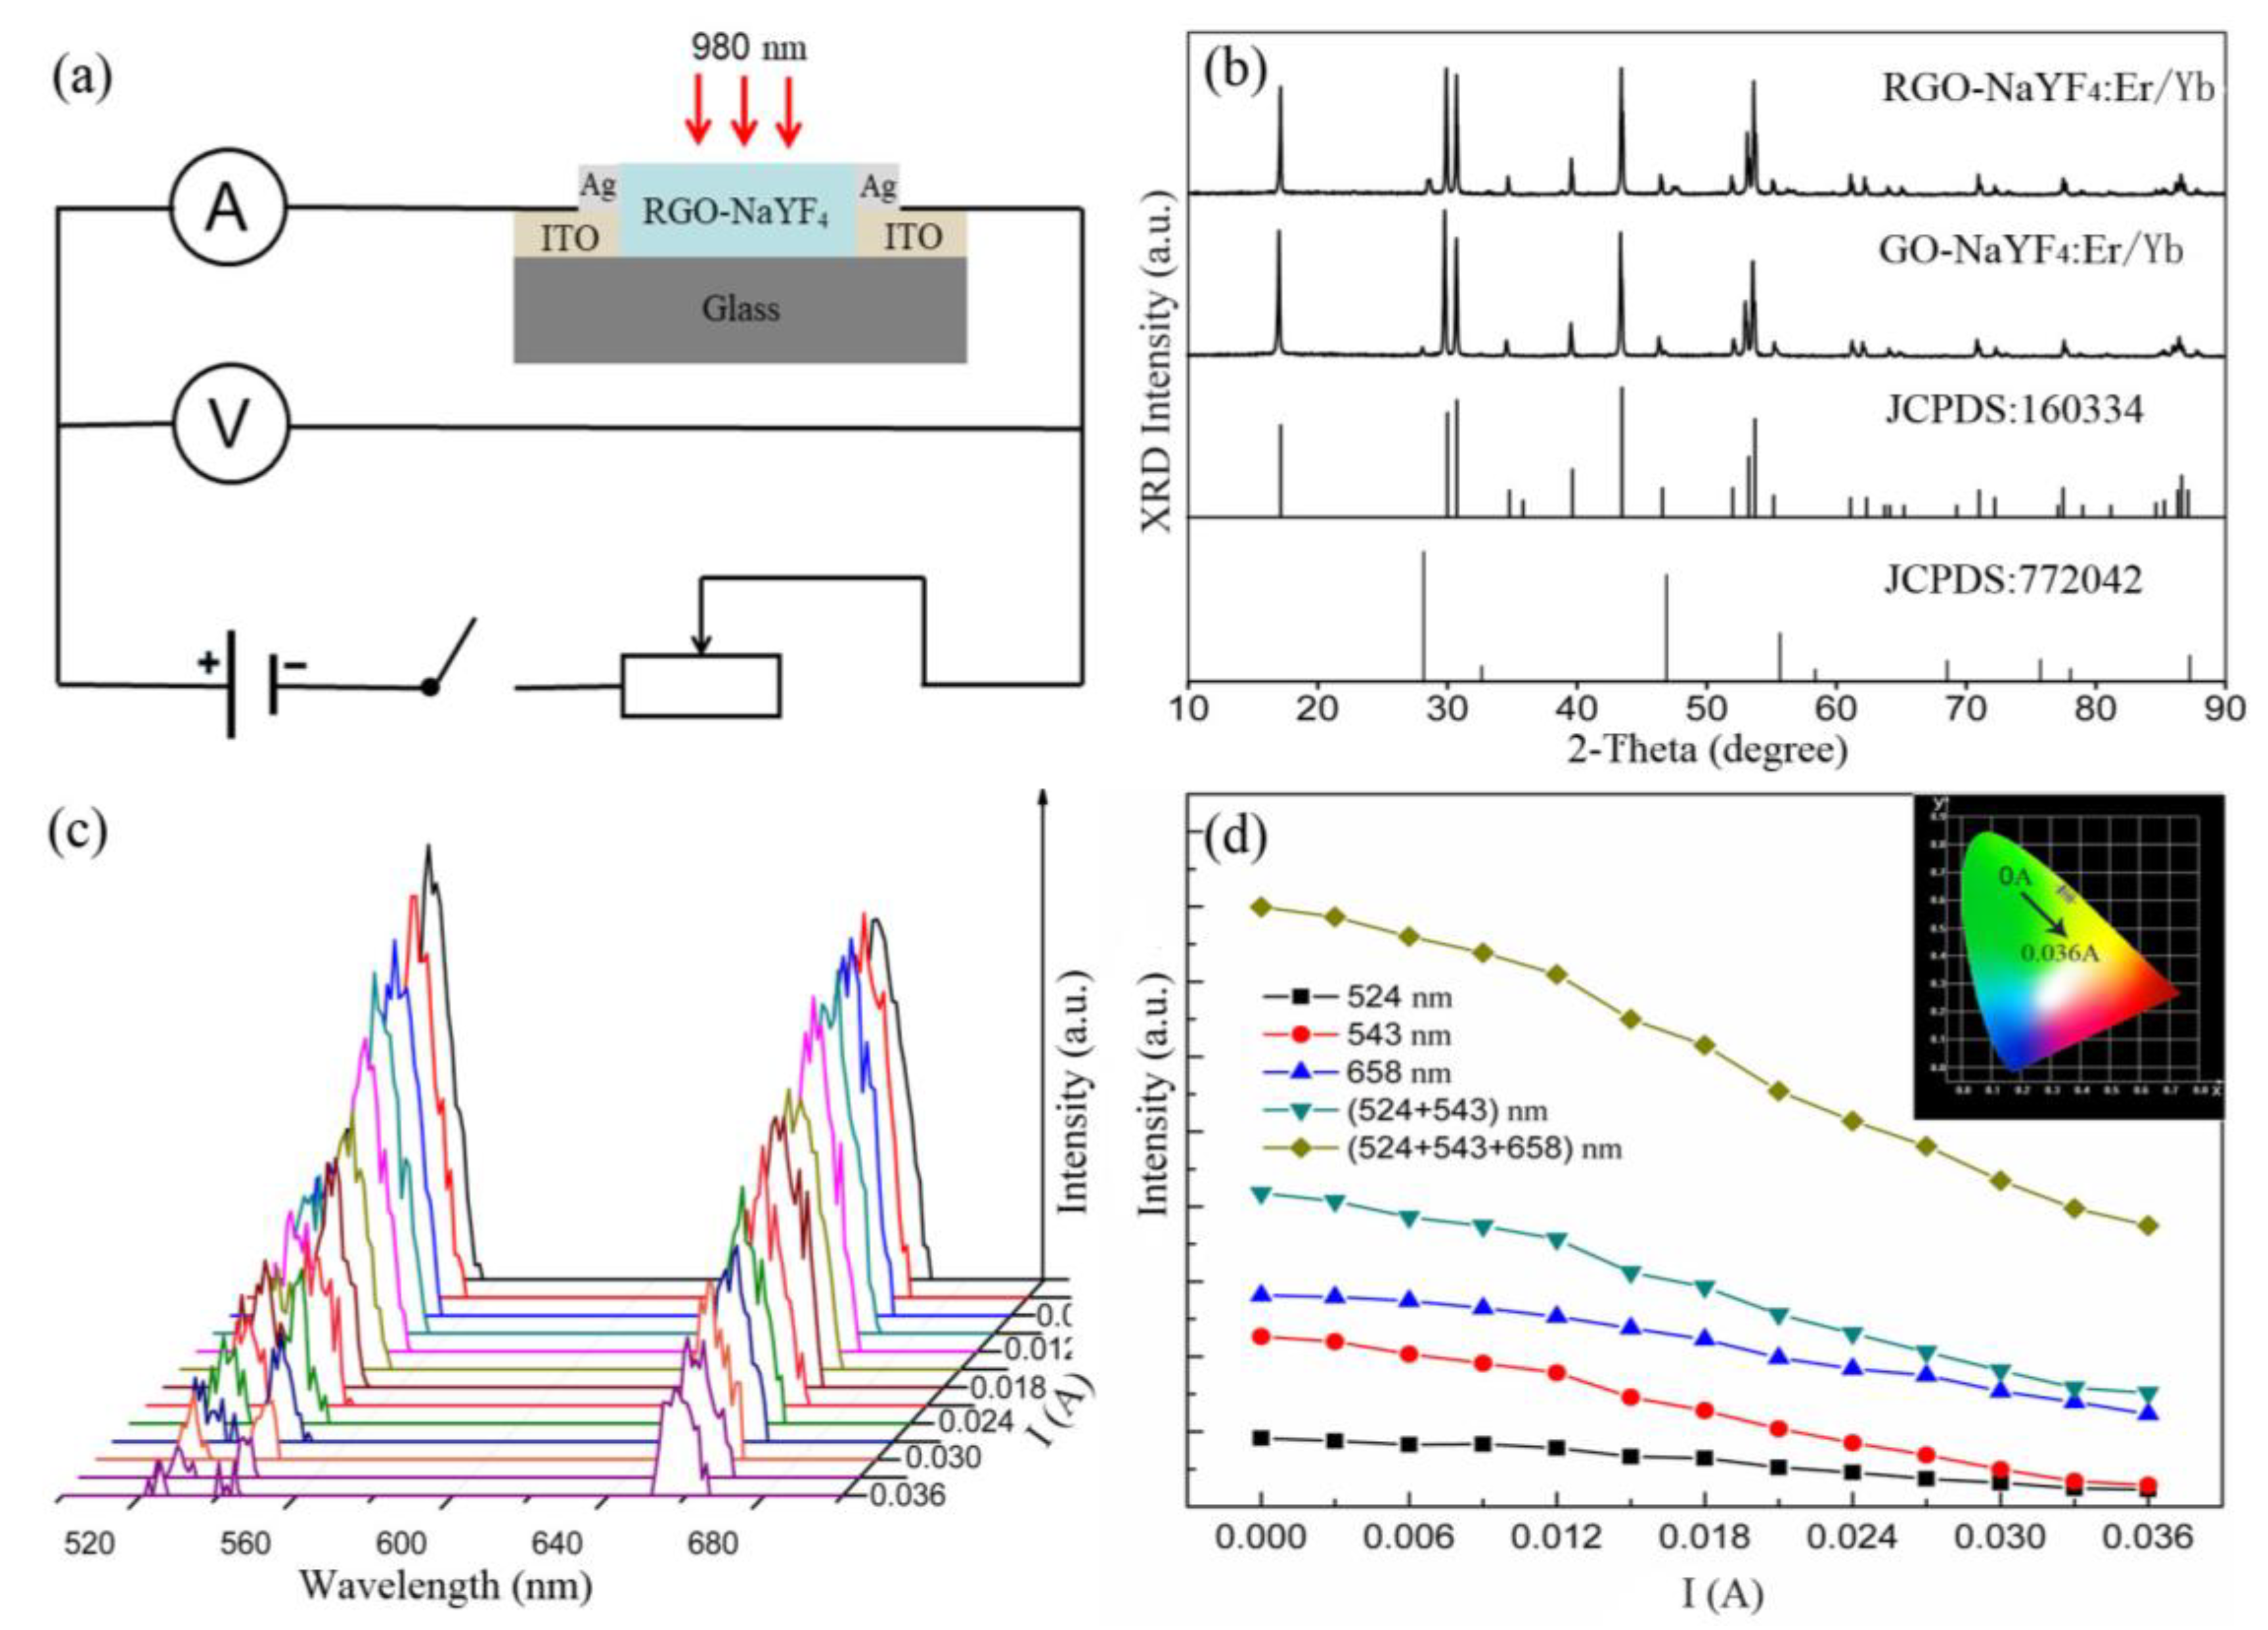
In order to study the performance quality of the variable-resistance sensor device, the measurement circuit is set up, as shown in Figure 2a. The sensor, irradiated by a fixed excitation source (980 nm), is connected to a series circuit composed solely of power supply, switch, sliding rheostat, voltmeter, and ammeter. The X-ray diffraction (XRD) patterns of GO-NaYF4:Yb3+,Er3+ and RGO-NaYF4:Yb3+,Er3+ as-prepared materials, show that the location and relative strengths of the diffraction peaks are capable of indexing to hexagonal (JCPDS Card no. 160334) and cubic (JCPDS Card no. 772042) mixed phase NaYF4 [35,36], as shown in Figure 2b. The up-conversion (UC) photoluminescence spectra of the sensor was measured with varying current under a fixed pump power (160.8 mW/mm2), among which, three emission bands were respectively ascribed to 2H11/2→4I15/2 (524 nm), 4S3/2→4I15/2 (543 nm), and 4F9/2→4I15/2 (658 nm) transitions of Er3+ ions [37,38,39], as depicted in Figure 2c. The luminescence intensity of three UC emission bands decreased with the increasing current, as described in Figure 2d. The CIE chromaticity in the inset of Figure 2d displays that the emission color transforms from green to greenish-yellow with the current intensity increasing. It means that the spectra and resistance of sensor are dependent on the current. In this process, the Joule heat will be generated.
3.2. Detecting Resistance Based on the FIR of 543 nm/524 nm
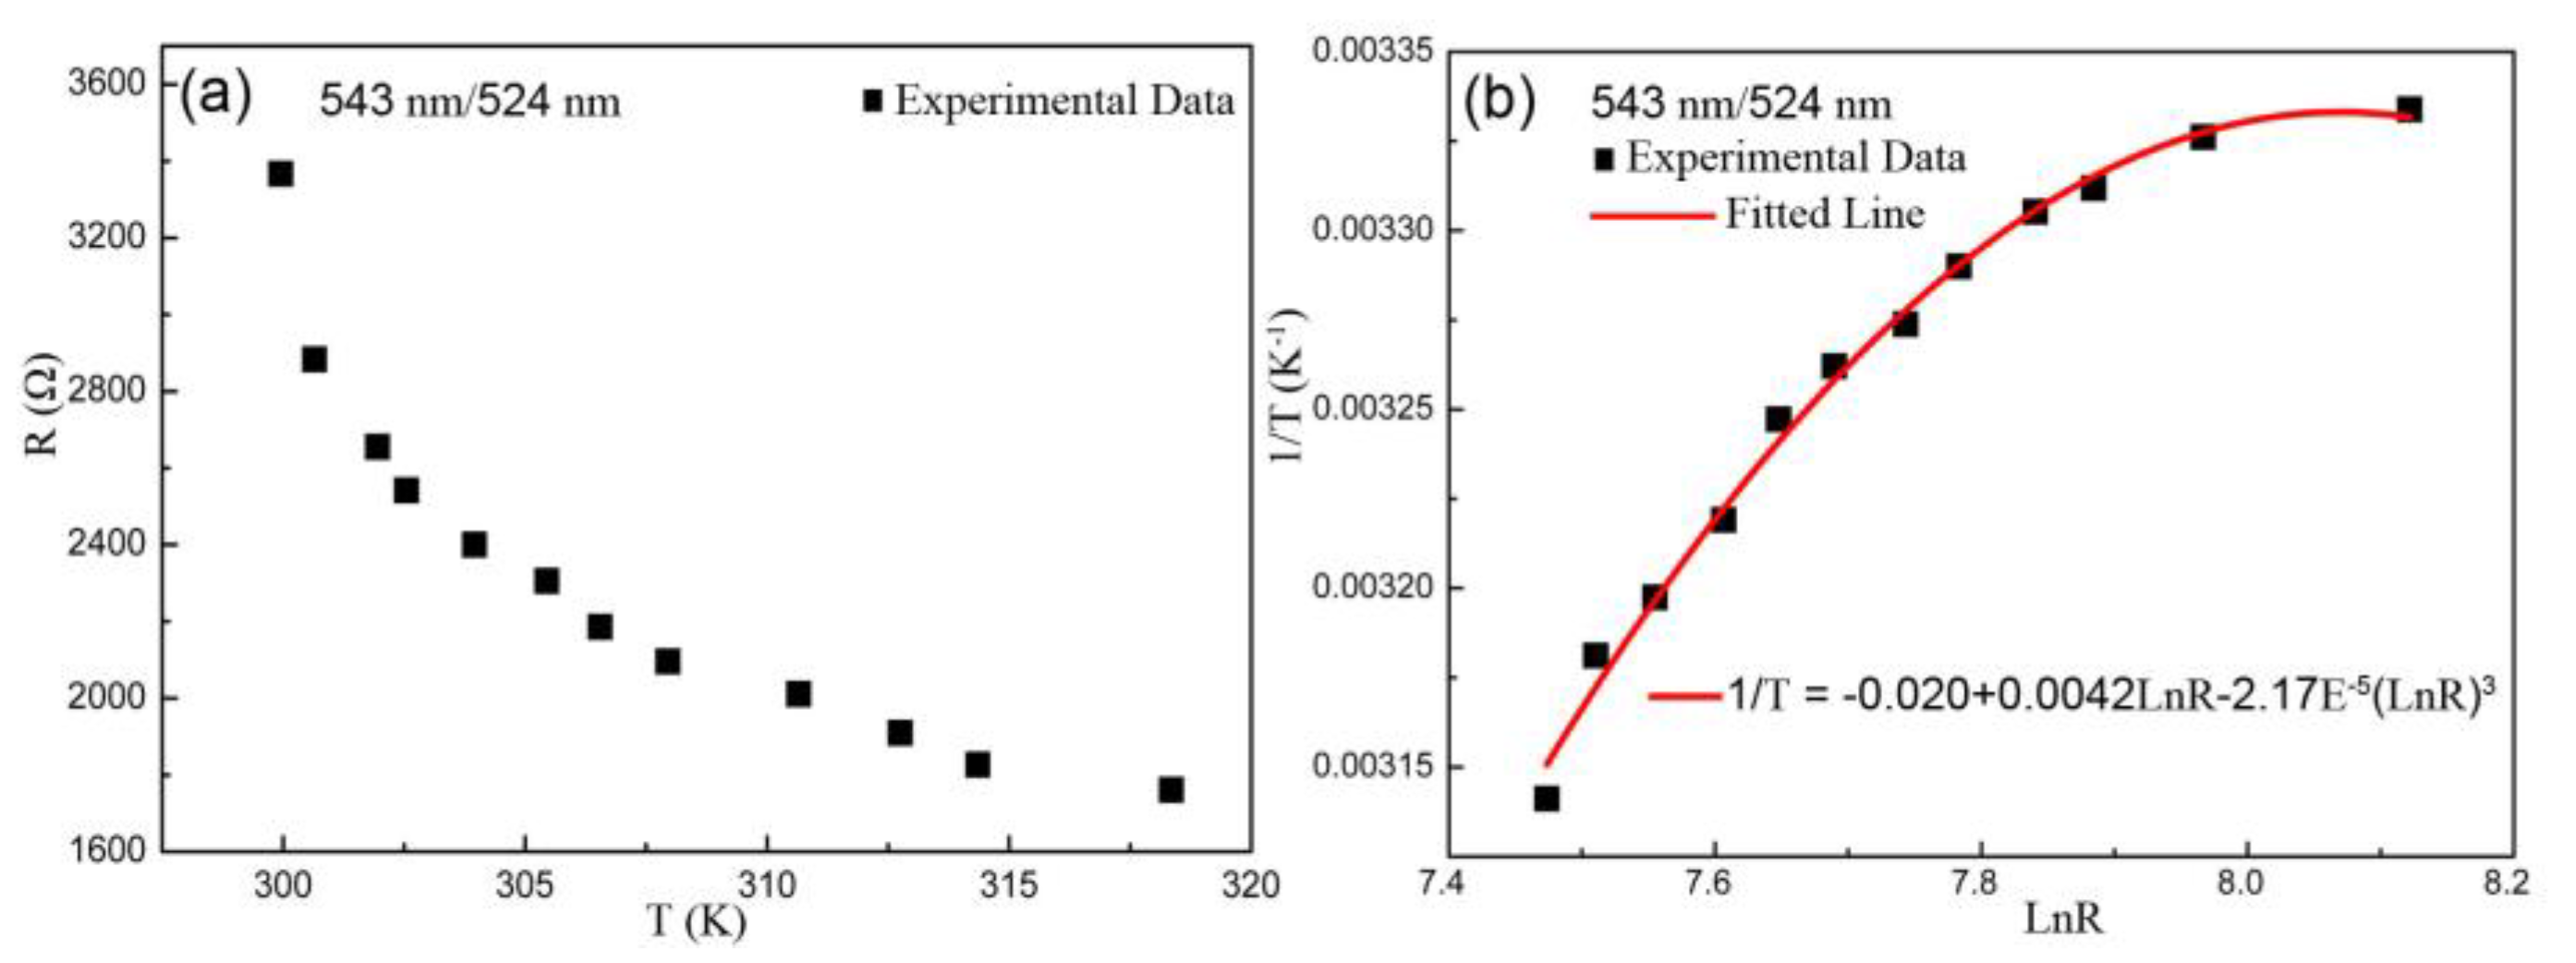
Since the current produces Joule heat resulting in temperature variation [40], it can be observed that the resistance decreases monotonically with increasing temperature based on experimental data from Figure 3a. Specifically, the experimental values of temperature–resistance exhibited a typical NTC performance [24], which follows the empirical formula of thermistor named Steinhart-Hart equation:
where T is in kelvin unit, R is the value of resistance, A, B and C are the fitted coefficients of curve. Based on the ratio of 543 nm/524 nm, the fitted curve of LnR dependent 1/T obtained according to Equation (1) was in good agreement with experimental values, and the coefficients of the Steinhart–Hart equation were: A = −0.02, B = 0.0042, C = −2.17E−5, as shown in Figure 3b.
The voltage across the variable-resistance sensor device is alterable through adjusting the sliding rheostat at a fixed voltage in a circuit, which makes the current change (between 0 A and 0.036 A). The voltage affects the flow of the electrons through the resistance which affects the Joule heat generated in the resistance and results in temperature variation [41]. The FIR results from thermalization and it follows the Boltzmann distribution. The FIR of 543 nm/524 nm will be adjusted by the Joule heat. According to former studies [10,11,12], the FIR of two thermally coupled levels of 4S3/2 and 2H11/2 can be expressed as a function of T based on the Boltzmann distribution law as follow:
where A and B are constants, ΔE is the energy difference between thermally coupled levels, K is the Boltzmann constant and T is the absolute temperature.
Equation (2) can also be rewritten as:
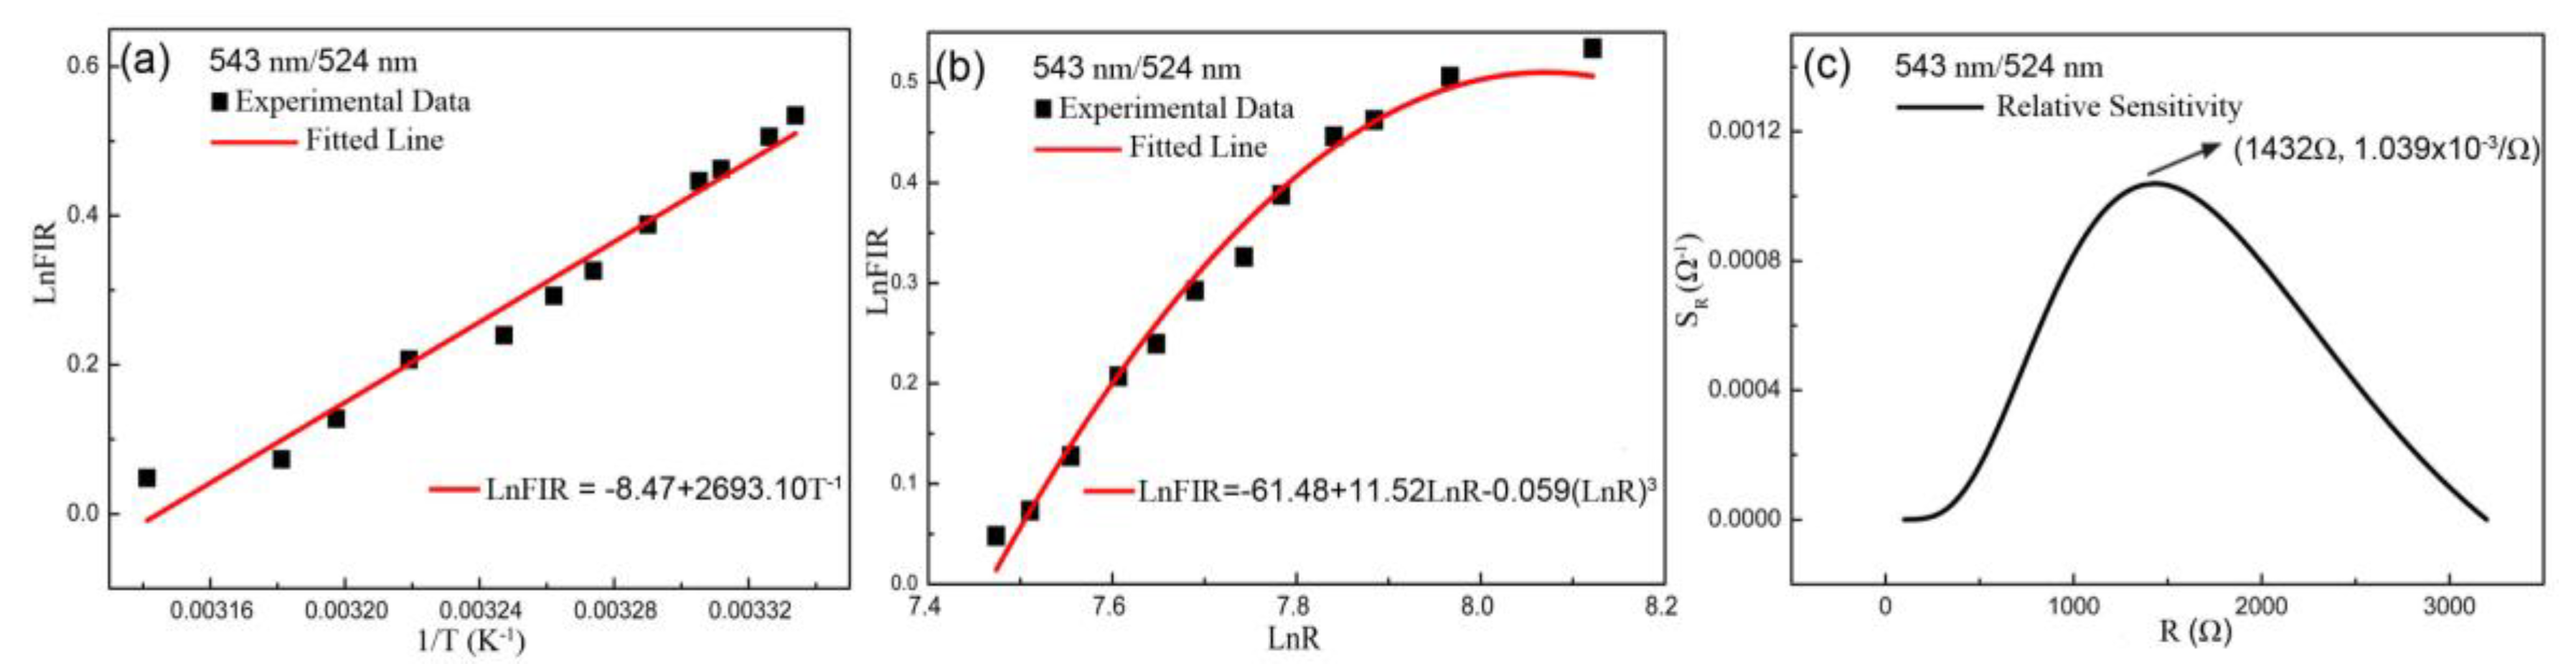
where a and b are fitted constants. The experimental points are scattered on or near the fitted linear curve of 1/T dependent LnFIR according to Equation (3), as shown in Figure 4a. One can find that the relation between the LnFIR and 1/T tends to be linear. Combining Equations (1) and (3), the relation between the FIR and R can be calculated as the following formula:
where a0, b0 and c0 are constants from fitted experimental data. Figure 4b describes that the experimental points can be well fitted by the formula in Equation (4) and LnR dependent LnFIR can be obtained.
To estimate the performance quality of variable-resistance sensor, the relative sensitivity SR as a function of R is defined as:
Figure 4c displays the curve of R dependent sensitivity SR, which increases, then decreases with the increasing R, and arrives at maximum value of 1.039 × 10⁻³/Ω at 1432 Ω. The excellent sensitivity property of the sensor is apparent.
3.3. Detecting Resistance Based on the FIR of 543 nm/658 nm
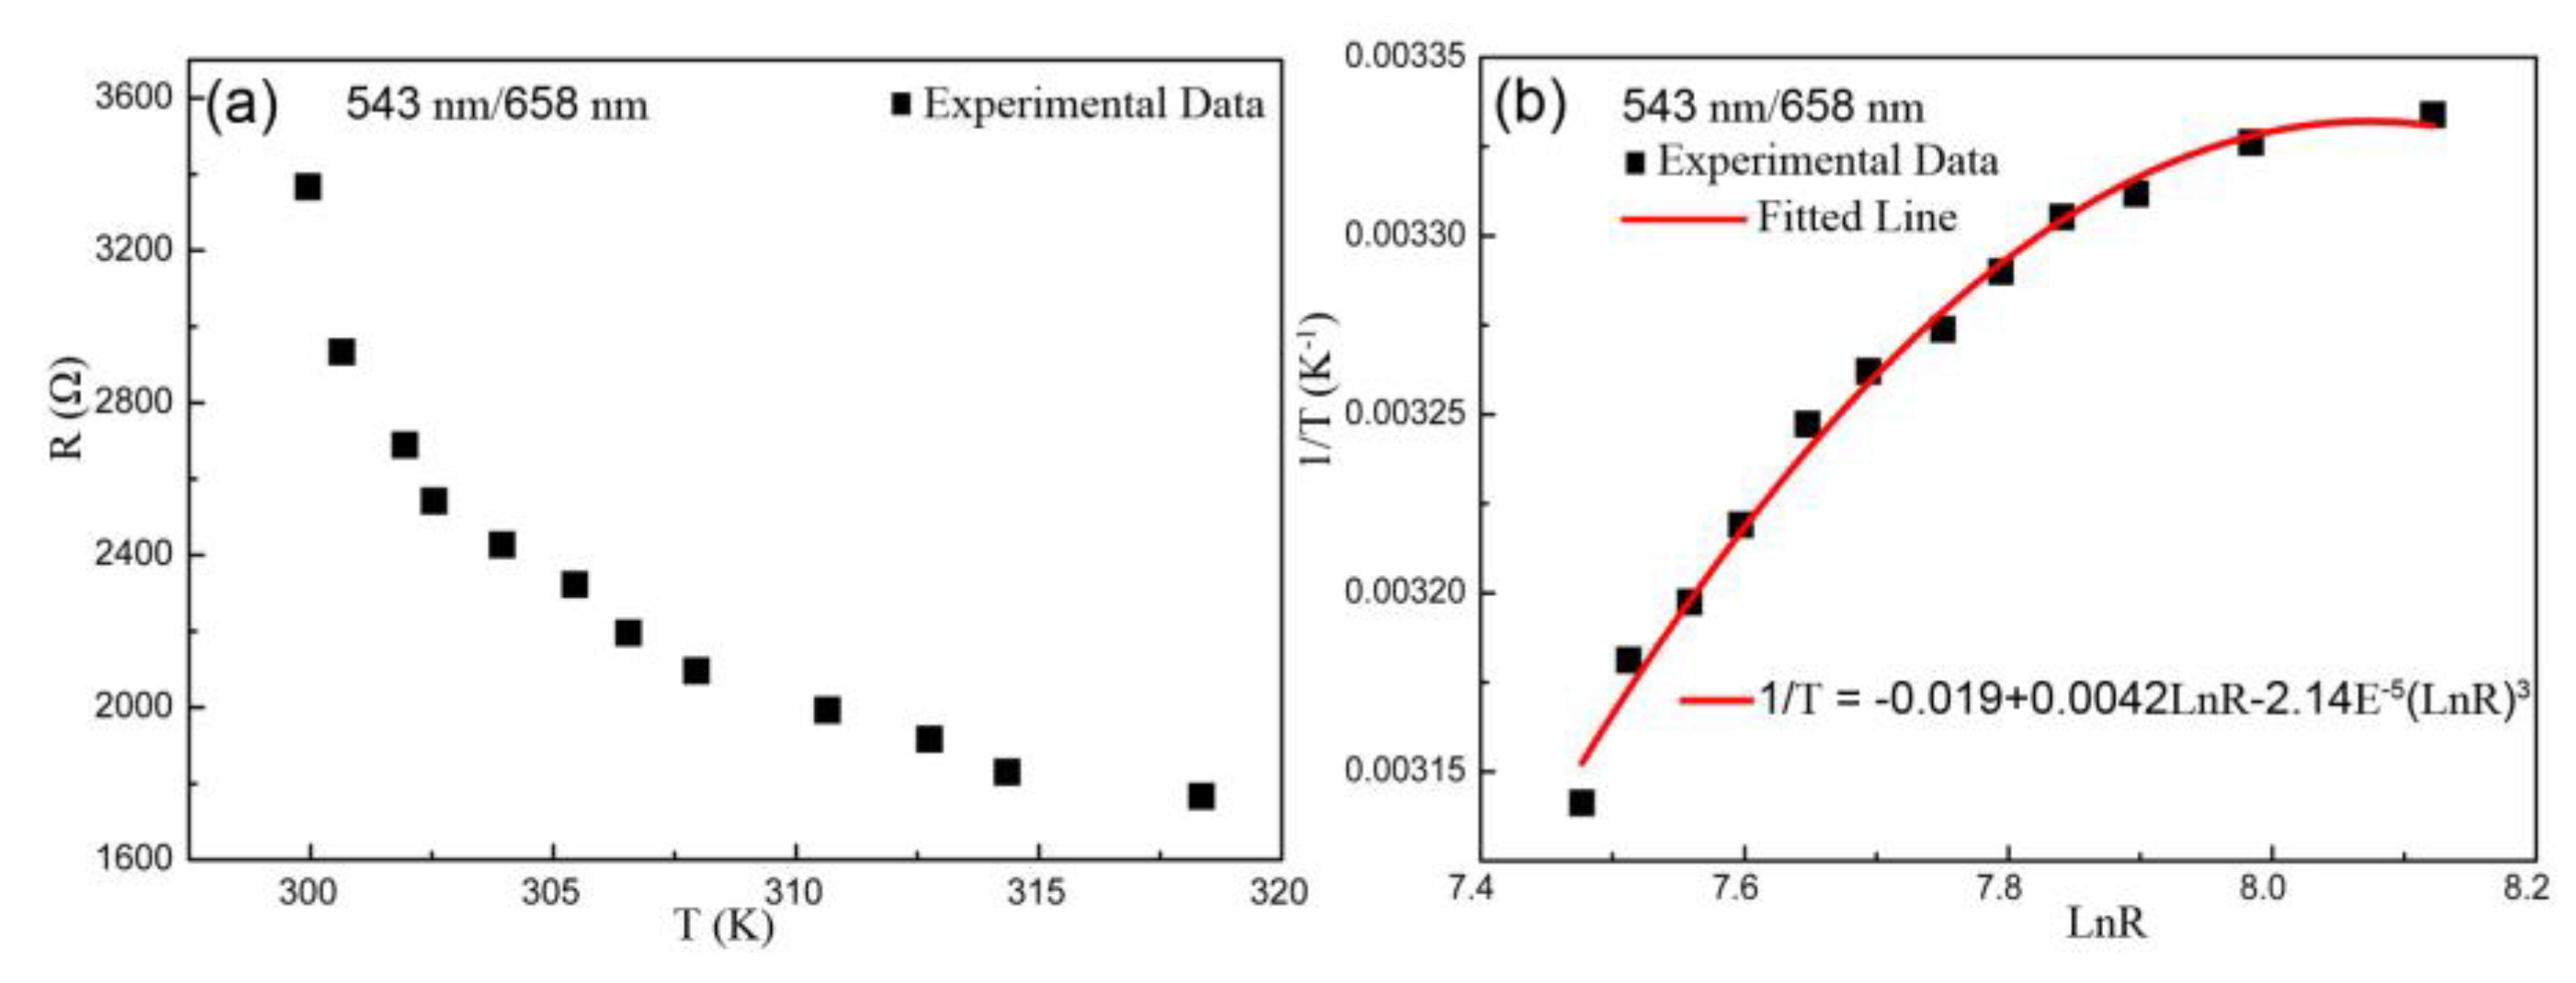
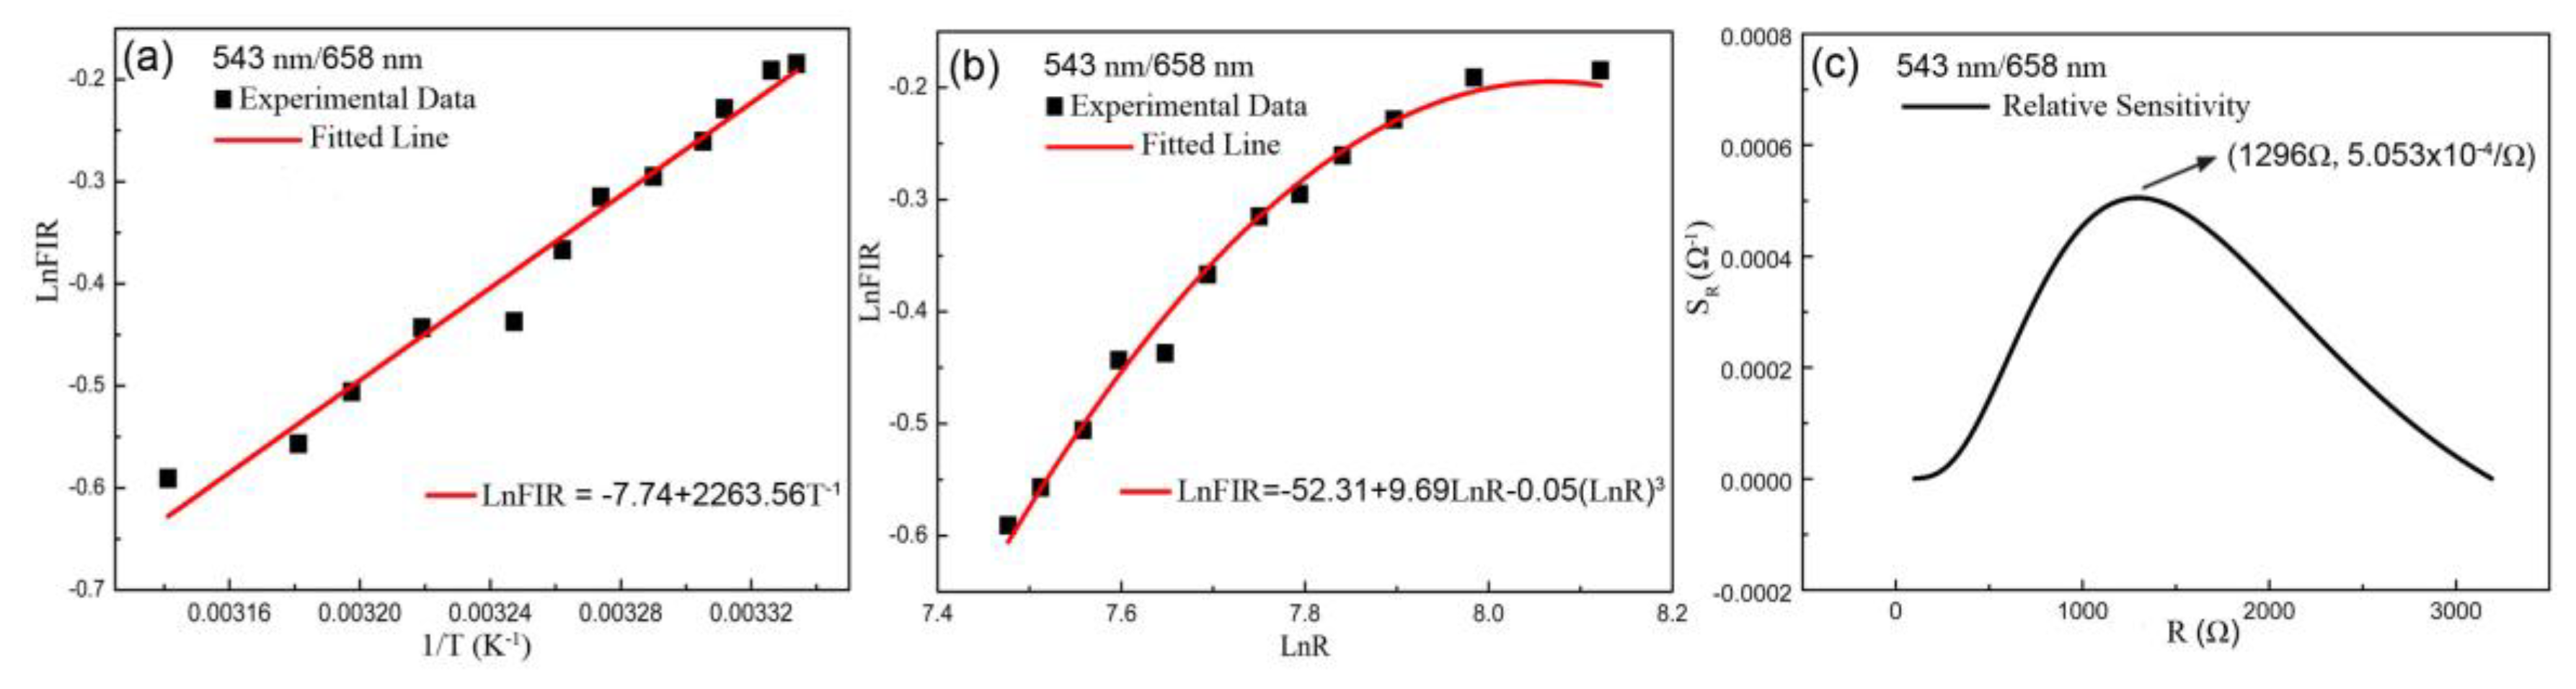
In the same theoretical analysis, it can be observed that the experimental values of temperature-resistance based on the ratio of 543 nm/658 nm still exhibits the characteristics of NTC resistance, as shown in Figure 5a. The curve of resistance-dependent temperature is fitted according to Steinhart–Hart equation in Figure 5b. The relation between 1/T and LnFIR based on the FIR of 543 nm/658nm is linear according to Boltzmann’s distribution law, as drawn in Figure 6a. The fitted curve of LnR dependent LnFIR matched well with the experimental points, as shown in Figure 6b. And the SR maximum value of 5.053 × 10⁻⁴/Ω at 1296 Ω was obtained, as shown in Figure 6c.
3.4. Sensitivity Stability of Sensor
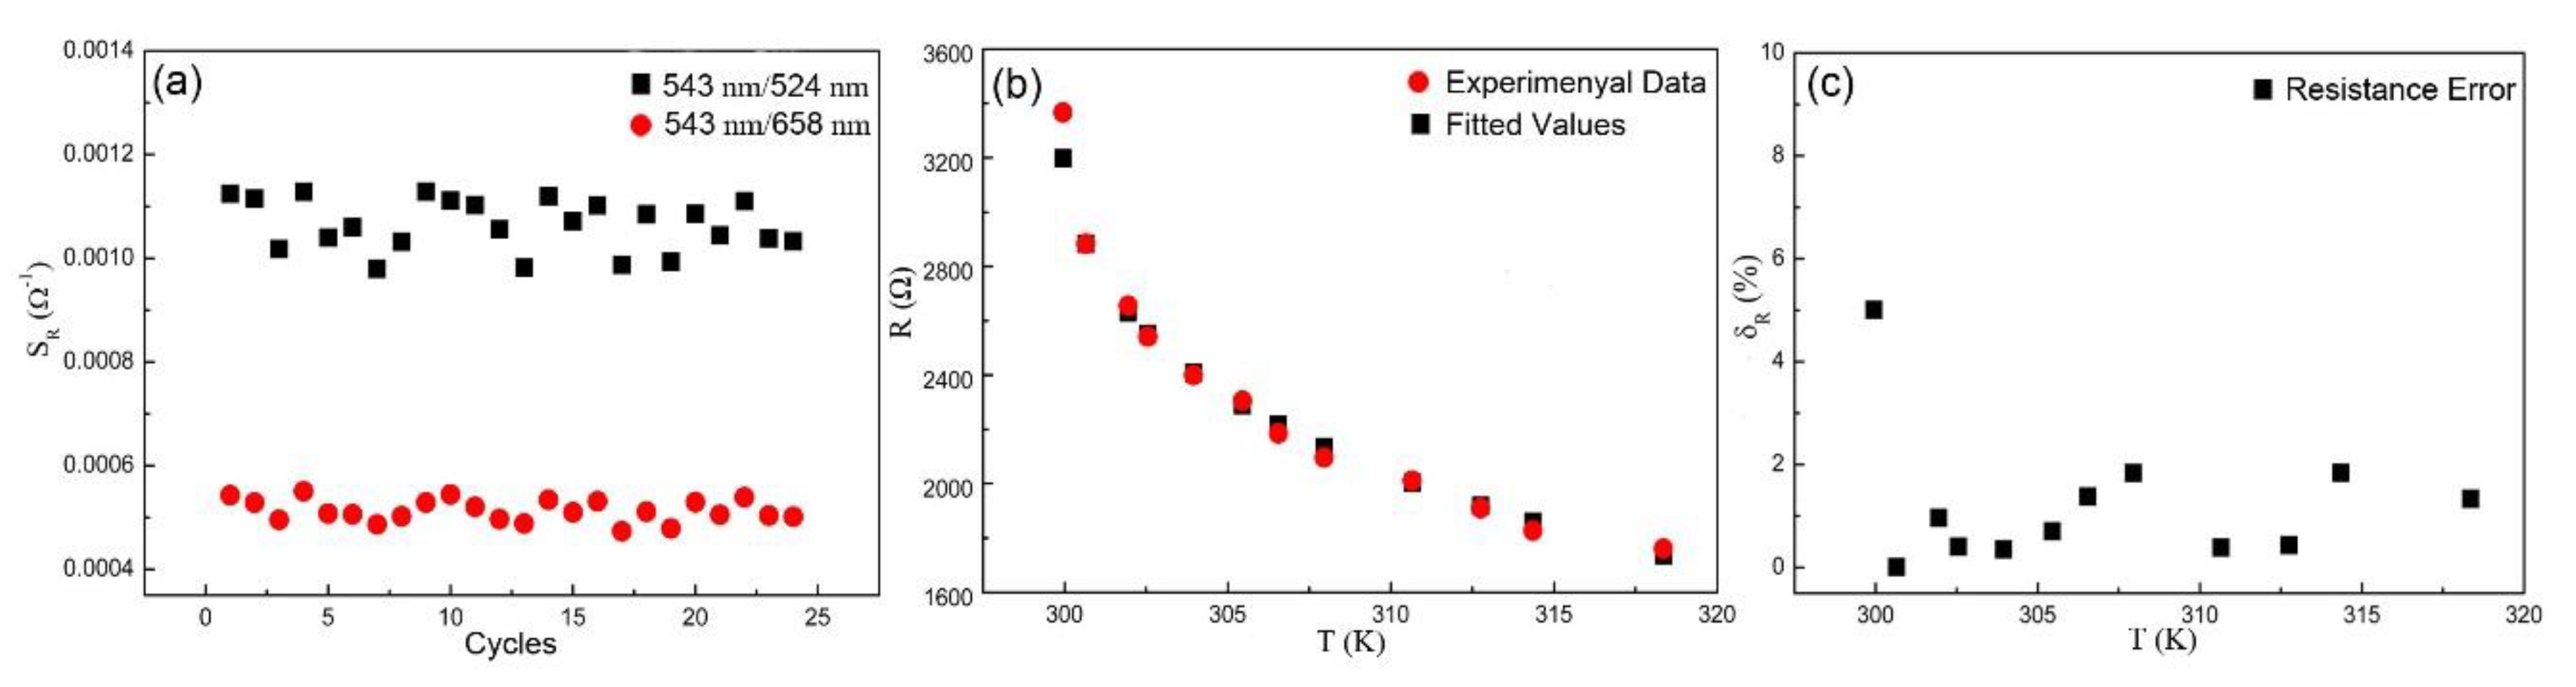
Based on the electricity behaviors of the NTC resistance related to its composition, we expect the excellent luminescence property, reproducibility, and stability of variable-resistance sensor, in view of the chemical and luminescence characteristics of the conductive composite RGO-NaYF4:Yb3+,Er3+. To investigate the sensitivity stability of the sensor, the sensitivity data of multiple sets of cyclic measurements are described in Figure 7a. Under numerous cyclic measurements, the SR based on the FIR of 543 nm/658 nm is more stable and fluctuate less. The dependence of fitted and experimental data of resistance on temperature for sensor is shown in Figure 7b. The fitted values describing the evolution of the R as a function of the T almost matches with the experimental data. To study the effect of error, the fitted values of resistance based on Steinhart–Hart equation was added, which shows a slight difference compared to experimental data. Here, we define the relative error of the resistance as δR:
where R0 is the experimental data and R is the fitted value. The temperature dependence of δR is shown in Figure 7c. It can be observed that the resistance error δR is comparatively small and stable.
4. Conclusions
In summary, since the conductive composite RGO-NaYF4:Yb3+,Er3+ synthesized through the hydrothermal method exhibited characteristics of NTC resistance and fluorescence property, a late-model variable-resistance sensor device was designed. Since the voltage affects the flow of electrons through resistance, the Joule heat is generated in this process and the temperature is variable. The LnR dependent on 1/T is investigated based on Steinhart–Hart equation. Furthermore, the 1/T dependent LnFIR is studied based on Boltzmann’s distributing law. Therefore, the FIR and SR as a function of R can be attained using the FIR technology based on green and red emissions. The maximum SR value is 1.039 × 10⁻³/Ω at 1432 Ω based on the FIR of 543 nm/524 nm. The SR based on the FIR of 543 nm/658 nm exhibits more stable cycle performance. The resistance error δR is comparatively small and stable. This work provides a novel strategy for measuring variable resistance by using an optical method during short time intervals.
Author Contributions
X.W. and X.Y., developed the idea and supervised the project; W.S., did all the synthetic experiments and performed measurements; Y.T., analyzed the structure and spectra properties. All authors discussed the results and contributed to writing the manuscript.
Funding
This study received funding from the National Natural Science Foundation of China (NSFC) (11404171), and the Jiangsu Natural Science Foundation for Excellent Young Scholar (BK20170101).
Acknowledgments
We would like to thank the National Electronic Science and Technology Experimental Teaching Demonstrating Center, and National Information and Electronic Technology Virtual Simulation Experiment Teaching Center, Nanjing University of Posts and Telecommunications, Nanjing 210023, China.
Conflicts of Interest
The authors declare no conflict of interest.
References
- Chua, L. Memristor-the missing circuit element. IEEE Trans. Circuit Theory 1971, 18, 507–519. [Google Scholar] [CrossRef]
- Strukov, D.B.; Snider, G.S.; Stewart, D.R.; Williams, R.S. The missing memristor found. Nature 2008, 453, 80. [Google Scholar] [CrossRef]
- Chua, L.O.; Desoer, C.A.; Kuh, E.S. Linear and nonlinear circuits. N. Y. McGraw-Hill 1987, 10, 277–286. [Google Scholar]
- Bueno, P.R.; Pianaro, S.A.; Pereira, E.C.; Bulhoes, L.O.S.; Longo, E.; Varela, J.A. Investigation of the electrical properties of SnO 2 varistor system using impedance spectroscopy. J. Appl. Phys. 1998, 84, 3700–3705. [Google Scholar] [CrossRef]
- Greuter, F.; Blatter, G. Electrical properties of grain boundaries in polycrystalline compound semiconductors. Semicond. Sci. Technol. 1990, 5, 111. [Google Scholar] [CrossRef]
- Vakiv, M.; Shpotyuk, O.; Mrooz, O.; Hadzaman, I. Controlled thermistor effect in the system CuxNi1–x–yCo2yMn2-yO4. J. Eur. Ceram. Soc. 2001, 21, 1783–1785. [Google Scholar] [CrossRef]
- Chen, D.; Wan, Z.; Zhou, Y.; Zhou, X.; Yu, Y.; Zhong, J.; Ding, M.; Ji, Z. Dual-phase glass ceramic: Structure, dual-modal luminescence, and temperature sensing behaviors. ACS Appl. Mater. Interfaces 2015, 7, 19484–19493. [Google Scholar] [CrossRef]
- Shi, R.; Ning, L.; Huang, Y.; Tao, Y.; Zheng, L.; Li, Z.; Liang, H. Li4SrCa (SiO4)2: Eu2+: A potential temperature sensor with unique optical thermometric properties. ACS Appl. Mater. Interfaces 2019, 11, 9691–9695. [Google Scholar] [CrossRef]
- Wang, X.D.; Wolfbeis, O.S.; Meier, R.J. Luminescent probes and sensors for temperature. Chem. Soc. Rev. 2013, 42, 7834–7869. [Google Scholar] [CrossRef]
- Xu, W.; Gao, X.; Zheng, L.; Zhang, Z.; Cao, W. An optical temperature sensor based on the upconversion luminescence from Tm3+/Yb3+ codoped oxyfluoride glass ceramic. Sens. Actuators B Chem. 2012, 173, 250–253. [Google Scholar] [CrossRef]
- Xu, W.; Gao, X.; Zheng, L.; Wang, P.; Zhang, Z.; Cao, W. Optical thermometry through green upconversion emissions in Er3+/Yb3+-codoped CaWO4 phosphor. Appl. Phys. Express 2012, 5, 072201. [Google Scholar] [CrossRef]
- Suo, H.; Hu, F.; Zhao, X.; Zhang, Z.; Li, T.; Duan, C.; Guo, C. All-in-one thermometer-heater up-converting platform YF3: Yb3+, Tm3+ operating in the first biological window. J. Mater. Chem. C 2017, 5, 1501–1507. [Google Scholar] [CrossRef]
- Saka, M.; Sun, Y.X.; Ahmed, S.R. Heat conduction in a symmetric body subjected to a current flow of symmetric input and output. Int. J. Therm. Sci. 2009, 48, 114–121. [Google Scholar] [CrossRef]
- Lee, G.; Park, Y. Lanthanide-doped upconversion nanocarriers for drug and gene delivery. Nanomaterials 2018, 8, 511. [Google Scholar] [CrossRef]
- Gong, G.; Xie, S.; Song, Y.; Tan, H.; Xu, J.; Zhang, C.; Xu, L. Synthesis of lanthanide-ion-doped NaYF4 RGB up-conversion nanoparticles for anti-counterfeiting Application. J. Nanosci. Nanotechnol. 2018, 18, 8207–8215. [Google Scholar] [CrossRef]
- Kostiv, U.; Lobaz, V.; Kučka, J.; Švec, P.; Sedláček, O.; Hrubý, M.; Horák, D. A simple neridronate-based surface coating strategy for upconversion nanoparticles: Highly colloidally stable 125I-radiolabeled NaYF4:Yb3+/Er3+@PEG nanoparticles for multimodal in vivo tissue imaging. Nanoscale 2017, 9, 16680–16688. [Google Scholar] [CrossRef] [PubMed]
- Chander, N.; Khan, A.F.; Komarala, V.K.; Chawla, S.; Dutta, V. Enhancement of dye sensitized solar cell efficiency via incorporation of upconverting phosphor nanoparticles as spectral converters. Prog. Photovolt. Prog. Photovolt. Res. Appl. 2016, 24, 692–703. [Google Scholar] [CrossRef]
- Luoshan, M.; Bai, L.; Bu, C.; Liu, X.; Zhu, Y.; Guo, K.; Zhao, X. Surface plasmon resonance enhanced multi-shell-modified upconversion NaYF4:Yb3+, Er3+@SiO2@Au@TiO2 crystallites for dye-sensitized solar cells. J. Power Sour. 2016, 307, 468–473. [Google Scholar] [CrossRef]
- Gangwar, A.K.; Gupta, A.; Kedawat, G.; Kumar, P.; Singh, B.P.; Singh, N.; Gupta, B.K. Highly luminescent dual mode polymeric nanofiber based flexible mat for white security paper and encrypted nanotaggant applications. Chem.-Eur. J. 2018, 24, 9477–9484. [Google Scholar] [CrossRef]
- Huo, L.; Zhou, J.; Wu, R.; Ren, J.; Zhang, S.; Zhang, J.; Xu, S. Dual-functional β-NaYF4: Yb3+, Er3+ nanoparticles for bioimaging and temperature sensing. Opt. Mater. Express 2016, 6, 1056–1064. [Google Scholar] [CrossRef]
- Geim, A.K.; Novoselov, K.S. The rise of graphene. Nanosci. Technol. A Collect. Rev. Nat. J. 2010, 11–19. [Google Scholar] [CrossRef]
- Kataria, M.; Yadav, K.; Haider, G.; Liao, Y.M.; Liou, Y.R.; Cai, S.Y.; Lee, H.M. Transparent, wearable, broadband, and highly sensitive upconversion nanoparticles and graphene-based hybrid photodetectors. ACS. Photonics 2018, 5, 2336–2347. [Google Scholar] [CrossRef]
- Rana, K.P.S.; Kumar, V.; Dagar, A.K.; Chandel, A.; Kataria, A. FPGA implementation of steinhart–hart equation for accurate thermistor linearization. IEEE. Sens. J. 2018, 18, 2260–2267. [Google Scholar] [CrossRef]
- Murmu, A.; Bhattacharyya, B.; Munshi, S. A synergy of voltage-to-frequency converter and continued-fraction algorithm for processing thermocouple signals. Measurement 2018, 116, 514–522. [Google Scholar] [CrossRef]
- Yu, S.H.; Choi, M.S.; Yoo, P.J.; Park, J.H.; Park, J.H.; Cho, J.H.; Lee, J.Y. Temperature sensing behavior of poly (3, 4-ethylenedioxythiophene) thin film. Synthetic. Met. 2013, 185, 52–55. [Google Scholar] [CrossRef]
- Chen, Y.; Pötschke, P.; Pionteck, J.; Voit, B.; Qi, H. Smart cellulose/graphene composites fabricated by in situ chemical reduction of graphene oxide for multiple sensing applications. J. Mater. Chem. A 2018, 6, 7777–7785. [Google Scholar] [CrossRef]
- Jeong, H.Y.; Lee, D.S.; Choi, H.K.; Lee, D.H.; Kim, J.E.; Lee, J.Y.; Choi, S.Y. Flexible room-temperature NO 2 gas sensors based on carbon nanotubes/reduced graphene hybrid films. Appl. Phys. Lett. 2010, 96, 213105. [Google Scholar] [CrossRef]
- de Vasconcelos, E.A.; Khan, S.A.; Zhang, W.Y.; Uchida, H.; Katsube, T. Highly sensitive thermistors based on high-purity polycrystalline cubic silicon carbide. Sensor Actuat. A-phys. 2000, 83, 167–171. [Google Scholar] [CrossRef]
- Li, X.; Zhang, R.; Yu, W.; Wang, K.; Wei, J.; Wu, D.; Ruoff, R.S. Stretchable and highly sensitive graphene-on-polymer strain sensors. Sci. Rep. 2012, 2, 870. [Google Scholar] [CrossRef] [Green Version]
- Gao, S.; Bao, Z.; Wang, L.; Yue, X. Comparison of voltammetry and digital bridge methods for electrical resistance measurements in wood. Comput. Electron. Agric. 2018, 145, 161–168. [Google Scholar] [CrossRef]
- Sasaki, H.; Nishinaka, H.; Shida, K. A modified Wheatstone bridge for high-precision automated resistance measurement. Jpn. J. Appl. Phys. 1987, 26, L1947. [Google Scholar] [CrossRef]
- Wu, S.; Sun, X.; Zhu, J.; Chang, J.; Zhang, S. Increasing electrical conductivity of upconversion materials by in situ binding with graphene. Nanotechnolog 2016, 27, 345703. [Google Scholar] [CrossRef]
- Li, Y.; Wang, G.; Pan, K.; Jiang, B.; Tian, C.; Zhou, W.; Fu, H. NaYF4: Er 3+/Yb 3+-graphene composites: Preparation, upconversion luminescence, and application in dye-sensitized solar cells. J. Mater. Chem. 2012, 22, 20381–20386. [Google Scholar] [CrossRef]
- Yin, M.; Wu, L.; Li, Z.; Ren, J.; Qu, X. Facile in situ fabrication of graphene–upconversion hybrid materials with amplified electrogenerated chemiluminescence. Nanoscale 2012, 4, 400–404. [Google Scholar] [CrossRef] [PubMed]
- Mai, H.X.; Zhang, Y.W.; Sun, L.D.; Yan, C.H. Size-and phase-controlled synthesis of monodisperse NaYF4:Yb, Er nanocrystals from a unique delayed nucleation pathway monitored with upconversion spectroscopy. J. Phys. Chem. 2007, 111, 13730–13739. [Google Scholar] [CrossRef]
- Yi, G.S.; Chow, G.M. Synthesis of hexagonal-phase NaYF4:Yb, Er and NaYF4:Yb, Tm nanocrystals with efficient up-conversion fluorescence. Adv. Funct. Mater. 2006, 16, 2324–2329. [Google Scholar] [CrossRef]
- Runowski, M.; Stopikowska, N.; Szeremeta, D.; Goderski, S.; Skwierczyńska, M.; Lis, S. Up-converting lanthanide fluoride core@shell nanorods for luminescent thermometry in the first and second biological windows-β-NaYF4: Yb3+, Er3+@ SiO2 temperature sensor. ACS Appl. Mater. Interfaces 2019. [Google Scholar] [CrossRef]
- Radunz, S.; Schavkan, A.; Wahl, S.; Würth, C.; Tschiche, H.R.; Krumrey, M.; Resch-Genger, U. Evolution of size and optical properties of upconverting nanoparticles during high-temperature synthesis. J. Phys. Chem. 2018, 122, 28958–28967. [Google Scholar] [CrossRef]
- Kostiv, U.; Patsula, V.; Noculak, A.; Podhorodecki, A.; Větvička, D.; Poučková, P.; Horák, D. Phthalocyanine-conjugated upconversion NaYF4:Yb3+/Er3+@SiO2 nanospheres for NIR-triggered photodynamic therapy in a tumor mouse model. ChemMedChem 2017, 12, 2066–2073. [Google Scholar] [CrossRef] [PubMed]
- Kang, Y.; Yang, C.; Huang, X. Joule heating induced transient temperature field and its effects on electroosmosis in a microcapillary packed with microspheres. Langmuir 2005, 21, 7598–7607. [Google Scholar] [CrossRef]
- Ghosh, S. Fundamentals of Electrical and Electronics Engineering, 2nd ed.; Asoke, K., Ghosh, Eds.; PHI Learning Private Limited: New Delhi, India, 2007; ISBN 978-81-203-3299-7. [Google Scholar]
Figure 1.
Schematic illustration of the mechanism of detecting variable resistance by fluorescence intensity ratios (FIR) technology. (a) Mechanism diagram of sensing under infrared excitation and current flow. (b) Fluorescence intensity. (c) The fitted curve of temperature dependent FIR based on Boltzmann distribution law. (d) Dependence of resistance on temperature. (e) The fitted curve of resistance dependent FIR. (f) Dependence of sensitivity on resistance.

Figure 2.
Experimental device and spectral measurement. (a) Schematic illustration of the experimental setup (including structures of variable-resistance sensor device). (b) The X-ray diffraction (XRD) patterns of composites GO-NaYF4:Yb3+,Er3+ and RGO-NaYF4:Yb3+,Er3+. (c) Current dependent luminescence spectra of the composite. (d) Fluorescence intensity of three up-conversion (UC), green and total emissions.

Figure 3.
Plots of the ratio of 543 nm/524 nm including (a) the resistance–temperature experimental values, and (b) the fitted curve of resistance dependent temperature based on Steinhart–Hart formula.
Figure 3.
Plots of the ratio of 543 nm/524 nm including (a) the resistance–temperature experimental values, and (b) the fitted curve of resistance dependent temperature based on Steinhart–Hart formula.

Figure 4.
Plots of the ratio of 543 nm/524 nm including (a) the fitted curve of temperature-dependent FIR based on Boltzmann’s distribution law, (b) the fitted curve of resistance dependent FIR, and (c) the curve of resistance dependent relative sensitivity SR.
Figure 4.
Plots of the ratio of 543 nm/524 nm including (a) the fitted curve of temperature-dependent FIR based on Boltzmann’s distribution law, (b) the fitted curve of resistance dependent FIR, and (c) the curve of resistance dependent relative sensitivity SR.

Figure 5.
Plots of the ratio of 543 nm/658 nm including (a) the resistance–temperature experimental data, and (b) the fitted curve of resistance dependent temperature based on Steinhart–Hart formula.
Figure 5.
Plots of the ratio of 543 nm/658 nm including (a) the resistance–temperature experimental data, and (b) the fitted curve of resistance dependent temperature based on Steinhart–Hart formula.

Figure 6.
Plots of the ratio of 543 nm/658 nm including (a) the fitted curve of temperature-dependent FIR based on Boltzmann distribution law, (b) the fitted curve of resistance dependent FIR, (c) the relative sensitivity SR as a function of resistance.
Figure 6.
Plots of the ratio of 543 nm/658 nm including (a) the fitted curve of temperature-dependent FIR based on Boltzmann distribution law, (b) the fitted curve of resistance dependent FIR, (c) the relative sensitivity SR as a function of resistance.

Figure 7.
Sensitivity characterization of the sensor. (a) Dependence of relative sensitivity SR on the number of cycles. (b) The fitted and experimental data points showing the dependence of the resistance on temperature. (c) Dependence of the resistance error δR on temperature.
Figure 7.
Sensitivity characterization of the sensor. (a) Dependence of relative sensitivity SR on the number of cycles. (b) The fitted and experimental data points showing the dependence of the resistance on temperature. (c) Dependence of the resistance error δR on temperature.

© 2019 by the authors. Licensee MDPI, Basel, Switzerland. This article is an open access article distributed under the terms and conditions of the Creative Commons Attribution (CC BY) license (http://creativecommons.org/licenses/by/4.0/).
Share and Cite
MDPI and ACS Style
Sheng, W.; Wang, X.; Tao, Y.; Yan, X. Detecting Variable Resistance by Fluorescence Intensity Ratio Technology. Sensors 2019, 19, 2400. https://doi.org/10.3390/s19102400
AMA Style
Sheng W, Wang X, Tao Y, Yan X. Detecting Variable Resistance by Fluorescence Intensity Ratio Technology. Sensors. 2019; 19(10):2400. https://doi.org/10.3390/s19102400
Chicago/Turabian StyleSheng, Wanjun, Xiangfu Wang, Yong Tao, and Xiaohong Yan. 2019. "Detecting Variable Resistance by Fluorescence Intensity Ratio Technology" Sensors 19, no. 10: 2400. https://doi.org/10.3390/s19102400
Note that from the first issue of 2016, this journal uses article numbers instead of page numbers. See further details here.