Hg2+-Promoted Spirolactam Hydrolysis Reaction: A Design Strategy for the Highly Selective Sensing of Hg2+ over other Metal Ions in Aqueous Media

 , , ,
, , ,  and
and
Abstract
:
1. Introduction
2. Materials and Methods
2.1. Instruments
2.2. Reagent
2.3. Computational Methodology
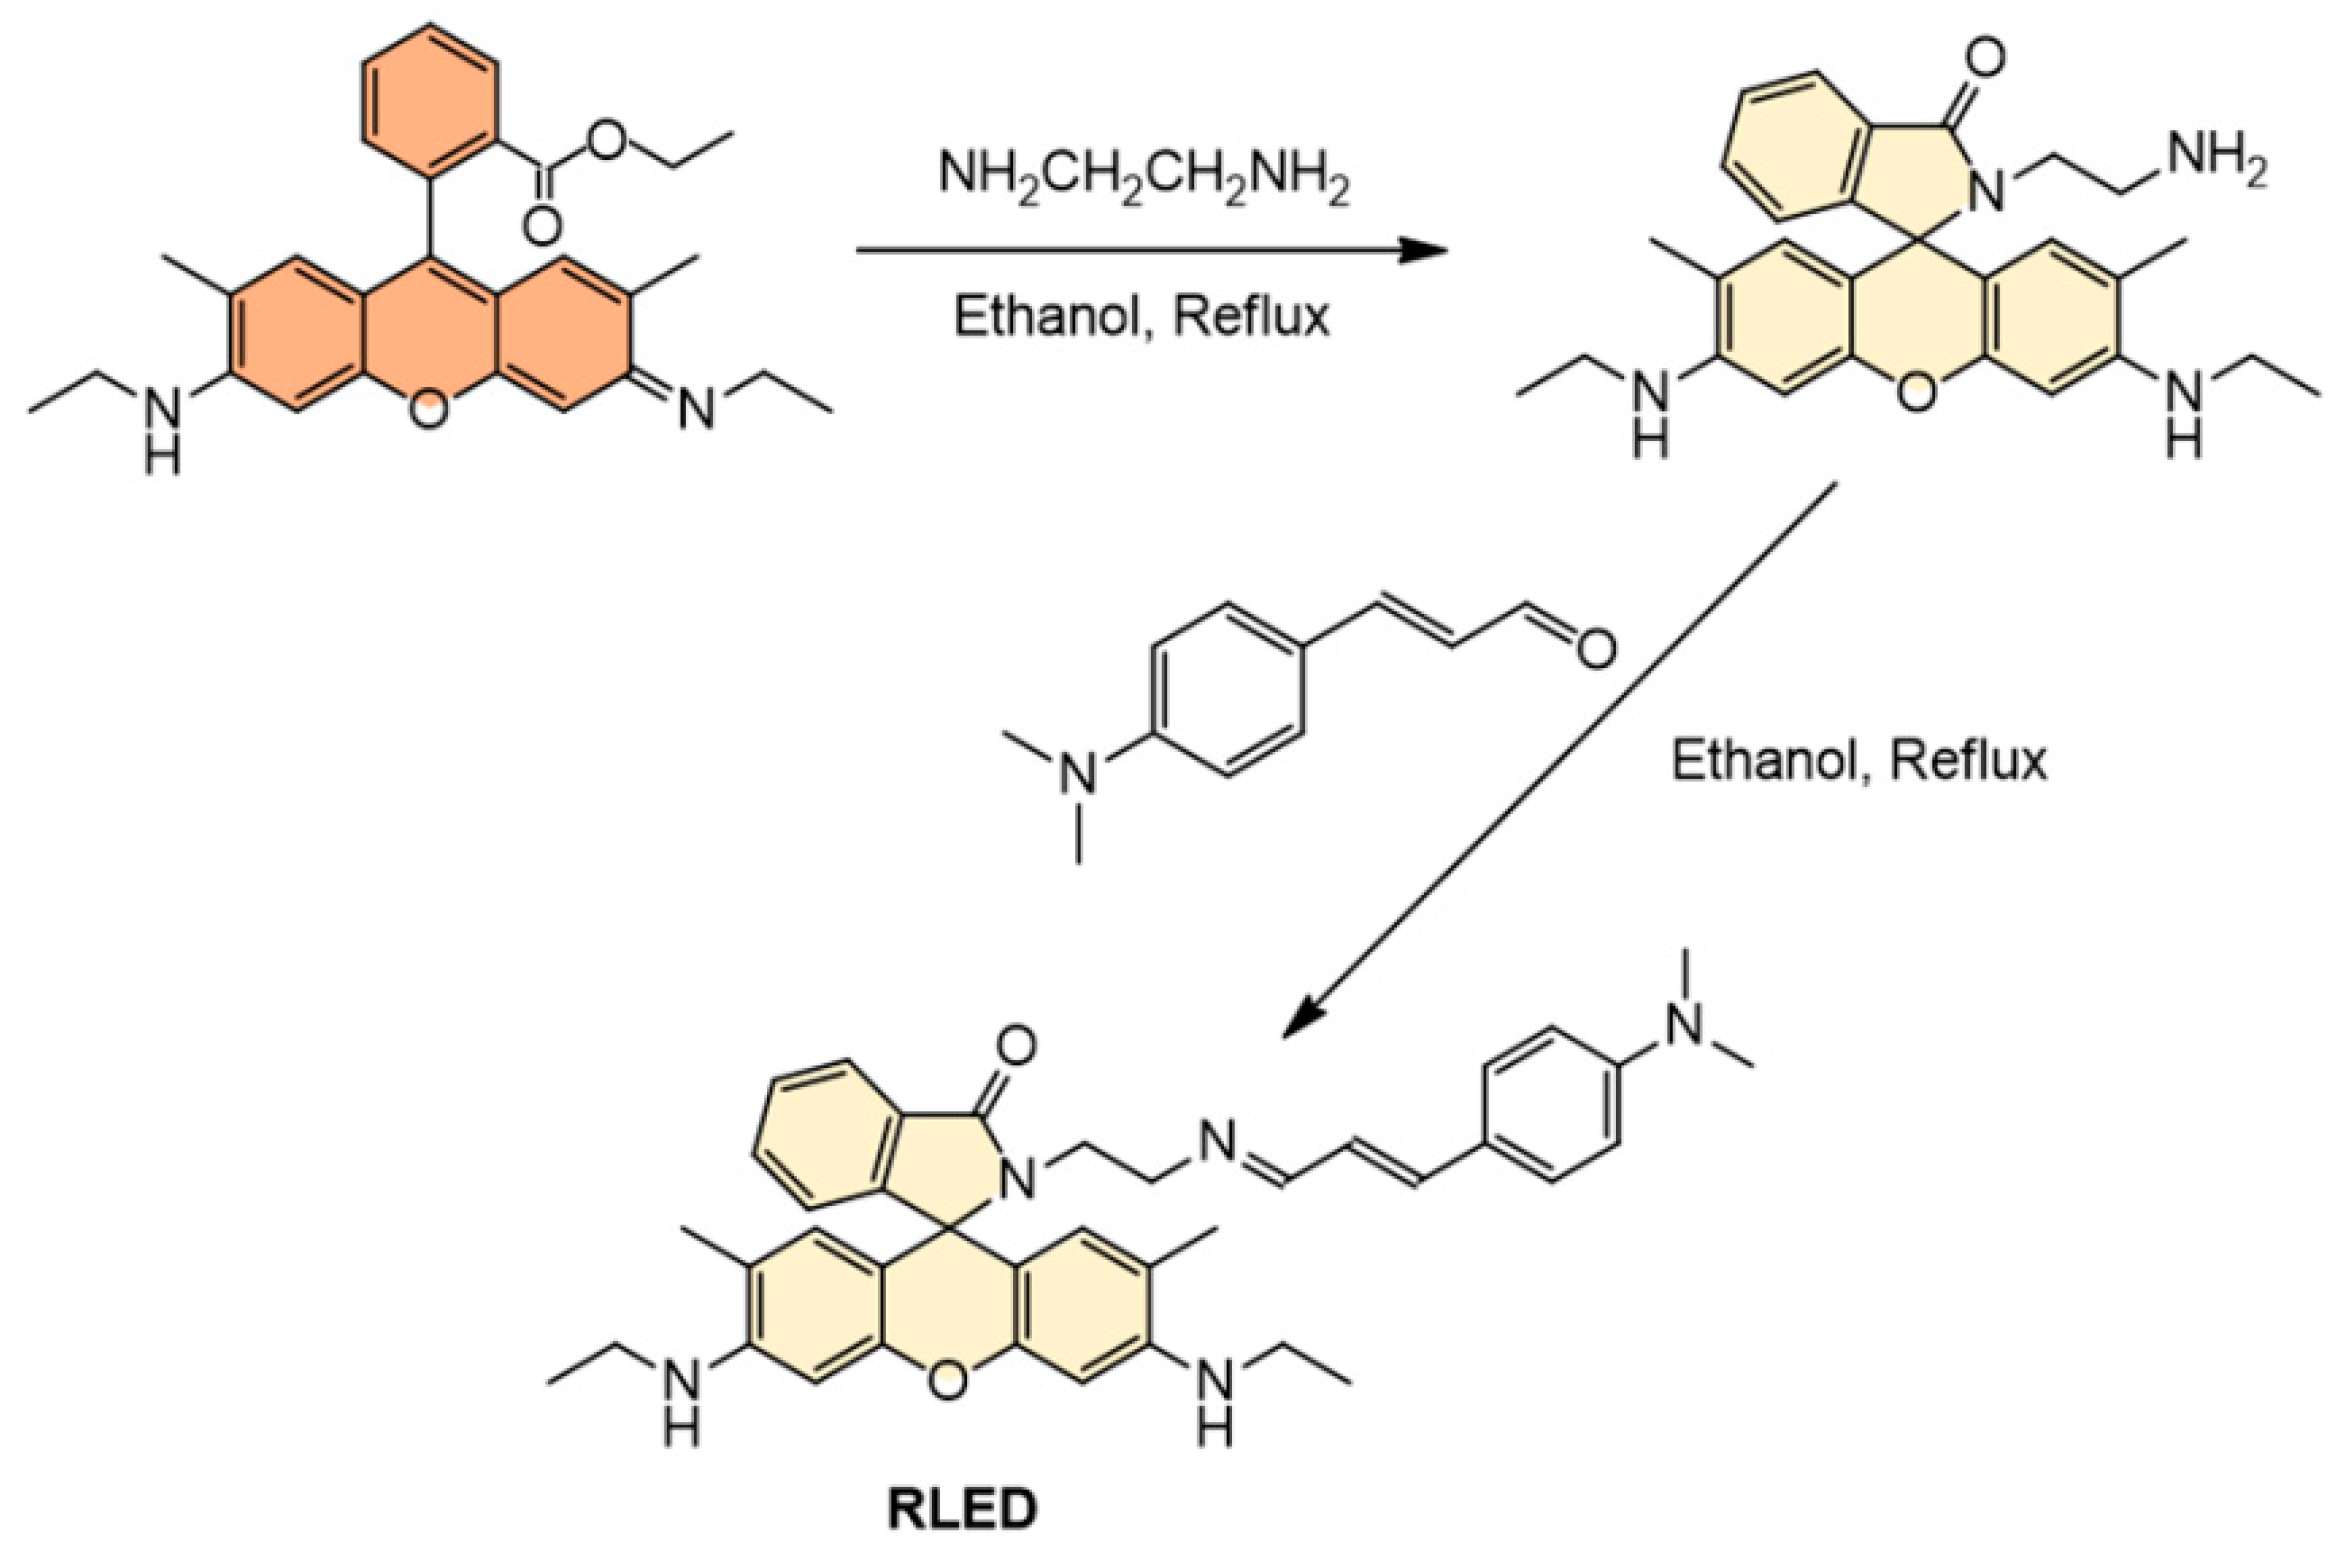
2.4. Synthesis
3. Results and Discussion
3.1. The Experimental Characterization and Application of RLED
3.2. The Theoretical Characterization and Application of RLED
4. Conclusions
Supplementary Materials
Author Contributions
Funding
Conflicts of Interest
References
- Chen, X.Q.; Nam, S.W.; Jou, M.J.; Kim, Y.; Kim, S.J.; Park, S.; Yoon, J. Hg2+ Selective Fluorescent and Colorimetric Sensor: Its Crystal Structure and Application to Bioimaging. Org. Lett. 2008, 10, 5235–5238. [Google Scholar] [CrossRef] [PubMed]
- Raikwar, M.K.; Kumar, P.; Singh, M.; Singh, A. Toxic effect of heavy metals in livestock health. Vet. World 2008, 1, 28. [Google Scholar] [CrossRef]
- Flora, S.J.S.; Mittal, M.; Mehta, A. Heavy metal induced oxidative stress & its possible reversal by chelation therapy. Indian J. Med. Res. 2008, 128, 501–523. [Google Scholar] [PubMed]
- Hien, N.K.; Quy, P.T.; Trung, N.T.; Vien, V.; Van Khanh, D.; Nhung, N.T.A.; Quang, D.T. A Dansyl–Diethylenetriamine–Thiourea Conjugate as a Fluorescent Chemodosimeter for Hg2+ Ions in Water Media. Chem. Lett. 2014, 43, 1034–1036. [Google Scholar] [CrossRef]
- Nhan, D.T.; Nhung, N.T.A.; Vien, V.; Trung, N.T.; Cuong, N.D.; Bao, N.C.; Huong, D.Q.; Hien, N.K.; Quang, D.T. A Benzothiazolium-derived Colorimetric and Fluorescent Chemosensor for Detection of Hg2+ Ions. Chem. Lett. 2017, 46, 135–138. [Google Scholar] [CrossRef]
- Quy, P.T.; Hien, N.K.; Bao, N.C.; Nhan, D.T.; Khanh, D.V.; Nhung, N.T.A.; Tung, T.Q.; Luyen, N.D.; Quang, D.T. A new rhodamine-based fluorescent chemodosimeter for mercuric ions in water media. Luminescence 2015, 30, 325–329. [Google Scholar] [CrossRef] [PubMed]
- Lee, M.H.; Wu, J.S.; Lee, J.W.; Jung, J.H.; Kim, J.S. Highly sensitive and selective chemosensor for Hg2+ based on the rhodamine fluorophore. Org. Lett. 2007, 9, 2501–2504. [Google Scholar] [CrossRef]
- Duruibe, J.O.; Ogwuegbu, M.; Egwurugwu, J. Heavy metal pollution and human biotoxic effects. Int. J. Phys. Sci. 2007, 2, 112–118. [Google Scholar]
- Ibrahim, D.; Froberg, B.; Wolf, A.; Rusyniak, D.E. Heavy metal poisoning: Clinical presentations and pathophysiology. Clin. Lab. Med. 2006, 26, 67–97. [Google Scholar] [CrossRef]
- Hien, N.K.; Bao, N.C.; Nhung, N.T.A.; Trung, N.T.; Nam, P.C.; Duong, T.; Kim, J.S.; Quang, D.T. A highly sensitive fluorescent chemosensor for simultaneous determination of Ag (I), Hg (II), and Cu (II) ions: Design, synthesis, characterization and application. Dyes Pigments 2015, 116, 89–96. [Google Scholar] [CrossRef]
- Hou, J.T.; Ren, W.X.; Li, K.; Seo, J.; Sharma, A.; Yu, X.Q.; Kim, J.S. Fluorescent bioimaging of pH: From design to applications. Chem. Soc. Rev. 2017, 46, 2076–2090. [Google Scholar] [CrossRef] [PubMed]
- Quang, D.T.; Hop, N.V.; Luyen, N.D.; Thu, H.P.; Oanh, D.Y.; Hien, N.K.; Hieu, N.V.; Lee, M.H.; Kim, J.S. A new fluorescent chemosensor for Hg2+ in aqueous solution. Luminescence 2013, 28, 222–225. [Google Scholar] [CrossRef] [PubMed]
- Jana, A.; Kim, J.S.; Jung, H.S.; Bharadwaj, P.K. A cryptand based chemodosimetric probe for naked-eye detection of mercury(II) ion in aqueous medium and its application in live cell imaging. Chem. Commun. 2009, 4417–4419. [Google Scholar] [CrossRef] [PubMed]
- Hu, J.M.; Wu, T.; Zhang, G.Q.; Liu, S.Y. Highly Selective Fluorescence Sensing of Mercury Ions over a Broad Concentration Range Based on Mixed Polymeric Micelles. Macromolecules 2012, 45, 3939–3947. [Google Scholar] [CrossRef]
- Zou, Q.; Zou, L.; Tian, H. Detection and adsorption of Hg2+ by new mesoporous silica and membrane material grafted with a chemodosimeter. J. Mater. Chem. 2011, 21, 14441–14447. [Google Scholar] [CrossRef]
- Sumiya, S.; Sugii, T.; Shiraishi, Y.; Hirai, T. A benzoxadiazole-thiourea conjugate as a fluorescent chemodosimeter for Hg(II) in aqueous media. J. Photochem. Photobiol. A Chem. 2011, 219, 154–158. [Google Scholar] [CrossRef]
- Lu, Z.J.; Wang, P.N.; Zhang, Y.; Chen, J.Y.; Zhen, S.; Leng, B.; Tian, H. Tracking of mercury ions in living cells with a fluorescent chemodosimeter under single- or two-photon excitation. Anal. Chim. Acta 2007, 597, 306–312. [Google Scholar] [CrossRef]
- Lee, M.H.; Lee, S.W.; Kim, S.H.; Kang, C.; Kim, J.S. Nanomolar Hg(II) Detection Using Nile Blue Chemodosimeter in Biological Media. Org. Lett. 2009, 11, 2101–2104. [Google Scholar] [CrossRef]
- Guo, Z.; Zhu, W.H.; Zhu, M.M.; Wu, X.M.; Tian, H. Near-Infrared Cell-Permeable Hg2+-Selective Ratiometric Fluorescent Chemodosimeters and Fast Indicator Paper for MeHg+ Based on Tricarbocyanines. Chem. Eur. J. 2010, 16, 14424–14432. [Google Scholar] [CrossRef]
- Lee, M.H.; Kim, J.S.; Sessler, J.L. Small molecule-based ratiometric fluorescence probes for cations, anions, and biomolecules. Chem. Soc. Rev. 2015, 44, 4185–4191. [Google Scholar] [CrossRef] [Green Version]
- Kim, H.N.; Ren, W.X.; Kim, J.S.; Yoon, J. Fluorescent and colorimetric sensors for detection of lead, cadmium, and mercury ions. Chem. Soc. Rev. 2012, 41, 3210–3244. [Google Scholar] [CrossRef] [PubMed]
- Yang, Y.M.; Zhao, Q.; Feng, W.; Li, F.Y. Luminescent Chemodosimeters for Bioimaging. Chem. Rev. 2013, 113, 192–270. [Google Scholar] [CrossRef] [PubMed]
- Lee, J.W.; Jung, H.S.; Kwon, P.S.; Kim, J.W.; Bartsch, R.A.; Kim, Y.; Kim, S.J.; Kim, J.S. Chromofluorescent indicator for intracellular Zn2+/Hg2+ dynamic exchange. Org. Lett. 2008, 10, 3801–3804. [Google Scholar] [CrossRef] [PubMed]
- Zhao, Y.G.; Lin, Z.H.; He, C.; Wu, H.M.; Duan, C.Y. A “turn-on” fluorescent sensor for selective Hg(II) detection in aqueous media based on metal-induced dye formation. Inorg. Chem. 2006, 45, 10013–10015. [Google Scholar] [CrossRef] [PubMed]
- Kim, H.N.; Lee, M.H.; Kim, H.J.; Kim, J.S.; Yoon, J. A new trend in rhodamine-based chemosensors: application of spirolactam ring-opening to sensing ions. Chem. Soc. Rev. 2008, 37, 1465–1472. [Google Scholar] [CrossRef] [PubMed]
- Jiang, W.; Wang, W. A selective and sensitive “turn-on” fluorescent chemodosimeter for Hg2+ in aqueous media via Hg2+ promoted facile desulfurization-lactonization reaction. Chem. Commun. 2009, 3913–3915. [Google Scholar] [CrossRef] [PubMed]
- Samb, I.; Bell, J.; Toullec, P.Y.; Michelet, V.; Leray, I. Fluorescent Phosphane Selenide as Efficient Mercury Chemodosimeter. Org. Lett. 2011, 13, 1182–1185. [Google Scholar] [CrossRef] [PubMed]
- Cheng, X.H.; Li, Q.Q.; Qin, J.G.; Li, Z. A New Approach to Design Ratiometric Fluorescent Probe for Mercury(II) Based on the Hg2+-Promoted Deprotection of Thioacetals. ACS Appl. Mater. Interfaces 2010, 2, 1066–1072. [Google Scholar] [CrossRef]
- Cheng, X.H.; Li, S.; Zhong, A.S.; Qin, J.G.; Li, Z. New fluorescent probes for mercury(II) with simple structure. Sens. Actuators B Chem. 2011, 157, 57–63. [Google Scholar] [CrossRef]
- Song, F.L.; Watanabe, S.; Floreancig, P.E.; Koide, K. Oxidation-Resistant Fluorogenic Probe for Mercury Based on Alkyne Oxymercuration. J. Am. Chem. Soc. 2008, 130, 16460–16461. [Google Scholar] [CrossRef]
- Ando, S.; Koide, K. Development and Applications of Fluorogenic Probes for Mercury(II) Based on Vinyl Ether Oxymercuration. J. Am. Chem. Soc. 2011, 133, 2556–2566. [Google Scholar] [CrossRef] [PubMed] [Green Version]
- Lee, H.; Kim, H.J. Ratiometric fluorescence chemodosimeter for mercuric ions through the Hg(II)-mediated propargyl amide to oxazole transformation. Tetrahedron Lett. 2011, 52, 4775–4778. [Google Scholar] [CrossRef]
- Du, J.J.; Fan, J.L.; Peng, X.J.; Sun, P.P.; Wang, J.Y.; Li, H.L.; Sun, S.G. A New Fluorescent Chemodosimeter for Hg2+: Selectivity, Sensitivity, and Resistance to Cys and GSH. Org. Lett. 2010, 12, 476–479. [Google Scholar] [CrossRef] [PubMed]
- Gao, Y.L.; Zhang, C.; Peng, S.W.; Chen, H.Y. A fluorescent and colorimetric probe enables simultaneous differential detection of Hg2+ and Cu2+ by two different mechanisms. Sens. Actuators B Chem. 2017, 238, 455–461. [Google Scholar] [CrossRef]
- Manna, S.; Karmakar, P.; Maiti, K.; Ali, S.S.; Mandal, D.; Mahapatra, A.K. A reactive primary fluorescence switch-on sensor for Hg2+ and the generated fluorophore as secondary recognition receptor toward Cu2+ in aqueous acetonitrile solution. J. Photochem. Photobiol. A Chem. 2017, 343, 7–16. [Google Scholar] [CrossRef]
- Becke, A.D. Density-functional thermochemistry. IV. A new dynamical correlation functional and implications for exact-exchange mixing. J. Chem. Phys. 1996, 104, 1040–1046. [Google Scholar] [CrossRef]
- Becke, A.D. Density-functional thermochemistry. III. The role of exact exchange. J. Chem. Phys. 1993, 98, 5648–5652. [Google Scholar] [CrossRef]
- Frisch, M.J.; Trucks, G.W.; Schlegel, H.B.; Scuseria, G.E.; Robb, M.A.; Cheeseman, J.R.; Scalmani, G.; Barone, V.; Petersson, G.A.; Nakatsuji, H.; et al. Gaussian 16; Gaussian, Inc.: Wallingford, CT, USA, 2016. [Google Scholar]
- Biegler-König, F. Update of the AIM2000-Program for atoms in molecules. J. Comput. Chem. 2000, 21, 1040. [Google Scholar] [CrossRef]
- Stratmann, R.E.; Scuseria, G.E.; Frisch, M.J. An efficient implementation of time-dependent density-functional theory for the calculation of excitation energies of large molecules. J. Chem. Phys. 1998, 109, 8218–8224. [Google Scholar] [CrossRef]
- Nhan, D.T.; Hien, N.K.; Duc, H.V.; Nhung, N.T.A.; Trung, N.T.; Van, D.U.; Shin, W.S.; Kim, J.S.; Quang, D.T. A hemicyanine complex for the detection of thiol biomolecules by fluorescence. Dyes Pigments 2016, 131, 301–306. [Google Scholar] [CrossRef]
- Lee, C.T.; Yang, W.T.; Parr, R.G. Development of the Colle-Salvetti Correlation-Energy Formula into a Functional of the Electron-Density. Phys. Rev. B 1988, 37, 785–789. [Google Scholar] [CrossRef]
- Koch, U.; Popelier, P.L.A. Characterization of C-H-O Hydrogen-Bonds on the Basis of the Charge-Density. J. Phys. Chem. 1995, 99, 9747–9754. [Google Scholar] [CrossRef]
- Bader, R.F.W. A Quantum-Theory of Molecular-Structure and Its Applications. Chem. Rev. 1991, 91, 893–928. [Google Scholar] [CrossRef]
- Valeur, B. Molecular Fluorescence: Principles and Applications; Wiley-VCH Verlag GmbH: Hoboken, NJ, USA, 2001. [Google Scholar]
- Hien, N.K.; Nhan, D.T.; Kim, W.Y.; Van Bay, M.; Nam, P.C.; Van, D.U.; Lim, I.T.; Kim, J.S.; Quang, D.T. Exceptional case of Kasha’s rule: Emission from higher-lying singlet electron excited states into ground states in coumarin-based biothiol sensing. Dyes Pigments 2018, 152, 118–126. [Google Scholar] [CrossRef]
- Roberts, J.D.; Caserio, M.C. Basic Principles of Organic Chemistry; WA Benjamin, Inc.: Menlo Park, CA, USA, 1977. [Google Scholar]
- Sayre, L.M.; Jacobson, A.R. Metal-Ion Catalysis of Amide Hydrolysis. Abstr. Pap. Am. Chem. Soc. 1986, 191, 1632–1635. [Google Scholar] [CrossRef]
- de Silva, A.P.; Moody, T.S.; Wright, G.D. Fluorescent PET (Photoinduced Electron Transfer) sensors as potent analytical tools. Analyst 2009, 134, 2385–2393. [Google Scholar] [CrossRef]


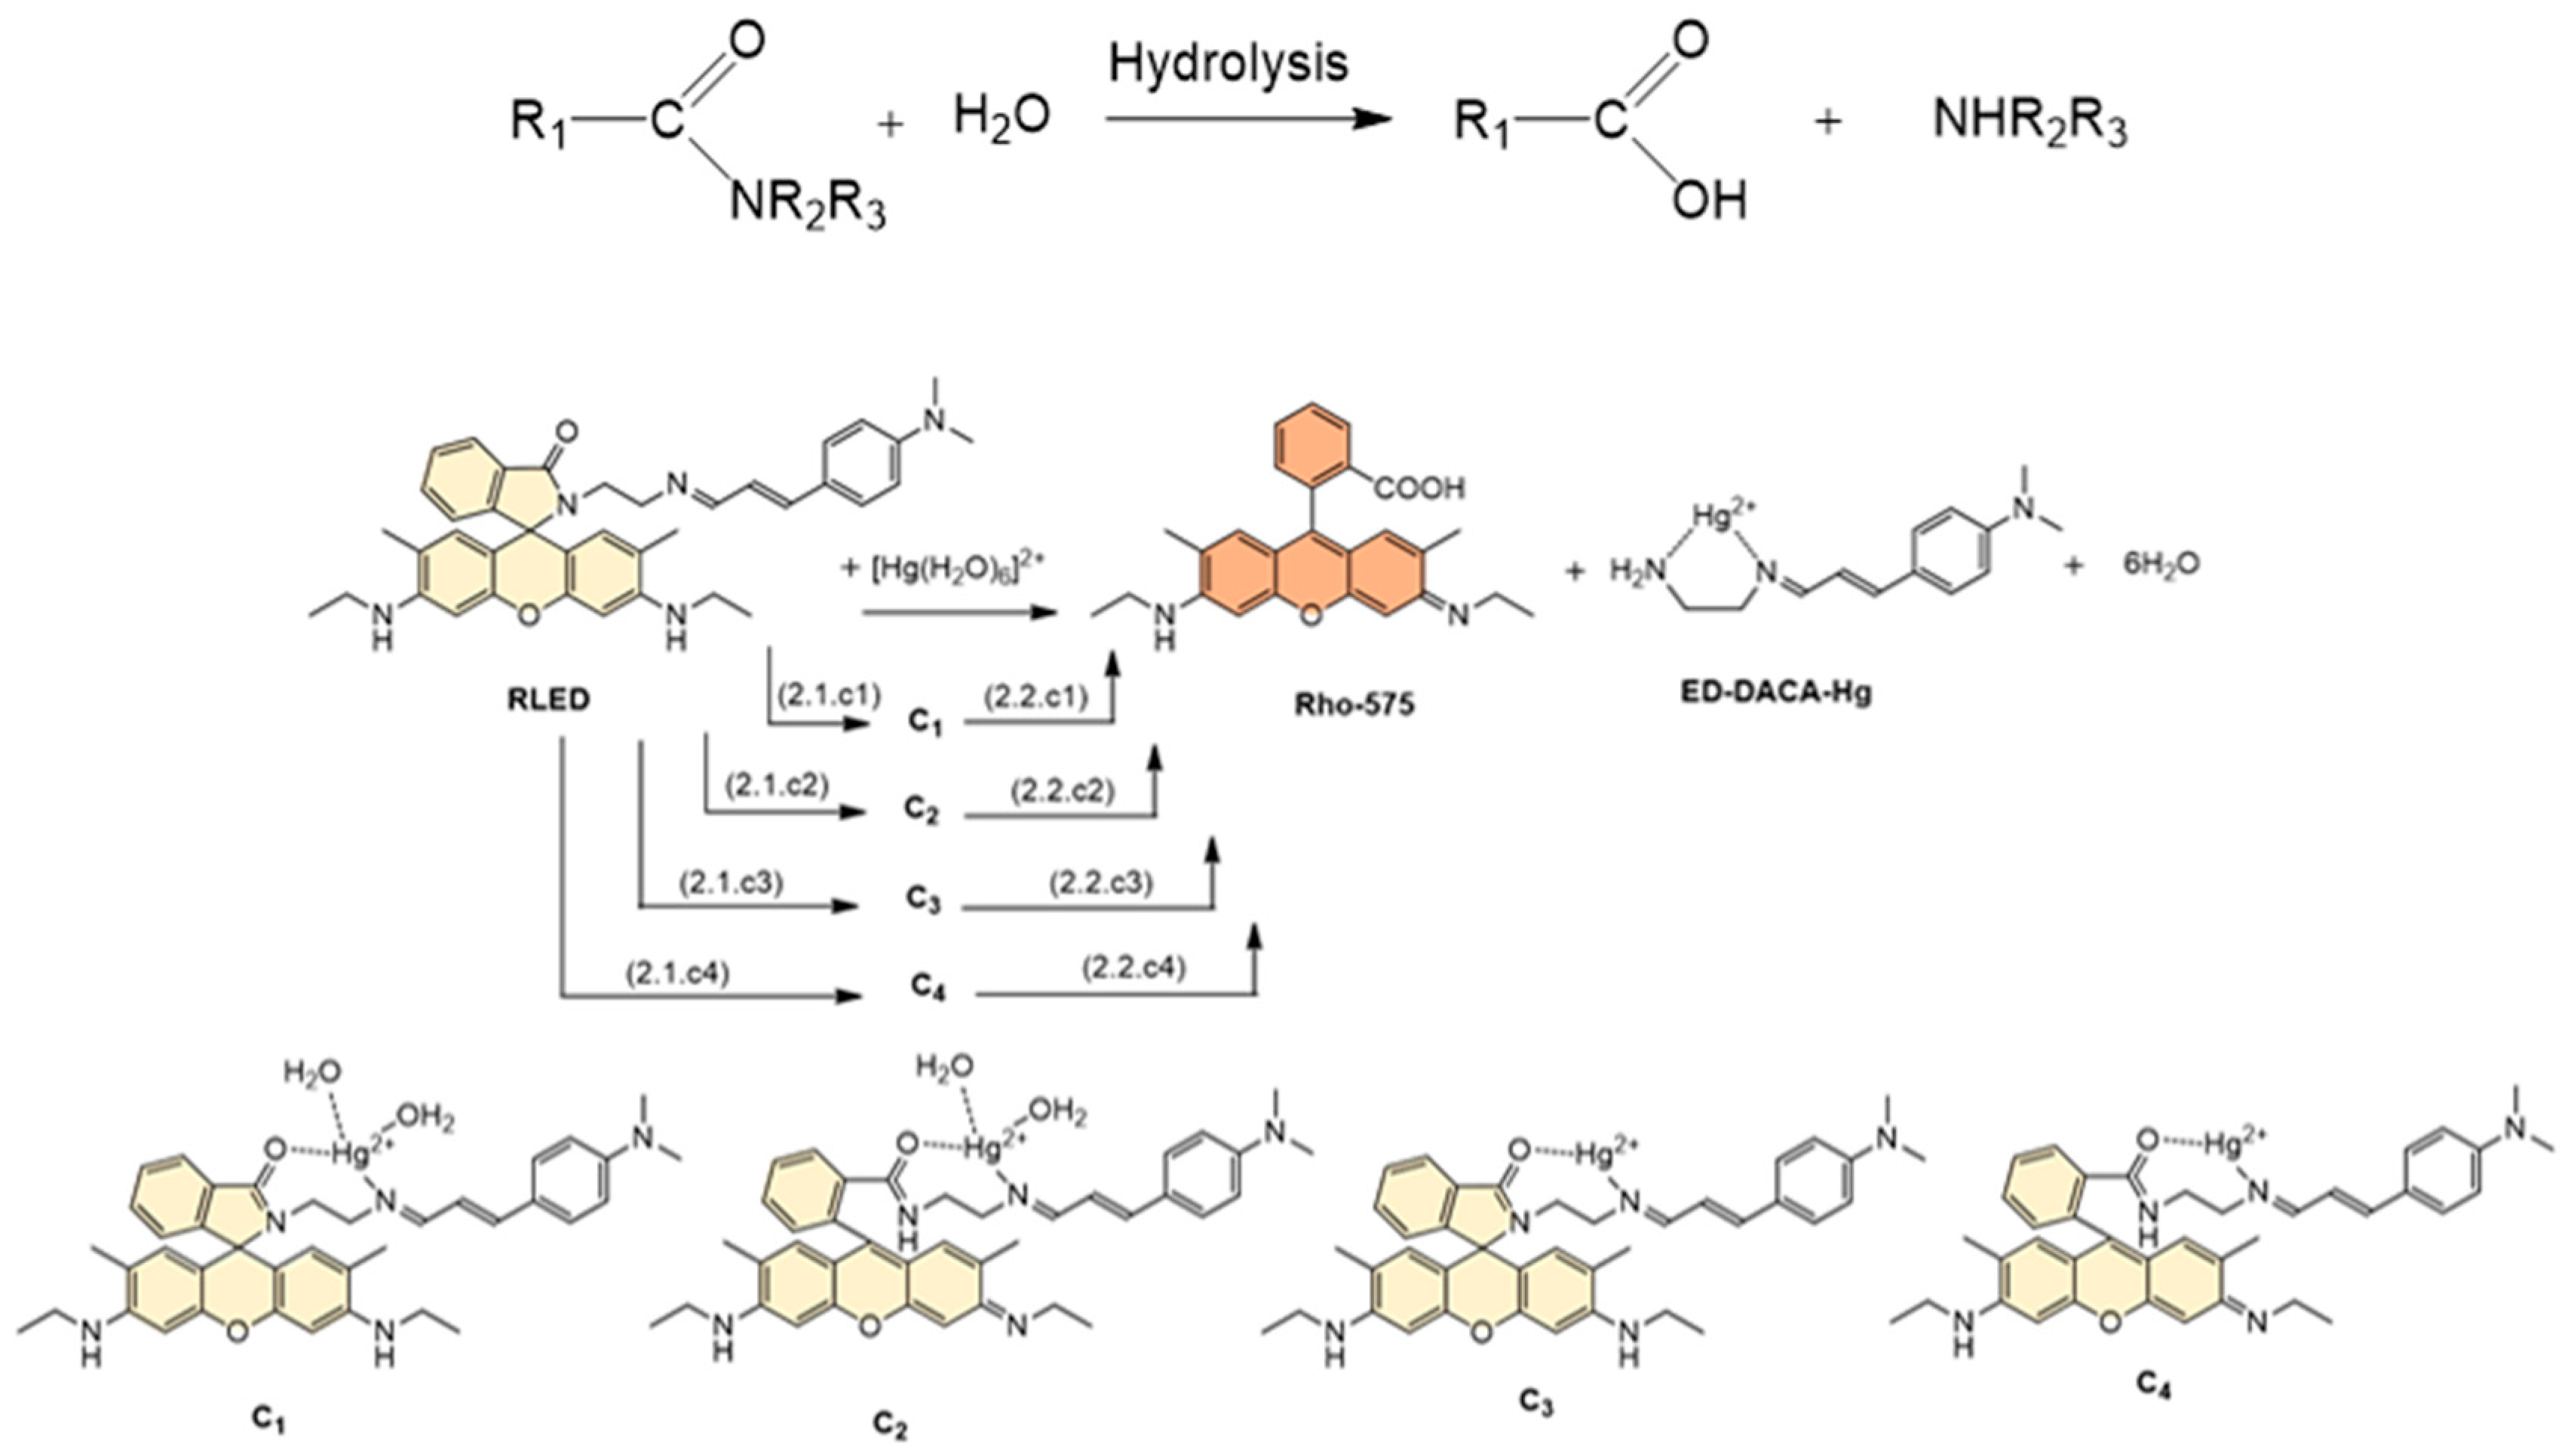
| Reaction | ∆H298 | ∆G298 | Reaction | ∆H298 | ∆G298 |
|---|---|---|---|---|---|
| (2) | 19.46 | −34.13 | |||
| (2.1c1) | −5.88 | −27.12 | (2.2c1) | 25.34 | −7.02 |
| (2.1c2) | −1.74 | −24.52 | (2.2c2) | 21.20 | −9.61 |
| (2.1c3) | −2.95 | −47.90 | (2.2c3) | 22.41 | 13.76 |
| (2.1c4) | 24.0 | −19.21 | (2.2c4) | −4.63 | −14.93 |
| Compound | State | E (eV) | λ (nm) | f | Contribution of Orbital Transition | |
|---|---|---|---|---|---|---|
| Composition | Percentage Contribution (%) | |||||
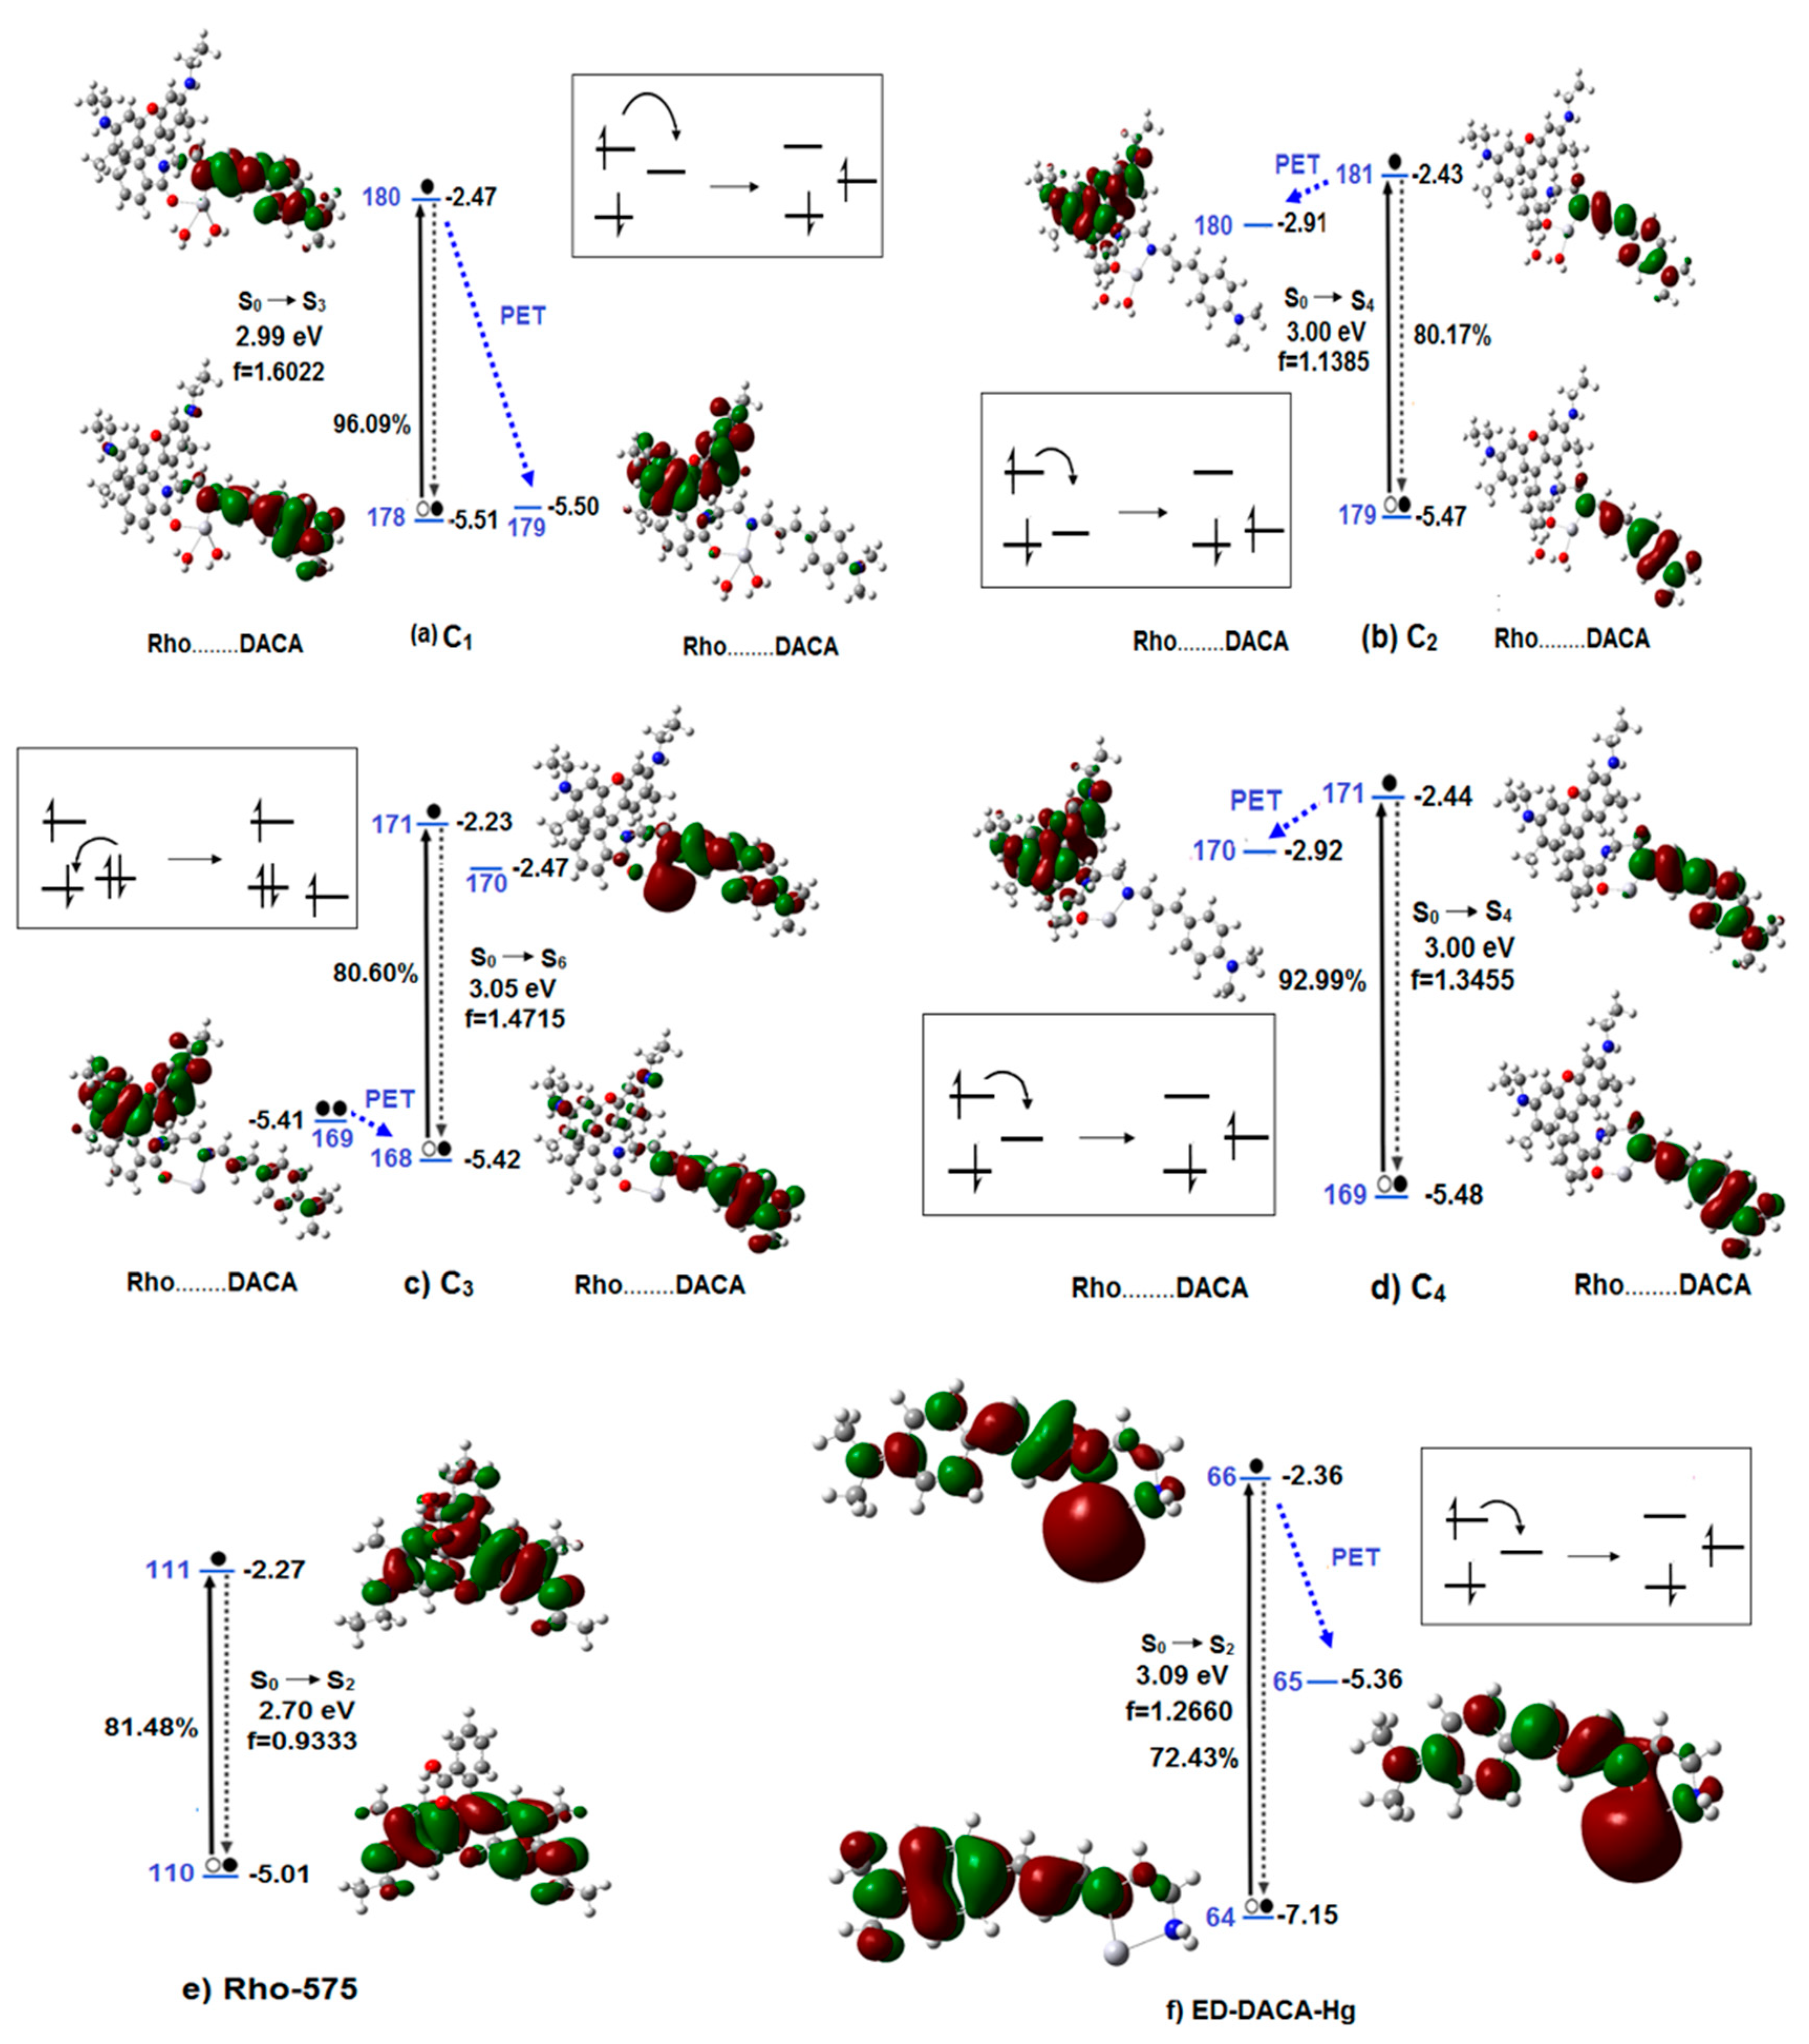
| C1 | S0 → S3 | 2.99 | 414.4 | 1.6022 | HOMO-1 → LUMO | 96.09 |
| C2 | S0 → S2 | 2.74 | 452.5 | 0.8299 | HOMO-1 → LUMO | 95.21 |
| S0 → S3 | 2.89 | 429.0 | 0.5591 | HOMO-2 → LUMO | 79.77 | |
| S0 → S4 | 3.01 | 412.4 | 1.1385 | HOMO → LUMO+1 | 80.17 | |
| C3 | S0 → S1 | 2.49 | 498.1 | 0.0689 | HOMO-1 → LUMO | 77.33 |
| S0 → S6 | 3.05 | 407.2 | 1.4715 | HOMO-1 → LUMO+1 | 80.0 | |
| C4 | S0 → S2 | 2.74 | 453.1 | 0.8088 | HOMO-1 → LUMO | 92.80 |
| S0 → S3 | 2.81 | 441.9 | 0.4326 | HOMO-2 → LUMO | 85.61 | |
| S0 → S4 | 3.00 | 413.8 | 1.3455 | HOMO → LUMO+1 | 92.99 | |
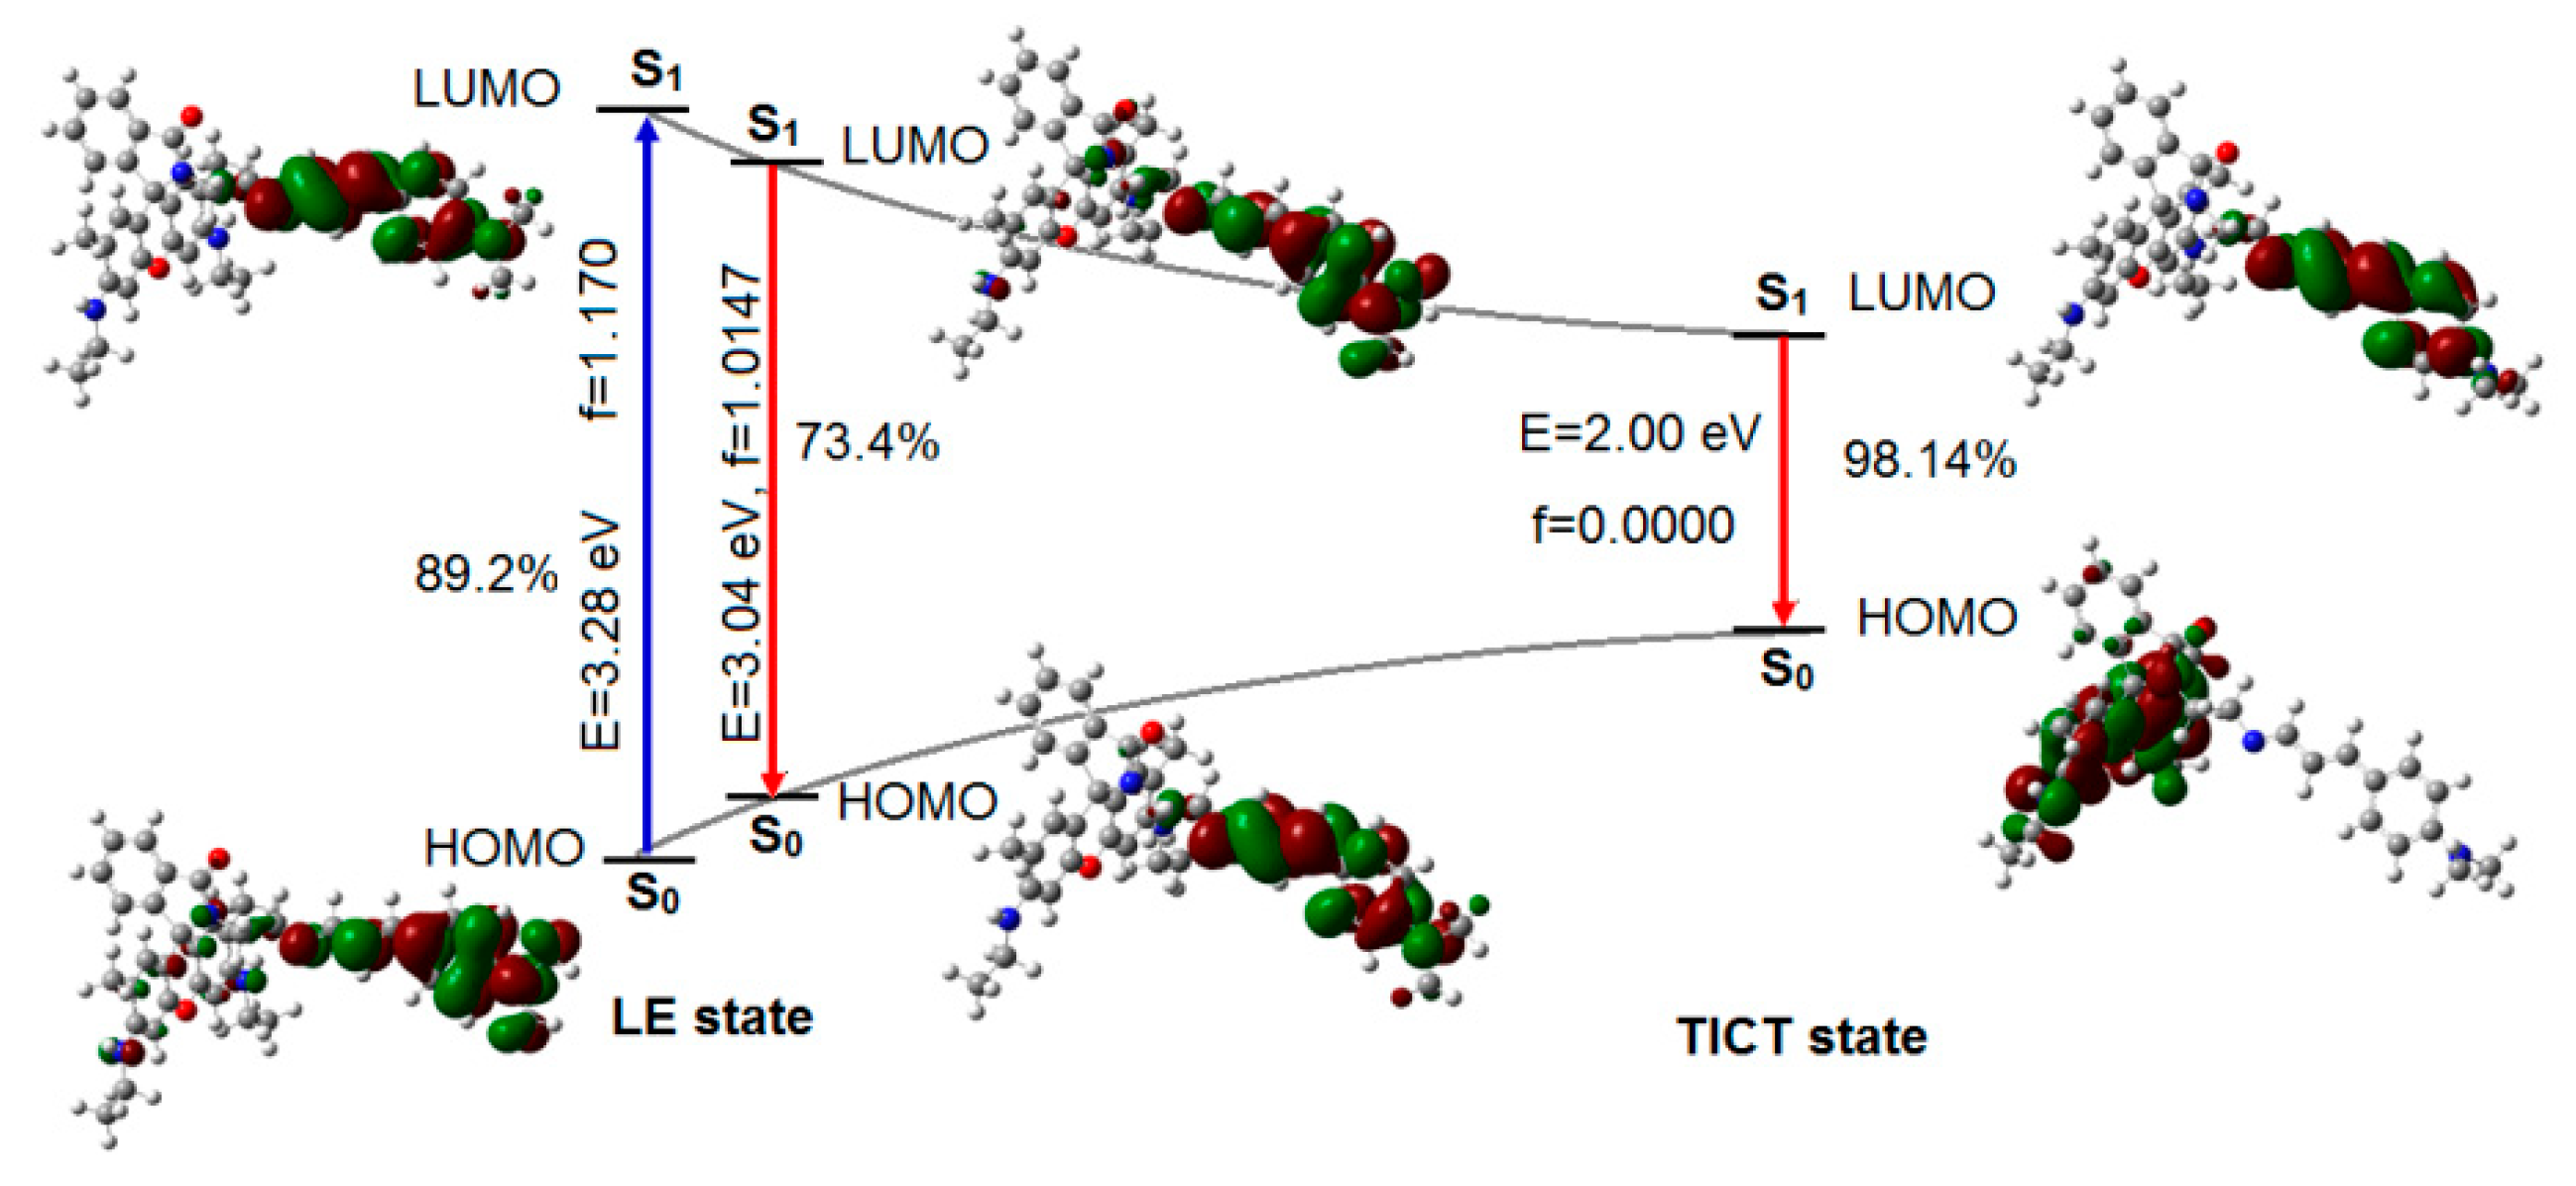
| Rho-575 | S0 → S2 | 2.70 | 460.0 | 0.9333 | HOMO → LUMO | 81.48 |
| ED-DACA-Hg | S0 → S1 | 2.61 | 475.1 | 0.1411 | HOMO → LUMO | 72.81 |
| S0 → S2 | 3.09 | 401.1 | 1.2660 | HOMO → LUMO+1 | 72.43 | |
© 2019 by the authors. Licensee MDPI, Basel, Switzerland. This article is an open access article distributed under the terms and conditions of the Creative Commons Attribution (CC BY) license (http://creativecommons.org/licenses/by/4.0/).
Share and Cite
Bay, M.V.; Hien, N.K.; Son, S.; Trinh, N.D.; Trung, N.T.; Nam, P.C.; Kim, J.S.; Quang, D.T. Hg2+-Promoted Spirolactam Hydrolysis Reaction: A Design Strategy for the Highly Selective Sensing of Hg2+ over other Metal Ions in Aqueous Media. Sensors 2019, 19, 128. https://doi.org/10.3390/s19010128
Bay MV, Hien NK, Son S, Trinh ND, Trung NT, Nam PC, Kim JS, Quang DT. Hg2+-Promoted Spirolactam Hydrolysis Reaction: A Design Strategy for the Highly Selective Sensing of Hg2+ over other Metal Ions in Aqueous Media. Sensors. 2019; 19(1):128. https://doi.org/10.3390/s19010128
Chicago/Turabian StyleBay, Mai Van, Nguyen Khoa Hien, Subin Son, Nguyen Duy Trinh, Nguyen Tien Trung, Pham Cam Nam, Jong Seung Kim, and Duong Tuan Quang. 2019. "Hg2+-Promoted Spirolactam Hydrolysis Reaction: A Design Strategy for the Highly Selective Sensing of Hg2+ over other Metal Ions in Aqueous Media" Sensors 19, no. 1: 128. https://doi.org/10.3390/s19010128
APA StyleBay, M. V., Hien, N. K., Son, S., Trinh, N. D., Trung, N. T., Nam, P. C., Kim, J. S., & Quang, D. T. (2019). Hg2+-Promoted Spirolactam Hydrolysis Reaction: A Design Strategy for the Highly Selective Sensing of Hg2+ over other Metal Ions in Aqueous Media. Sensors, 19(1), 128. https://doi.org/10.3390/s19010128