Article

Electrocomposite Developed with Chitosan and Ionic Liquids Using Screen-Printed Carbon Electrodes Useful to Detect Rutin in Tropical Fruits

1
Ingeniería Agroindustrial, Facultad de Ingeniería Agronómica, Universidad del Tolima, Calle 67 No. 53-108 B, Ibagué-Tolima 730001, Colombia
2
Facultad de Química, Pontificia Universidad Católica de Chile, Vicuña Mackenna 4860, Santiago 7820436, Chile
3
Facultad de Ciencias Naturales y Matemáticas, Universidad de Ibagué, Carrera 22 Calle 67, Ibagué 730001, Colombia
4
Departamento de Química, Universidad de los Andes, Carrera 1 No. 18A-12, Bogotá 111711, Colombia
*
Author to whom correspondence should be addressed.
Sensors 2018, 18(9), 2934; https://doi.org/10.3390/s18092934
Submission received: 9 August 2018 / Revised: 28 August 2018 / Accepted: 28 August 2018 / Published: 4 September 2018
(This article belongs to the Special Issue Paper-Based Sensors)

Abstract

:
This work reports the development of a composite of the ionic liquid 1-butyl-3-methylimidazolium tetrafluoroborate ([BMIM]BP4) and chitosan (CS) described in previous reports through a new method using cyclic voltammetry with 10 cycles at a scan rate of 50.0 mV s−1. This method is different from usual methods such as casting, deposition, and constant potential, and it allows the development of an electroactive surface toward the oxidation of rutin by stripping voltammetry applied to the detection in tropical fruits such as orange, lemon, and agraz (Vaccinium meridionale Swartz), with results similar to those reported in previous studies. In addition, the surface was characterized by electrochemical impedance spectroscopy (EIS), scanning electron microscopy (SEM), and Raman spectroscopy. The limit of detection was 0.07 µmol L−1 and the relative standard deviation (RSD) of 10 measurements using the same modified electrode was 0.86%. Moreover, the stability of the sensor was studied for six days using the same modified electrode, where the variation of the signal using a known concentration of rutin (RT) was found to be less than 5.0%. The method was validated using a urine chemistry control spiked with known amounts of RT and possible interference was studied using ten substances including organic and biological compounds, metal ions, and dyes. The results obtained in this study demonstrated that this electrodeveloped composite was sensitive, selective, and stable.

1. Introduction

In the last decade, ionic liquids (ILs) and chitosan (CS) have been widely used in the modification of electrodes used as electrochemical sensors. This has been mainly due to the advantageous properties of CS such as good biocompatibility, biodegradability, and adhesion [1] that allow the immobilization of enzymes [2] and single stranded deoxyribonucleic acid (ssDNA) [3] through the charge interaction at acidic pH values, and properties of ILs such as high ionic conductivity, high viscosity, ionic structure, and low volatility [4,5]. Moreover, imidazolium and pyridinium groups are the most used cations, and the hexafluorophosphate and tetrafluoroborate ions are the most used anions in electrode modification [6]. Therefore, they have been used in the detection of biological substances such as dopamine and uric acid [7,8,9], organic substances such as hydroquinone [10], fephol [11], and hydrazine [12], fumigants such as imidacloprid [13,14], toxic metal ions such as Pb and Cd [15,16], and for microextraction of pesticides [17].
The combination of CS with ILs was studied by Chen et al., who reported that the imidazolium cation is dissolved more effectively with chitosan through hydrogen bonds [18]. Moreover, this combination has been used for CO2 capture [19]. Therefore, this composite has been used in the electroanalytical detection of formaldehyde and nitrite with 1-octyl-3-methylimidazolium hexafluorophosphate, [OMIM]PF6 [20,21], cholesterol with 1-butyl-3-methylimidazolium chloride, [BMIM]Cl [22], theophylline with 1-(3-Aminopropyl)-3-methylimidazolium bromide [AMIM]Br [23], glucose [24], hydrogen peroxide and luteolin with 1-butyl-3-methyl-imidazolium hexafluorophosphate [BMIM]PF6 [25,26], and ssDNA with N-hexylpyridinium hexafluorophosphate [HPP]F6, and 1-butylpyridinium hexafluorophosphate [BPP]F6 [27,28]. Additionally, this composite has been used as a catalyst in the Heck reaction of aryl bromides [29] and in the development of the membranes for the fabrication of dye-sensitized solar cells [30].
In particular, the composite formed between CS and [BMIM]PB4 is one of the most reported in the development of electroanalytical sensors. It has been used to detect trichloroacetic acid [31], hydrogen peroxide [32,33,34], glucose [35], NADH [36], cholesterol [37], guanine and adenine [38], and bisphenol [39]. In these studies, glassy carbon, carbon paste, and gold were the most commonly used electrodes. On the other hand, the CS and IL properties were mainly controlled by casting, deposition, and the substrate, and less often by electrodepositing at a controlled potential.
Interest in detecting rutin (RT) or vitamin P in natural products such as fruits, coffee, and tea is motivated mainly by their potential activity, such as antioxidant, anti-inflammatory, blood-vessel-protecting and anticancer-agent activities [40,41]. The detection of RT using CS in electrode modification has been reported with multiwalled carbon nanotubes [42,43], graphene [44] and graphene with poly (amido amine) [45]. Moreover, the use of ionic liquids to detect rutin has also been reported using pyridinium and imidazolium ionic liquid on a modified carbon paste and glassy carbon electrodes with detection limits between 0.6 nmol L−1 and 0.09 μmol L−1 [33,46,47,48,49,50,51,52,53]. On the other hand, CS and IL composites with rutin have been recently reported to act as an immunosensor with multiwalled carbon nanotubes and [BMIM]BF4 [54]. Most of these reports use other substances such as graphene, carbon nanotubes, nanoparticles, and conductive polymers. By contrast, there have been no reports of the use of screen-printed carbon electrodes that are very versatile for this type of study.
The previous studies described above demonstrate the importance of detecting RT and the versatility of chitosan and ionic liquids for modifying the electrodes.
In this study, we evaluated the electrochemical oxidation of rutin using a screen-printed carbon (SPC) electrode coated with a CS-IL composite. The development of a simple method that allows the detection of RT in tropical fruits is the aim of this work.

2. Materials and Methods

2.1. Apparatus

Cyclic voltammograms (CVs) and square wave-stripping voltammograms (SWAdVs) were obtained using a DropSens µStat400 potentiostat (Oviedo, Spain). Electrochemical impedance spectroscopy (EIS) was carried using a VersaSTAT 3 Potentiostat/galvanostat from Princeton Applied Research (Oak Ridge, TN, USA) Scanning electron microscopy (SEM) was performed using a JEOL, model JSM 6490-LV (Tokyo, Japan) with a secondary electron detector. Raman spectroscopy was performed with a RIBA Yovin-Ivon spectrometer (Kyoto, Japan) using various laser wavelengths (532, 638 and 786 nm). The electrochemical cell consisted of a screen-printed carbon electrode (DRP C110. DropSens, Oviedo, Spain) with carbon as the working electrode (4 mm), Ag as the reference electrode, and carbon as the counter electrode. The pH measurements were carried out using an Orion-430 digital pH/mV meter equipped with a combined pH glass electrode.

2.2. Chemicals and Reagents

Ultrapure water was obtained using a Wasselab Purifier System. Methanol, phosphoric acid, NaH2PO4, and Na2HPO4 were obtained from Merck (Darmstadt, Germany). Chitosan (low molecular weight), 1-butil-3-metilimidazolio tetrafluoroborate, and K4Fe(CN)6 were obtained from Sigma–Aldrich (Milwaukee, WI, USA). The stock solutions, rutin, morin, quercetin, dopamine, ascorbic acid, uric acid, hydroquinone, tartrazine, and sunset yellow (Sigma–Aldrich) were prepared only once for the entire study (0.6 mmol L−1) in methanol. The phosphate buffer solutions (PBS) as electrolyte were prepared in the pH range between 2.0 and 7.0 range using 0.010 mol L−1 phosphoric acid, sodium phosphate, and disodium phosphate solutions.

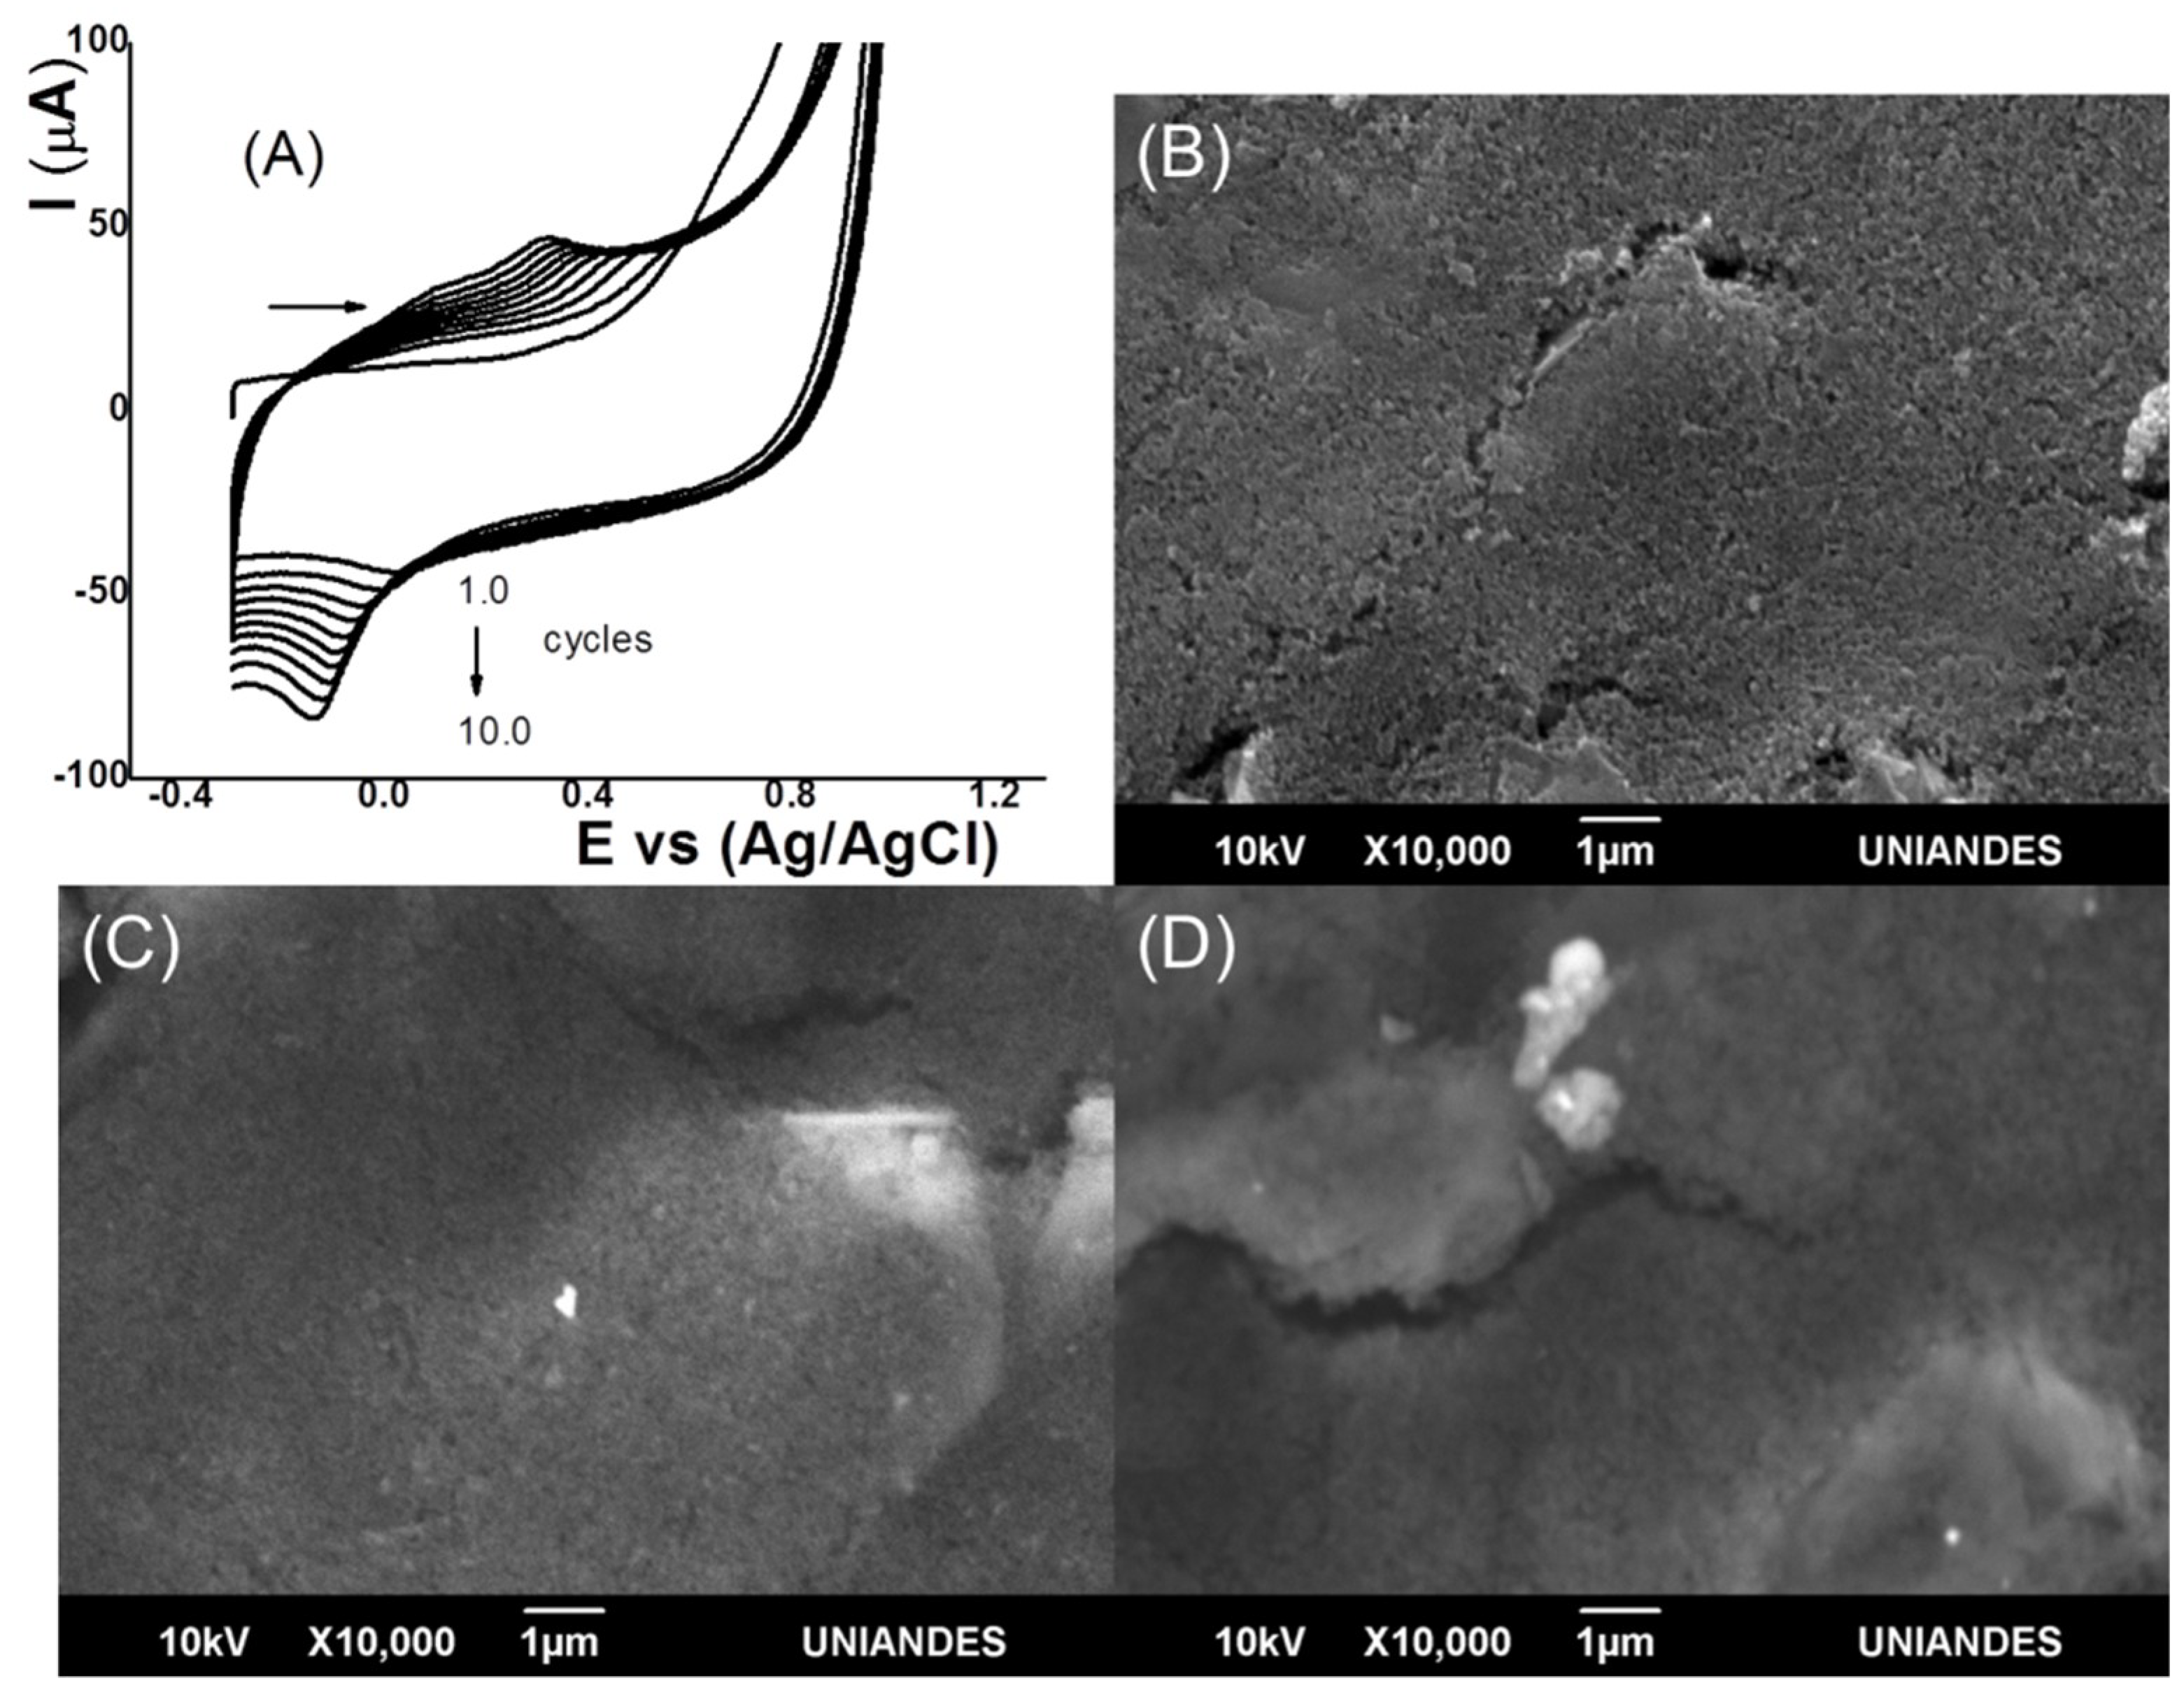
2.3. Preparation of Electromodified SPC Electrode with Chitosan and Ionic Liquids (IL-CS/SPC)

The SPC electrode surface was washed with ultra-pure water. The electromodified IL-CS/SPC electrode was prepared as follows: first, the composite of CS and ILs was prepared using 100.0 µL of CS optimal solution (between 2.5 and 13.5 mg of CS in 10.0 mL acetic acid 1.0%) and 100.0 µL of pure ILs. Then, 20 µL of the freshly prepared solution was added on the surface of the SPC electrode. Then, the IL-CS/SPC-modified electrode was subjected to 10 cycles between –0.3 and 1.0 V at a rate of 0.05 Vs−1 and was washed with ultrapure water to remove the excess solvent.

2.4. Samples Preparation

The orange, lemon, and agraz tropical fruits were obtained from a supermarket in Ibague, Colombia. The extraction was carried with a juice extractor via a conventional method. Agraz (Vaccinium meridionale Swartz) was dried at room temperature and crushed in a disc mill. A total of 500 g was extracted diligently in methanol in a 5 L vessel for 15 days and shaken daily. The obtained extract was concentrated under reduced pressure in a vacuum brand system. No pretreatment was necessary before each analysis.

2.5. Measurement Procedure

2.5.1. Cyclic Voltammetry

In the electrochemical cell, ultrapure water (9.5 mL), PBS (0.5 mL, 0.01 mol L−1), and RT (250.0 µL, 0.6 mmol L−1) were added sequentially. Then, after an equilibration time of 3 s, cyclic voltammograms (scan rate of 50 mV s−1) were recorded while the potential was scanned from −0.3 to 0.6 V. Each voltammogram was repeated 3 times.

2.5.2. Square Wave-Stripping Voltammetry

In the electrochemical cell, ultrapure water (9.5 mL), PBS (0.2 mL, 0.01 mol L−1), and RT (10.0–100.0 µL, 0.30 mmol L−1) were added sequentially, and the mixture was deposited for 30 s at 0.0 V. After an equilibration time of 3.0 s, the potential was scanned from −0.3 to 0.5 V using a square wave with a frequency of 15 Hz and pulse amplitude of 500 mV. Each voltammogram was repeated 3 times. The calibration curves for RT were developed between 0.60 and 30.0 µmol L−1. The detection limits were calculated using the standard error (3σ) and the slope of the calibration curve. In the real sample, the standard addition method was used to eliminate matrix effects. All data were obtained at room temperature (~25 °C).

2.5.3. EIS

EIS measurements were carried out at the open-circuit potential using a perturbation amplitude of 10 mV and a frequency range between 10.0 kHz and 0.10 Hz. The working electrodes were an SPC electrode, CS/SPC, and IL-CS/SPC. The tested electrolyte was K4Fe(CN)6 10.0 mmol L−1 in KCl 10.0 mmol L−1.

3. Results and Discussion

3.1. Characterization of CS/SPC Electrode Surface with SEM

The IL-SC composite was electrodeposited between −0.3 and 1.0 V at a scan rate of 0.05 V s−1 for 10 cycles. Figure 1A shows the voltammograms. An anodic peak current and a cathodic peak current were clearly observed between 0.2 and 0.4 V and −0.1 and −0.2 V, respectively, assigned to a quasireversible system of the imidazolium group of the ionic liquid [55]. When the study was done only with CS and in the absence of ILs, this redox pair was not observed. This increase in the current in each cycle indicated the presence of an IL-CS composite electrodeposited film on the electrode surface. Moreover, after more than 10 cycles, the current was not increased. The changes on the modified electrodes surfaces were investigated by SEM. Figure 1B shows the surface of the SPC electrode without CS, and IL-CS composite where a nonuniform and porous surface was observed. Meanwhile, for the CS/SPC electrode (Figure 1C), a more homogeneous and smooth surface was observed. On the other hand, the surface with the IL-CS composite (Figure 1D) showed few changes, indicating a good interaction between CS and ILs.

3.2. Raman Spectroscopy

Raman analysis showed that the experiment conducted at 638 nm provided the best Raman dispersion information. For the SPC electrode, only the D band (1350 cm−1) and the G band (1591 cm−1) were observed, both of which are the characteristic bands of materials with carbonaceous structures [56]. The G band is related to the energy of sp2 bonding and is assigned to normal graphitic structures. In addition, when CS was deposited on the electrode, two bands were observed at 1341 and 1589 cm−1, corresponding to the amino and acetamido groups, respectively [57]. In the electrode containing the IL-CS electrocomposite, the CS bands were observed to shift to higher wavenumbers, indicating that there was an interaction between the CS and ILs. The figures are shown as supporting information (Figures S1–S3)

3.3. Characterization of SPC, CS/SPC and IL-CS/SPC Electrodes by CV and EIS

SPC-modified electrodes were studied with K4Fe(CN)6 10.0 mmol L−1 in KCl 10.0 mmol L−1 as test solutions to identify the conductive properties of the surface using CV and EIS. The results are shown in Figure 2. Electrochemical impedance analysis is reported in the Nyquist plot for an electrical circuit at high and low frequencies. The results of the EIS analysis for K4Fe(CN)6 using SPC, CS/SPC, and IL-CS/SPC electrodes are shown in Figure 2A. The electrochemical impedance for the SPC electrode exhibits a straight line with a slope to 90° at low frequencies that is associated with a porous surface and semi-infinite diffusion [58]. The impedance of a simple faradic reaction without diffusion can be calculated in terms of a CPE, CS/CPE, and IL-CS/CPE as
Z ( ω ) = R s + R s 1 + ( j ω ) a Q   R c t
were Q and a are the CPE parameters, ω is the angular frequency. Q represents the differential capacity of the interface in the case where a = 1 [59].
The charge transfer resistance (Rct) value is 35,500 Ohm. These results indicate a limitation of the faradaic process for the SPC electrode. Similar results for Rct were reported for a system with unmodified SPC electrodes [6]. The SPC electrode coated with CS and the IL-CS composite showed very different response results, first exhibiting a line with a slope close to 45° at low frequencies that can be associated with diffusion on a homogenous film. On the other hand, the charge transfer resistance (Rct) values were 4500 and 1800 Ohm. These results are related to the SEM results, where it was observed that the surfaces were more homogenous for the electrodes with CS and IL-CS composite. These results imply that IL-CS/SPC electrocomposite film facilitated the electron transfer.
Cyclic voltammograms for the K4Fe(CN)6 solution with KCl using SPC, CS/SPC, and IL-CS/SPC electrodes are shown in Figure 2B. For the SPC electrode, the anodic and cathodic peak currents were 63.8 and −35.8 µA with ∆V of 0.22 V for a quasireversible reaction. When SPC electrode was coated with CS and IL-CS electrocomposite, anodic and cathodic peak currents were ±70.0 µA, indicating that the amount of oxidized Fe2+ is the same as the amount of Fe3+, allowing a reversible redox reaction. On the other hand, the observed charges for SPC, CS/SPC, and IL-CS/SPC electrodes were 0.132, 0.140 and 0.167 mC, respectively. These results are similar to those observed by EIS, where the presence of CS and ILs improves the conductivity of the surface of the SPC electrode. Moreover, the background current of the IL-CS/SPC electrode is higher than that of the large surface area of the composite film. For the electrodes modified with CS, ILs, and nanoparticles, a more considerable increase in the values of the anodic and cathodic current was not observed [54].

3.4. Activity of RT Using SPC, CS/SPC and IL-CS/SPC Electrodes

Electroactivity properties for RT are related to the ortho-dihydroxy-phenol group in the chemical structure where two proton–electron pairs can be oxidized between 0.0 and 0.5 V [60]. Figure 3A shows the cyclic voltammograms for RT (35.0 µmol L−1) at 0.10 V s−1 in pH 2.5 with PBS, using SPC, CS/SPC, and IL-CS/SPC electrodes. The results clearly show that RT shows activity on the surface of the three electrodes through a quasireversible reaction. The ∆E values for RT using SPC, CS/SPC, and IL-CS/SPC were 0.06, 0.14, and 0.23 V, respectively. These results indicate that more energy is required to oxidize RT with the modified electrode. This may be due to the width of the film. On the other hand, the anodic peak currents for RT with SPC, CS/SPC, and IL-CS/SPC electrodes were 3.95, 11.0, and 29.1 µA, respectively. These results showed that the current increased by more than 100% with IL-CS/SPC, indicating that the concentration of RT on the surface of the IL-CS/SPC electrode is higher. It is possible that the positive charge of the CS as NH3+ in acidic medium interacts with the imidazolium anion. Therefore, the CS–IL composite acts as an extraction agent for RT through an affinity interaction [47]. Similar results have been reported for other analytes such as for the interaction of dopamine with ILs [61]. With respect to the potential peak for RT, it was reported at more positive values with ILs on carbon paste [33] and CS on glassy carbon [42]. To select the most sensitive technique, cathodic stripping voltammetry (CSV), the most popular stripping voltammetric technique suitable for the determination of organic substances, and adsorptive stripping voltammetry (AdSV) that shows higher sensitivity due to the adequate accumulation potential value, were evaluated for RT oxidation. In CSV and AdSV (Figure 3B) using square wave, the anodic and cathodic peak potentials of RT (3.5 µmol L−1) are observed at 0.28 V with the cathodic and anodic peak currents of −2.36 and 3.98 µA, respectively. These results showed that AdSV exhibit a higher response. Therefore, it has higher sensitivity for RT analysis. AdSV is chosen as the optimal technique for subsequent studies.

3.5. Influence of the Scan Rate of RT on the IL-CS/SPC Electrode

The mass-transfer process for RT on the IL-CS/SPC electrode was studied to elucidate the influence of the scan rate (ν) on the anodic peak current at pH 2.5 (Figure 4A). Anodic peak currents were studied at the rates between 0.02 and 0.10 V s−1. A linear trend was observed at low and high scan rates. The regression equation was ipa (µA) = −4.549 + 0.439ν (correlation coefficient R2 = 0.995). This result indicates that the process on the IL-CS/SPC electrode is adsorption-controlled. Moreover, the plots of the dependence of the anodic peak potentials vs. ln ν for RT are fitted with the regression equation of Epa (V) = −0.033 + 0.069 ln ν (correlation coefficient R2 = 0.990). This slope value is close to the value of 0.059 in the Nernst equation. This linear relationship indicates that the electro-oxidation of RT shows a stoichiometry of 2H+:2e. Similar results were reported for RT using Cu–CS/MWCNT carbon nanotubes [42] and ionic liquid-modified carbon-paste electrodes [33].

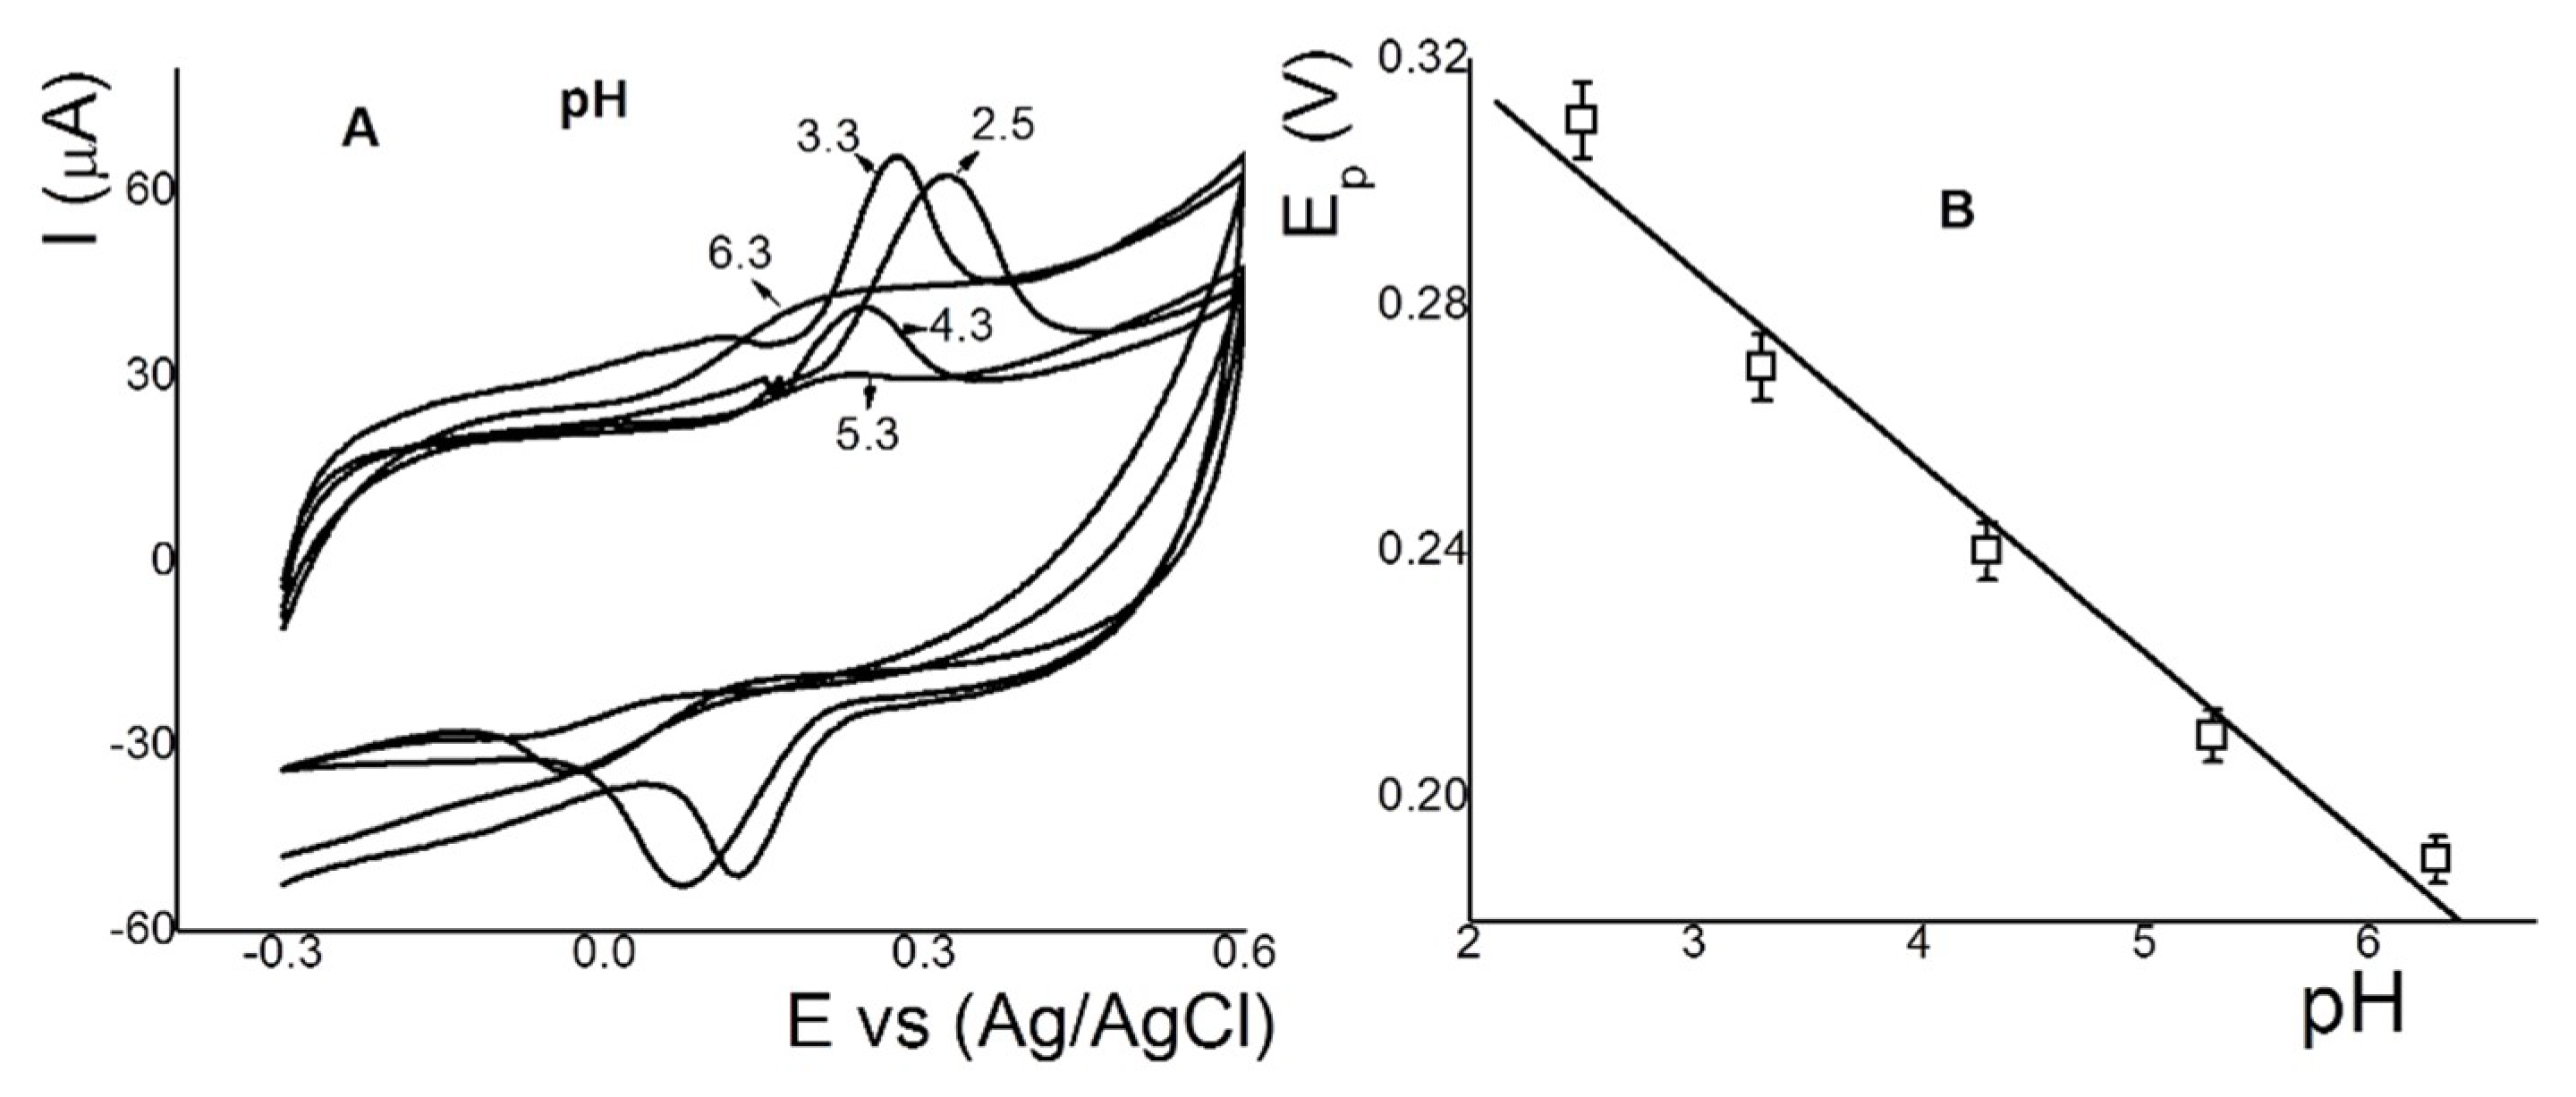
3.6. Effect of pH on the Anodic Peak Current of RT on the IL-CS/SPC Electrode

Adsorptive properties depend largely on the pH value in the electrochemical cell. The pH influence on anodic peak current for RT was studied at pH range 2.5–6.3 using PBS (0.001 mol L−1) with 35.0 µmol L−1 of RT (0.1 V s−1) (Figure 5A). Anodic peak potentials for RT were shifted slightly toward more negative values with increasing pH, suggesting that protons participate directly in the oxidation of RT. The anodic peak current maximum was obtained at pH 2.5 and this pH was used for further experiments. Moreover, the plots of the dependence of the anodic peak potentials on pH for RT were fitted with the regression equation Epa (V) = 0.368 + 0.049pH (correlation coefficient R2 = 0.992). This value of the slope value is close to the value of 0.059 in the Nernst equation. This linear relationship indicates that the electro-oxidation for a quasireversible reaction of RT shows the stoichiometry of 2H+:2e. These results are the same as those described in Section 3.3 and as previously reported in the literature [62].

3.7. Influence of the Adsorption Time (tADS), Adsorption Potential (EADS) and SWV Parameters

To optimize the adsorption of RT on the IL-CS/CPE surface, tADS, EADS, and SWV parameters were studied with an RT concentration of 3.5 µmol L−1. The results showed that with an increase in the adsorption time, the anodic peak current increased to 60 s, with no increase observed for longer time. This may be due to the saturation of the electrode surface. 60 s is chosen as the optimal tADS for subsequent studies. EADS was studied between −0.2 and 0.2 V. The results showed that anodic peak current for RT was higher at the positive potential values. 0.1 V was chosen as the optimal potential value. This potential value it is not high enough to oxidize RT. Therefore, RT was adsorbed on the IL-CS/SPC electrode surface. The effects of the square wave parameters, such as the pulse amplitude (V) and frequency (Hz), on the anodic peak current were also studied in the ranges of 0.01–0.1 V and 5.0–30.0 Hz, respectively. The anodic peak current for RT increased with the increase in the pulse amplitude and frequency to 0.09 V and 10.0 Hz, respectively. Therefore, these values were chosen as optimal for the subsequent studies.

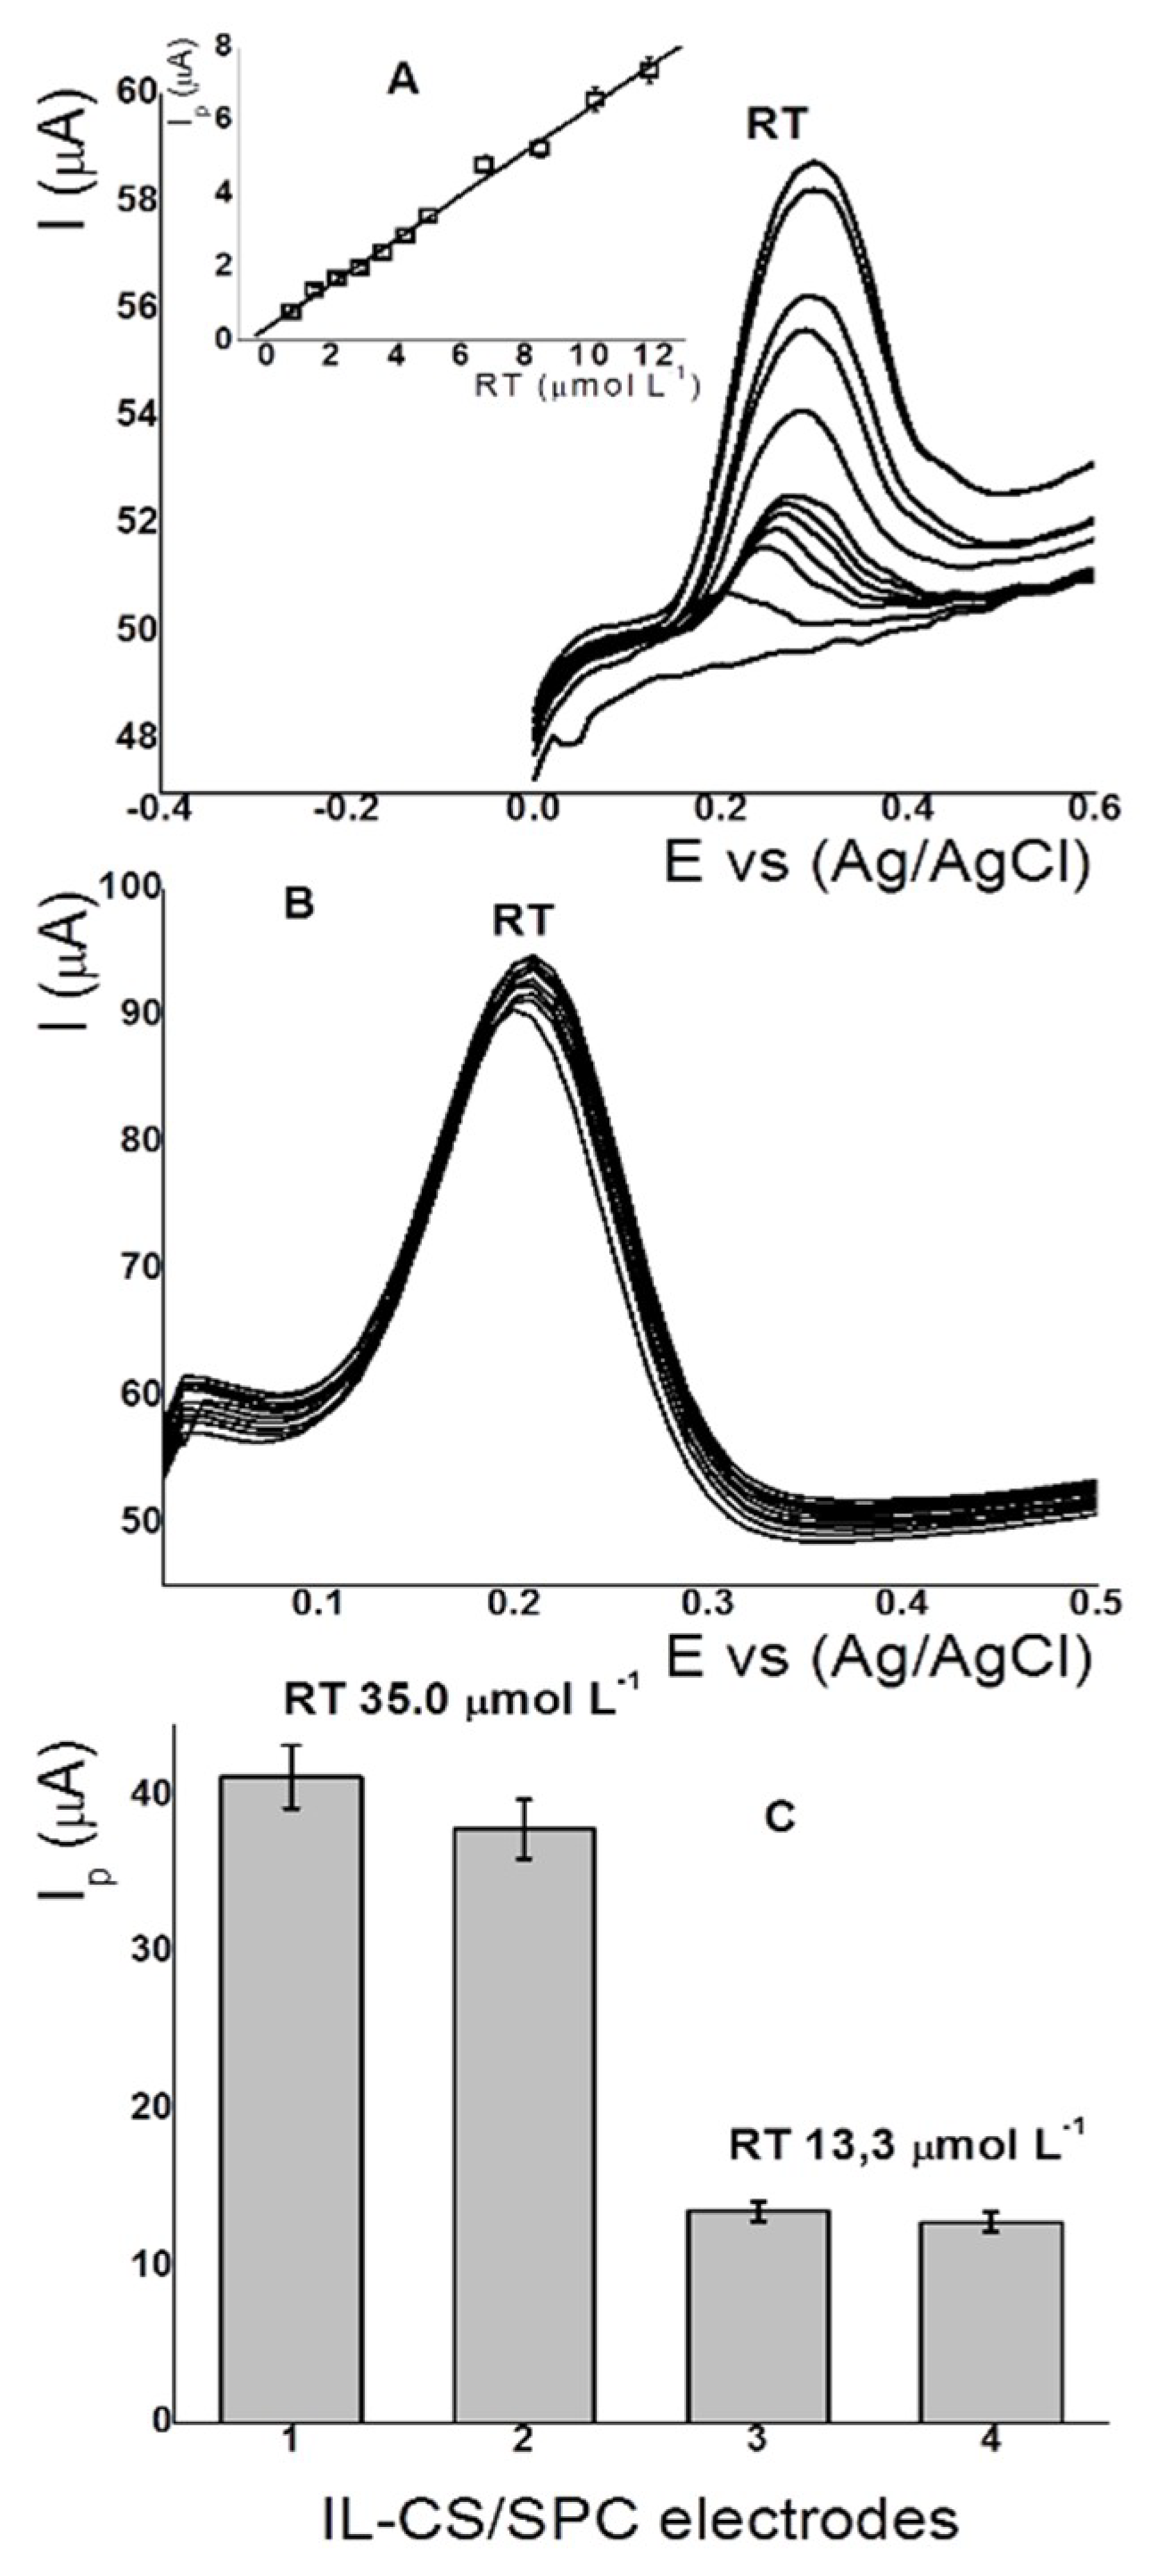
3.8. Analytical Parameters, Stability and Repeatability

Figure 6 shows the voltammograms of the calibration curve (calibration-curve insert), stability, and reproducibility of the IL-SC/SPC electrode. Detection limits was calculated from the calibration curve obtained between 0.75 and 12.5 µmol L−1 of RT with the optimized conditions: pH 2.5 (0.01 mol L−1 PBS), EADS 0.1 V, and tADS 60 s. The regression equation for the anodic peak currents (Figure 6A) was Ipa = 0.397 ± 0.01 + 0.596 ± 0.09CRT (correlation coefficient R2 = 0.997). The DL obtained for RT based on the values of the slopes and the random errors in x and y was 0.07 µmol L−1. The stability and durability of the sensor was evaluated by performing SWAdV after 10 consecutive measurements for a RT concentration of 35.0 µmol L−1. The results are shown in Figure 6B. Anodic peak currents for RT increased by only approximately 5.0%. This corresponds to the increase of 0.5% in the current (μA) for each measurement. Moreover, the relative standard deviation (RSD) was 0.86% (n = 10). The reproducibility was 1.5% (n = 7) for RT (35.0 and 13 µmol L−1) using four different electrodes (Figure 6C). These results indicate that the performance of the sensor allows it to be used for a long period of time without an appreciable reduction in its activity. The proposed method using IL-CS/CPE for RT detection was compared to other modified electrodes, as summarized in Table 1.

3.9. Interference, Validation and Study

The possible interfering substances in the detection of RT with the IL-CS/SPC electrode were evaluated by the amperometric technique at 0.3 V with metal ions using an ICP multielement standard solution IX (Merck) containing As, Be, Cd, Cr(VI), Hg, Ni, Pb, Se, and Tl 100 mg L−1, hydroquinone (HQ), catechol (CT), uric acid (UA), ascorbic acid (AA), dopamine (DP), dye colors such as tartrazine (TZ) and sunset yellow (SY), and others flavonoids such as quercetin (QC) and morin (MR) in concentrations ten times higher. The results showed that only HQ and CT can cause interference with the signal for RT. Figure 7A shows the amperograms for RT in the presence of the substances mentioned above. These results suggest that the IL-SC/SPC electrode can be used for the analysis of natural samples and foods.
The accuracy for RT detection using the IL-CS/SPC electrode was evaluated with the standard control urine chemistry from Bio-Rad spiked with known amounts of RT. The results are summarized in Table 2. The relative error of the four samples were close to 10.0%, indicating acceptable accuracy, considering the concentration of smaller than 5.0 µmol L−1. Moreover, the slopes of the calibration curves for RT were 1.18, 1.09, and 0.90. The small differences in the slope values indicate that the matrix of the sample did not affect the activity of the sensor. The voltammograms for sample 1 of Table 2 are shown in Figure 7A.

3.10. Analytical Application

An IL-CS/SPC electrode was used in the detection and quantification of RT in tropical fruits such as orange, lemon, and agraz (Vaccinium meridionale Swartz) obtained at a supermarket in Ibagué, Colombia. The concentrations of RT were calculated by standard addition. Each sample was analyzed at pH 2.5 with PBS. The results are shown in Table 3. These results were similar to a previous report where the concentration of RT was found to be higher in lemon than in orange [42]. Moreover, the amount of RT detected in agraz was higher and was similar to the amount of RT detected in grapefruit by capillary electrophoresis [63] and electroanalytical method [64].

4. Conclusions

The IL-CS composite deposited onto SPC electrode showed high activity and selectivity towards RT oxidation. Moreover, it allowed the detection and quantification in natural samples without any pretreatment. Additionally, the sensor was shown to be stable, reproducible, sensitive, and easily developed.

Supplementary Materials

The following are available online at https://www.mdpi.com/1424-8220/18/9/2934/s1, Raman spectroscopy of SPC, CS/SPC and IL-CS/SPC. Were performed in a RIBA Yovin-Ivon spectrometer (Kyoto, Japan) using various laser wavelengths (532, 638, and 786 nm).

Author Contributions

L.M. and O.G.-B. contributed to the sample agraz extraction. V.A. and E.N. contributed to the characterization, pH, detection limits, and validation study. J.J.H. contributed to the SEM and Raman spectroscopy study.

Funding

The authors E.N. thank the financial support to the Universidad de Ibagué (projects 18-541-INT and 16-416-INT).

Acknowledgments

The authors J.J.H. express their thanks to the Universidad de los Andes for financial support from the Interfaculty project and the Faculty of Sciences.

Conflicts of Interest

The authors declare no conflict of interest.

References

  1. Yang, S.; Liu, X.; Zeng, X.; Xia, B.; Gu, J.; Luo, S.; Mai, N.; Wei, W. Fabrication of nano-copper/carbon nanotubes/chitosan film by one-step electrodeposition and its sensitive determination of nitrite. Sens. Actuators B-Chem. 2010, 145, 762–768. [Google Scholar] [CrossRef]
  2. Kang, X.; Wang, J.; Wu, H.; Aksay, I.A.; Liu, J.; Lin, Y. Glucose Oxidase-graphene-chitosan modified electrode for direct electrochemistry and glucose sensing. Biosens. Bioelectron. 2009, 25, 901–905. [Google Scholar] [CrossRef] [PubMed]
  3. Xu, C.; Cai, H.; He, P.; Fang, Y. Electrochemical detection of sequence-specific DNA using a DNA probe labeled with aminoferrocene and chitosan modified electrode immobilized with ssDNA. Analyst 2001, 126, 62–65. [Google Scholar] [CrossRef] [PubMed]
  4. Sun, P.; Armstrong, D.W. Ionic liquids in analytical chemistry. Anal. Chim. Acta 2010, 661, 1–16. [Google Scholar] [CrossRef] [PubMed]
  5. Opallo, M.; Lesniewski, A. A review on electrodes modified with ionic liquids. J. Electroanal. Chem. 2011, 656, 2–16. [Google Scholar] [CrossRef]
  6. Nagles, E.; García-Beltrán, O.; Calderon, J.A. Evaluation of the usefulness of a novel electrochemical sensor in detecting uric acid and dopamine in the presence of ascorbic acid using a screen-printed carbon electrode modified with single walled carbon nanotubes and ionic liquids. Electrochim. Acta 2017, 258, 512–523. [Google Scholar] [CrossRef]
  7. Ping, J.; Wu, J.; Wang, Y.; Ying, Y. Simultaneous determination of ascorbic acid, dopamine and uric acid using high performance screen-printed graphene electrode. Biosens. Bioelectron. 2010, 34, 70–76. [Google Scholar] [CrossRef] [PubMed]
  8. Niu, X.; Yang, W.; Guo, H.; Ren, J.; Yang, F.; Gao, J. A novel and simple strategy for simultaneous determination of dopamine, uric acid and ascorbic acid based on the stacked graphene platelet nanofibers/ionic liquids/chitosan modified electrode. Talanta 2012, 99, 984–988. [Google Scholar] [CrossRef] [PubMed]
  9. Pandurangachar, M.; Kumara Swamy, B.E.; Chandrashekar, B.N.; Gilbert, O.; Sherigara, B.S. Electrochemical deposition of 1-butyl-4-methyl-pyridinium tetrafluroborate ionic liquid on carbon paste electrode and its application for the simultaneous determination of dopamine, ascorbic acid and uric acid. J. Mol. Liq. 2011, 158, 13–17. [Google Scholar] [CrossRef]
  10. Hu, S.; Wang, Y.; Wang, X.; Xu, L.; Xiang, J.; Sun, W. Electrochemical detection of hydroquinone with a gold nanoparticle and graphene modified carbon ionic liquid electrode. Sens. Actuators B-Chem. 2012, 168, 27–33. [Google Scholar] [CrossRef]
  11. Beitollahi, H.; Tajik, S.; Biparva, P. Electrochemical determination of sulfite and phenol using a carbon paste electrode modified with ionic liquids and graphene nanosheets: Application to determination of sulfite and phenol in real samples. Measurement 2014, 56, 170–177. [Google Scholar] [CrossRef]
  12. Beitollahi, H.; Tajik, S.; Jahani, S. Electrocatalytic Determination of Hydrazine and Phenol Using a Carbon Paste Electrode Modified with Ionic Liquids and Magnetic Core-shell Fe3O4@SiO2/MWCNT Nanocomposite. Electroanalysis 2016, 28, 1093–1099. [Google Scholar] [CrossRef]
  13. Majidi, M.R.; Baj, R.F.B.; Bamorowat, M. Ionic liquid modified carbon-ceramicelectrode with structure similar to Graphene nanoplatelets: Application to Imidacloprid determination in some agricultural products. Measurement 2016, 93, 29–35. [Google Scholar] [CrossRef]
  14. River-Guzman, K.; Franco, L.M.; García-Beltrán, O.; Calderon, J.A.; Nagles, E. Electochemical Detection of Imidacloprid Using a Screen Printed Single Walled Carbon Nanotubes Coated with and Ionic Liquids. Int. J. Electrochem. Sci. 2018, 13, 5775–5787. [Google Scholar] [CrossRef]
  15. Wang, Z.; Wang, H.; Zhang, Z.; Liu, G. Electrochemical determination of lead and cadmium in rice by a disposable bismuth/electrochemically reduced graphene/ionic liquid composite modified screen-printed electrode. Sens. Actuators B-Chem. 2014, 199, 7–14. [Google Scholar] [CrossRef]
  16. Chaiyo, S.; Mehmeti, E.; Žagar, K.; Siangproh, W.; Chailapakul, O.; Kalcher, K. Electrochemical sensors for the simultaneous determination of zinc, cadmium and lead using a Nafion/ionic liquid/graphene composite modified screen-printed carbon electrode. Anal. Chim. Acta 2016, 918, 26–34. [Google Scholar] [CrossRef] [PubMed]
  17. Ahmad, W.; Al-Sibaai, A.A.; Bashammakh, A.S.; Alwael, H.; El-Shahawi, M.S. Recent advances in dispersive liquid-liquid microextraction for pesticide analysis. TrAC-Trend Anal. Chem. 2015, 72, 181–192. [Google Scholar] [CrossRef]
  18. Chen, Q.; Xu, A.; Li, Z.; Wang, J.; Zhang, S. Influence of anionic structure on the dissolution of chitosan in 1-butyl-3-methylimidazolium-based ionic liquids. Green Chem. 2011, 13, 3446–3452. [Google Scholar] [CrossRef]
  19. Xie, H.; Zhang, S.; Li, S. Chitin and chitosan dissolved in ionic liquids as reversible sorbents of CO2. Green Chem. 2006, 8, 630–633. [Google Scholar] [CrossRef]
  20. Wang, Q.; Zheng, J.; Zhang, H. A novel formaldehyde sensor containing AgPd alloy nanoparticles electrodeposited on an ionic liquid–chitosan composite film. J. Electroanal. Chem. 2012, 674, 1–6. [Google Scholar] [CrossRef]
  21. Xiao, F.; Liu, L.; Li, J.; Zeng, J.; Zeng, B. Electrocatalytic Oxidation and Voltammetric Determination of Nitrite on Hydrophobic Ionic Liquid-Carbon Nanotube Gel-Chitosan Composite Modified Electrodes. Electroanalysis 2008, 20, 2047–2054. [Google Scholar] [CrossRef]
  22. Safavi, A.; Farjami, F. Electrodeposition of gold–platinum alloy nanoparticles on ionic liquid–chitosan composite film and its application in fabricating an amperometric cholesterol biosensor. Biosens. Bioelectron. 2011, 26, 2547–2552. [Google Scholar] [CrossRef] [PubMed]
  23. MansouriMajd, S.; Teymourian, H.; Salimi, A.; Hallaj, R. Fabrication of electrochemical theophylline sensor based on manganese oxide nanoparticles/ionic liquid/chitosannanocomposite modified glassy carbon electrode. Electrochim. Acta 2013, 108, 707–716. [Google Scholar] [CrossRef]
  24. Ragupathy, D.; Iyengar Gopalan, A.; Pill Lee, K. Synergistic contributions of multiwall carbon nanotubes and gold nanoparticles in a chitosan–ionic liquid matrix towards improved performance for a glucose sensor. Electrochem. Commun. 2009, 11, 397–401. [Google Scholar] [CrossRef]
  25. Yu, Q.; Shi, Z.; Liu, X.; Luo, S.; Wei, W. A nonenzymatic hydrogen peroxide sensor based on chitosan-copper complexes modified multi-wall carbon nanotubes ionic liquid electrode. J. Electroanal. Chem. 2011, 655, 92–95. [Google Scholar] [CrossRef]
  26. Franzoi, A.C.; Cruz Vieira, I.; Dupont, J.; Weber Scheeren, C.; de Oliveira, L.F. Biosensor for luteolin based on silver or gold nanoparticles in ionic liquid and laccase immobilized in chitosan modified with cyanuric chloride. Analyst 2009, 134, 2320–2328. [Google Scholar] [CrossRef] [PubMed]
  27. Sun, W.; Qin, P.; Gao, H.; Lic, G.; Jiao, K. Electrochemical DNA biosensor based on chitosan/nano-V2O5/MWCNTs composite film modified carbon ionic liquid electrode and its application to the LAMP product of Yersinia enterocolitica gene sequence. Biosens. Bioelectron. 2010, 25, 1264–1270. [Google Scholar] [CrossRef] [PubMed]
  28. Sun, W.; Qi, X.; Chen, Y.; Liu, S.; Gao, H. Application of chitosan/Fe3O4 microsphere-graphene composite modified carbon ionic liquid electrode for the electrochemical detection of the PCR product of soybean Lectin gene sequence. Talanta 2011, 87, 106–112. [Google Scholar] [CrossRef] [PubMed]
  29. Caló, V.; Nacci, A.; Monopoli, A.; Fornaro, A.; Sabbatini, L.; Cioffi, N.; Ditaranto, N. Heck Reaction Catalyzed by Nanosized Palladium on Chitosan in Ionic Liquids. Organometallics 2004, 23, 5154–5158. [Google Scholar] [CrossRef]
  30. Singh, P.K.; Bhattacharya, B.; Nagarale, R.K.; Kim, K.; Rhee, H. Synthesis, characterization and application of biopolymer-ionic liquid composite membranes. Synth. Met. 2010, 160, 139–142. [Google Scholar] [CrossRef]
  31. Lu, X.; Hu, J.; Yao, X.; Wang, Z.; Li, J. Composite System Based on Chitosan and Room-TemperatureIonic Liquid: Direct Electrochemistry and Electrocatalysis of Hemoglobin. Biomacromolecules 2006, 7, 975–980. [Google Scholar] [CrossRef] [PubMed]
  32. Xi, F.; Liu, L.; Wu, Q.; Lin, X. One-step construction of biosensor based on chitosan-ionic liquid-horseradish peroxidase biocomposite formed by electrodeposition. Biosens. Bioelectron. 2008, 24, 29–34. [Google Scholar] [CrossRef] [PubMed]
  33. Zhang, Y.; Zheng, J. Direct electrochemistry and electrocatalysis of cytochrome c based on chitosan–room temperature ionic liquid-carbon nanotubes composite. Electrochim. Acta 2008, 54, 749–754. [Google Scholar] [CrossRef]
  34. Lu, X.; Zhang, Q.; Zhang, L.; Li, J. Direct electron transfer of horseradish peroxidase and its biosensor based on chitosan and room temperature ionic liquid. Electrochem. Commun. 2006, 8, 874–878. [Google Scholar] [CrossRef]
  35. Zeng, X.; Li, X.; Xing, L.; Liu, X.; Luo, S.; Wei, W.; Kong, B.; Li, Y. Electrodeposition of chitosan-ionic liquid-glucose oxidase biocomposite onto nano-gold electrode for amperometric glucose sensing. Biosens. Bioelectron. 2009, 24, 2898–2903. [Google Scholar] [CrossRef] [PubMed]
  36. Wang, Q.; Tang, H.; Xie, Q.; Tan, L.; Zhang, Y.; Li, B.; Yao, S. Room-temperature ionic liquids/multi-walled carbon nanotubes/chitosan composite electrode for electrochemical analysis of NADH. Electrochim. Acta 2007, 52, 6630–6637. [Google Scholar] [CrossRef]
  37. Gopalan, A.I.; Lee, K.; Ragupathy, D. Development of a stable cholesterol biosensor based on multi-walled carbon nanotubes–gold nanoparticles composite covered with a layer of chitosan–room-temperature ionic liquid network. Biosens. Bioelectron. 2009, 24, 2211–2217. [Google Scholar] [CrossRef] [PubMed]
  38. Niu, X.; Yang, W.; Ren, J.; Guo, H.; Long, S.; Chen, J.; Gao, J. Electrochemical behaviors and simultaneous determination of guanine and adenine based on graphene–ionic liquid–chitosan composite film modified glassy carbon electrode. Electrochim. Acta 2012, 80, 346–353. [Google Scholar] [CrossRef]
  39. Wang, Q.; Wang, Y.; Liu, S.; Wang, L.; Gao, F.; Gao, F.; Sun, W. Voltammetric detection of bisphenol a by a chitosan–graphene composite modified carbon ionic liquid electrode. Thin Solid Films 2012, 520, 4459–4464. [Google Scholar] [CrossRef]
  40. Roseghini, R.; Rocha, D.S.; Clarêncio, J.; Costa, S.L.; Costa, M.F.D.; Tardy, M.; Nascimento, R.; Schaer, R.; Velozo, E.; Meyer, R.; et al. Flavonoid Rutin Alters the Viability and Function of Mitogen-Stimulated Splenocytes and Thymocytes Compared with Non Stimulated Cells. Immunopharmacol. Immunotoxicol. 2007, 29, 275–281. [Google Scholar] [CrossRef] [PubMed]
  41. Sapozhnikova, Y. Development of liquid chromatography-tandem mass spectrometry method for analysis of polyphenolic compounds in liquid samples of grape juice, green tea and coffee. Food Chem. 2014, 150, 87–93. [Google Scholar] [CrossRef] [PubMed]
  42. Gholivand, M.B.; Mohammadi-Behzad, L.; Hosseinkhani, H. Application of a Cuechitosan/multiwalled carbon nanotube film-modified electrode for the sensitive determination of rutin. Anal. Biochem. 2016, 493, 35–43. [Google Scholar] [CrossRef] [PubMed]
  43. Deng, P.; Xu, Z.; Li, J. Simultaneous determination of ascorbic acid and rutin in pharmaceutical preparations with electrochemical method based on multi-walled carbon nanotubes-chitosan composite film modified electrode. J. Pharm. Biomed. 2013, 76, 234–242. [Google Scholar] [CrossRef] [PubMed]
  44. An, J.; Bi, Y.; Yang, C.; Hu, F.; Wang, C. Electrochemical study and application on rutin at chitosan/graphene films modified glassy carbon electrode. J. Pharm. Anal. 2013, 3, 102–108. [Google Scholar] [CrossRef] [PubMed]
  45. Yin, H.; Zhou, Y.; Cui, L.; Liu, T.; Ju, P.; Zhu, L.; Ai, S. Sensitive voltammetric determination of rutin in pharmaceuticals, human serum, and traditional Chinese medicines using a glassy carbon electrode coated with graphene nanosheets, chitosan, and a poly(amido amine) dendrimer. Microchim. Acta 2011, 173, 337–345. [Google Scholar] [CrossRef]
  46. Sun, W.; Yang, M.; Li, Y.; Jiang, Q.; Liu, S.; Jiao, K. Electrochemical behavior and determination of rutin on a pyridinium-based ionic liquid modified carbon paste electrode. J. Pharm. Anal. 2008, 48, 1326–1331. [Google Scholar] [CrossRef] [PubMed]
  47. Liu, X.; Li, L.; Zhao, X.; Lu, X. Electrochemical behavior of rutin on a multi-walled carbon nanotube and ionic liquid composite film modified electrode. Colloid Surf. B 2010, 81, 344–349. [Google Scholar] [CrossRef] [PubMed]
  48. Hu, S.; Zhu, H.; Liu, S.; Xiang, J.; Sun, W.; Zhang, L. Electrochemical detection of rutin with a carbon ionic liquid. electrode modified by Nafion, graphene oxide and ionic. liquid composite. Microchim. Acta 2012, 178, 211–219. [Google Scholar] [CrossRef]
  49. Zhan, T.; Sun, X.; Wang, X.; Sun, W.; Hou, W. Application of ionic liquid modified carbon ceramic electrode for the sensitive voltammetric detection of rutin. Talanta 2010, 82, 1853–1857. [Google Scholar] [CrossRef] [PubMed]
  50. Zhu, Z.; Sun, X.; Zhuang, X.; Zeng, Y.; Sun, W.; Huang, X. Single-walled carbon nanotubes modified carbon ionic liquid electrode for sensitive electrochemical detection of rutin. Thin Solid Films 2010, 519, 928–933. [Google Scholar] [CrossRef]
  51. Sun, W.; Wang, X.; Zhu, H.; Sun, X.; Shi, F.; Li, G.; Sun, Z. Graphene-MnO2 nanocomposite modified carbon ionic liquid electrode for the sensitive electrochemical detection of rutin. Sens. Actuators B-Chem. 2013, 178, 443–449. [Google Scholar] [CrossRef]
  52. Gao, F.; Qi, X.; Cai, X.; Wang, Q.; Gao, F.; Sun, W. Electrochemically reduced graphene modified carbon ionic liquid electrode for the sensitive sensing of rutin. Thin Solid Films 2012, 520, 5064–5069. [Google Scholar] [CrossRef]
  53. Sun, W.; Wang, Y.; Gong, S.; Cheng, Y.; Shi, F.; Sun, Z. Application of poly(acridine orange) and graphene modified carbon/ionic liquid paste electrode for the sensitive electrochemical detection of rutin. Electrochim. Acta 2013, 109, 298–304. [Google Scholar] [CrossRef]
  54. Roushani, M.; Valipour, A. Using electrochemical oxidation of Rutin in modeling a novel andsensitive immunosensor based on Pt nanoparticle and graphene–ionicliquid–chitosan nanocomposite to detect human chorionicgonadotropin. Sens. Actuators B-Chem. 2016, 222, 1103–1111. [Google Scholar] [CrossRef]
  55. Shkrob, I.A.; Marin, T.W.; Chemerisov, S.D.; Hatcher, J.L.; Wishart, J.F. Radiation Induced Redox Reactions and Fragmentation of Constituent Ions in Ionic Liquids. 2. Imidazolium Cations. J. Phys. Chem. B 2011, 115, 3889–3902. [Google Scholar] [CrossRef] [PubMed]
  56. Ferrari, A.C.; Robertson, J. Interpretation of Raman spectra of disordered and amorphous carbon. Phys. Rev. B 2000, 61, 14095–14107. [Google Scholar] [CrossRef]
  57. Takeda, M.; Iavazzo, R.E.S.; Garfinkel, D.; Scheinberg, I.H.; Edsall, J.T. Raman Spectra of Amino Acids and Related Compounds. IX. Ionization and Deuterium Substitution in Glycine, Alanine and β-Alanine1,2,3. J. Am. Chem. Soc. 1958, 80, 3813–3818. [Google Scholar] [CrossRef]
  58. Bisquert, J.; Garcia-Belmonte, G.; Bueno, P.; Longo, E.; Bulhões, L.O.S. Impedance of constant phase element (CPE)-blocked diffusion in film electrodes. J. Electroanal. Chem. 1998, 452, 229–234. [Google Scholar] [CrossRef]
  59. Hirschorn, B.; Orazema, M.E.; Tribollet, B.; Vivier, V.; Frateur, I.; Musiani, M. Determination of effective capacitance and film thickness fromconstant-phase-element parameters. Electrochim. Acta 2010, 55, 6218–6227. [Google Scholar] [CrossRef]
  60. Sasikumar, R.; Govindasamy, M.; Chen, S.M.; Chieh-Liu, Y.; Ranganathan, P.; Rwei, S.P.J. Electrochemical determination of morin in Kiwi and Strawberry fruit samples using vanadium pentoxide nano-flakes. J. Colloid Interface Sci. 2017, 504, 626–632. [Google Scholar] [CrossRef] [PubMed]
  61. Chang, J.L.; Wei, G.T.; Zen, J.M. Screen-printed ionic liquid/preanodized carbono electrode: Effective detection of dopamine in the presence of high concentration of ascorbic acid. Electrochem. Commun. 2011, 13, 174–177. [Google Scholar] [CrossRef]
  62. Hotta, H.; Ueda, M.; Nagano, S.; Tsujino, Y.; Koyama, J.; Osakai, T. Mechanistic study of the oxidation of caffeic acid by digital simulation of cyclic voltammograms. Anal. Biochem. 2002, 303, 66–72. [Google Scholar] [CrossRef] [PubMed]
  63. Wu, T.; Guan, Y.; Ye, J. Determination of flavonoids and ascorbic acid in grapefruit peel and juice by capillary electrophoresis with electrochemical detection. Food Chem. 2007, 100, 1573–1579. [Google Scholar] [CrossRef]
  64. Nagles, E.; García-Beltrán, O.; Hurtado, J. Speciation of morin and rutin in black tea, Cymbopogon citratus and fruit infusions by adsorption voltammetry using screen-printed carbon electrodes coated with chitosan: Effect of pH on speciation. Anal. Methods 2018, 10, 3680–3689. [Google Scholar] [CrossRef]
Figure 1. (A) Preparation of electromodified screen-printed carbon (SPC) electrode by cyclic voltammogram (CV) (10 cycles) and scanning electron microscopy (SEM) images of the (B) SPC, (C) chitosan (CS)/SPC electrodes, and (D) ionic liquid (IL)-CS/SPC.
Sensors 18 02934 g001
Figure 2. (A) Nyquist plot for Fe(CN)63−/4− 10.0 mmol L−1 in KCl 10 mmol L−1 using SPC (black curve), CS/SPC (blue curve) and IL-CS/SPC (red curve). (B) Cyclic voltammograms of Fe(CN) 3−/4− 10.0 mmol L−1 in KCl 10 mmol L−1 using SPC (dash curve), CS/SPC (dash-dot curves) and IL-CS/SPC (solid curve). Scan rate (v) 0.1 V s−1.
Sensors 18 02934 g002
Figure 3. (A) Cyclic voltammograms of rutin (RT) (35.0 mmol L−1) pH 2.5 (PBS) using SPC, CS/SPC, and IL-CS/SPC electrodes. 0.1 V s−1. (B) cathodic and adsorptive stripping voltammograms of RT (3.5 µmol L−1). Conditions: pH 2.5 (PBS); cathodic stripping voltammetry (CSV): Eads 0.6 V; tads 60 s; adsorptive stripping voltammetry (AdSV): Eads 0.1 V; tads 60 s. Other conditions: Step amplitude 0.01 V; pulse amplitude 0.05 mV; and frequency 15 Hz.
Sensors 18 02934 g003
Figure 4. (A) Voltammograms and (B) plots of the dependence of anodic peak potentials vs. ln ν for RT (35.0 µmol L−1) using IL-CS/SPC electrode.
Sensors 18 02934 g004
Figure 5. (A) Voltammograms of the effect of the pH (6.3, 5.3, 4.3, 3.3, and 2.5) for 35.0 μmol L−1 of RT, and (B) plots of the dependence of anodic peak potentials vs. pH for RT using IL-CS/SPC. Conditions: scan rate of 0.1 V s−1.
Sensors 18 02934 g005
Figure 6. (A) Adsorptive voltammograms and calibration curve (insert) of RT between 0.75−12.5 µmol L−1; (B) adsorptive voltammograms (n = 10) for RT 35.0 µmol L−1; (C) and anodic peak current for RT 35.0 and 13.3 µmol L−1 using four different CS/SPC electrodes. Conditions: pH 2.5; EADS 0.1 V; tADS 60 s.
Sensors 18 02934 g006
Figure 7. (A) Amperograms for RT with morin (MR), quercetin (QC), metal ions, hydroquinone (HQ), catechol (CT), dopamine (DP), ascorbic acid (AA), uric acid (UA), tartrazine (TZ), sunset yellow (SY) and (B) adsorptive voltammograms and calibration curves (inset) of sample 1 * (Table 2). Using the IL-CS/SPC electrode under the same conditions as Figure 6.
Sensors 18 02934 g007
Table 1. Modified electrodes for rutin determination.
ElectrodeMaterialsDL (µmol L−1)ApplicationReference
GCECu–CS/MWCNT0.01Fruits[42]
ABPECS/ MWCNT0.01Pharmaceutical samples[43]
CPEIL0.01Pharmaceutical samples[33]
GCECS/G0.50Pharmaceutical samples[44]
GCEIL-MWCNT0.02 [47]
SPCCS0.09Tea[63]
SPCIL-CS0.07Tropical fruitsThis work
GCE: glassy carbon electrode; CPE: carbon paste electrode; ABPE: acetylene black paste electrode; Cu–CS/MWCNT: copper-complexed chitosan/multiwalled carbon nanotubes; G-CS-polyAA: graphene nanosheets, chitosan, and a poly (amido amine).
Table 2. Results for RT in urine chemistry control standard.
SampleAdded (µmol L−1)Found (µmol L−1)% Relative error
1 *1.741.94 ± 0.0111.5
21.741.95 ± 0.0212.1
33.503.92 ± 0.0512.0
43.503.72 ± 0.046.3
* voltammograms are shown in Figure 7B (insert calibration curve).
Table 3. Results for RT in tropical fruit samples.
SampleFound (mol µL−1)RDS (%)
RTRT
Agraz extract18.30.50
Orange2.300.05
Lemon4.200.08

