Oscillation Suppression in the Sense Mode of a High-Q MEMS Gyroscope Using a Simplified Closed-Loop Control Method

1
Research & Development Institute, Northwestern Polytechnical University, Shenzhen 518057, China
2
MOE Key Laboratory of Micro and Nano Systems for Aerospace, Northwestern Polytechnical University, Xi’an 710072, China
*
Author to whom correspondence should be addressed.
Sensors 2018, 18(8), 2443; https://doi.org/10.3390/s18082443
Submission received: 11 April 2018
/
Revised: 21 July 2018
/
Accepted: 24 July 2018
/
Published: 27 July 2018
(This article belongs to the Special Issue Inertial Sensors and Systems 2018)
Abstract
:The oscillation of the sense mode of the micro-machined Coriolis vibratory gyroscope (MCVG) with high quality factor (Q) is analyzed in this study and the corresponding force feedback control scheme is presented to suppress this oscillation. The controller consists of integrator and some filters, instead of the common but complicated demodulation and remodulation modules. Compared with using no oscillation suppression scheme, the proposed simplified oscillation suppression control scheme can achieve an improvement of the sense mode of the MCVG. The inband spectrum ripple of the angular rate output are improved from 51.4 dB to 4.23 × 10⁻⁴ dB. Correspondingly, these two performance parameters are improved by 370.4 and 186.2 times, which are higher than two orders of magnitude, respectively. Bias stability is improved from 9.72 deg/h to 2.5 deg/h. Test results prove that the proposed control scheme is effective in suppressing the oscillation.
1. Introduction
The micro-machined Coriolis vibratory gyroscope (MCVG) has been widely used in many fields, including for motor vehicles, robotics, and smartphones, because of its low cost and power, and high yield rate. However, its low performance limits further high-end applications of the MCVG. One important factor limiting its performance is the inevitable zero-rate output drift of the gyroscope, also known as the bias drift [1].
In order to reduce the bias and suppress bias drift, the bias sources resulting from various aspects have been analyzed, and corresponding control schemes have also been discussed in the published literature. First, the drive voltage will be coupled to the sense mode through the parasitic capacitances between the wire bonding pads, wires, proof mass, substrate, etc. [2,3,4] Researchers have aimed to reduce this in either the microfabrication process [5] or circuit design based on the trans-impedance amplifiers [6]. Second, the phase error in the circuits will inevitably result in an incomplete demodulation, which is also an important bias source [7,8,9,10]. This error is suppressed by selecting the reference phase of the drive-mode control circuits. Third, the mechanical movement in the drive mode will be coupled to the sense mode because both modes cannot be ensured to be perfectly orthogonal by current fabrication technologies, which is also known as the quadrature error [2,11,12]. The quadrature error of the MCVG has usually been suppressed by adaptive control, sigma-delta demodulator scheme, or demodulation and modulation scheme [6,13,14,15,16,17,18,19,20].
Currently, the high-vacuum packaging technology is an efficient method to improve the performance of the MCVG. It can suppress some bias sources by increasing the quality factor (Q) of the MCVG [21,22,23,24]. Nevertheless, the MCVG, as a typical two-order mass-damping-stiffness system, almost works in a critical damping state with increasing Q. Especially, when the sense-mode resonant frequency further approaches the drive-mode frequency with the aim of achieving higher signal noise ratio (SNR), the harmful oscillation of the sense-mode of the MCVG will be inevitably induced by slight external disturbances or the drive-mode vibration in small bandwidth. This will lead to a drastic fluctuation of the bias and severe performance deterioration. In our experiments, for a gyroscope with a Q of 30,000 in the sense mode with small bandwidth, the oscillation can generate an alternating current (AC) signal of 230 millivolts, which will cause the bias to fluctuate over time, severely deteriorating the gyroscope performance. Some researchers have designed special mode-matched schemes to improve the bias stability and performance of the MCVG [15,20]. In these schemes, performance seriously depends on the phase accuracy of the modulation and demodulation modules of the sense mode. Currently, a part of these items has been confirmed to contribute to this phase, such as quadrature error, feedthrough coupling, and even thermal drift of the circuit components. Nevertheless, other potentially unknown contribution items have not been confirmed yet. Therefore, it is not easy to provide accurate phase confirmation to improve performance, which also drove us to design an alternative control scheme in the sense mode to suppress the oscillation. In this work, the oscillation of the sense mode is first analyzed in a typical symmetrical MCVG. Then, based on the proposed combination scheme of integrator and filter, a simplified closed-loop control method without demodulation or remodulation modules is presented to suppress the oscillation.
This paper is organized as follows. In Section 2, the oscillation of the sense mode is described and analyzed. In Section 3, a simulation of the oscillation suppression method is presented. In Section 4, the gyroscope with and without oscillation suppression is compared. Finally, conclusions are presented in Section 5.
2. Analysis of Oscillation of Sense Mode
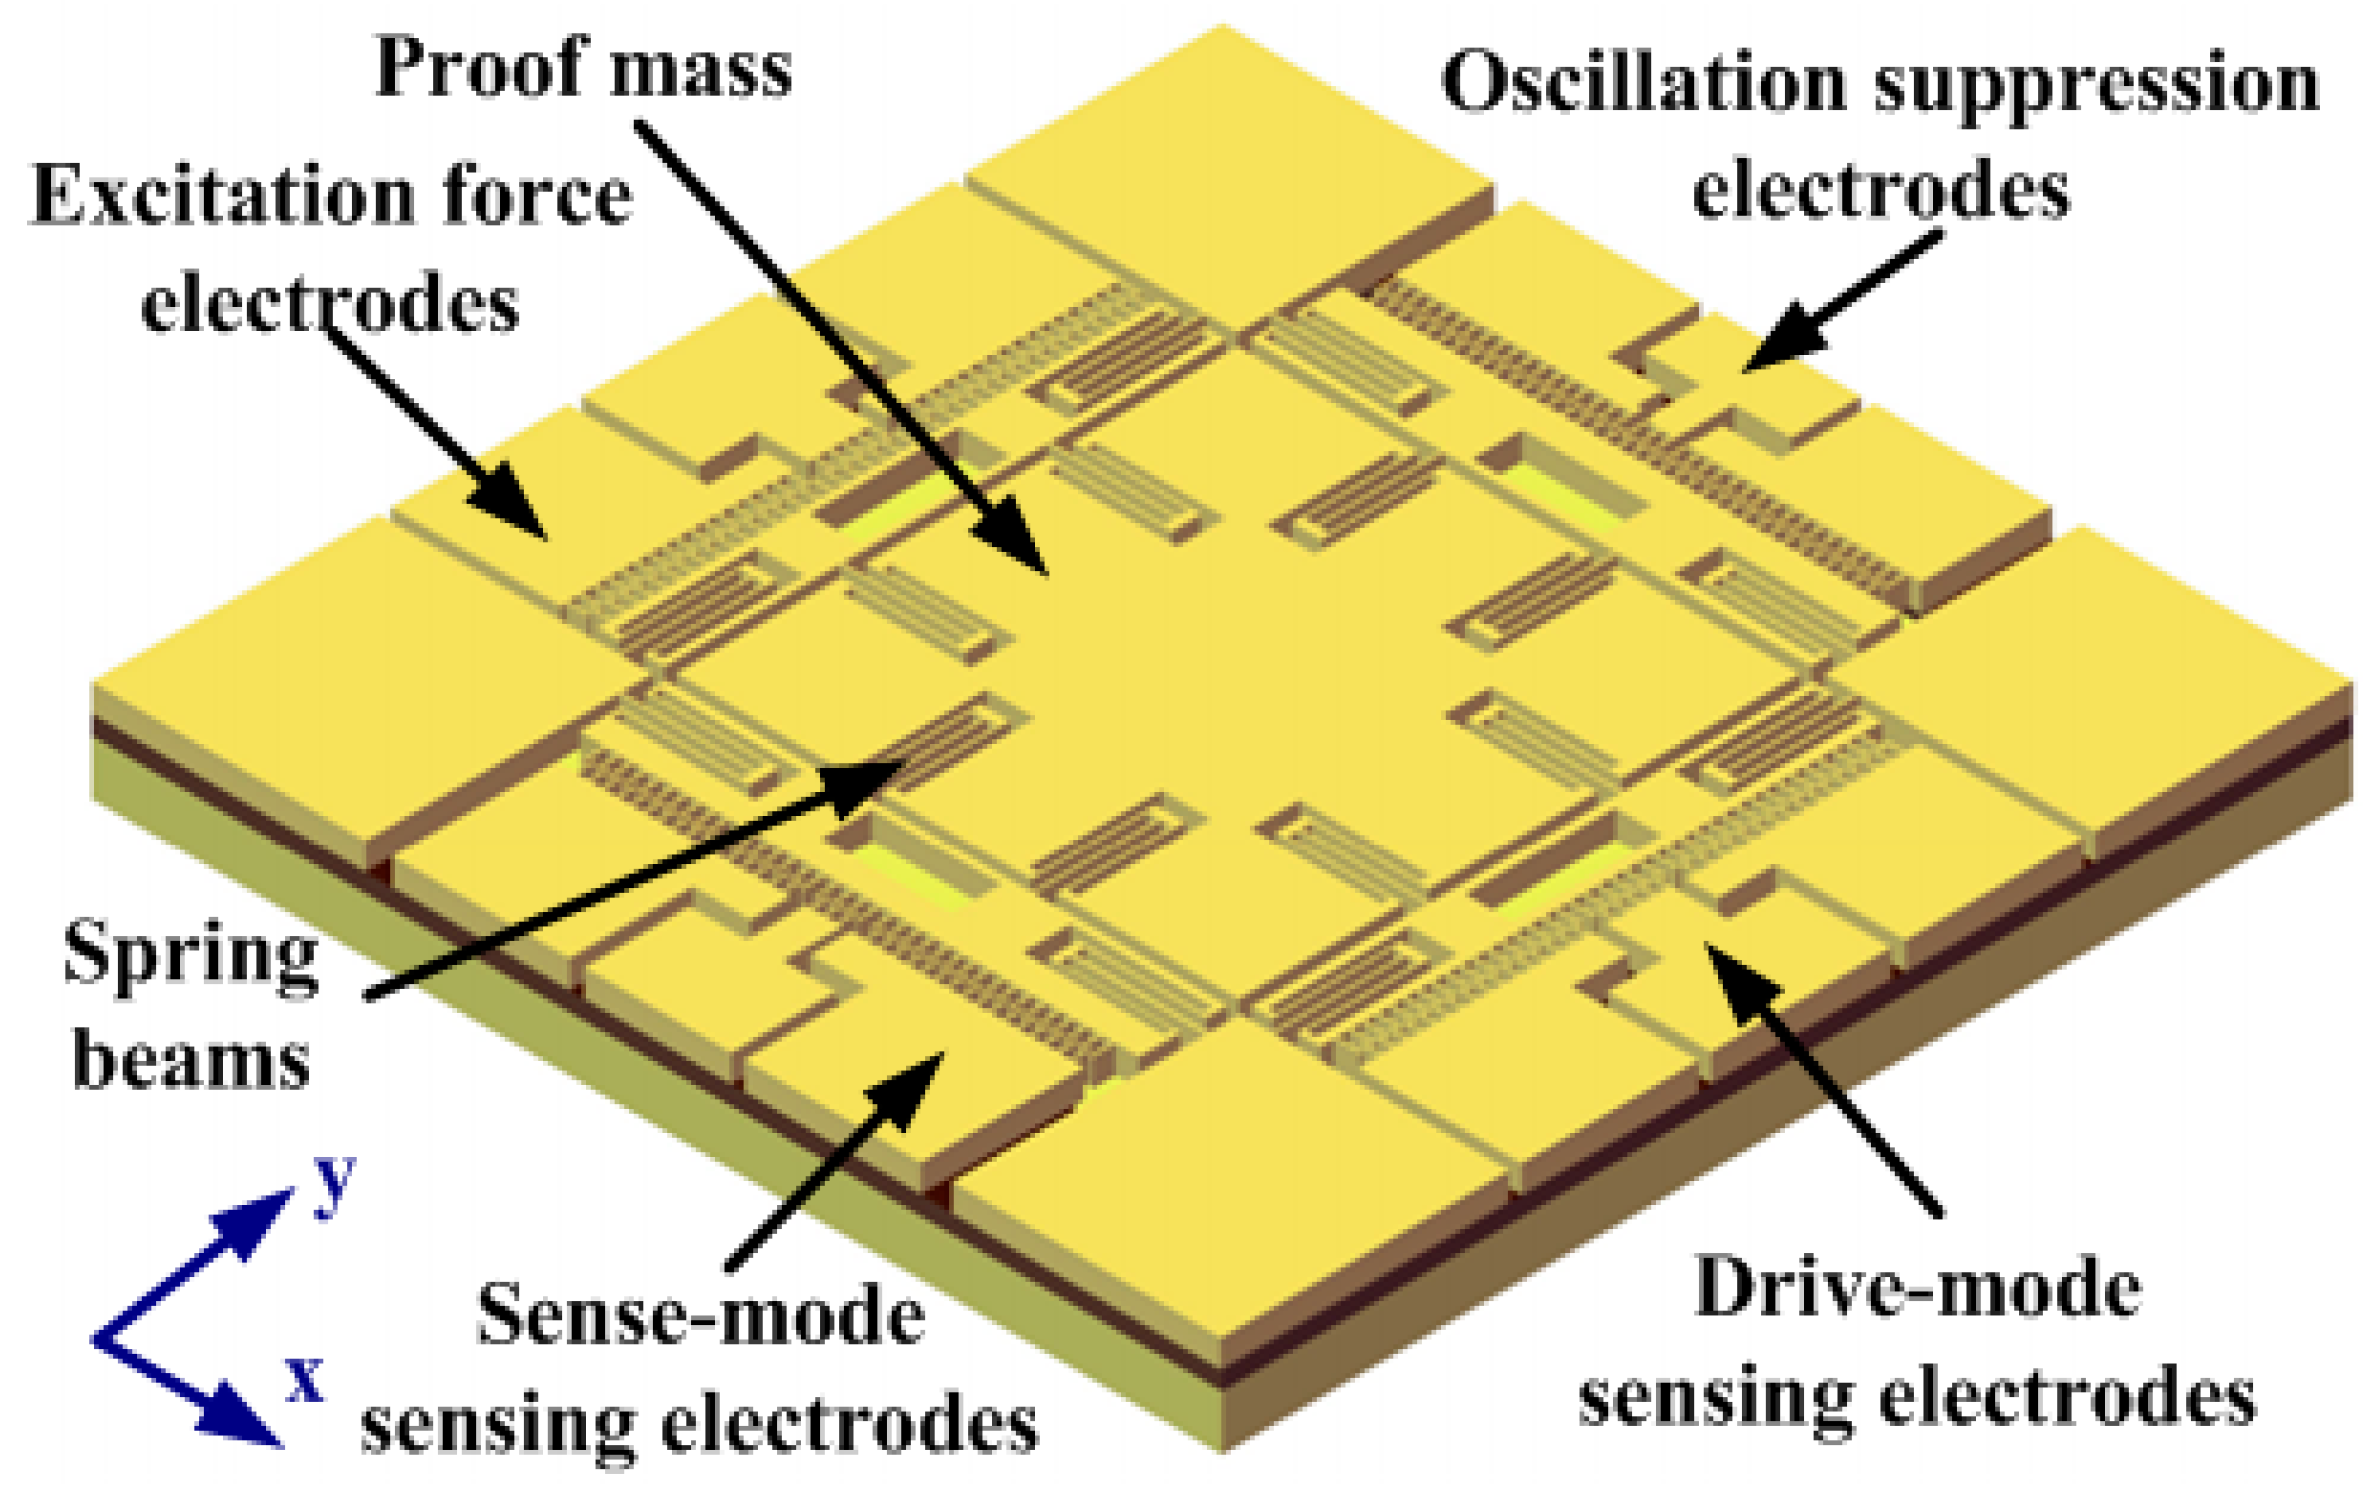
In this work, a completely symmetrical Z-axis gyroscope was selected as the controlling object, as shown in Figure 1. The detailed operation principles of the gyroscope are omitted here, as they were described in our previous work [24].
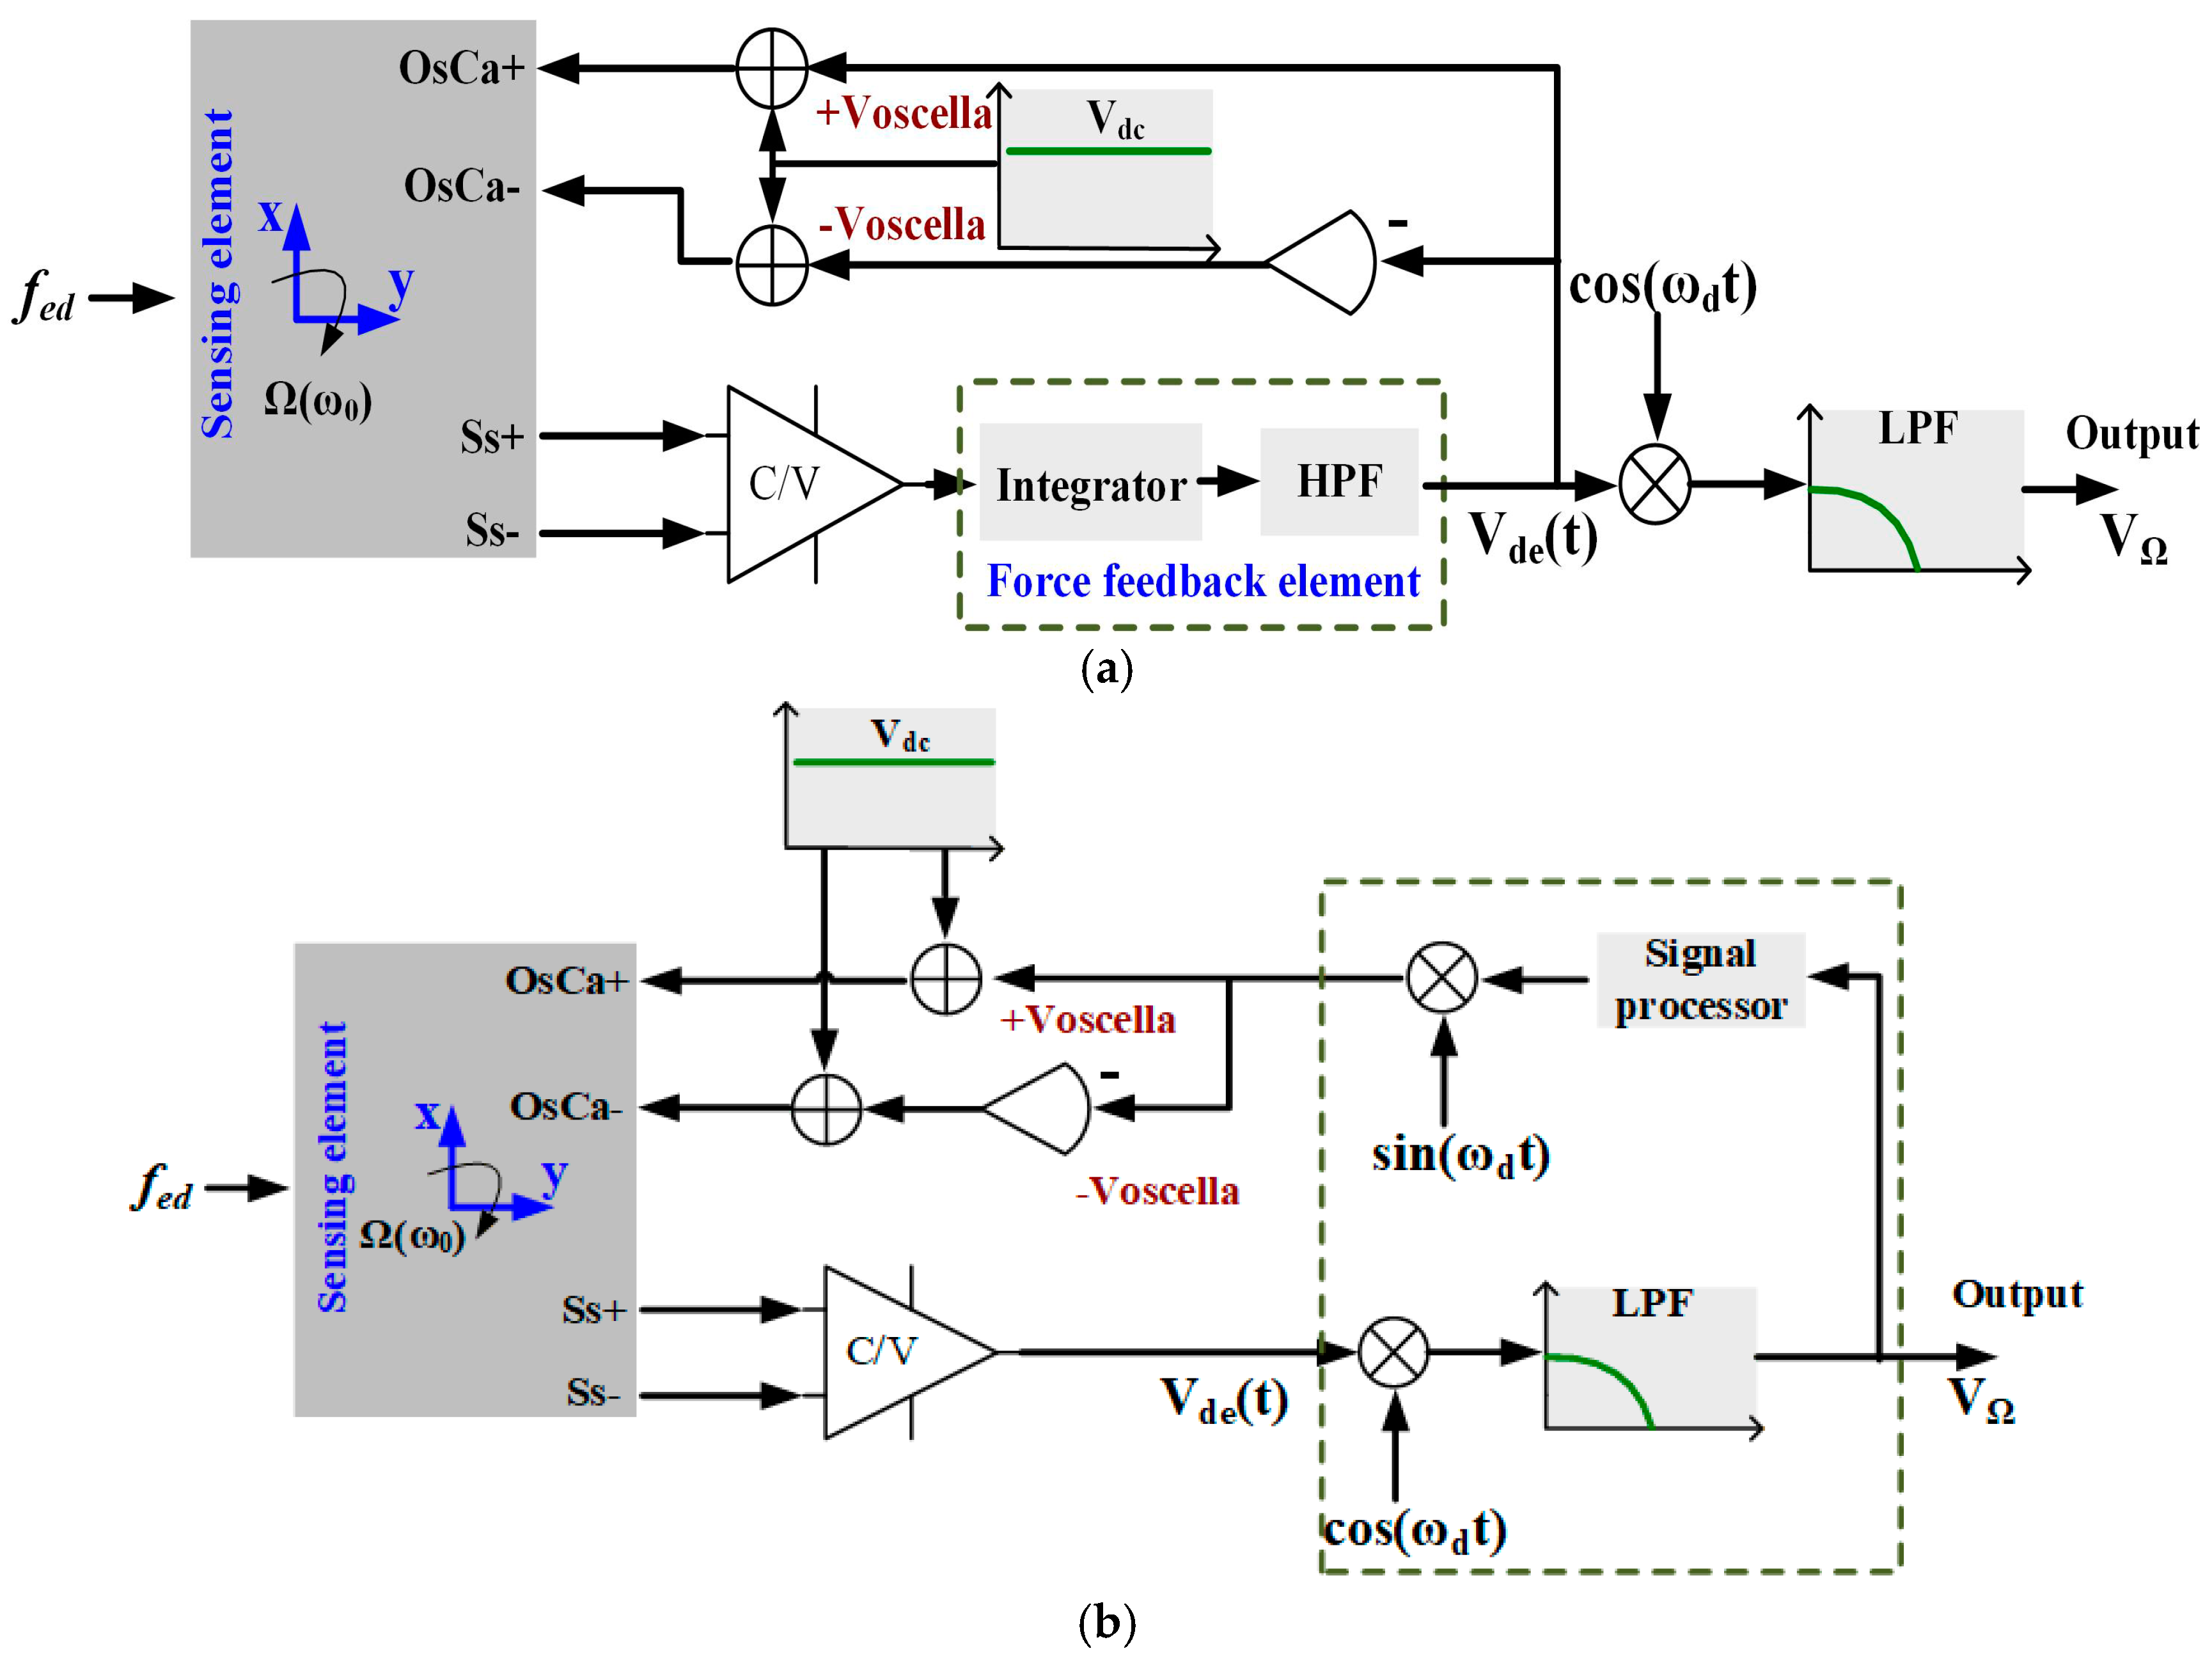
According to the schematic representation of the gyroscope, the angular rate detection electronics consists of the C/V sensing element of the gyroscope and the proposed force control element marked in the dotted box, as shown in Figure 2a. To be compared with the proposed scheme, the traditional method is also presented in a dotted box in Figure 2b [20]. Signals cos(ωdt) and sin(ωdt) belong to the demodulation and modulation modules, respectively.
In the angular rate detection electronics, when a random disturbance is applied to the gyroscope, the oscillation of the sense mode will occur easily at the resonance frequency ωs because of the high Q of the gyroscope, which is caused by the high-vacuum packaging. The random disturbance signal can be assumed as a cosine signal and its expression is written as
where fed is the amplitude of the external disturbance, ξ is the phase offset, and ωs = 2πfs is the sense-mode resonance frequency. The transfer function from the external disturbance force to the oscillation displacement of the sense mode could be written as
where s = jωs and ms is the mass of the sense mode. Displacement of the oscillation can be written as
From Equation (3), it can be seen that the amplitude of the oscillation is mainly dominated by the disturbance force fed and the sense-mode quality factor Qs. In Figure 2, this displacement is directly picked from the Ss+ and Ss− ports of the sensing element. After the interface circuits, the oscillation voltage can be expressed as
where η and are very small phase shift and gain from the displacement yso(t) to the input Vde(t) of the demodulator including the proposed integrator and filter, respectively. Subsequently, the signal is demodulated by the reference cosine signal cos(ωdt) and low-pass filtered to obtain the output voltage VΩ, which is written as
where the gyroscope output VΩ generated by the oscillation is still a cosine signal with an oscillation frequency |ωs − ωd|.
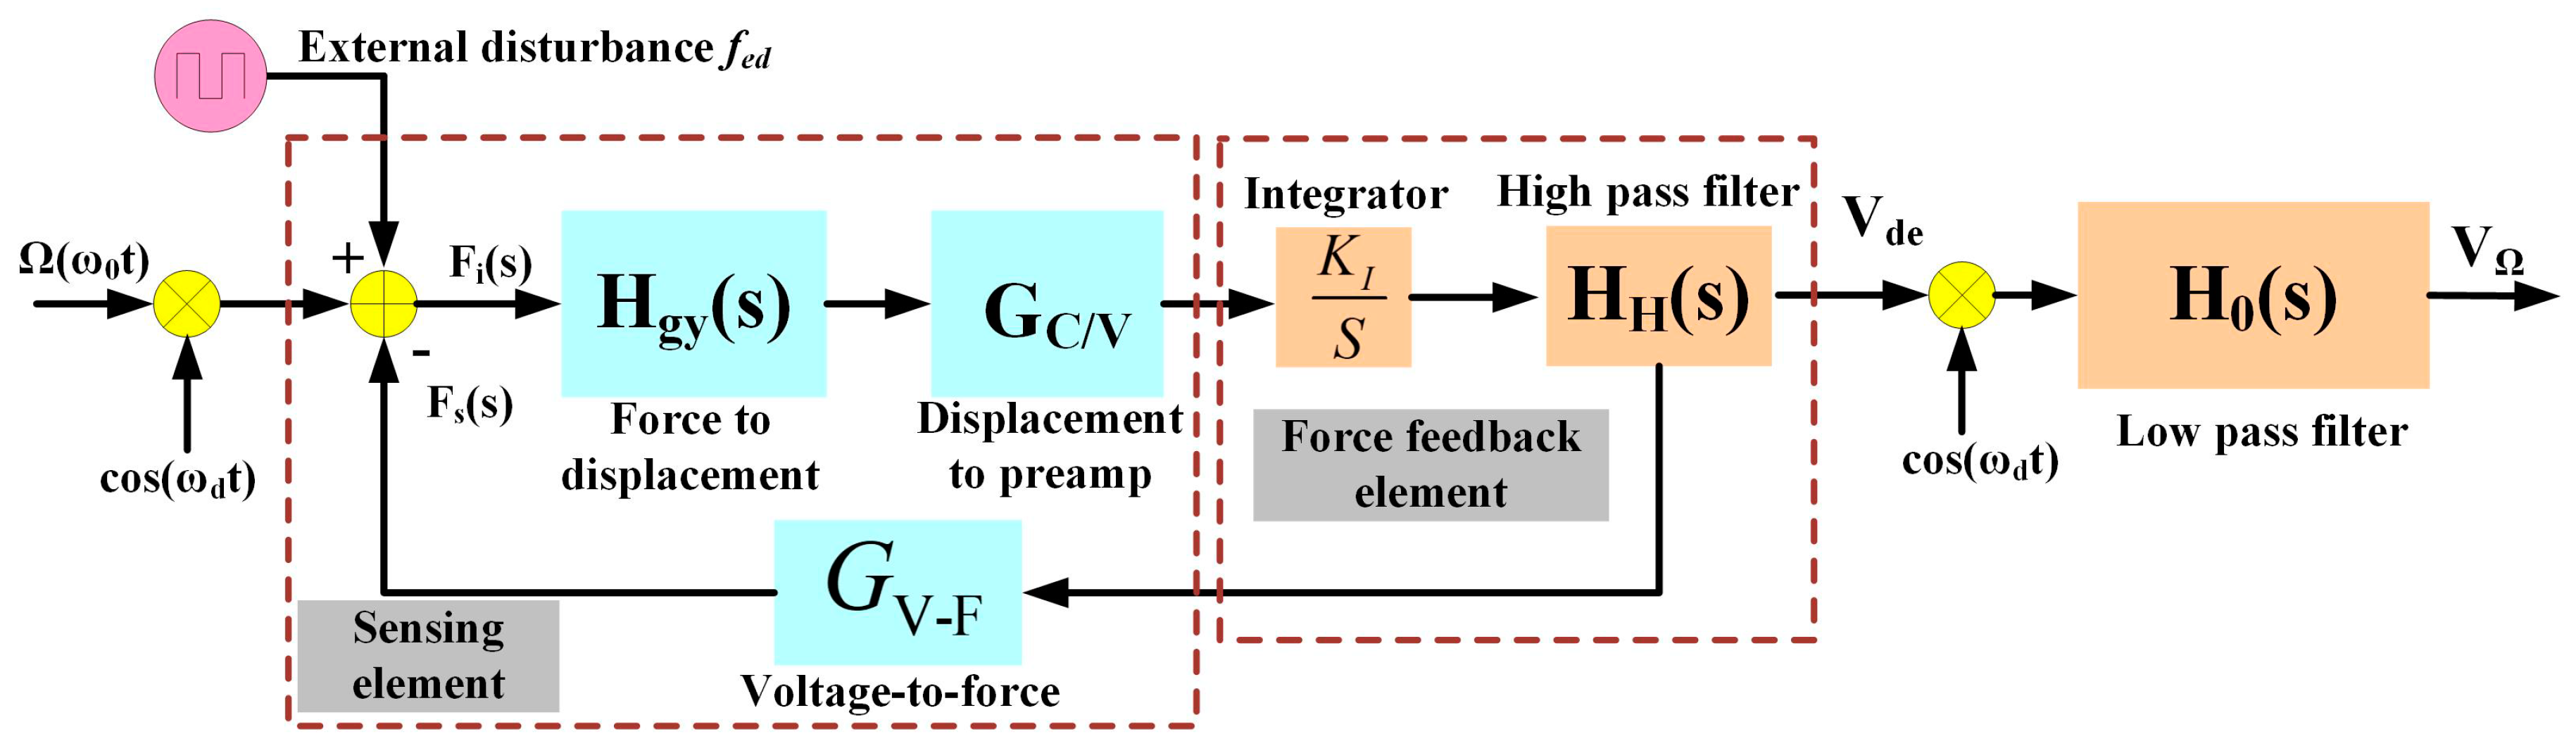
In the sense-mode force feedback loop, the output signal of the interface circuit module is fed into the controller consisting of the integrator and high-pass filter (HPF) located in the forward path. After the controller, the AC voltage Voscella is obtained and differentially applied on the oscillation suppression electrodes OsCa+ and OsCa− in the sense mode with a fixed Vdc bias voltage to generate the error suppression force. This force is in anti-phase with the external disturbance force fed. Figure 3 shows the transfer function of the proposed sense-mode force feedback control system.
The open loop transfer function of the control system can be written as
where GC/V is the gain of the displacement-to-voltage interface circuit module; KI is the gain of the proposed integrator; E(s) is dominated by the integrator and HPF characteristic, which are used to suppress the noise and keep the amplitude-frequency response constant within the frequency domain (ωd − ωΩ, ωd + ωΩ), where ωd is the resonance frequency of the drive mode of the gyroscope, and ωΩ = 2πfΩ is the working frequency of the input angular rate. HH(s) is the transfer function of the HPF and it is written as
where ωc = 2πfc is the cut-off frequency of the HPF (ωc is slightly smaller than ωd − ωΩ to satisfy the dynamic response to the angular rate). The closed-loop transfer function of the control system at the resonance frequency ωd is written as
In the closed-loop transfer function Y(s), the HPF and integrator are the strategic components that weaken the amplitude of the system at the frequency with fs. In addition, the inhibiting effect is illustrated through a simulation analysis in Section 3.
According to the Coriolis principle, frequency ωΩ of the angular rate Ω is demodulated by frequency ωd of the drive-mode velocity , where X is the amplitude of the drive-mode displacement. When the angular rate Ω(ω0t) is input, Vde can be written as
After Vde(jωd) is demodulated by cos(ωdt) and low-pass filtered by H0(s), of which cut-off frequency is slightly larger than ωΩ, the angular rate output signal VΩ can be derived as
where Hgy, HH, and E are gains of the sensing element, proposed filter, and E(s) at the resonance frequency ωd, respectively; H0 is the gain of H0(s) at the frequency ωΩ. Therefore, according to the size of VΩ, the angular rate input signal Ω(ω0t) could be calculated.
3. Simulation Analysis
To quantitatively illustrate the oscillation suppression of the sense mode of the high-Q MCVG, a SIMULINK model was constructed based on Figure 3 and the corresponding analysis. First, according to Equation (6), the simulation of the open-loop transfer function E(s) of the MCVG was performed. The corresponding time-domain and frequency-domain characteristics caused by the external vibration were analyzed. The simulation parameters are listed in Table 1. Subsequently, according to Equation (8), the simulation analysis of the closed-loop transfer function Y(s) was performed to verify the effectiveness of the proposed method. In order to compare them with the open-loop characteristics, the time-domain and frequency-domain characteristics were also analyzed. The corresponding closed-loop simulation parameters and comparison results are listed in Table 2 and Table 3, respectively.
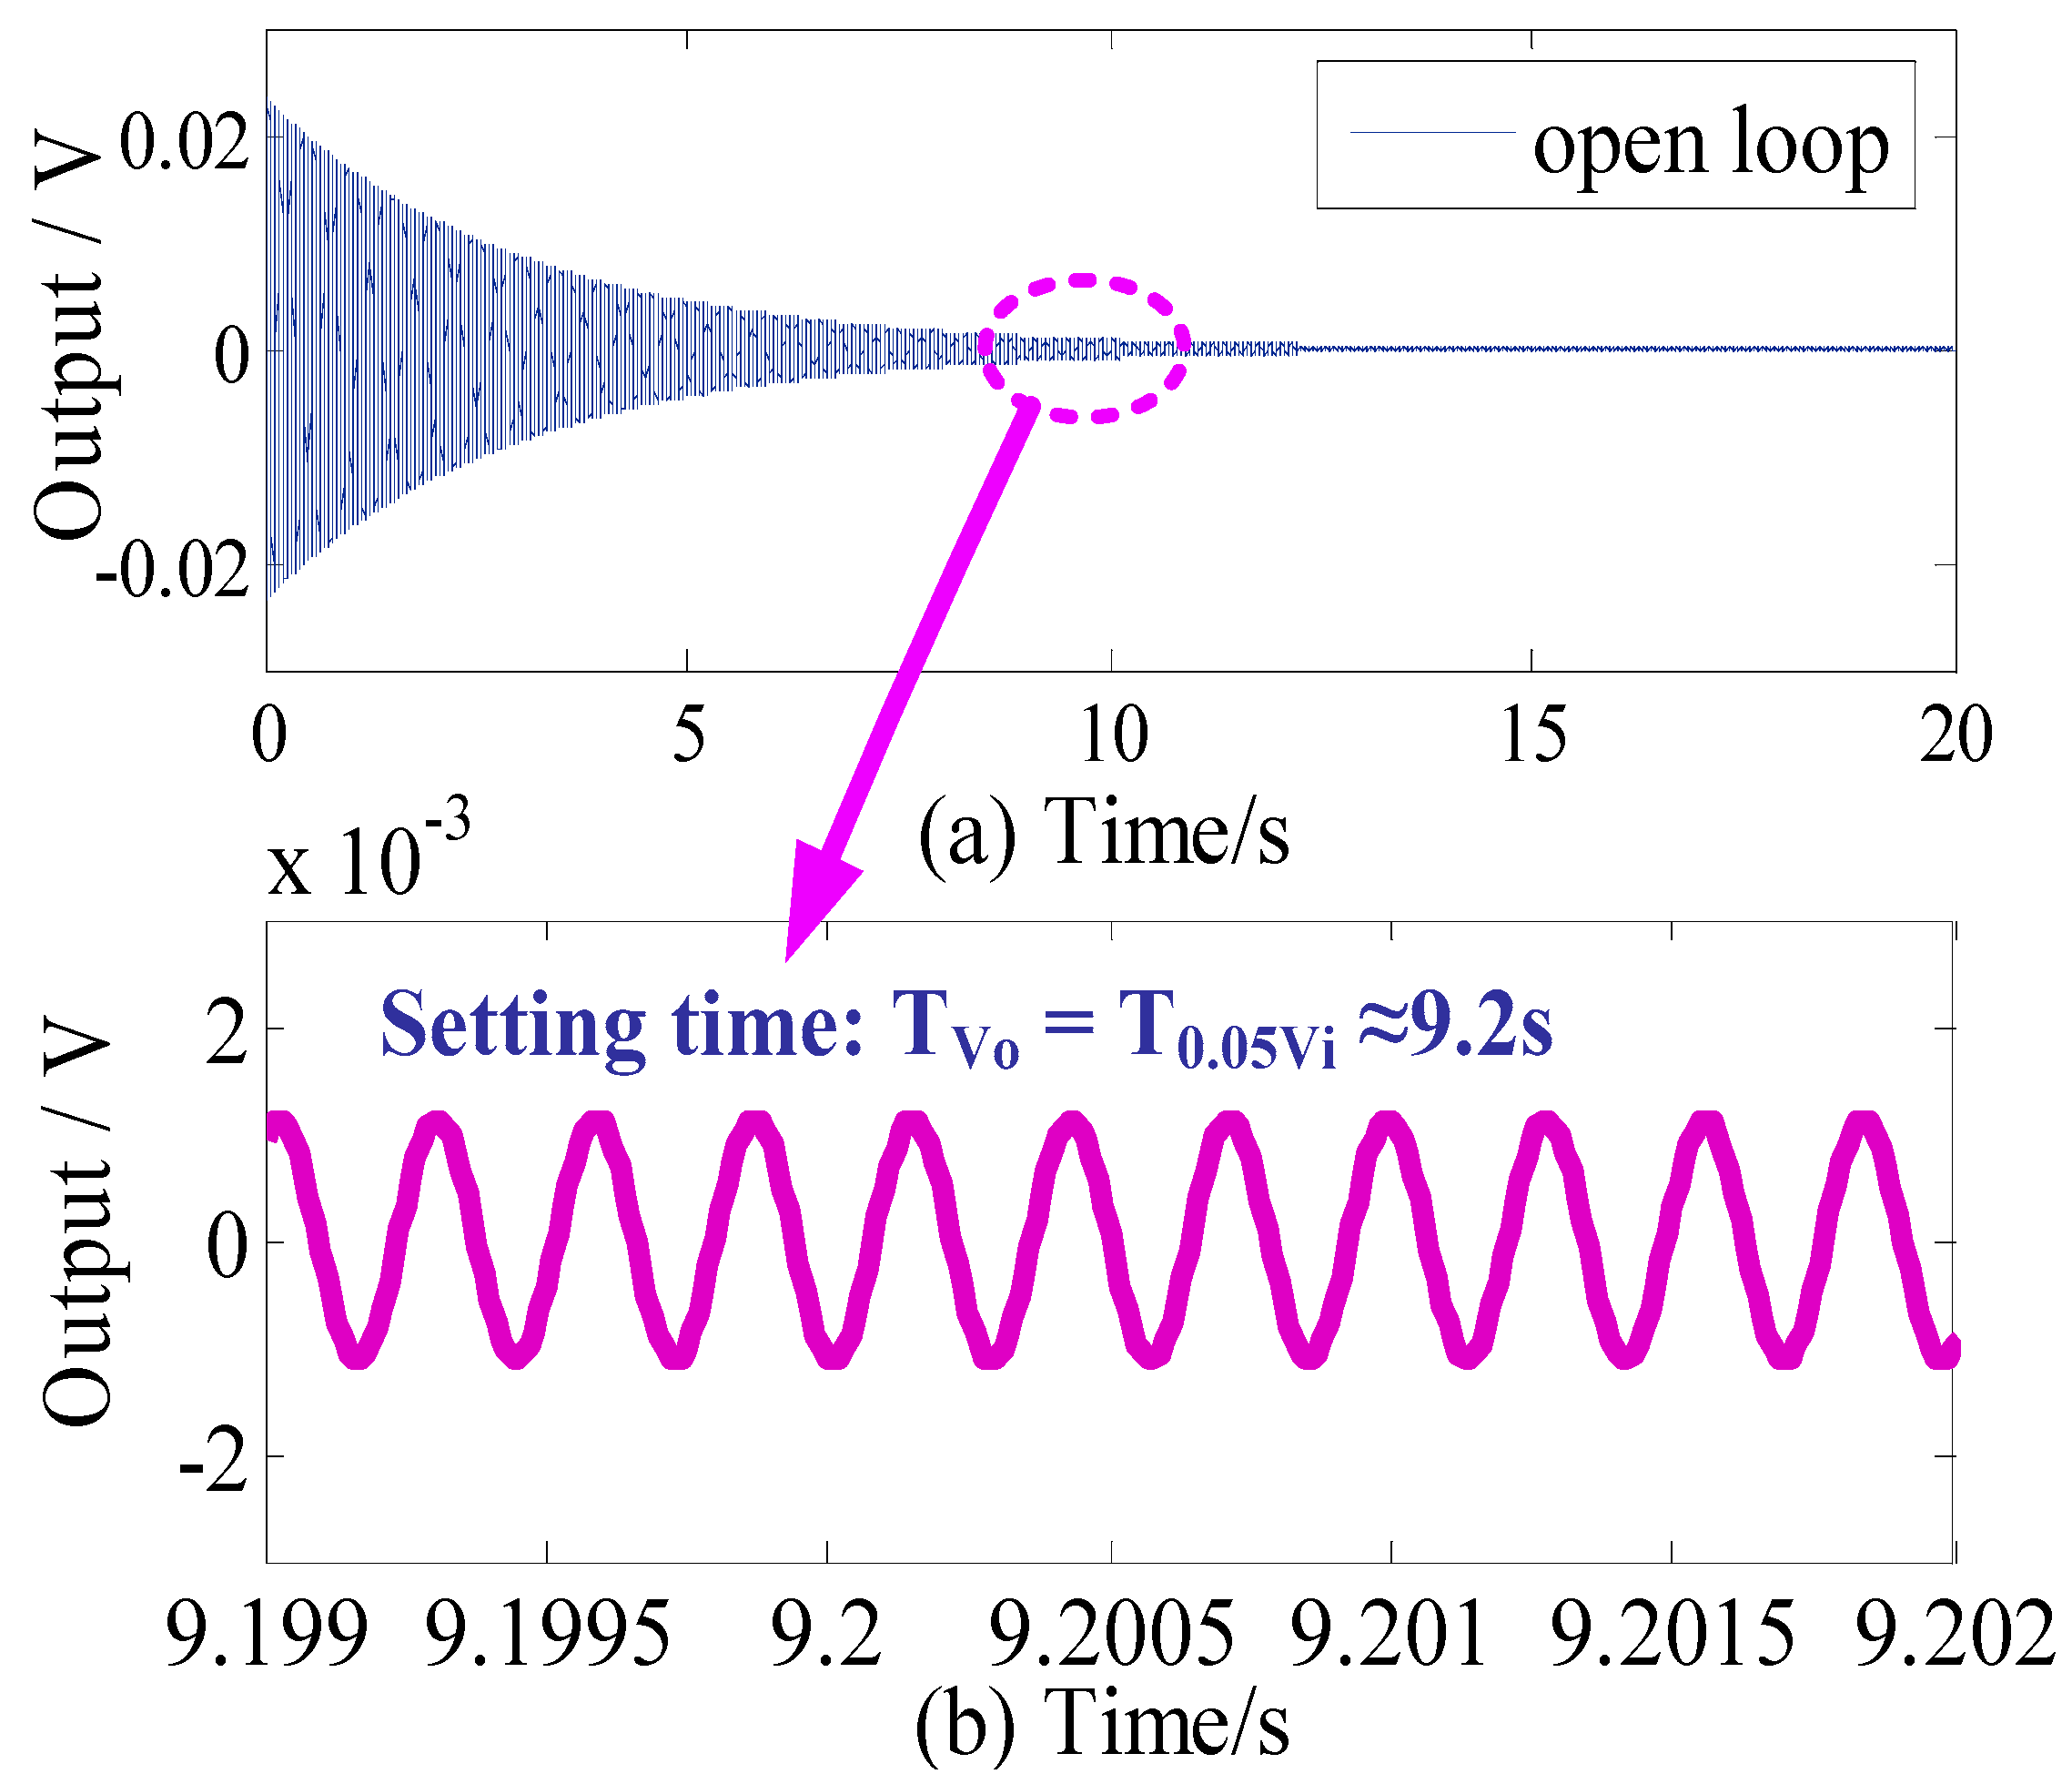
Figure 4 and Figure 5 show the open-loop time-domain and frequency-domain response curves of the sense mode of the MCVG, respectively. When an external disturbance is applied to the sensor, it could be seen in Figure 4a that the sense-mode ringdown oscillation representing the output of the MCVG lasts several seconds, which means that the bias seriously suffers from the external disturbance. Further, the close-up view of the curve is shown in Figure 4b. It can be seen that the setting time is about 9.2 s.
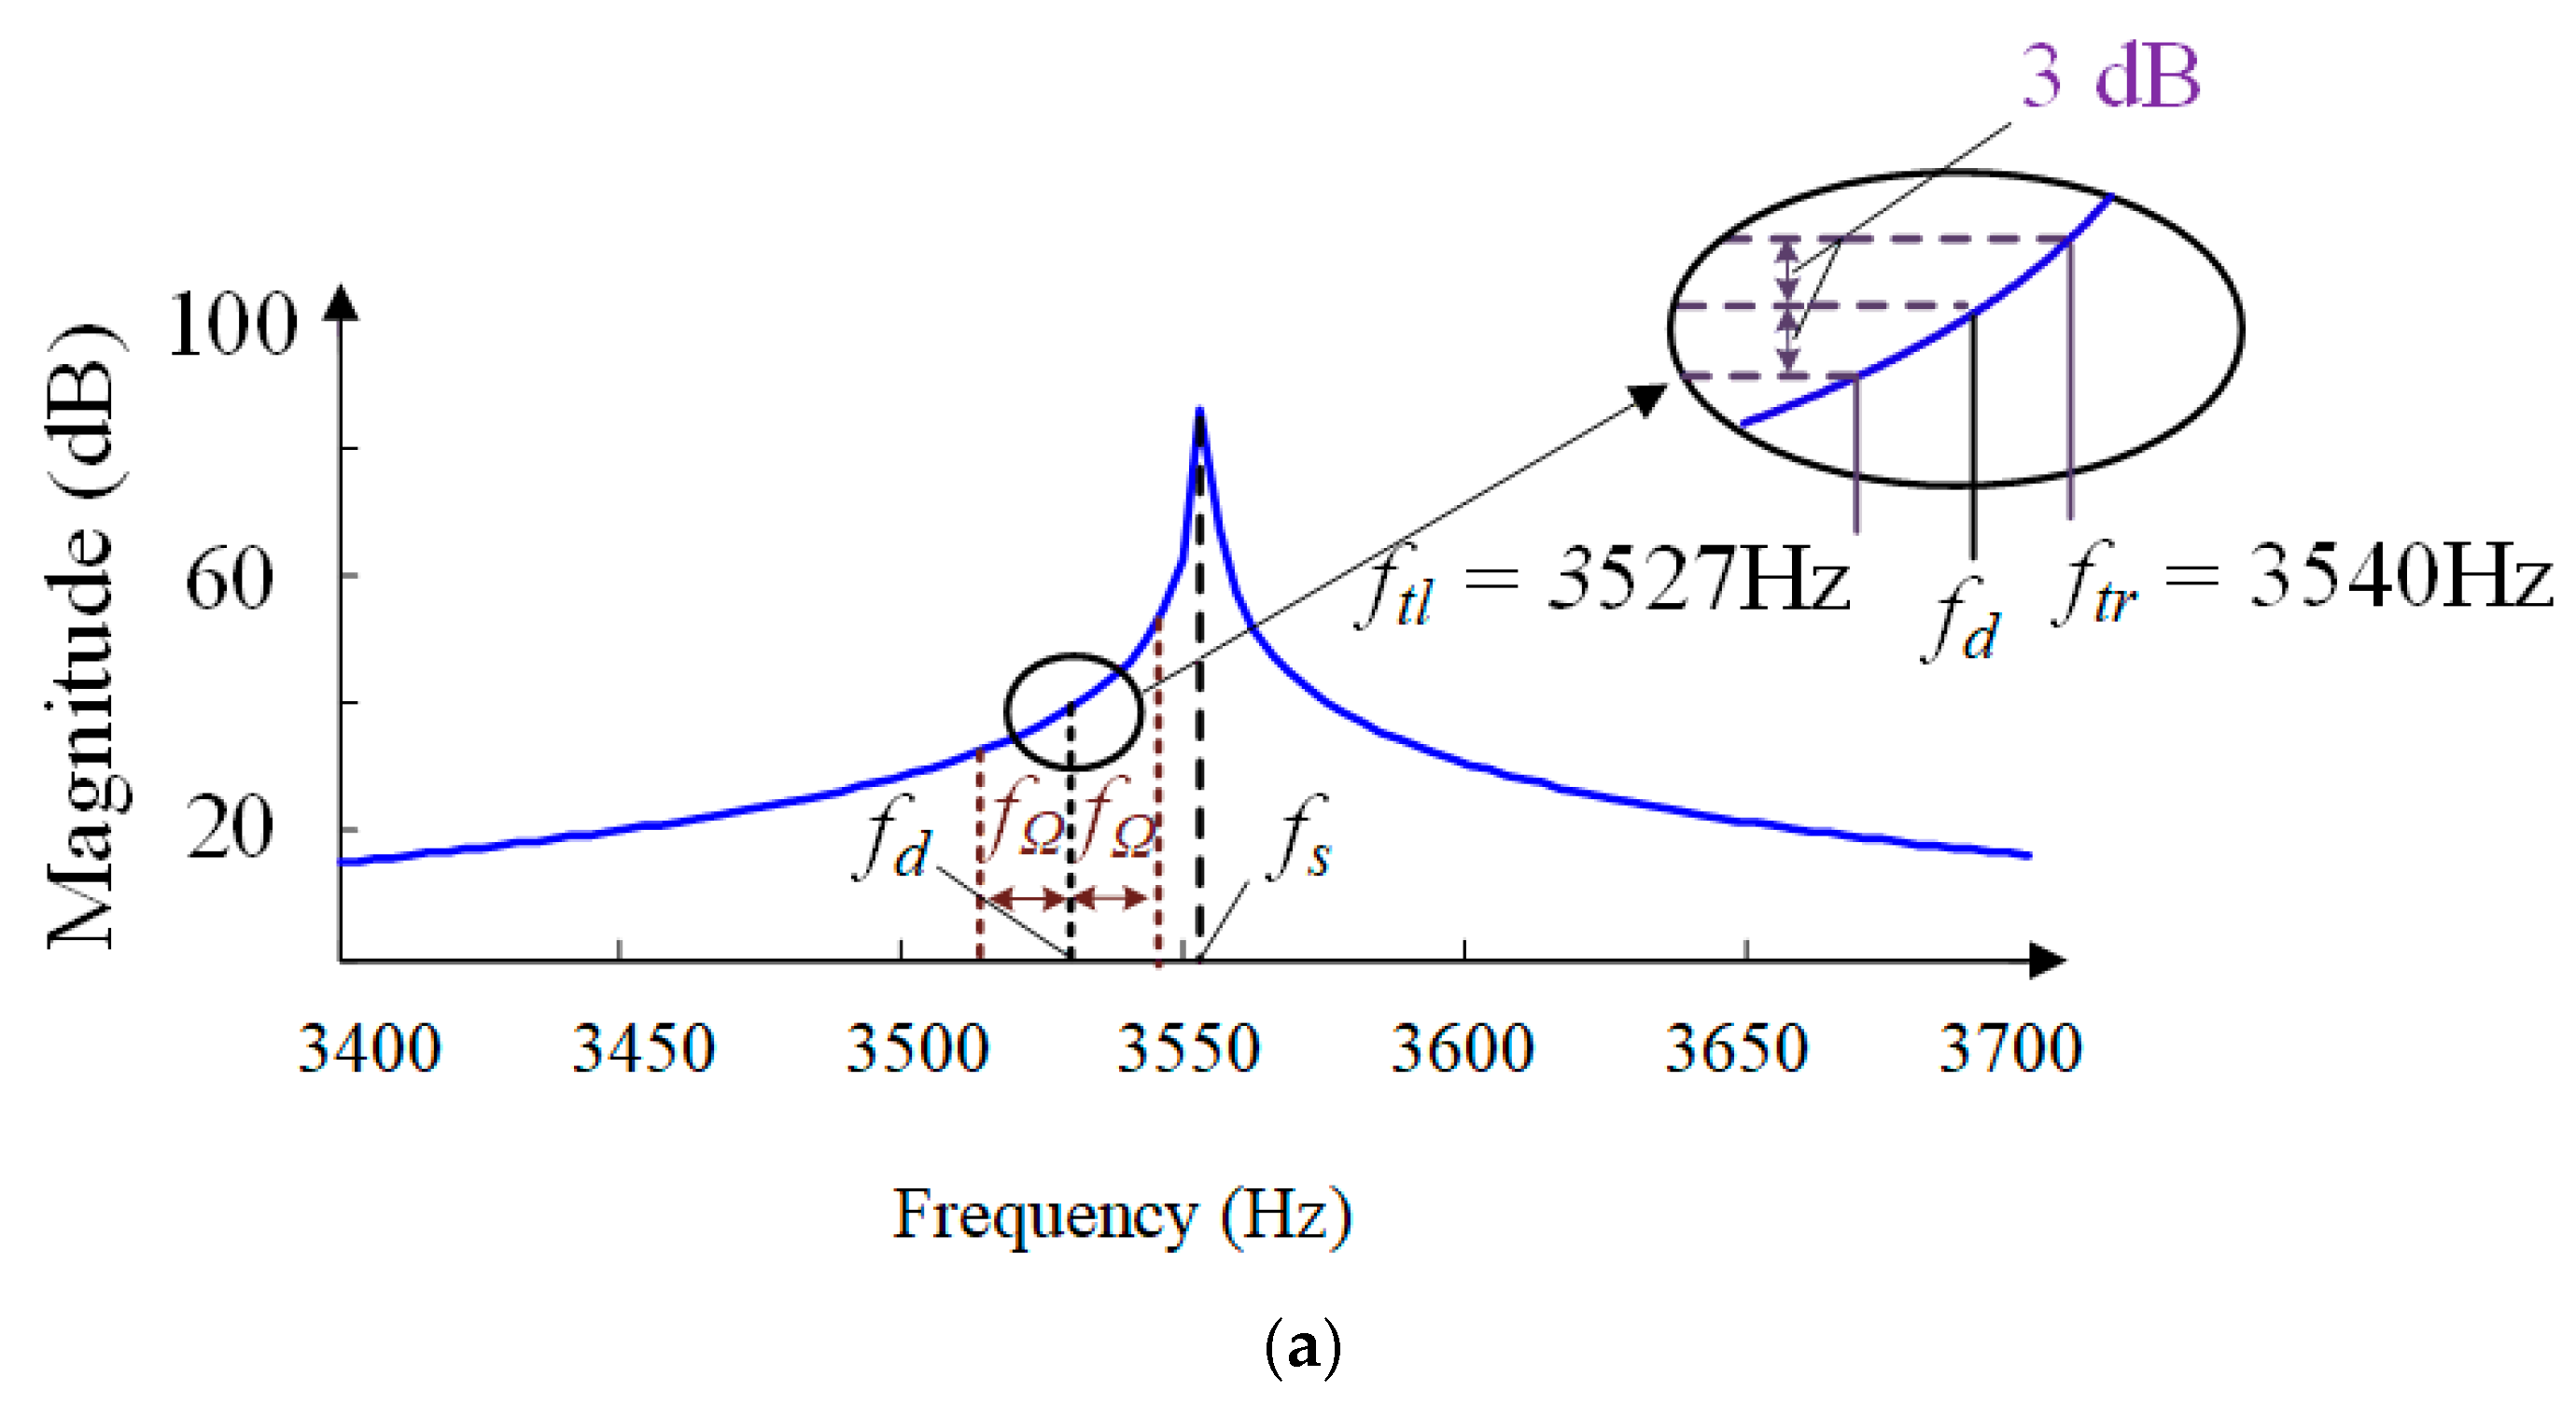
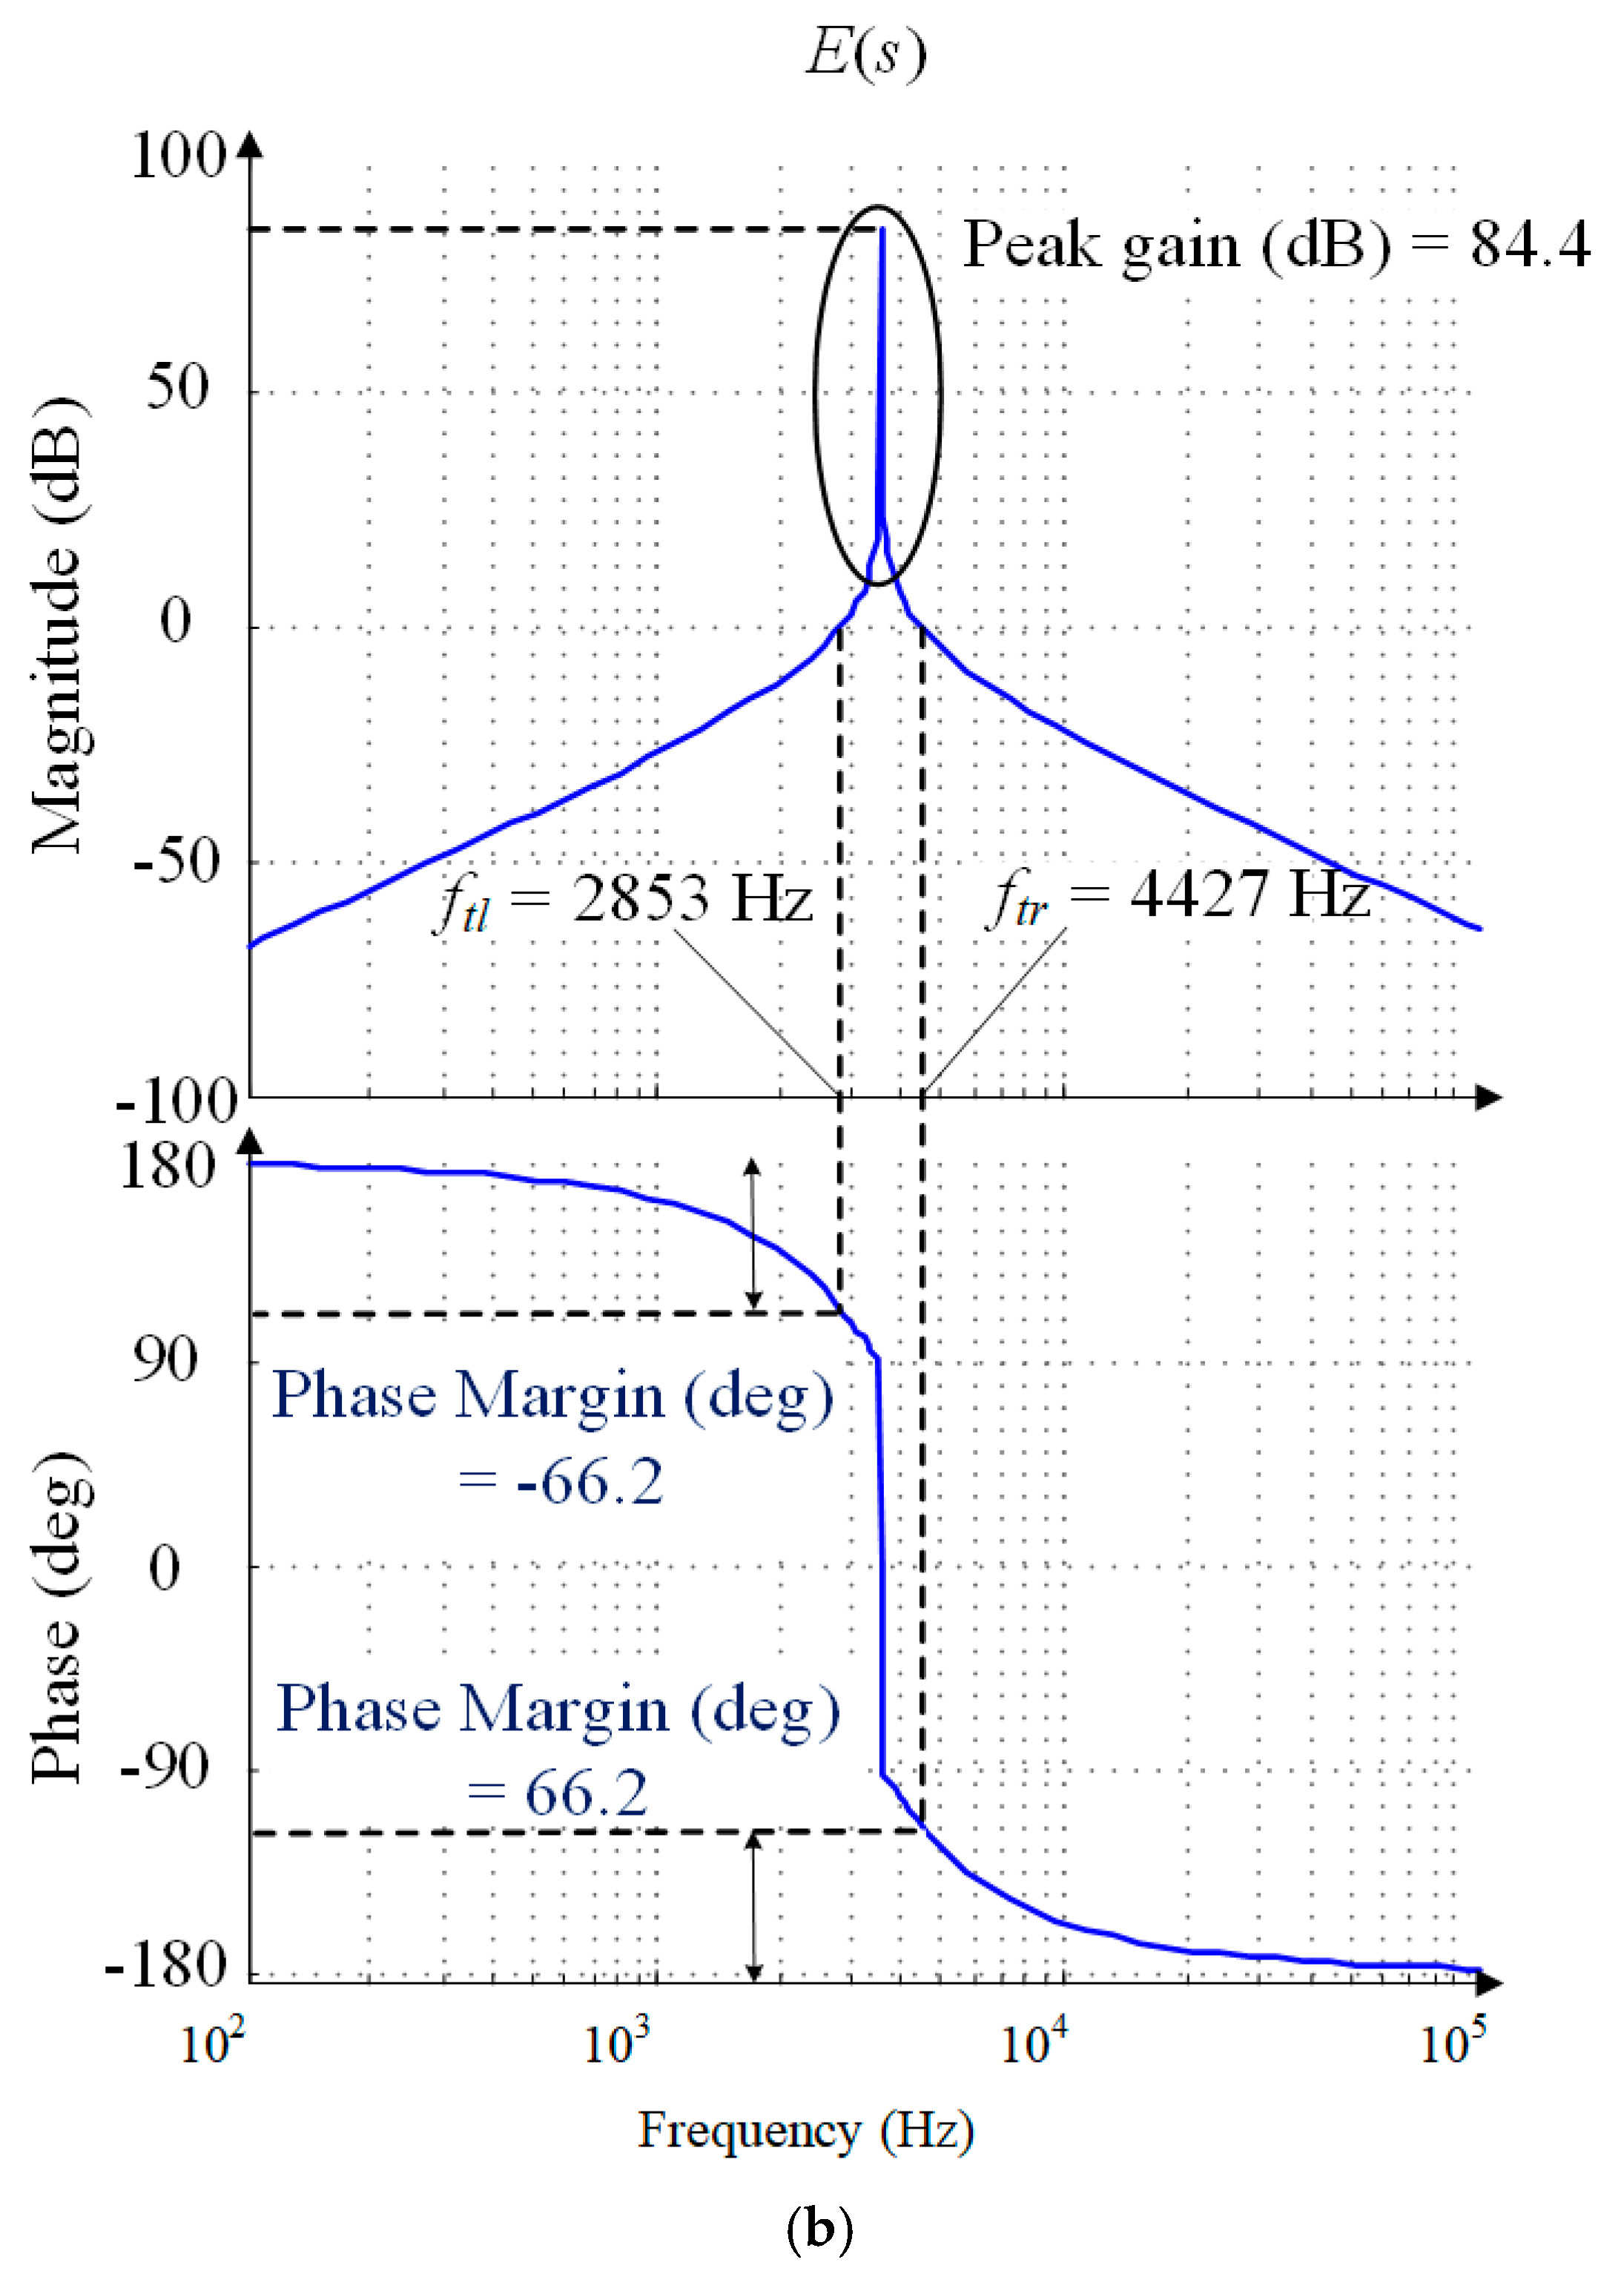
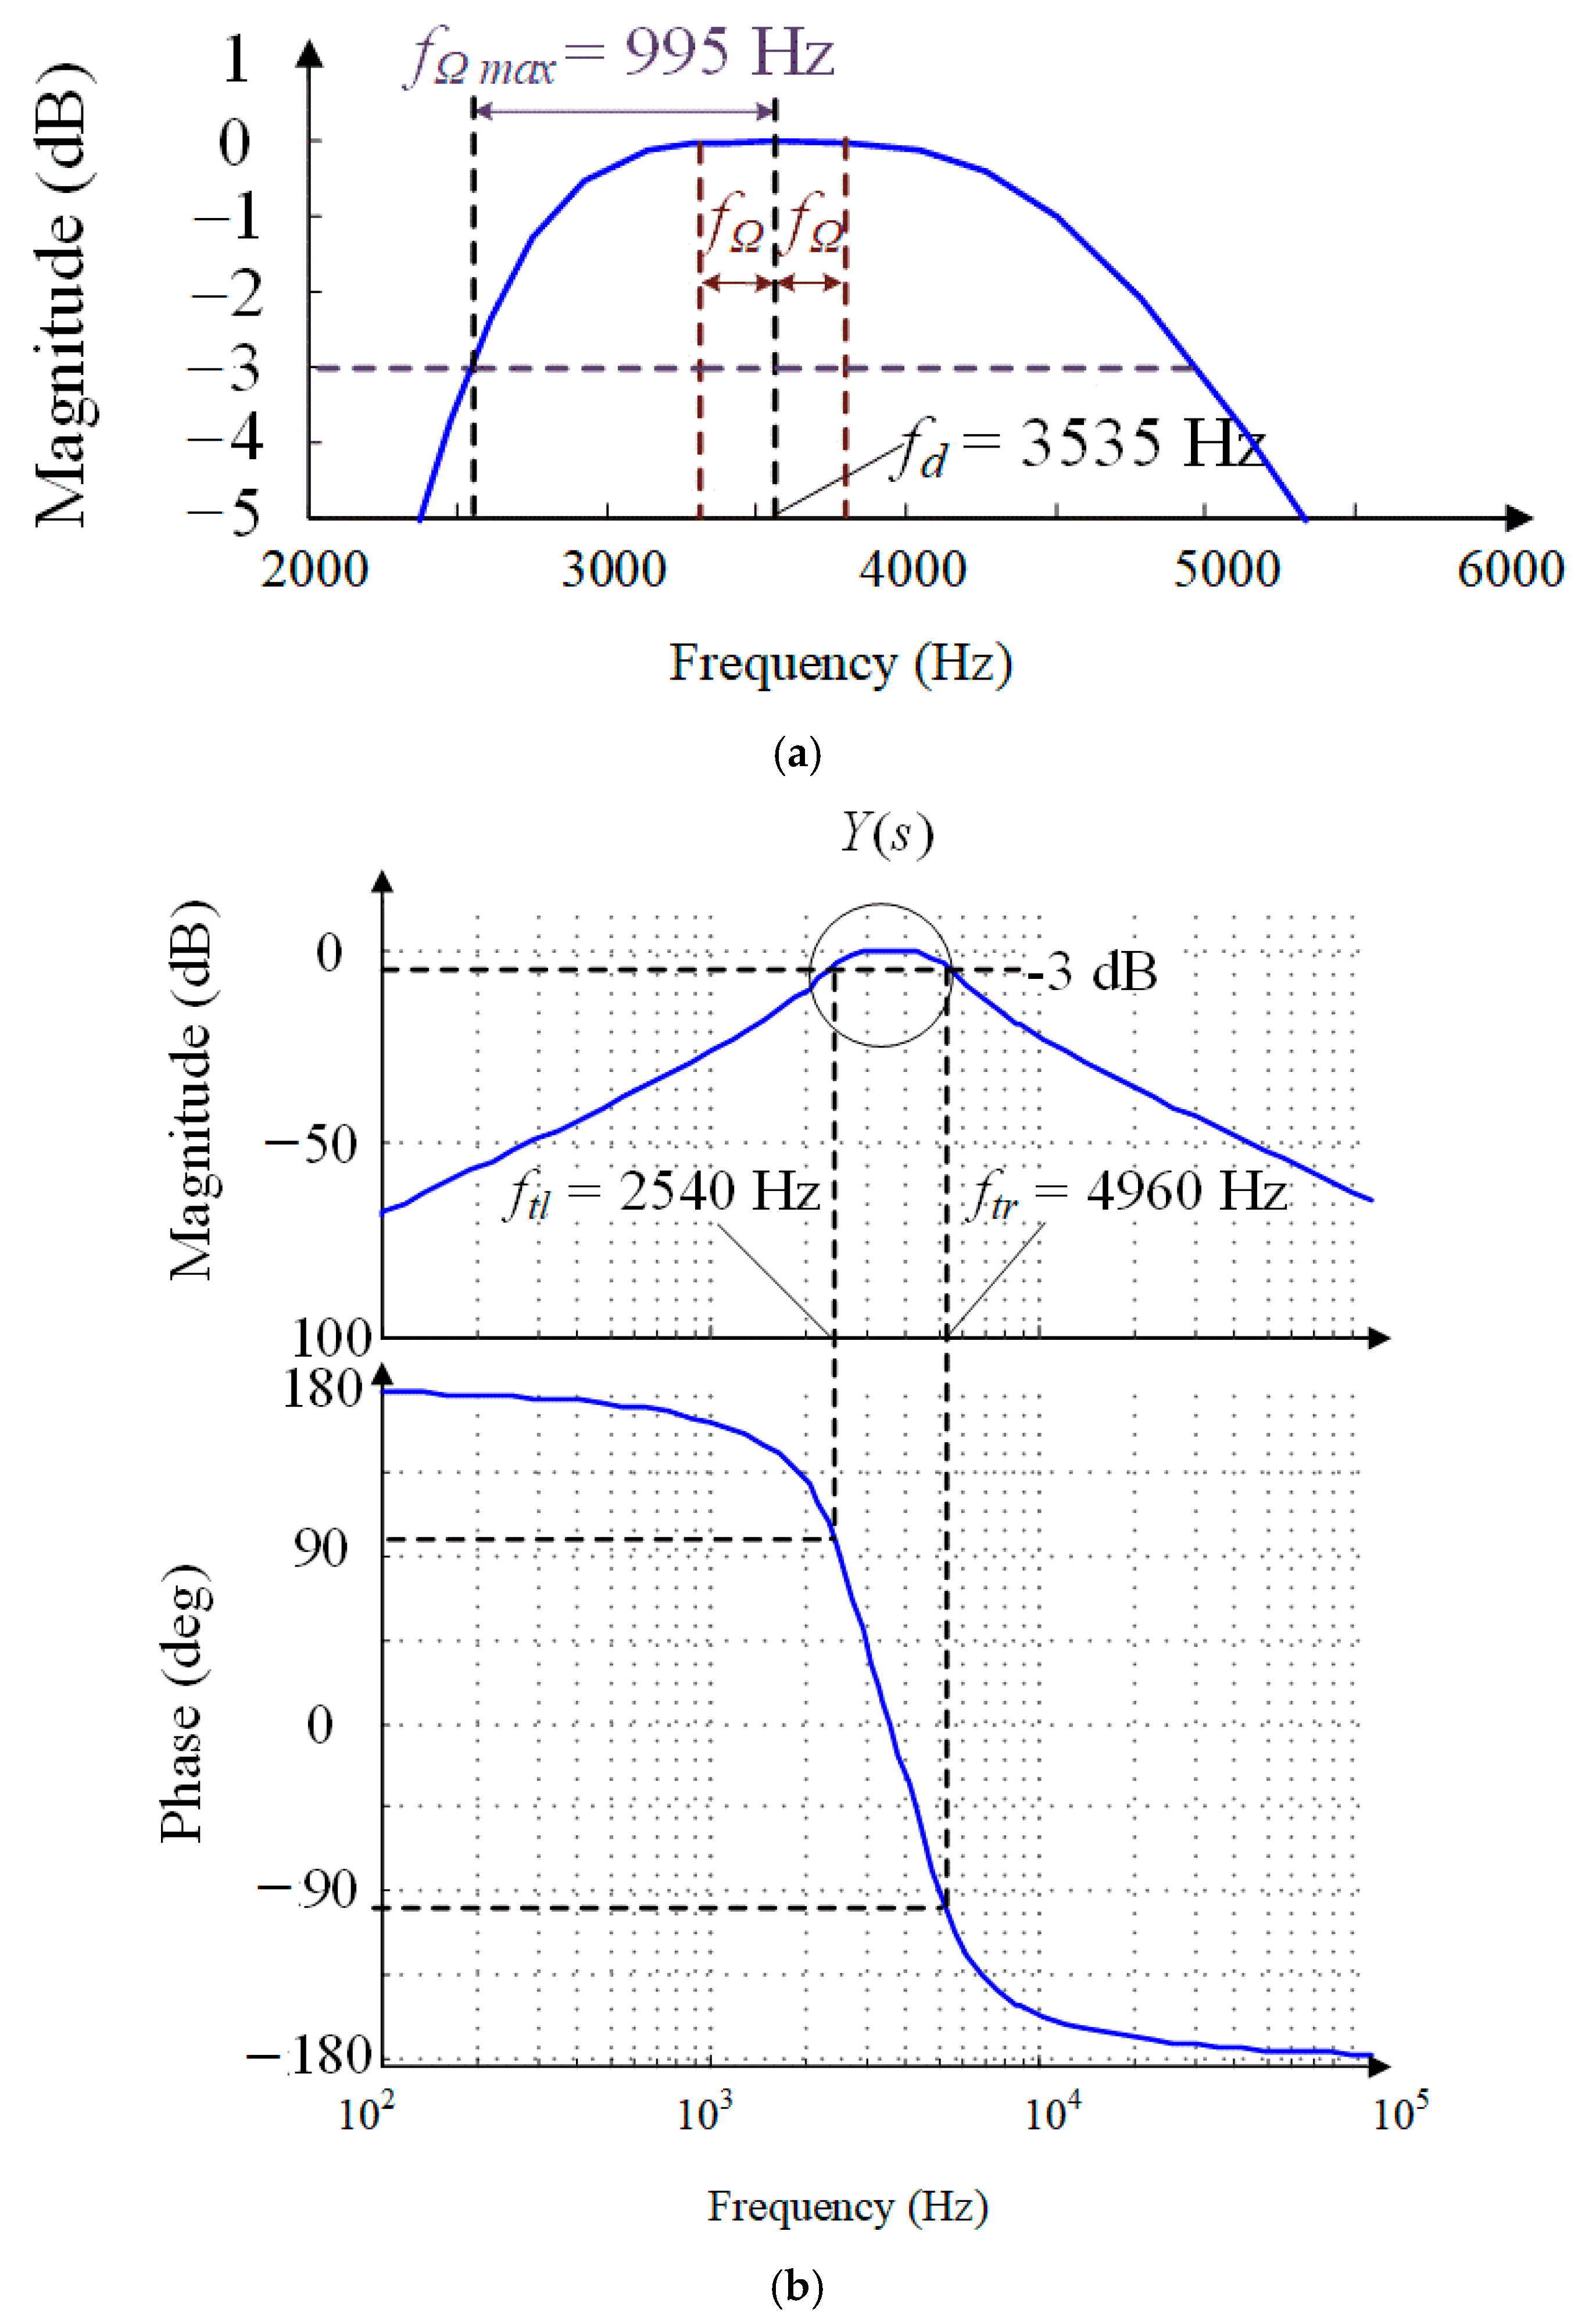
The amplitude-frequency and phase-frequency responses of the sense-mode open-loop function E(s) are shown in Figure 5. The peak gain of the amplitude-frequency response at the sense-mode resonant frequency reaches 84.4 dB because of the high Q of the sense mode. Nevertheless, when the external angular rate with frequency fΩ applies to the MCVG, fΩ is modulated to a two-side band fd − fΩ and fd + fΩ with the drive-mode resonant frequency fd of 3535 Hz as the center point, as shown in the detail view; −3 dB bandwidth of the angular rate response is only 13 Hz because of the high Q.
Further, the high Q will also result in the amplitude response of the angular rate seriously suffering from the fluctuation when the external angular rate varies dynamically with the bandwidth range of 2fΩ. The corresponding inband spectrum ripple deteriorates to 51.4 dB if the angular frequency fΩ varies with the maximum value of 30 Hz. This means that the sense mode itself will inevitably give rise to oscillation and severely deteriorate the performance of the MCVG.
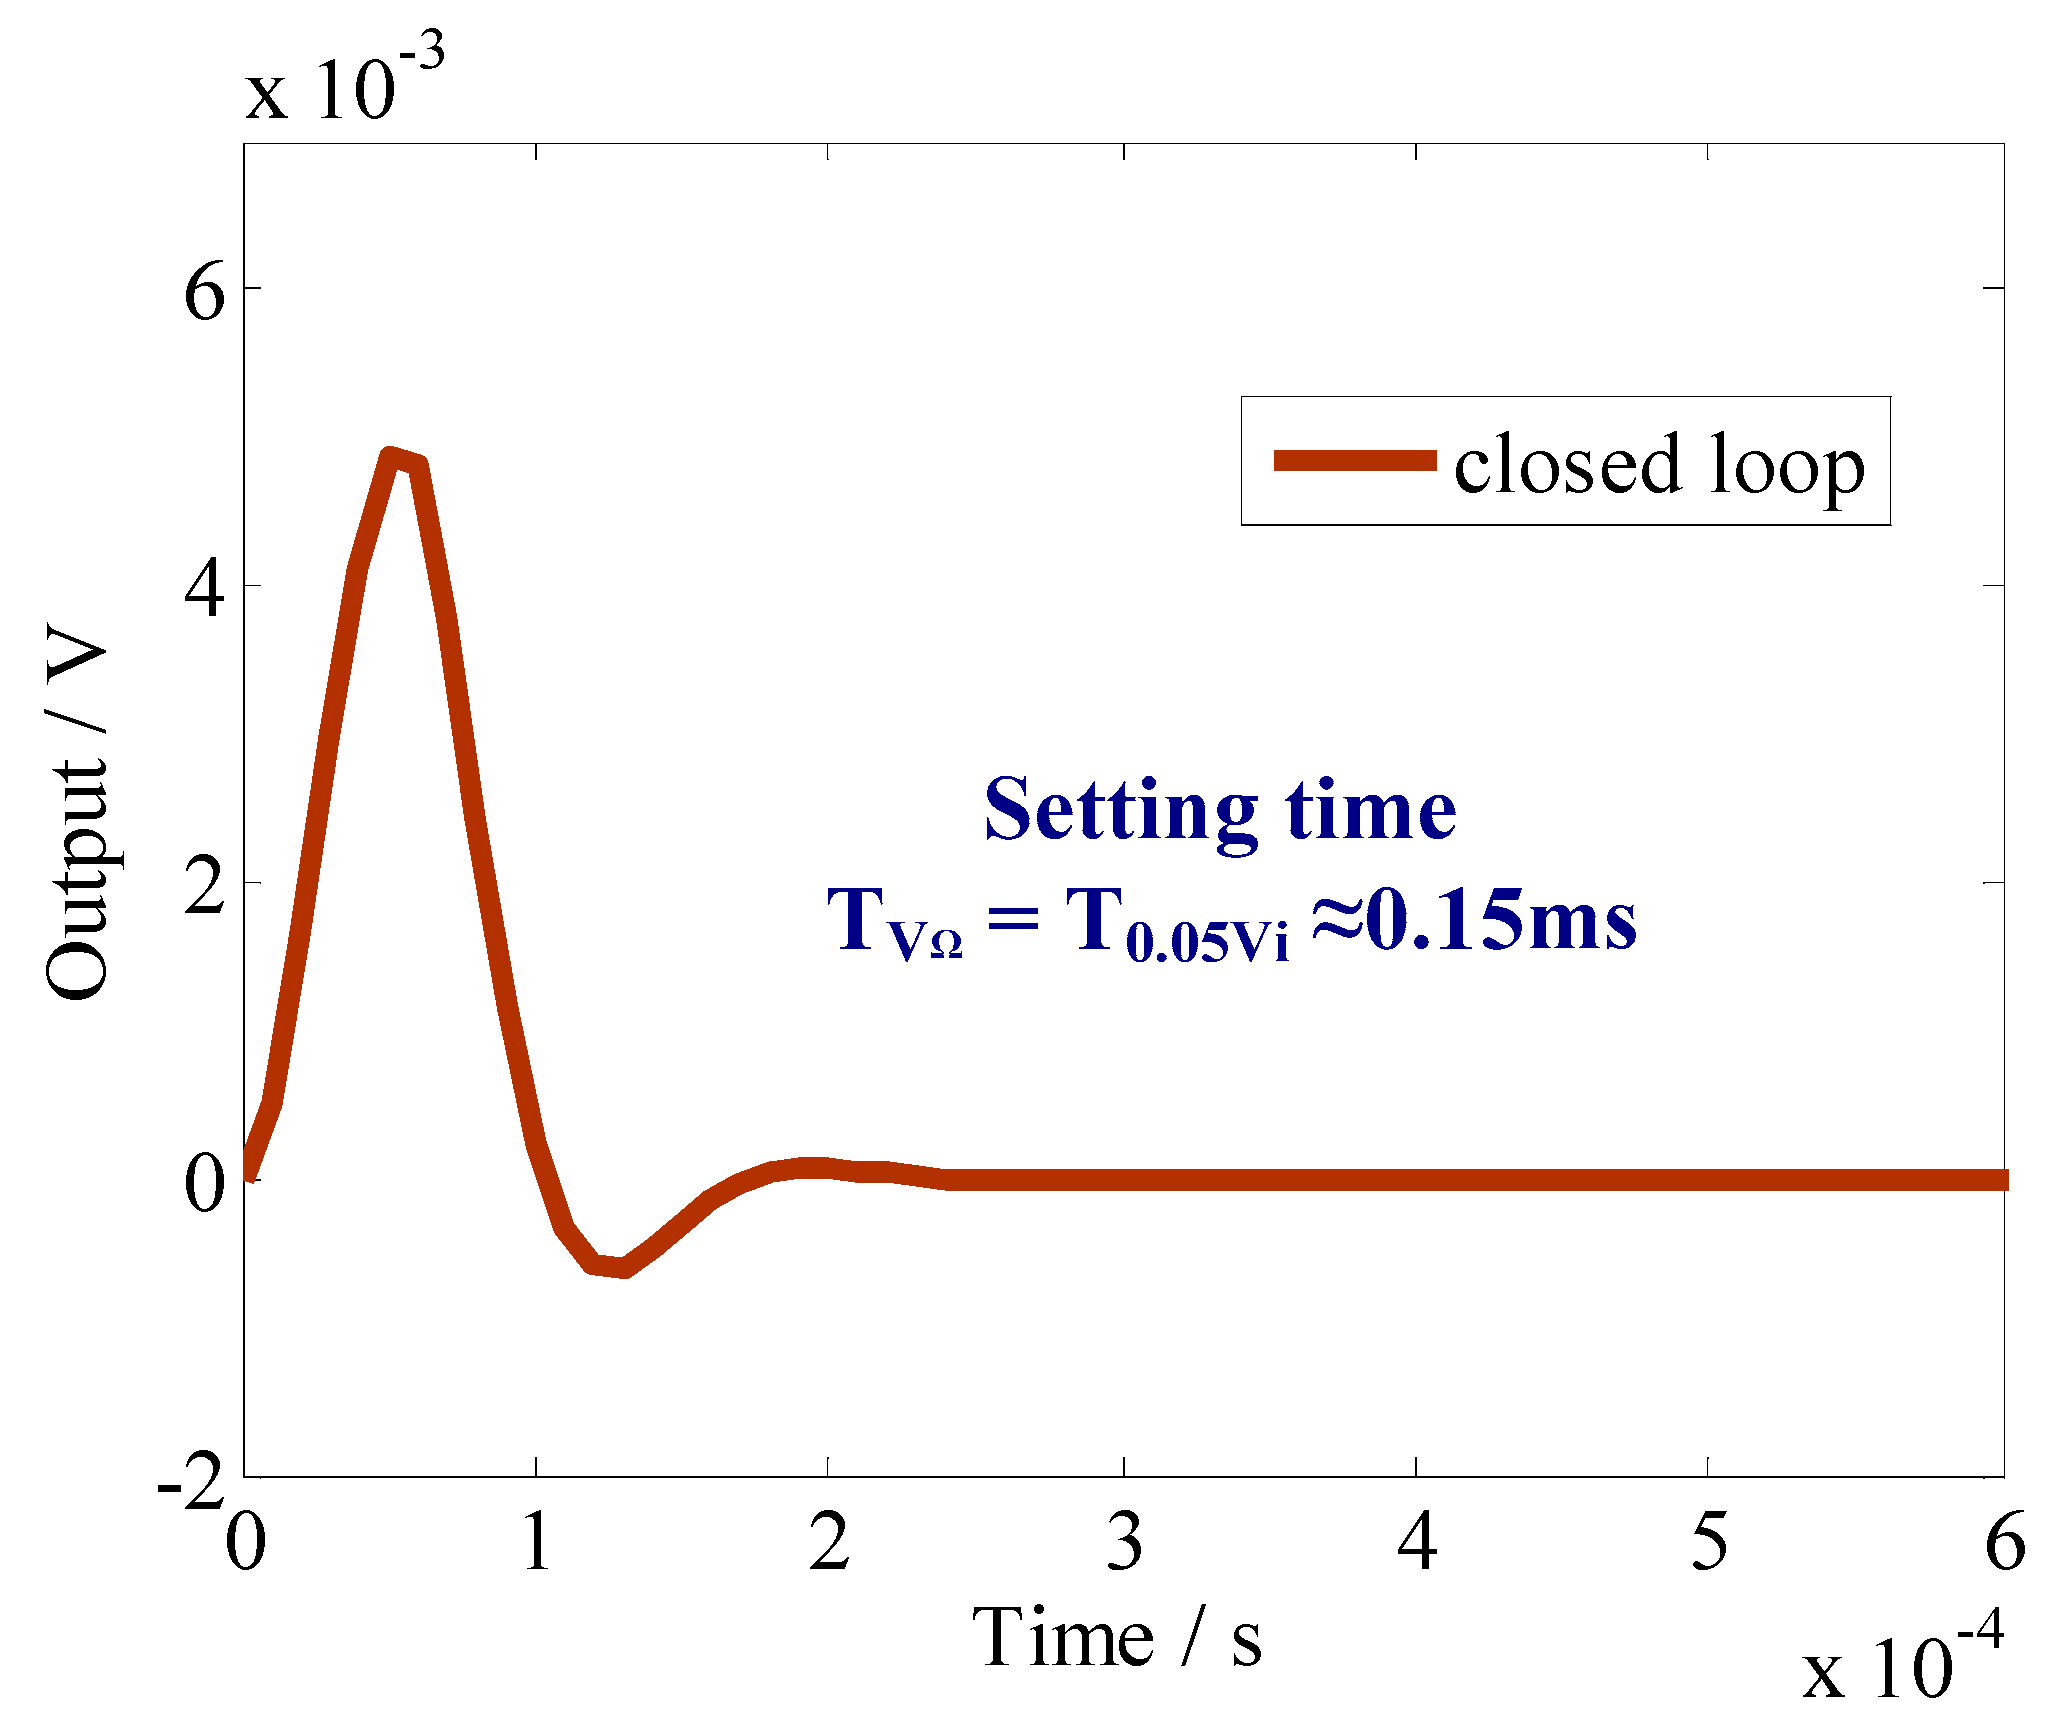
In order to improve the response characteristics of the sense mode, the closed-loop oscillation suppression scheme, as described in Figure 2, was simulated as shown in Figure 6 and Figure 7. Figure 6 shows the time-domain response curve of the proposed closed-loop function Y(s). The setting time is greatly reduced to 0.15 ms.
Further, frequency-domain response curves are shown in Figure 7. It can be seen that −3 dB bandwidth of the angular rate response is increased to 2420 Hz before the demodulation by the proposed control scheme. This bandwidth is sufficiently large so the sense-mode oscillation hardly occurs in the application. Further, the angular-rate amplitude response has the minimum inband spectrum ripple with only 4.23 × 10⁻⁴ dB. Comparing with the open-loop response, the inband spectrum ripple of the closed-loop control scheme with oscillation suppression is reduced to 2.7‰, which demonstrates that the bias performance of the MCVG can be obviously improved. The comparison results without and with oscillation suppression are listed in Table 3.
It can be seen from Table 3 that the simulated bandwidth of the loop transfer function Y(s) is 2420 Hz. Nevertheless, this bandwidth is not the actual bandwidth of the whole sense-mode circuit. The whole sense-mode bandwidth is finally determined by the last LPF outside the loop. In detail, the accurate bandwidth of the equivalent band pass filter (BPF) as listed in the above table can be obtained by accurately setting the simulation values of resistor/capacitor (RC) components. Inside the loop, a bandwidth in the range of [fd − fΩ, fd + fΩ] before the demodulation signal Vde(t) can be achieved because of the bandwidth of the equivalent BPF. However, after demodulating by reference signal cos(2πfd) coming from the drive mode, two types of signals with frequencies of 2fd and fΩ are generated. By the last LPF outside the loop with a bandwidth of 35 Hz set in this work, a signal with a frequency of 2fd is filtered, but the angular rate signal with a frequency fΩ < 35 Hz is retained. Therefore, the whole sense-mode bandwidth is limited to 35 Hz.
4. Test Results
According to the simulations in Section 3, it is demonstrated that the force feedback loop is effective in suppressing the oscillation. A closed-loop circuit was implemented based on the above simulation set, as listed in Table 1 and Table 2. Figure 8 shows the vibration test system consisting of the vibration table, high-Q sensing element, signal processing element application specific integrated circuit (ASIC), and a few discrete RC components, which adjust the key parameters of control electronic elements.
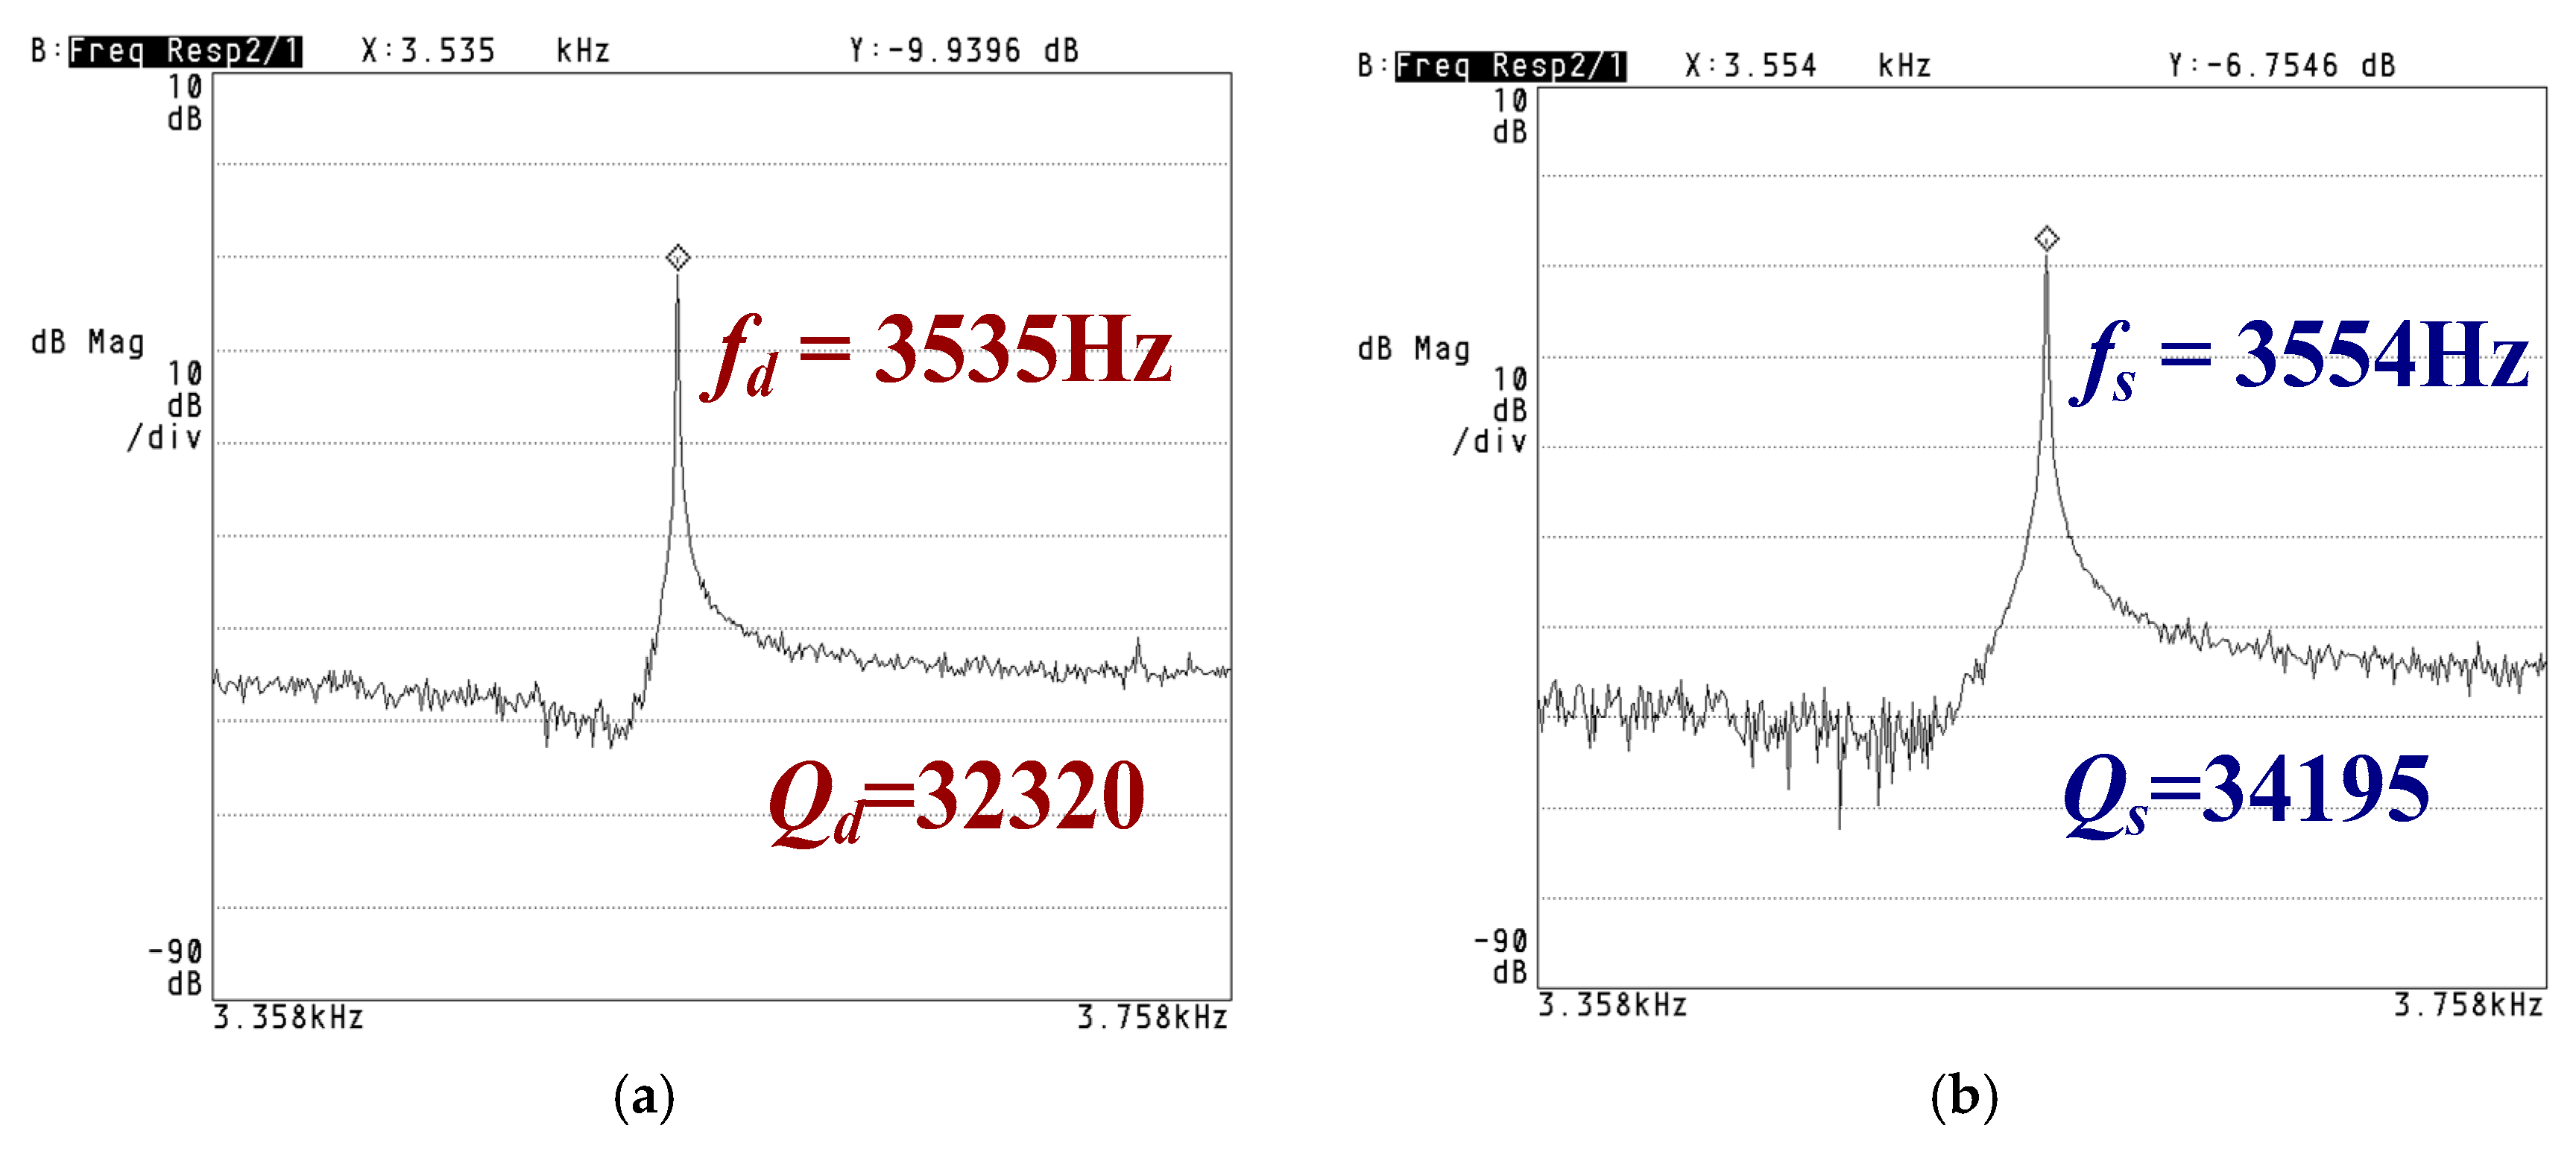
Figure 9 shows that the resonance frequencies of the drive mode and sense mode are measured to be 3535 Hz and 3554 Hz, respectively. The measured results indicate a frequency difference of 19 Hz. The corresponding measured quality factors of the two modes are 32,320 and 34,195, respectively. The corresponding pressure is about 10 Pa.
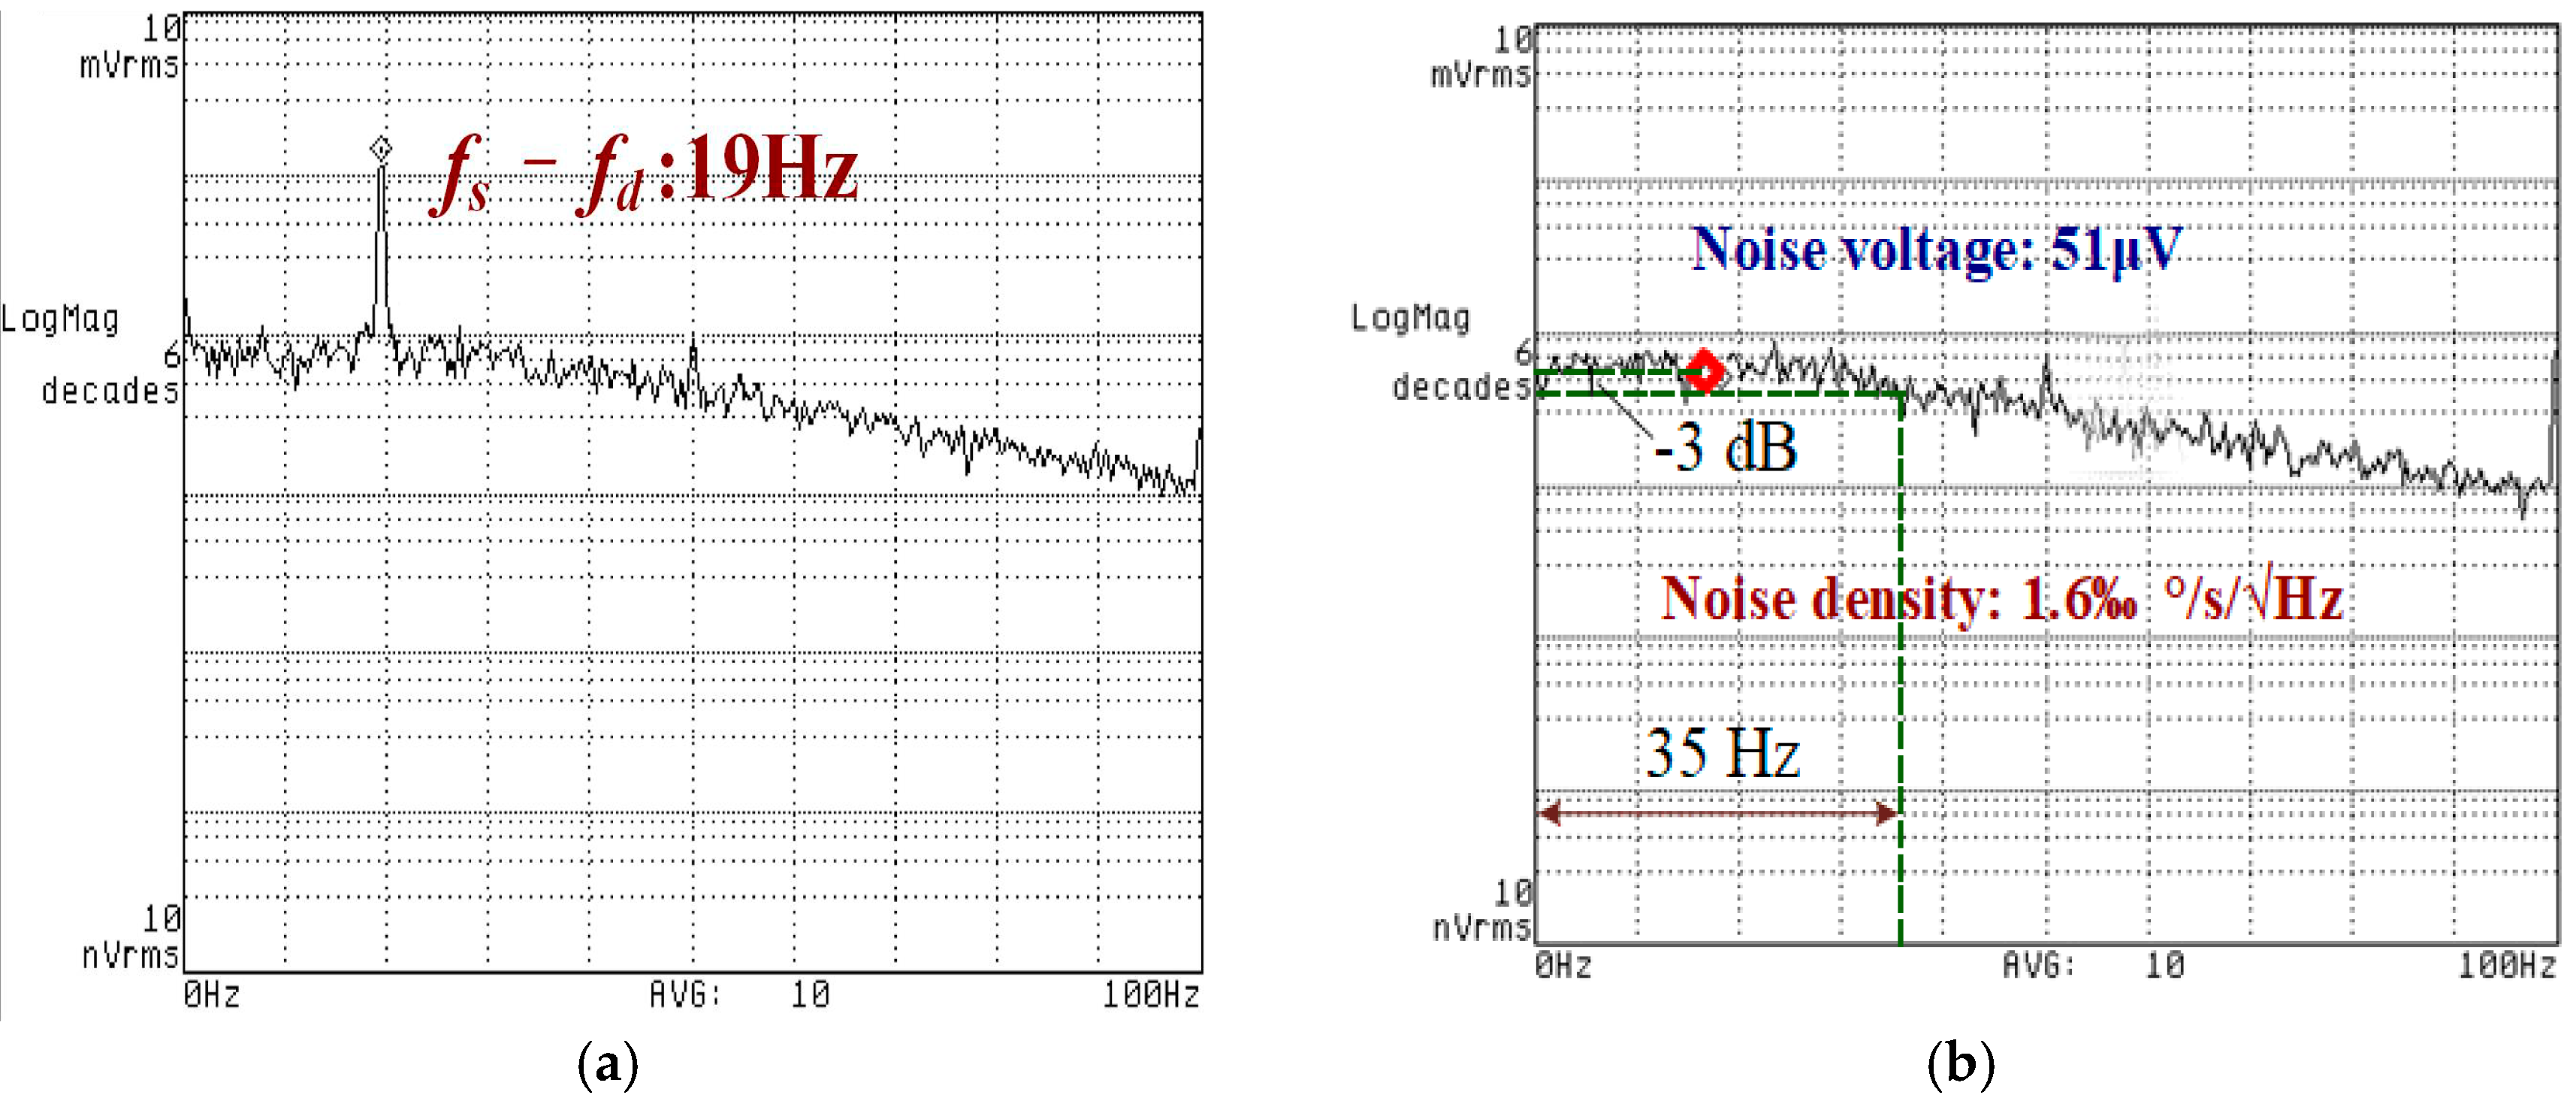
The comparison of the frequency-domain spectrum of the zero-rate output without and with oscillation suppression is shown in Figure 10. Within the system bandwidth, it is obvious in Figure 10a that the disturbance signal with a frequency of 19 Hz is about −54 dBV, which implies that the bias stability inevitably suffers from it. Figure 10b shows the noise floor of the gyroscope after oscillation suppression. A disturbance signal of 19 Hz is suppressed. The noise spectrum density of the gyroscope is about 51 µV/√Hz at the setting point of 19 Hz. The equivalent angular rate of the noise power spectral density is 1.6‰ deg/s/√Hz and the bandwidth of the input angular rate signal is 35 Hz, which is mainly determined by the cut-off frequency of the final-stage LPF. The effect of the power frequency of 50 Hz is degraded by properly shielding.
The comparison measurement of the oscillation suppression effect in the time domain was performed using the vibration test table shown in Figure 8. The specification of the external disturbance on the measurement is listed in Table 4. The time-domain shock profile is shown in Figure 11.
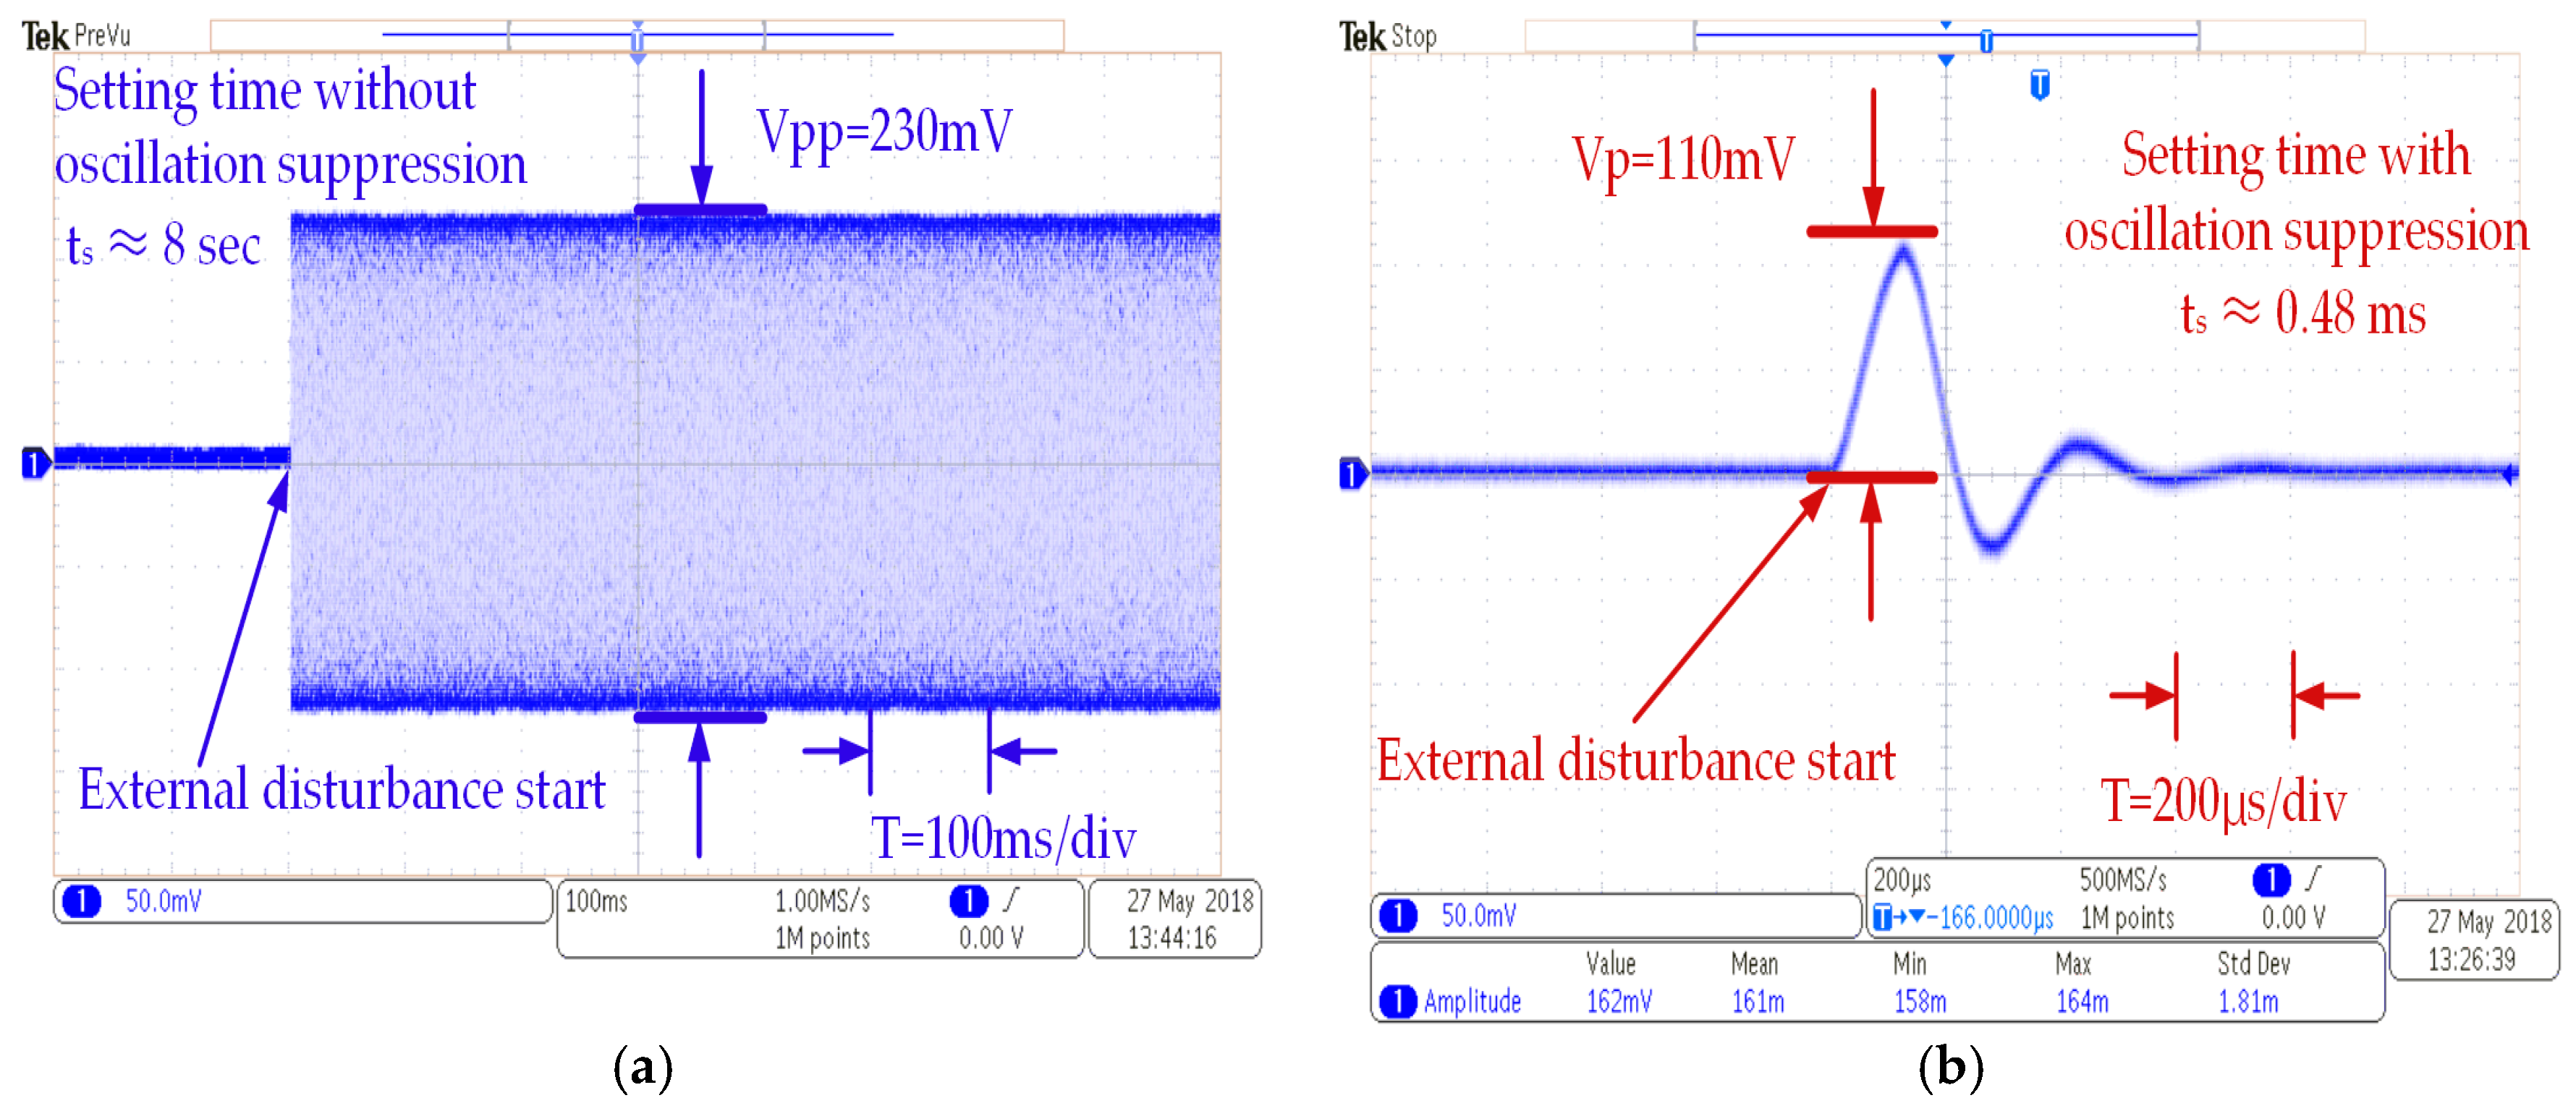
Figure 12a shows that the amplitude of the zero-rate output has a peak-to-peak value of about 230 mV when the external disturbance is applied by the standard vibration table. Assuming a setting time based on the oscillation attenuation curve with an error of 5% of the steady state, the setting time was calculated to be about 8 s. This phenomenon means that the oscillation of the sense mode is nearly in a state of non-damping oscillation with the high Q. However, the setting time is greatly shortened to just 0.48 milliseconds with the oscillation suppression circuits as shown in Figure 12b. Compared with the corresponding simulation in Figure 6, the test error of the settling time can contribute to unexpected additional fluctuation of bias output of the MCVG, beyond the fluctuation of the output induced by the external disturbance itself and some potential measurement errors, such as circuit components error and impulse load error caused by assembly.
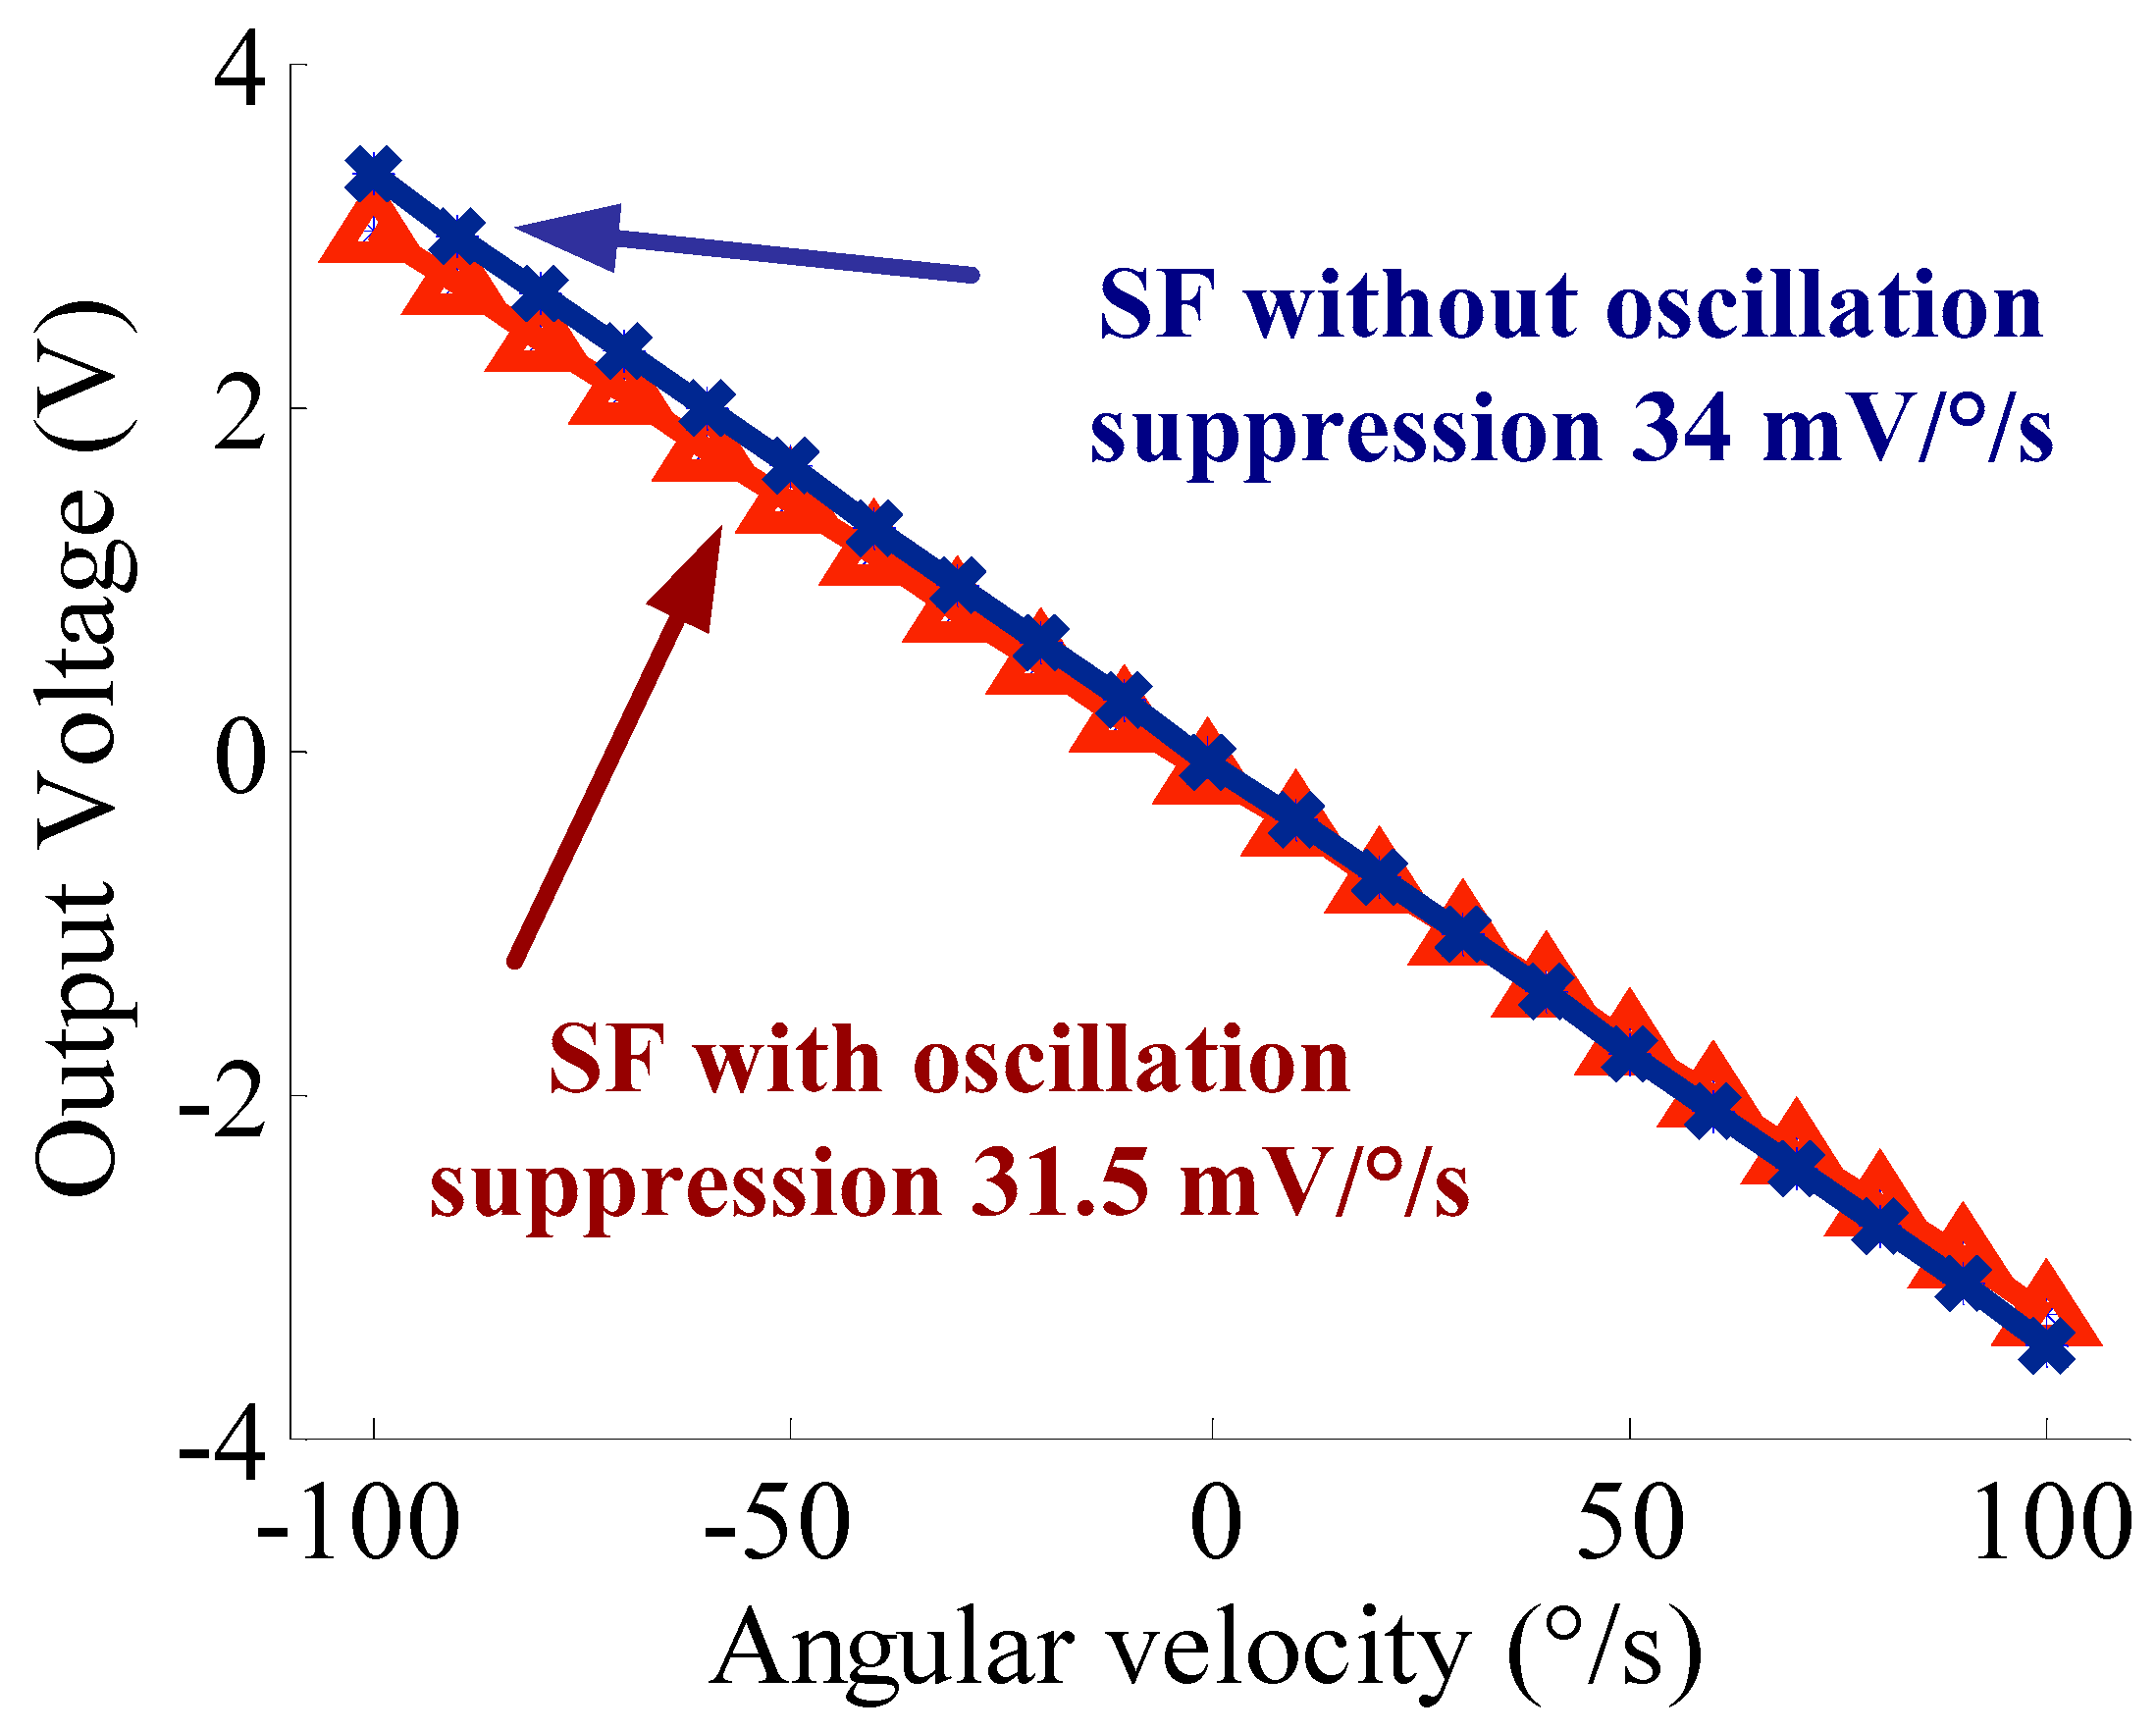
The oscillation effect can also be shown through the scale factor, as shown in Figure 13. The scale factors are 31.5 mV/deg/s and 34 mV/deg/s, respectively. The system sensitivity becomes a slightly lower after the oscillation suppression. The main reason is that the inaccurate RC components result in the fact that the amplitude–frequency response attenuation exists within the frequency domain (ωd − ω0, ωd + ω0), compared to that of the open-loop detection circuit. Nevertheless, the nonlinearity of the scale factor is reduced to 1.1‰ from 4.5‰.
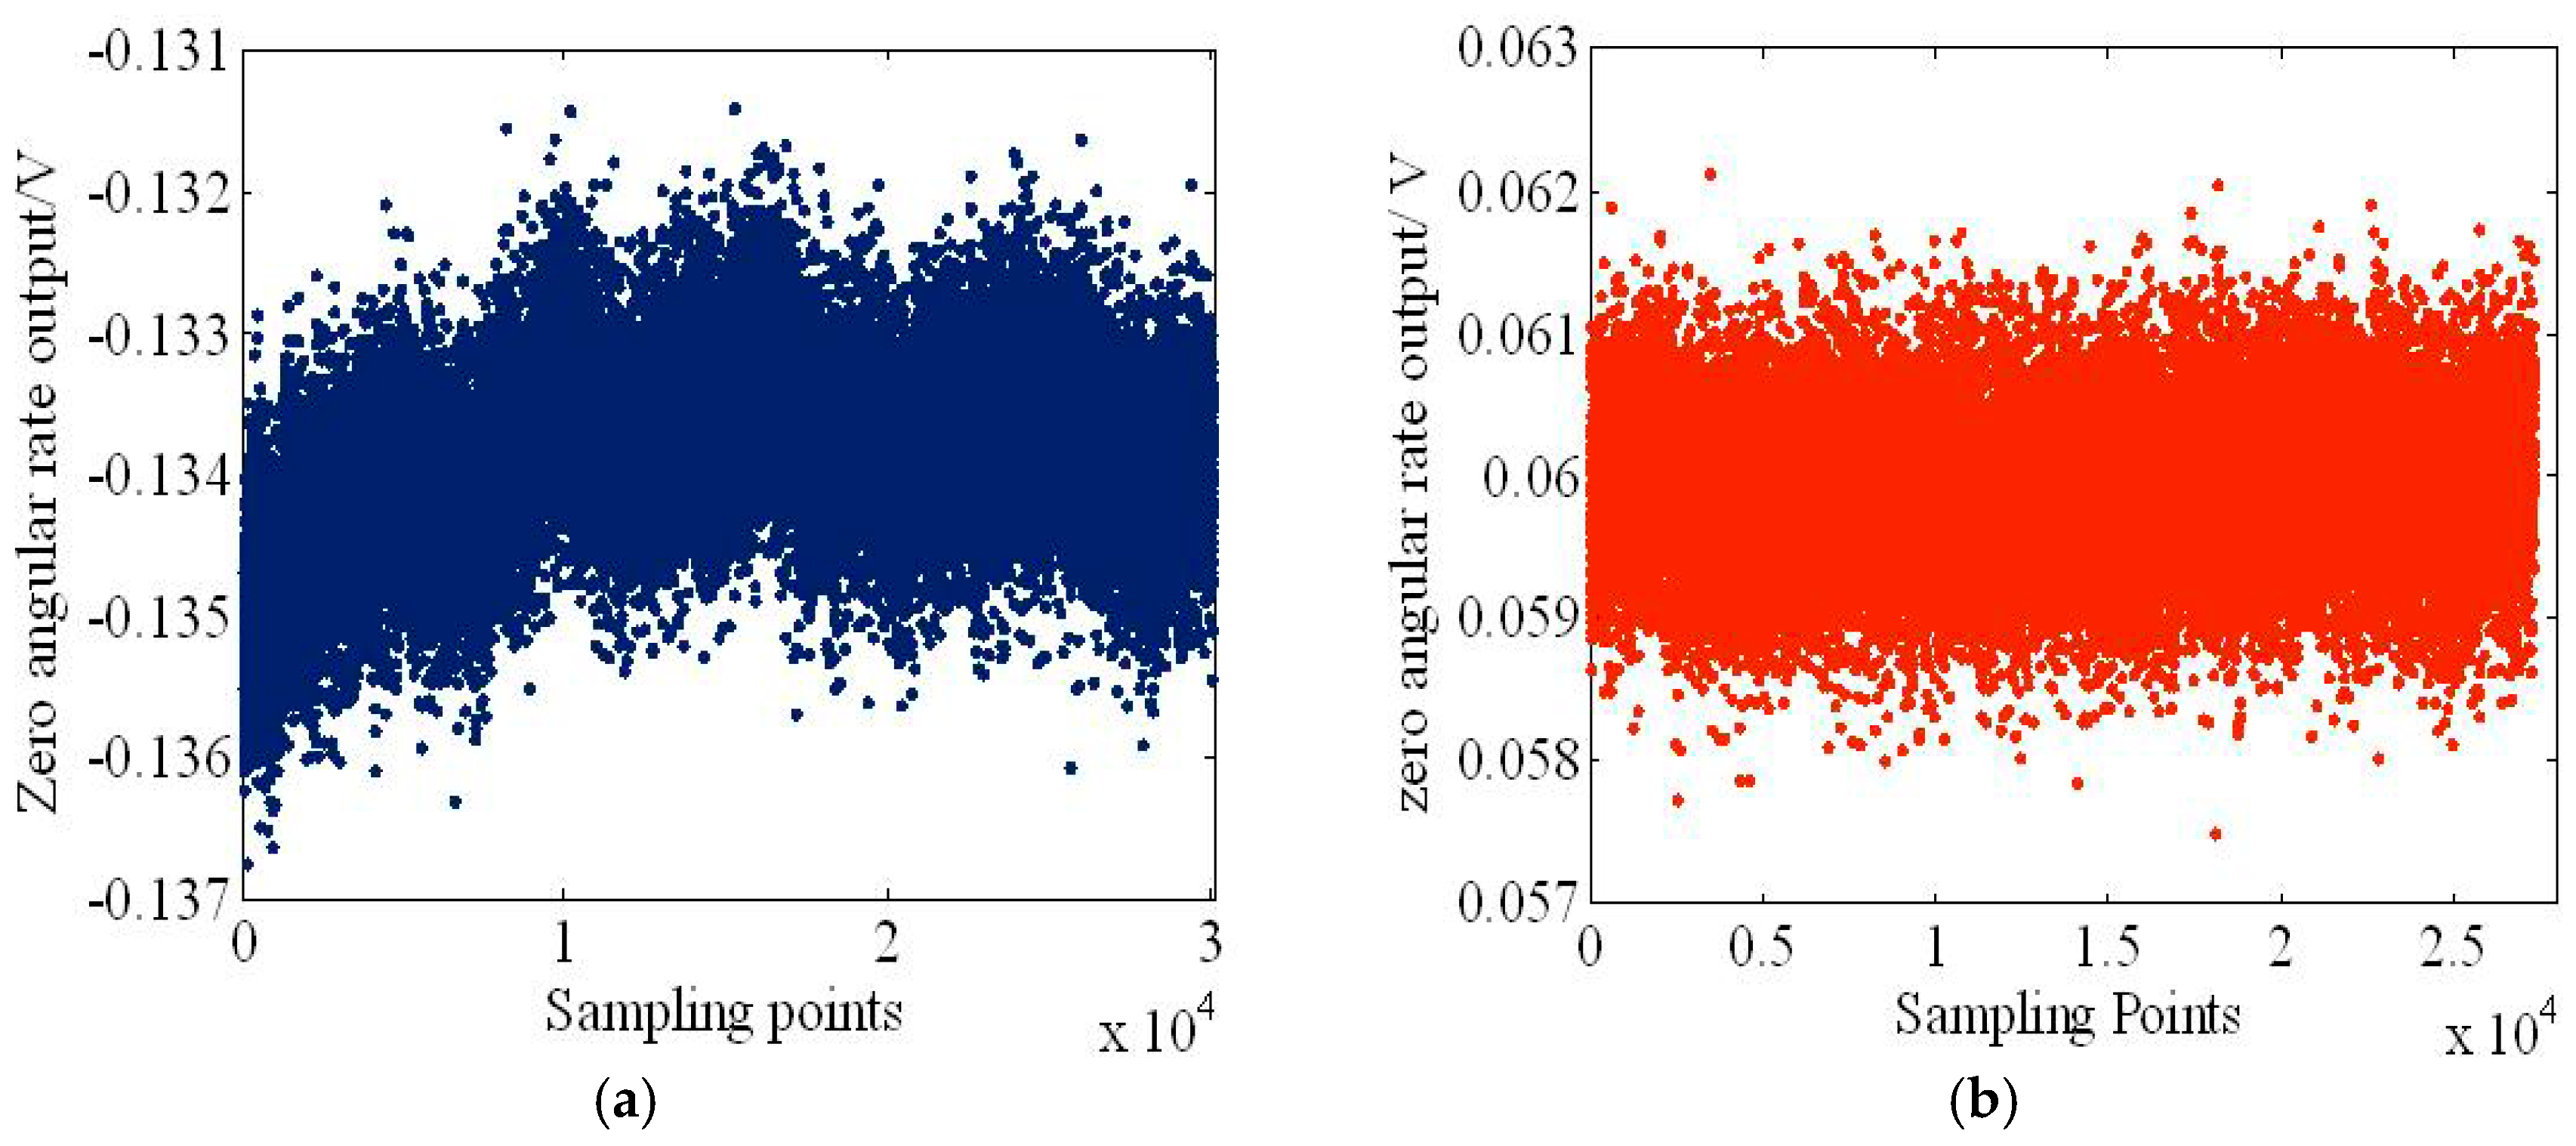
Figure 14 shows a slice of the recorded zero angular rate output with and without the oscillation suppression. The sampling period is 100 ms using an Agilent 34401A multi-meter. Figure 14a shows the bias drift curve for 1 hour without the oscillation suppression, which has a bias voltage and bias drift of about 134 mV and 5 mV, respectively. After the oscillation suppression, the bias voltage and bias drift were reduced to 60 mV and 3 mV, respectively, as shown in Figure 14b.
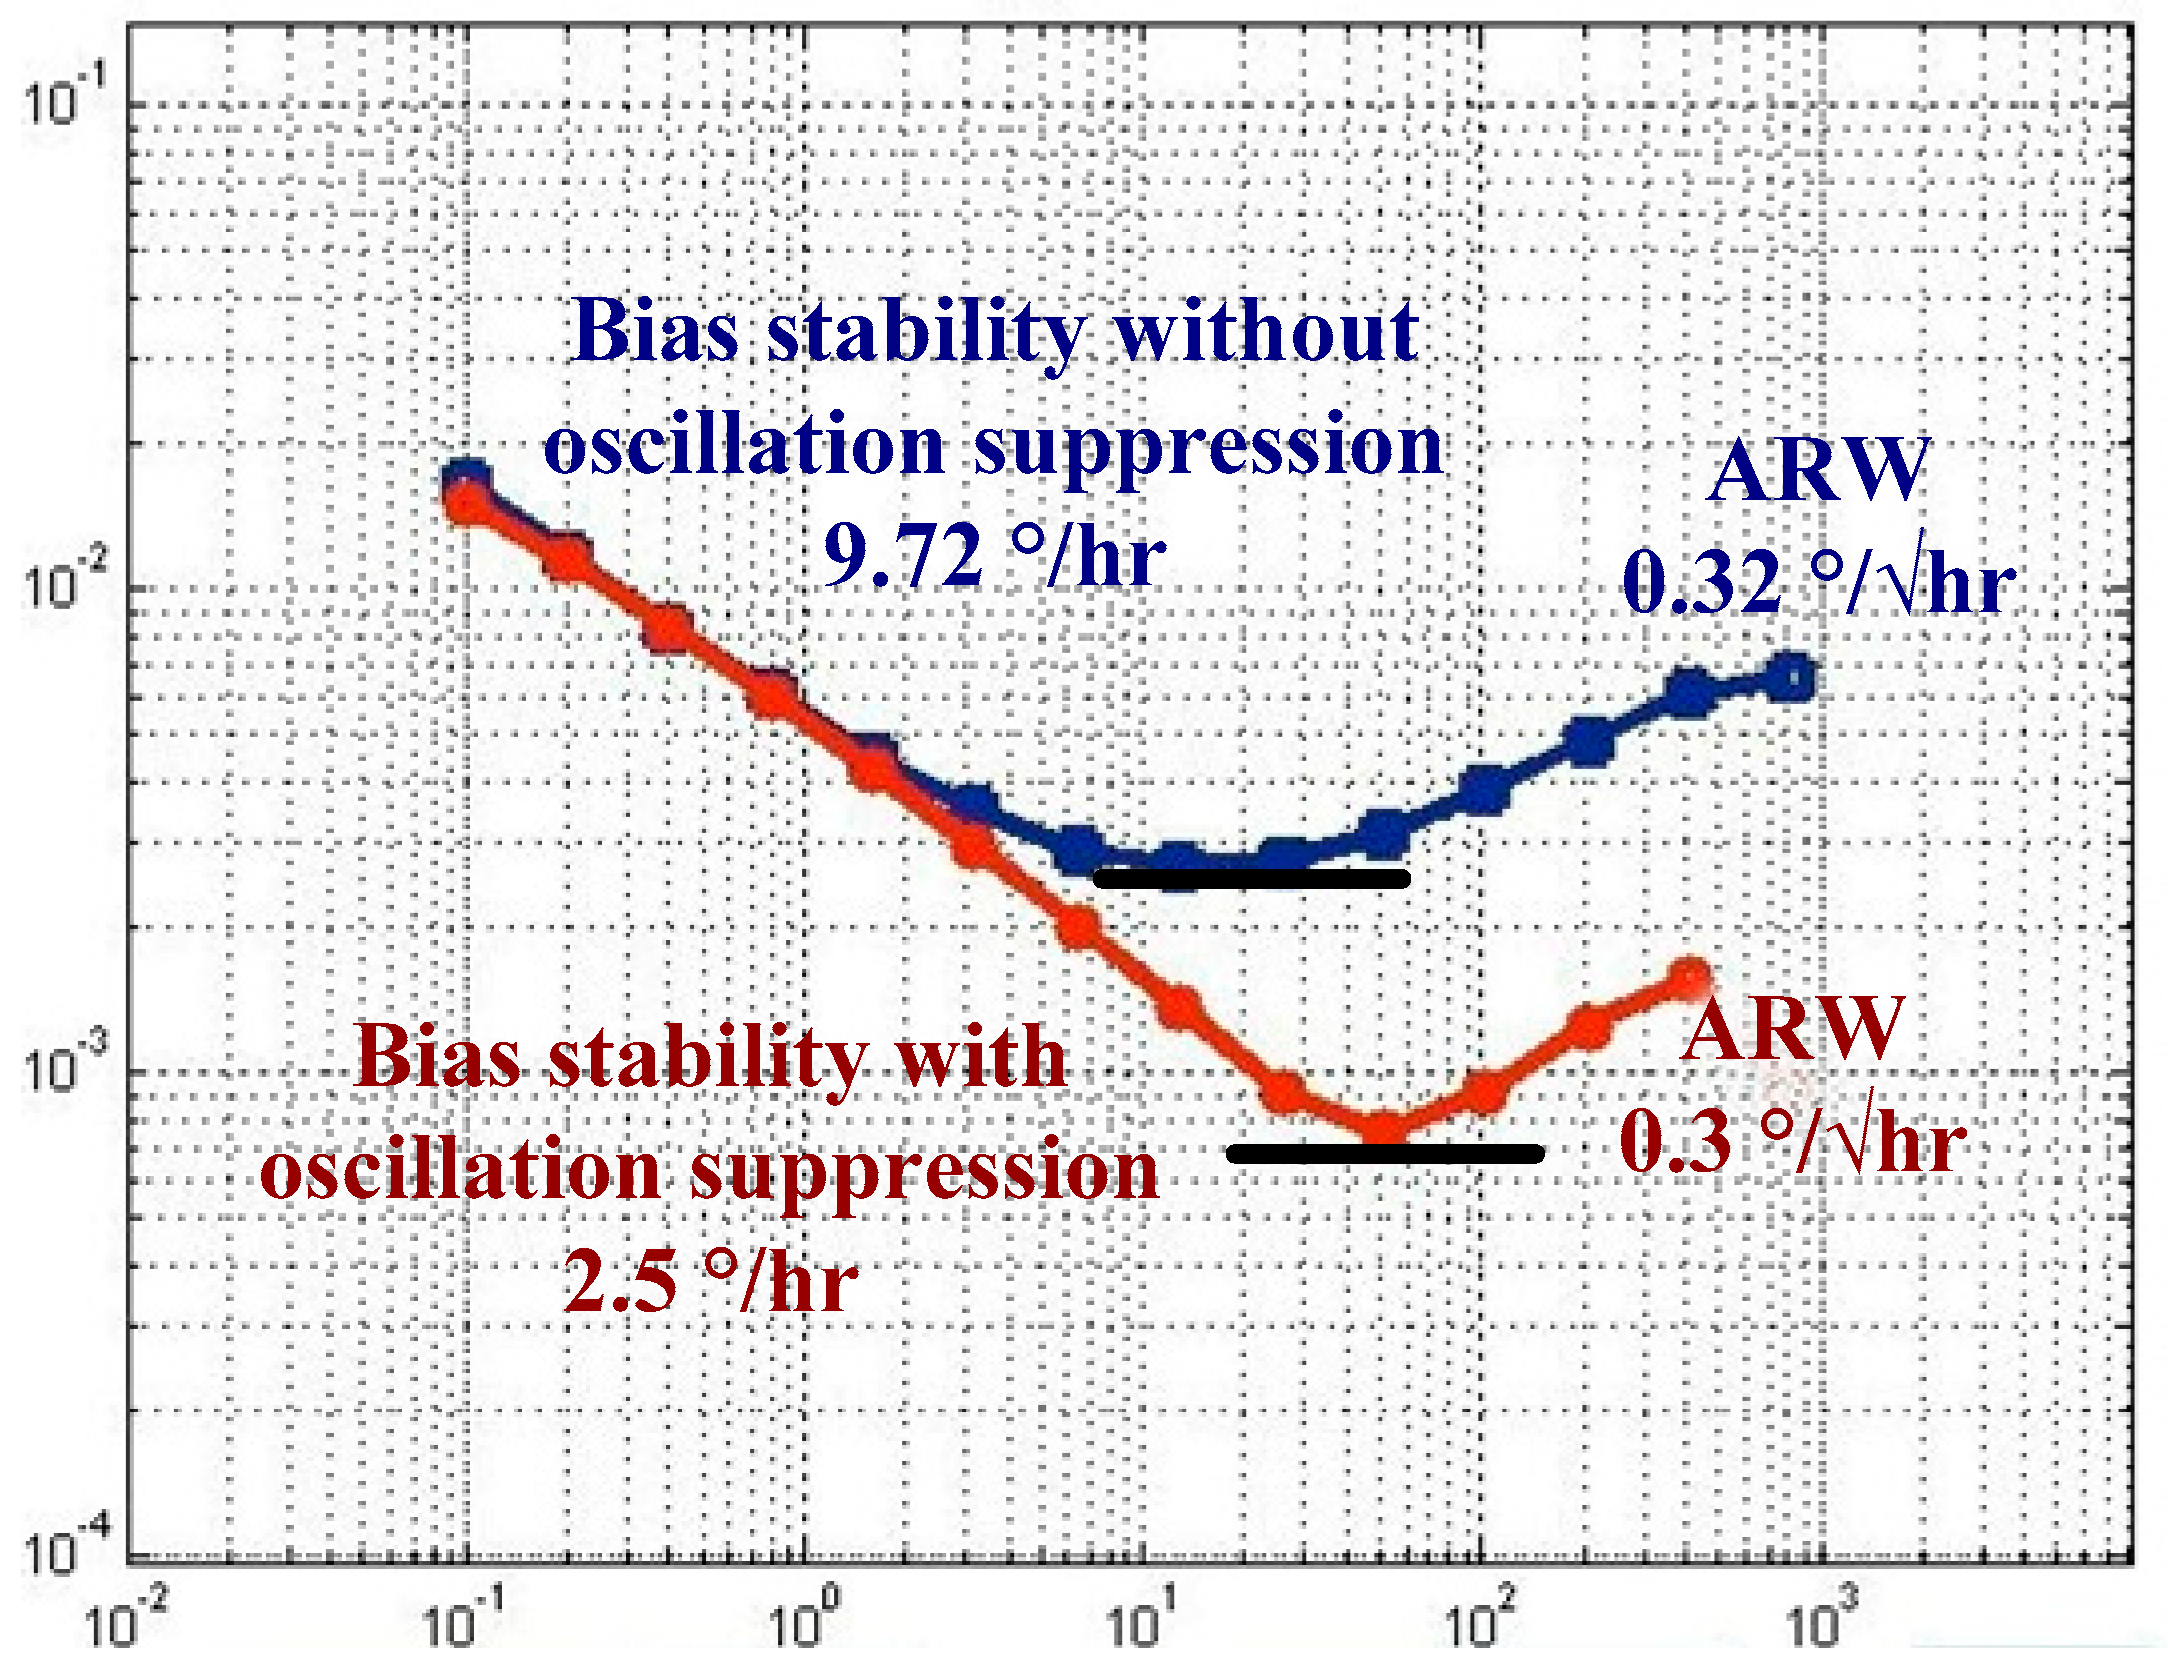
In Figure 15, the bias stability and angular random walk (ARW) of the gyroscope without the oscillation suppression are 9.72 deg/h and 0.32 deg/√h, respectively. The bias stability and ARW with the oscillation suppression are 2.5 deg/h and 0.3 deg/√h, respectively. This is a significant improvement, and the proposed scheme is thus effective in suppressing the oscillation of the sense mode.
5. Conclusions
In this paper, we describe the oscillation of the sense mode for a MCVG with high Q. The closed-loop control scheme based on the integrator and HPF is found to greatly suppress this oscillation. Due to no demodulation or modulation modules, the force feedback control circuit is greatly simplified. The experimental results demonstrate that the oscillation suppression scheme is very effective in improving the performance of the MCVG.
Author Contributions
Q.S. conceived the idea of the paper, designed and performed the simulations and experiments, and wrote the manuscript; X.W. performed the simulations and analysis; Y.W. performed noise measurement; and J.X. reviewed the manuscript.
Funding
This work was supported in part by the Chinese National Science Foundation under Grant 51705430 and in part by JCYJ20170306154045928.
Acknowledgments
The authors acknowledge Liang Yin at Harbin Institute of Technology for his help.
Conflicts of Interest
The authors declare no conflict of interest.
References
- Yazdi, N.; Ayazi, F.; Najafi, K. Micromachined inertial sensors. Proc. IEEE 1998, 86, 1640–1659. [Google Scholar] [CrossRef]
- Iyer, S.V. Modelling and Simulation of Non-Idealities in a Z-axis CMOS-MEMS Gyroscope. Ph.D. Thesis, Department of Electrical & Computer Engineering, Carnegie Mellon University, Pittsburgh, PA, USA, April 2003. [Google Scholar]
- Weinberg, M.S.; Kourepenis, A. Error sources in in-plane silicon tuning-fork MEMS gyroscope. J. Mciroelectromech. Syst. 2006, 15, 479–491. [Google Scholar] [CrossRef]
- Iyer, S.V.; Mukherjee, T. Simulation of manufacturing variations in a Z-axis CMOS-MEMS gyroscope. In Proceedings of the Fifth International Conference on Modeling and Simulation of Microsystems, San Juan, Puerto Rico, 22–25 April 2002. [Google Scholar]
- Walther, A.; Desloges, B.; Lejuste, C.; Coster, B.; Audebert, P.; Willemin, J. Development of a 3D capacitive gyroscope with reduced parasitic capacitance. J. Micromech. Microeng. 2013, 23, 025013. [Google Scholar] [CrossRef]
- Sharma, A.; Zaman, M.F.; Zucher, M.; Ayazi, F. A 0.1°/hr bias drift electronically matched tuning fork microgyroscope. In Proceedings of the IEEE MEMS 2008, Tucson, AZ, USA, 13–17 January 2008; pp. 6–9. [Google Scholar]
- Trusov, A.A.; Schofield, A.R.; Shkel, A.M. Vacuum packaged silicon MEMS gyroscope with Q-factor above 0.5 million. In Proceedings of the 6th International Conference and Exhibition on Device Packaging, Scottsdale, AZ, USA, 8–11 March 2010. [Google Scholar]
- Saukoski, M.; Aaltonen, L.; Halonen, K.A.I. Zero-rate output and quadrature compensation in vibratory MEMS gyroscopes. IEEE Sens. J. 2007, 7, 1639–1652. [Google Scholar] [CrossRef]
- Walther, A.; Blanc, C.L.; Delorme, N.; Deimerly, Y.; Anciant, R.; Willemin, J. Bias contributions in a MEMS tuning fork gyroscope. J. Microelectromech. Syst. 2013, 22, 303–308. [Google Scholar] [CrossRef]
- Kirkko-Jaakkola, M.; Collin, J.; Takala, J. Bias prediction for MEMS gyroscopes. IEEE Sens. J. 2012, 12, 2157–2163. [Google Scholar] [CrossRef]
- Iyer, S.V.; Zhou, Y.; Mukherjee, T. Analytical modeling of cross-axis coupling in micromechanical springs. In Proceedings of the International Conference on Modeling and Simulation of Microsystems, San Juan, Puerto Rico, USA, 19–21 April 1999; pp. 632–635. [Google Scholar]
- Geen, J.A. A path to low cost gyroscope. In Proceedings of the Solid-State Sensor and Actuator Workshop, Hilton Head Island, SC, USA, 8–11 June 1998; pp. 51–54. [Google Scholar]
- Seeger, J.; Rastegar, A.; Tormey, T. Method and Apparatus for Electronic Cancellation of Quadrature Error. U.S. Patent 7290435 B2, 6 November 2007. [Google Scholar]
- Sharma, A.; Zaman, M.F.; Ayazi, F. A 104-dB dynamic range transimpedance-based CMOS ASIC for tuning fork microgyroscopes. IEEE J. Solid-State Circuits 2007, 42, 1790–1802. [Google Scholar] [CrossRef]
- Zaman, M.F.; Sharma, A.; Hao, Z.; Ayazi, F. A mode-matched silicon-yaw tuning-fork gyroscope with subdegree-per-hour Allan deviation bias instability. J. Mciroelectromech. Syst. 2008, 17, 1526–1536. [Google Scholar] [CrossRef]
- Sharma, A.; Zaman, M.F.; Ayazi, F. A sub-0.2°/hr bias drift micromechanical silicon gyroscope with automatic CMOS mode-matching. IEEE J. Solid-State Circuits 2009, 44, 1593–1608. [Google Scholar] [CrossRef]
- Sonmezoglu, S.; Alper, S.E.; Akin, T. An automatically mode-matched mems gyroscope with 50 Hz bandwidth. In Proceedings of the IEEE MEMS 2012, Paris, France, 29 January–2 February 2012; pp. 523–526. [Google Scholar]
- Tatar, E.; Alper, S.E.; Akin, T. Error compensation and corresponding effects on the performance of fully decoupled MEMS gyroscopes. J. Mciroelectromech. Syst. 2012, 21, 656–667. [Google Scholar] [CrossRef]
- Sonmezoglu, S.; Alper, S.E.; Akin, T. A high performance automatic mode-matched MEMS gyroscope with an improved thermal stability of the scale factor. In Proceedings of the Transducers 2013, Barcelona, Spain, 16–20 June 2013; pp. 2519–2522. [Google Scholar]
- Sonmezoglu, S.; Alper, S.E.; Akin, T. An automatically mode-matched MEMS gyroscope with wide and tunable bandwidth. J. Mciroelectromech. Syst. 2014, 23, 284–297. [Google Scholar] [CrossRef]
- Prikhodko, I.P.; Trusov, A.A.; Shkel, A.M. Compensation of drifts in high-Q MEMS gyroscope using temperature self-sensing. Sens. Actuators A Phys. 2013, 201, 517–524. [Google Scholar] [CrossRef]
- Trusov, A.A.; Schofield, A.R.; Shkel, A.M. Micromachined rate gyroscope architecture with ultra-high quality factor and improved mode ordering. Sens. Actuators A Phys. 2011, 165, 26–34. [Google Scholar] [CrossRef]
- Yoon, S.W.; Lee, S.; Najafi, K. Vibration-induced errors in MEMS tuning fork gyroscopes. Sens. Actuators A Phys. 2012, 180, 32–44. [Google Scholar] [CrossRef]
- Zhou, J.; Shen, Q.; Xie, J.B.; Cao, P.P.; Yuan, W.Z. Energy dissipation contribution modeling of vibratory behavior for silicon micromachined gyroscope. Shock Vib. 2018, 2018, 10. [Google Scholar] [CrossRef]
Figure 1.
Schematic representation of the micro-machined Coriolis vibratory gyroscope (MCVG).

Figure 2.
Schematic comparison of (a) the proposed force feedback control method and (b) the traditional method for the MCVG.
Figure 2.
Schematic comparison of (a) the proposed force feedback control method and (b) the traditional method for the MCVG.

Figure 3.
Transfer function of the sense-mode force feedback control system.

Figure 4.
(a) Open-loop time-domain response of the sense mode and (b) enlarged view in 9.2 s.

Figure 5.
Frequency-domain responses of the open loop system E(s): (a) enlarged view; (b) frequency response.
Figure 5.
Frequency-domain responses of the open loop system E(s): (a) enlarged view; (b) frequency response.


Figure 6.
Time-domain response of the sense-mode closed-loop output.

Figure 7.
Frequency responses of the closed loop system Y(s): (a) enlarged view; (b) frequency response.
Figure 7.
Frequency responses of the closed loop system Y(s): (a) enlarged view; (b) frequency response.

Figure 8.
Vibration test system including vibration table and MCVG in vacuum; the signal processing element with oscillation suppression is marked in the yellow circle.
Figure 8.
Vibration test system including vibration table and MCVG in vacuum; the signal processing element with oscillation suppression is marked in the yellow circle.

Figure 9.
Resonance frequency of the gyroscope: (a) drive mode; (b) sense mode.

Figure 10.
(a) Low frequency information generated by external disturbance; (b) zero-rate output after oscillation suppression.
Figure 10.
(a) Low frequency information generated by external disturbance; (b) zero-rate output after oscillation suppression.

Figure 11.
Time-domain impact profile.

Figure 12.
Transient response of the zero angular rate output: (a) without and (b) with oscillation suppression electronics.
Figure 12.
Transient response of the zero angular rate output: (a) without and (b) with oscillation suppression electronics.

Figure 13.
Scale factor comparison of oscillation suppression.

Figure 14.
Time slice of the recorded zero angular rate output (a) without and (b) with oscillation suppression electronics.
Figure 14.
Time slice of the recorded zero angular rate output (a) without and (b) with oscillation suppression electronics.

Figure 15.
Allan variance curve with and without oscillation suppression.


Table 1.
Parameters of the gyroscope.
| Gyroscope Parameters | Value |
|---|---|
| Resonant frequency of the drive mode (fd) | 3535 Hz |
| Resonant frequency of the sense mode (fs) | 3554 Hz |
| Mechanical bandwidth | 19 Hz |
| Sense mode mass (ms) | 0.89 mg |
| Displacement amp. of the drive mode (X) | 5 μm |
| Drive-mode quality factor (Qd) | 32,320 |
| Sense-mode quality factor (Qs) | 34,195 |
Table 2.
Parameters of the closed-loop system.
| Parameters | Value |
|---|---|
| Gain of displacement-to-voltage interface circuit module (GC/V) | 4 × 10⁸ V/m |
| Gain of voltage-to-force interface circuit module (GV/F) | 3500 N/V |
| Gain of integrator (KI) | 100 |
| Cut-off frequency of high pass filter (fc) | 3500 Hz |
Table 3.
Comparison results with and without oscillation suppression.
| Gyroscope Parameters | Without Suppression | With Suppression |
|---|---|---|
| Setting time of transient response | 9.2 s | 0.15 ms |
| Phase margin | 66.2 deg | N/A |
| Cut-off frequency (ftl ftr) | ftl = 3527 Hz ftr = 3540 Hz | ftl = 2540 Hz ftr = 4960 Hz |
| Bandwidth | 13 Hz | 2420 Hz |
| Inband spectrum ripple | 51.4 dB | 4.23 × 10⁻⁴ dB |
Table 4.
Specification of external disturbance.
| Parameters of Impulse Test | Value |
|---|---|
| Equivalent weight of movable platform | 2000 g |
| Shock displacement | 0.3 mm |
| Impact acceleration | 490 m/s2 |
| pulse duration | 50 μs |
© 2018 by the authors. Licensee MDPI, Basel, Switzerland. This article is an open access article distributed under the terms and conditions of the Creative Commons Attribution (CC BY) license (http://creativecommons.org/licenses/by/4.0/).
Share and Cite
MDPI and ACS Style
Shen, Q.; Wang, X.; Wu, Y.; Xie, J. Oscillation Suppression in the Sense Mode of a High-Q MEMS Gyroscope Using a Simplified Closed-Loop Control Method. Sensors 2018, 18, 2443. https://doi.org/10.3390/s18082443
AMA Style
Shen Q, Wang X, Wu Y, Xie J. Oscillation Suppression in the Sense Mode of a High-Q MEMS Gyroscope Using a Simplified Closed-Loop Control Method. Sensors. 2018; 18(8):2443. https://doi.org/10.3390/s18082443
Chicago/Turabian StyleShen, Qiang, Xinpeng Wang, Yixuan Wu, and Jianbing Xie. 2018. "Oscillation Suppression in the Sense Mode of a High-Q MEMS Gyroscope Using a Simplified Closed-Loop Control Method" Sensors 18, no. 8: 2443. https://doi.org/10.3390/s18082443
Note that from the first issue of 2016, this journal uses article numbers instead of page numbers. See further details here.