Investigation of Gasochromic Rhodium Complexes Towards Their Reactivity to CO and Integration into an Optical Gas Sensor for Fire Gas Detection


Abstract
:1. Introduction
2. Sensing Principles
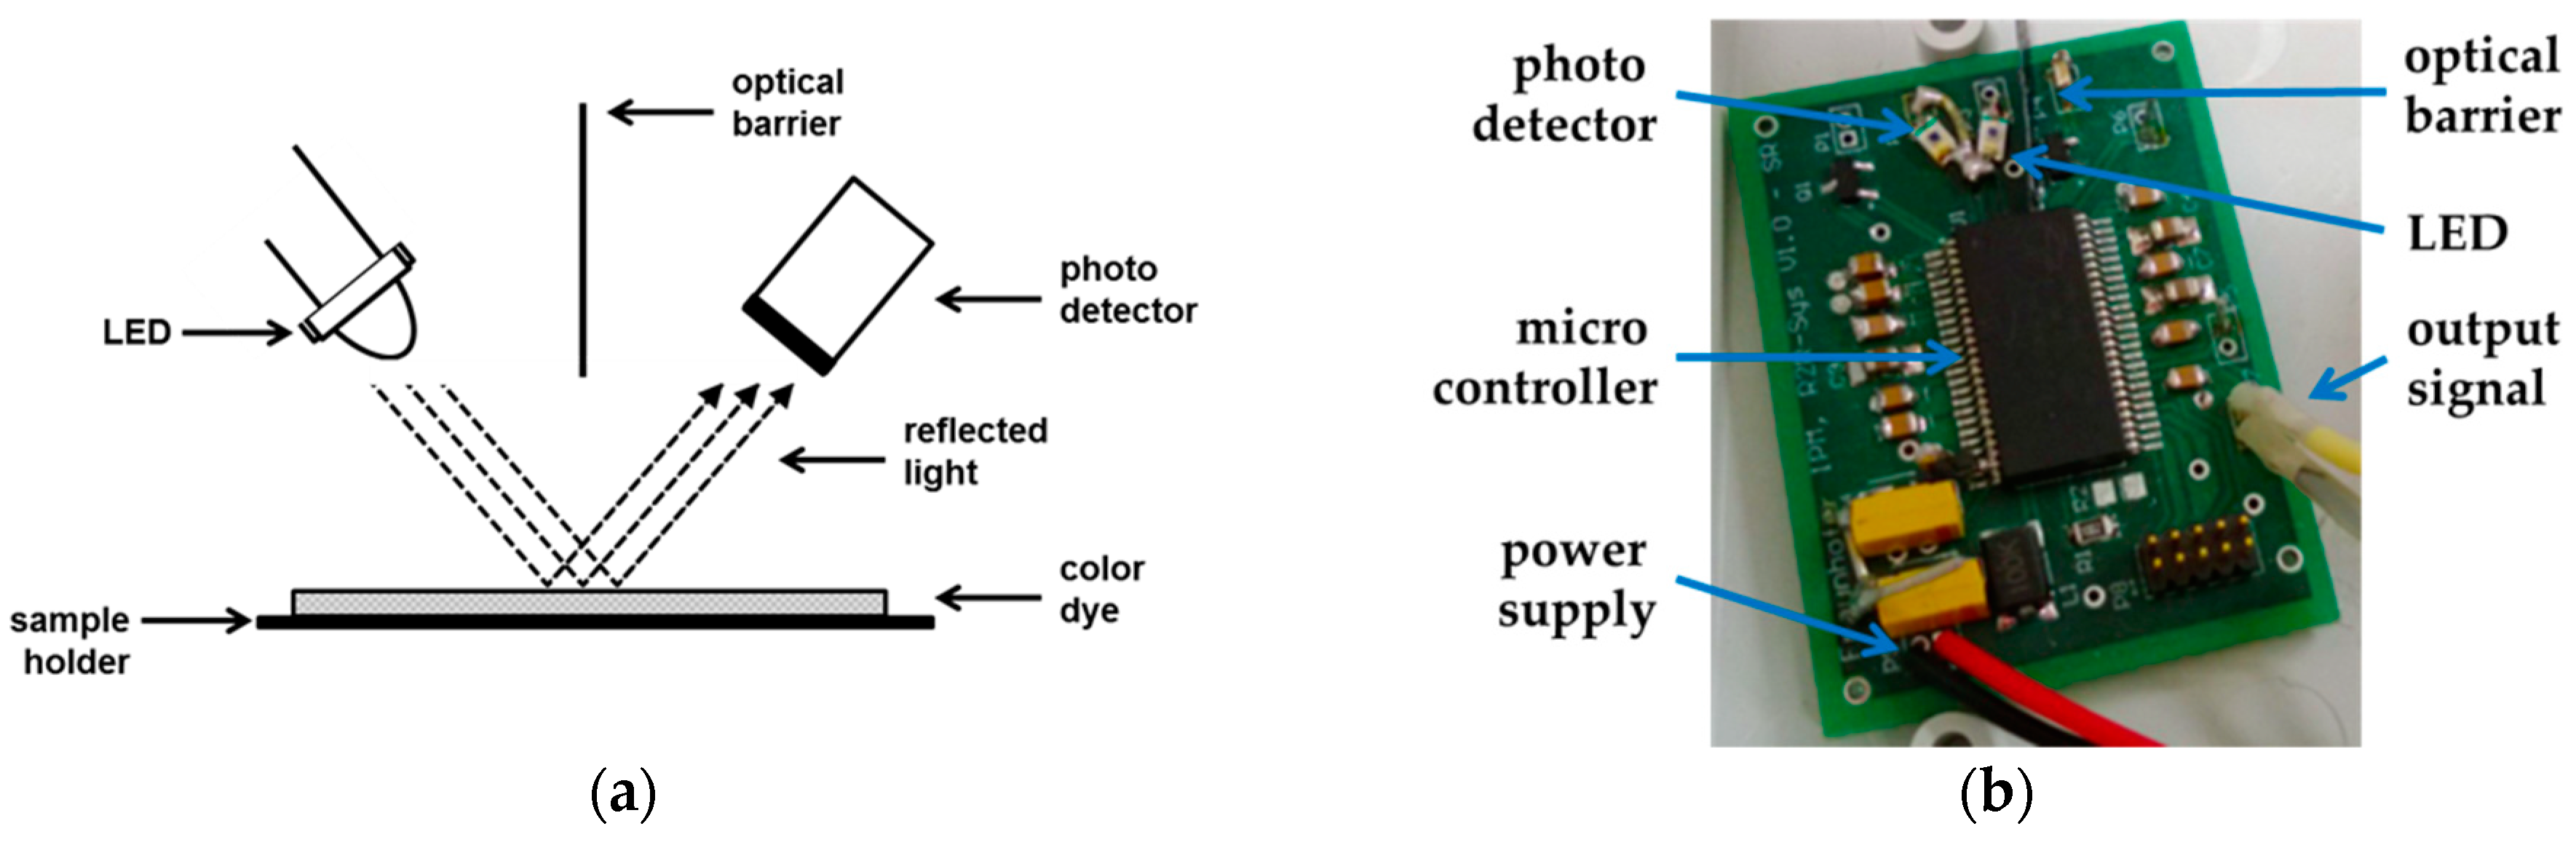
2.1. Reflection-Based Measurements
2.2. Waveguide-Based Measurements
3. Experimental
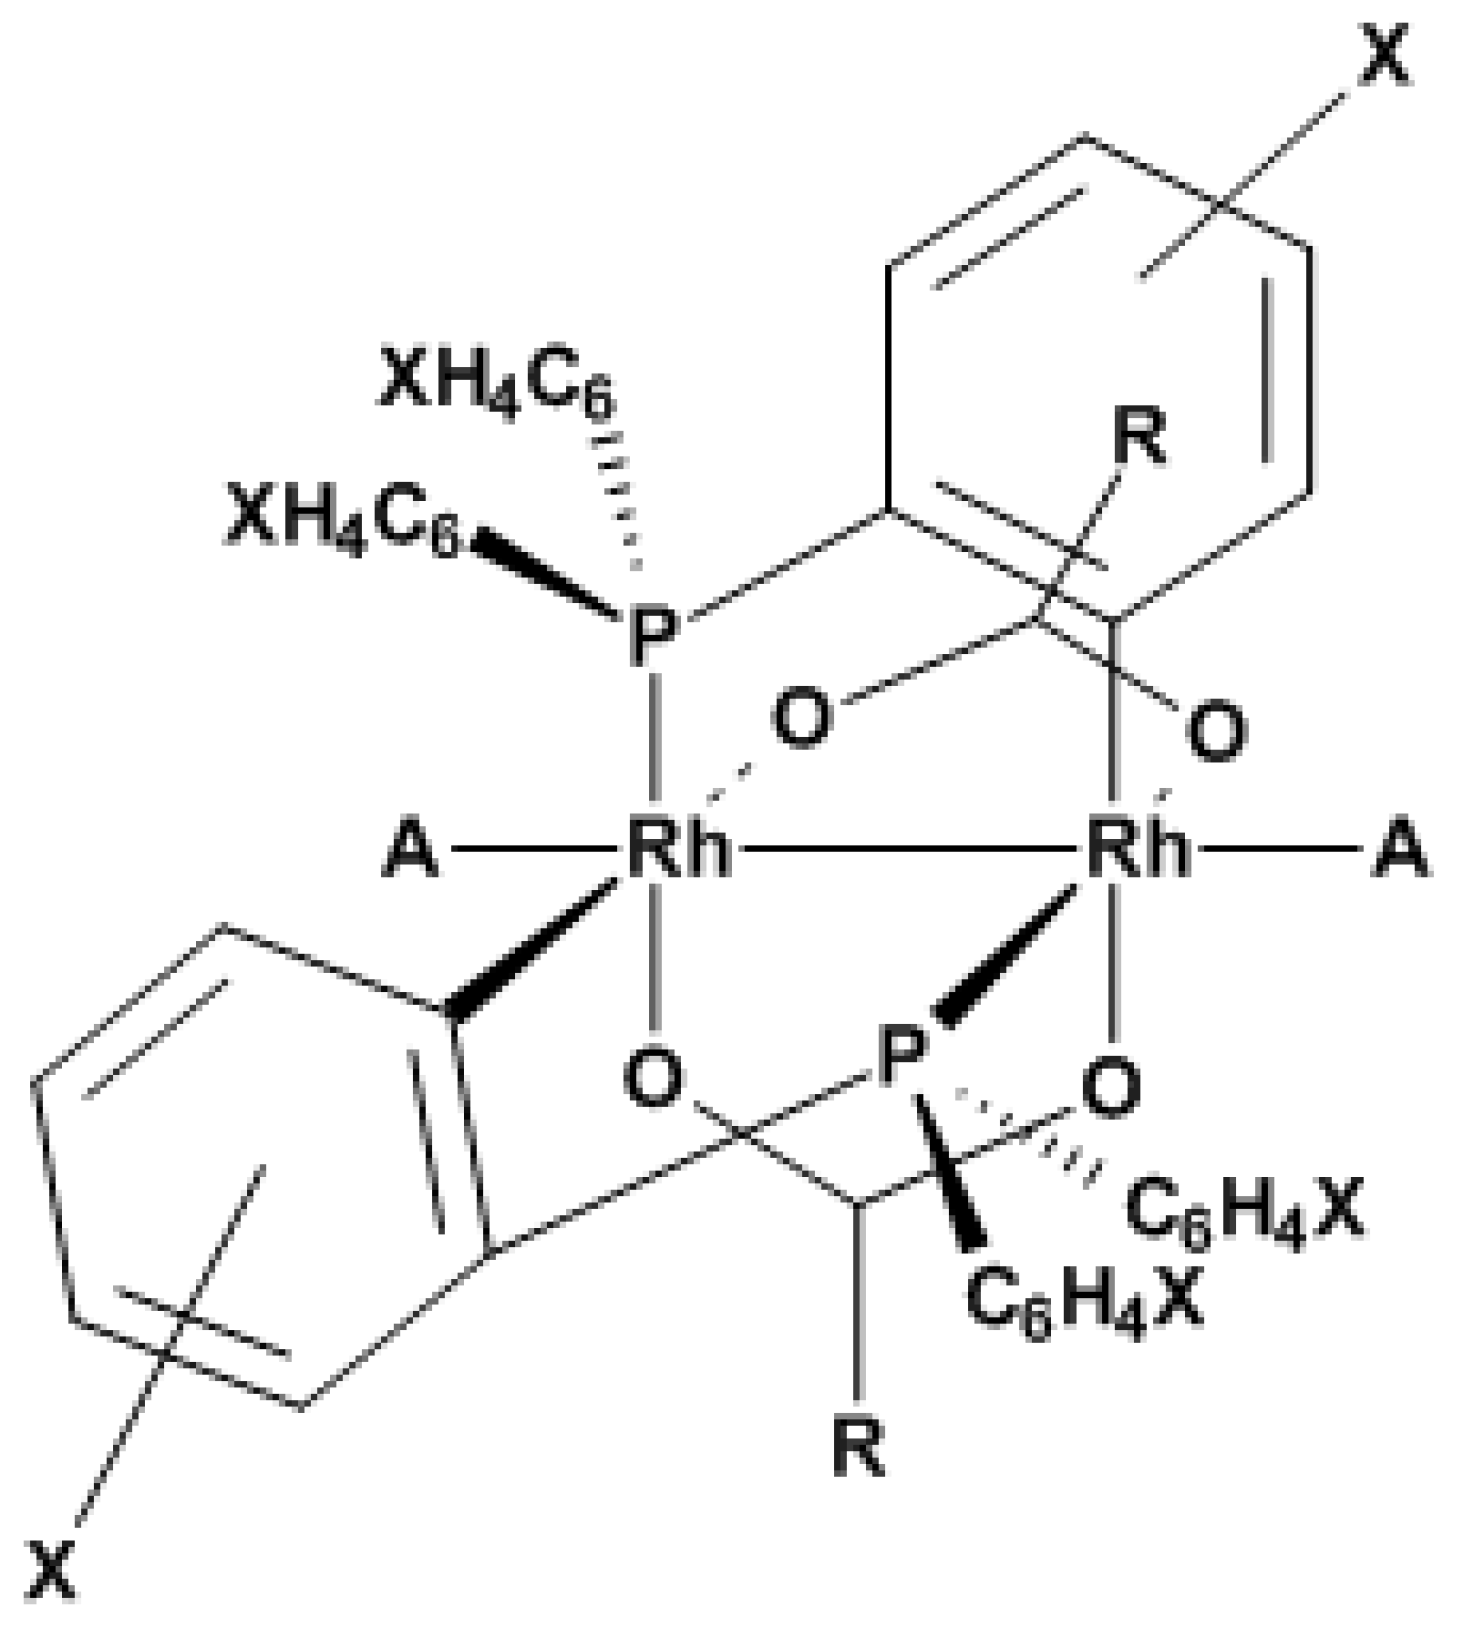
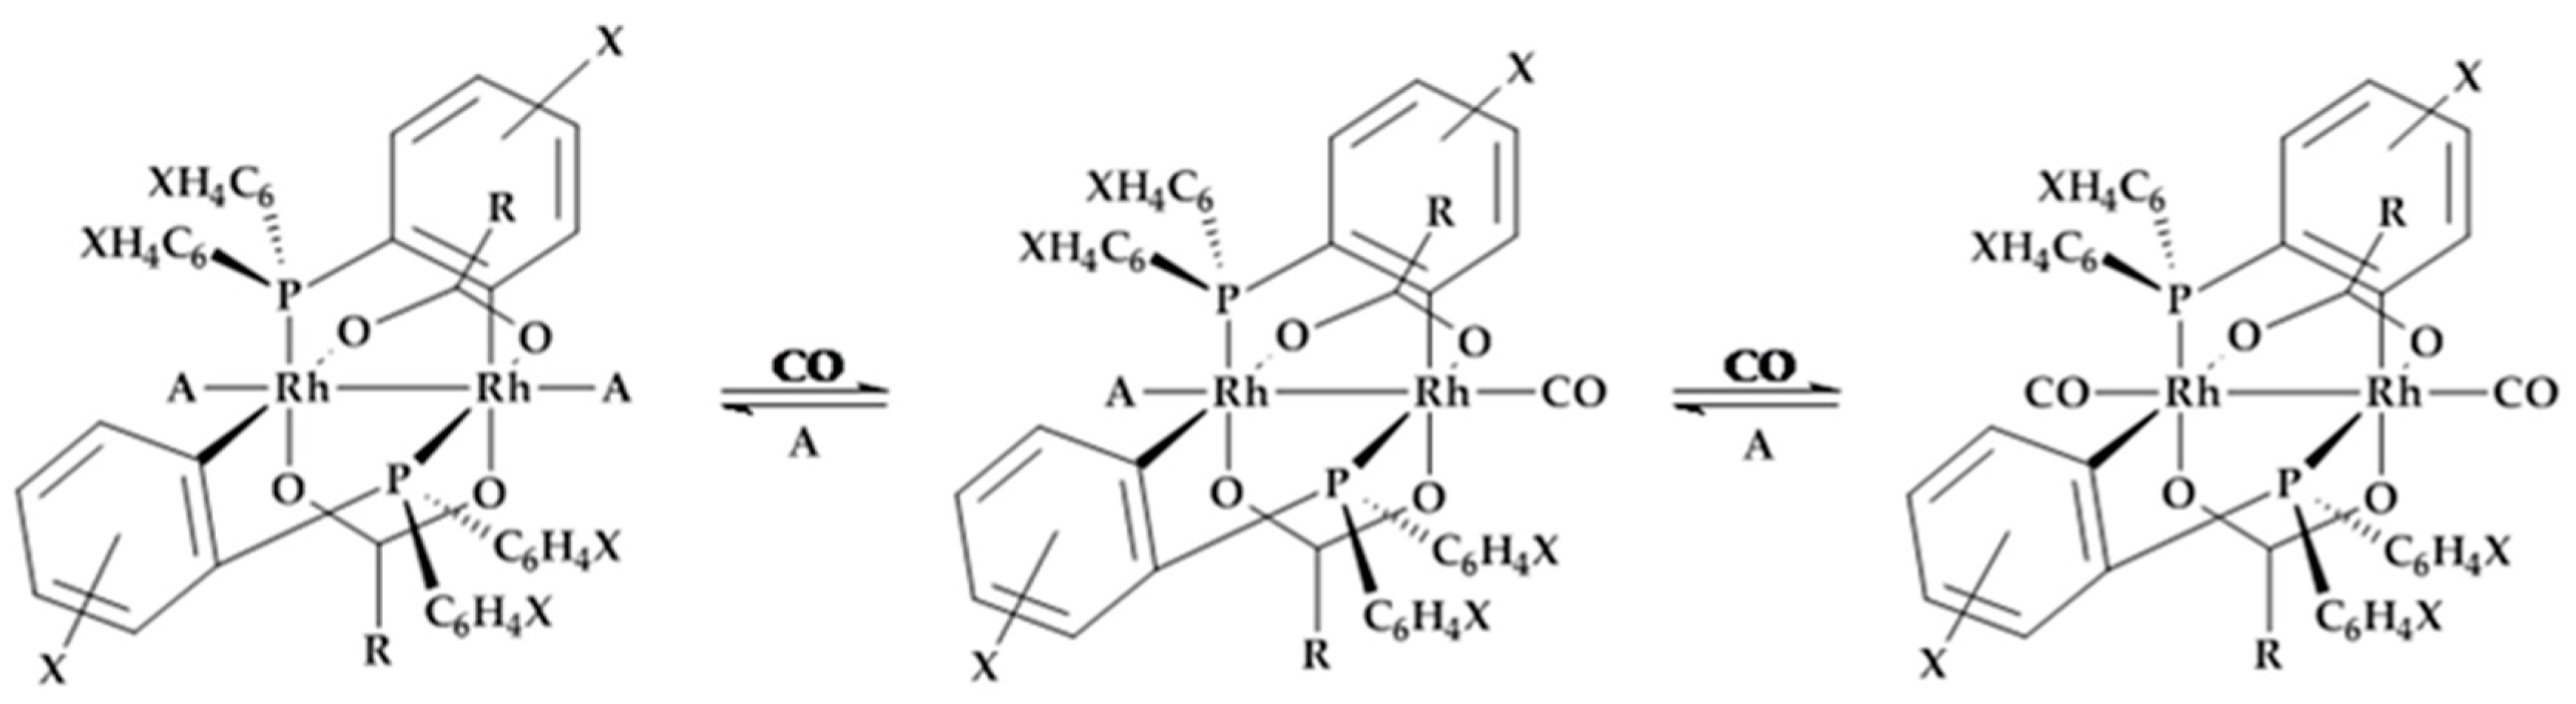
3.1. Variation of Binuclear Rhodium Complexes
3.2. Sample Preparation
3.3. Gas-Dependent Measurements
4. Results
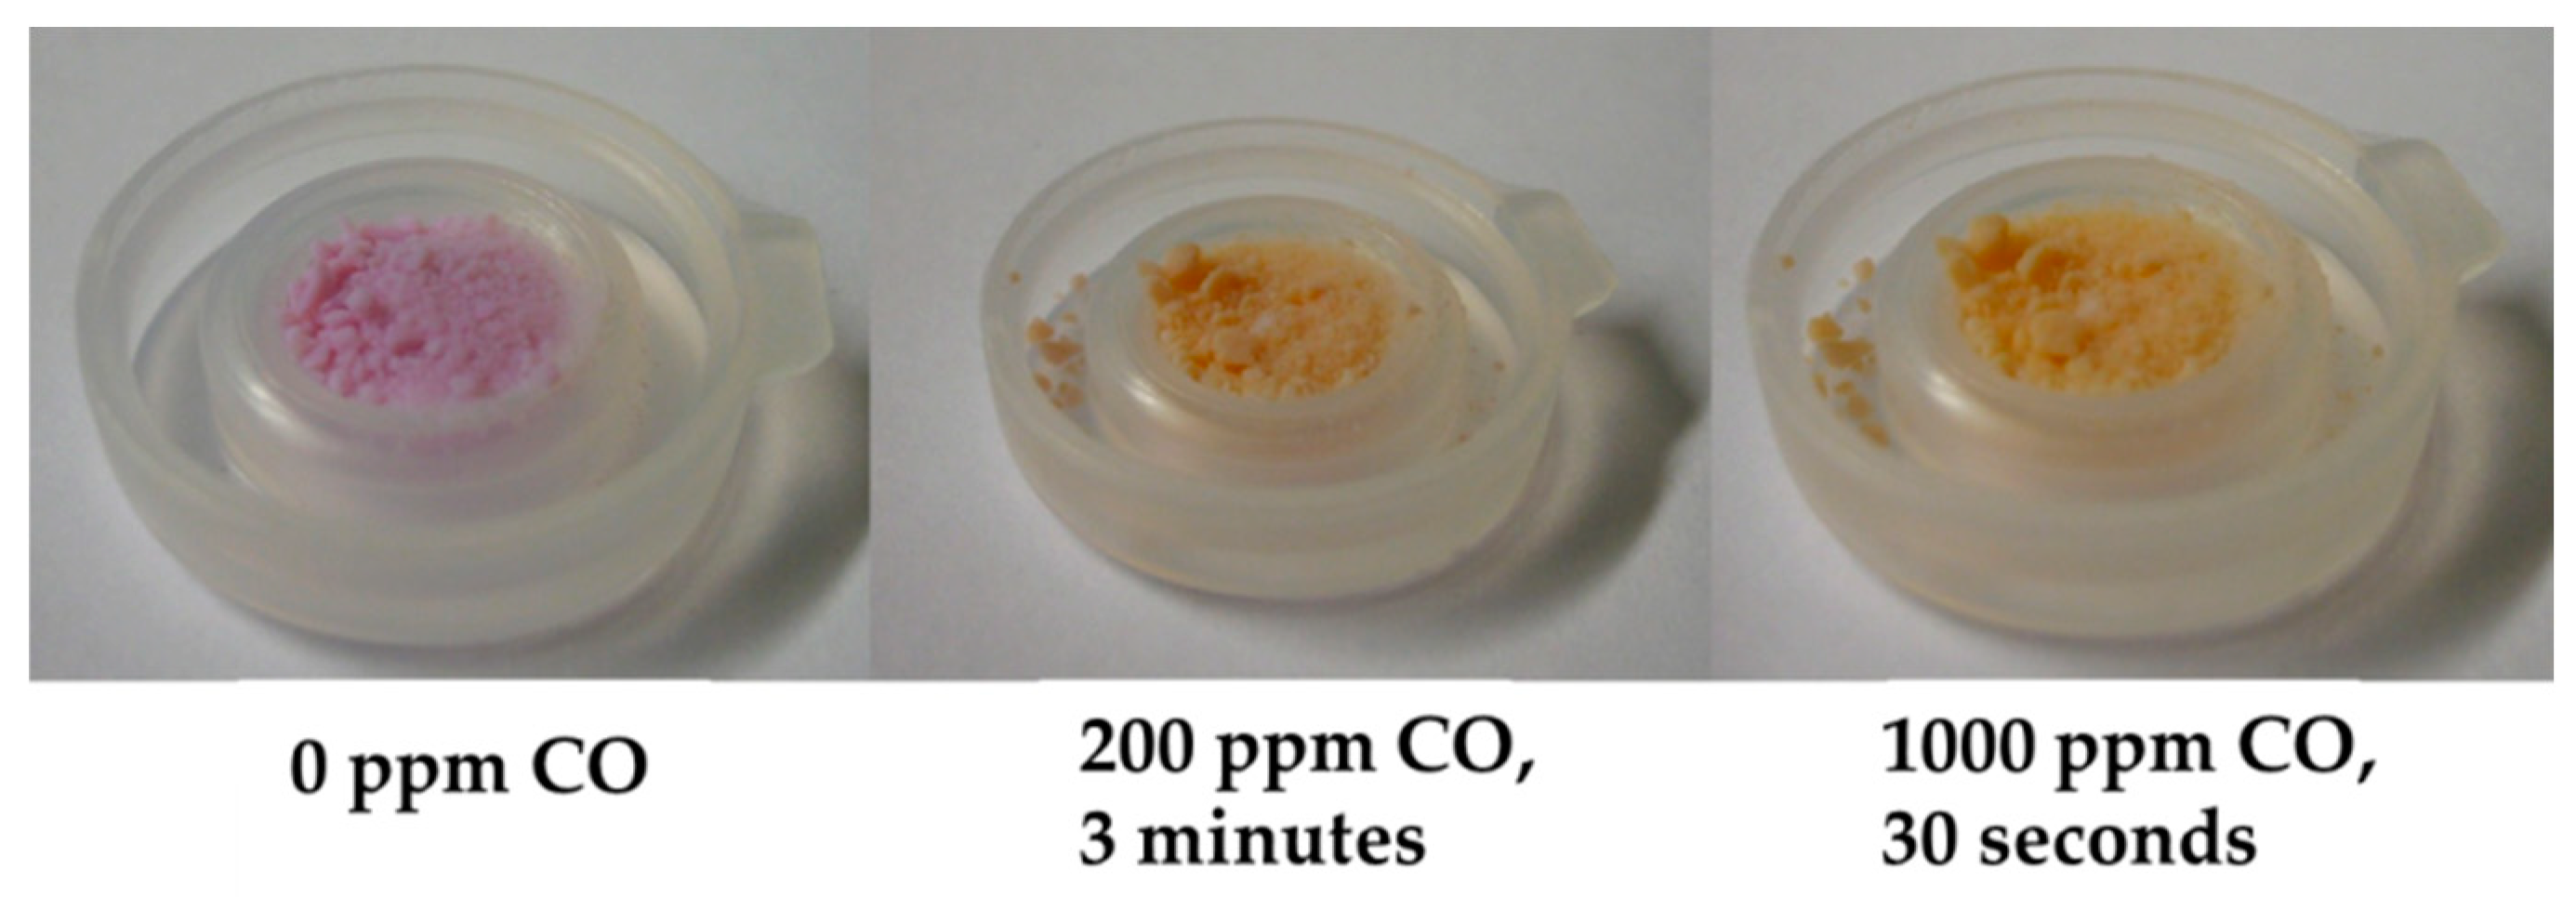
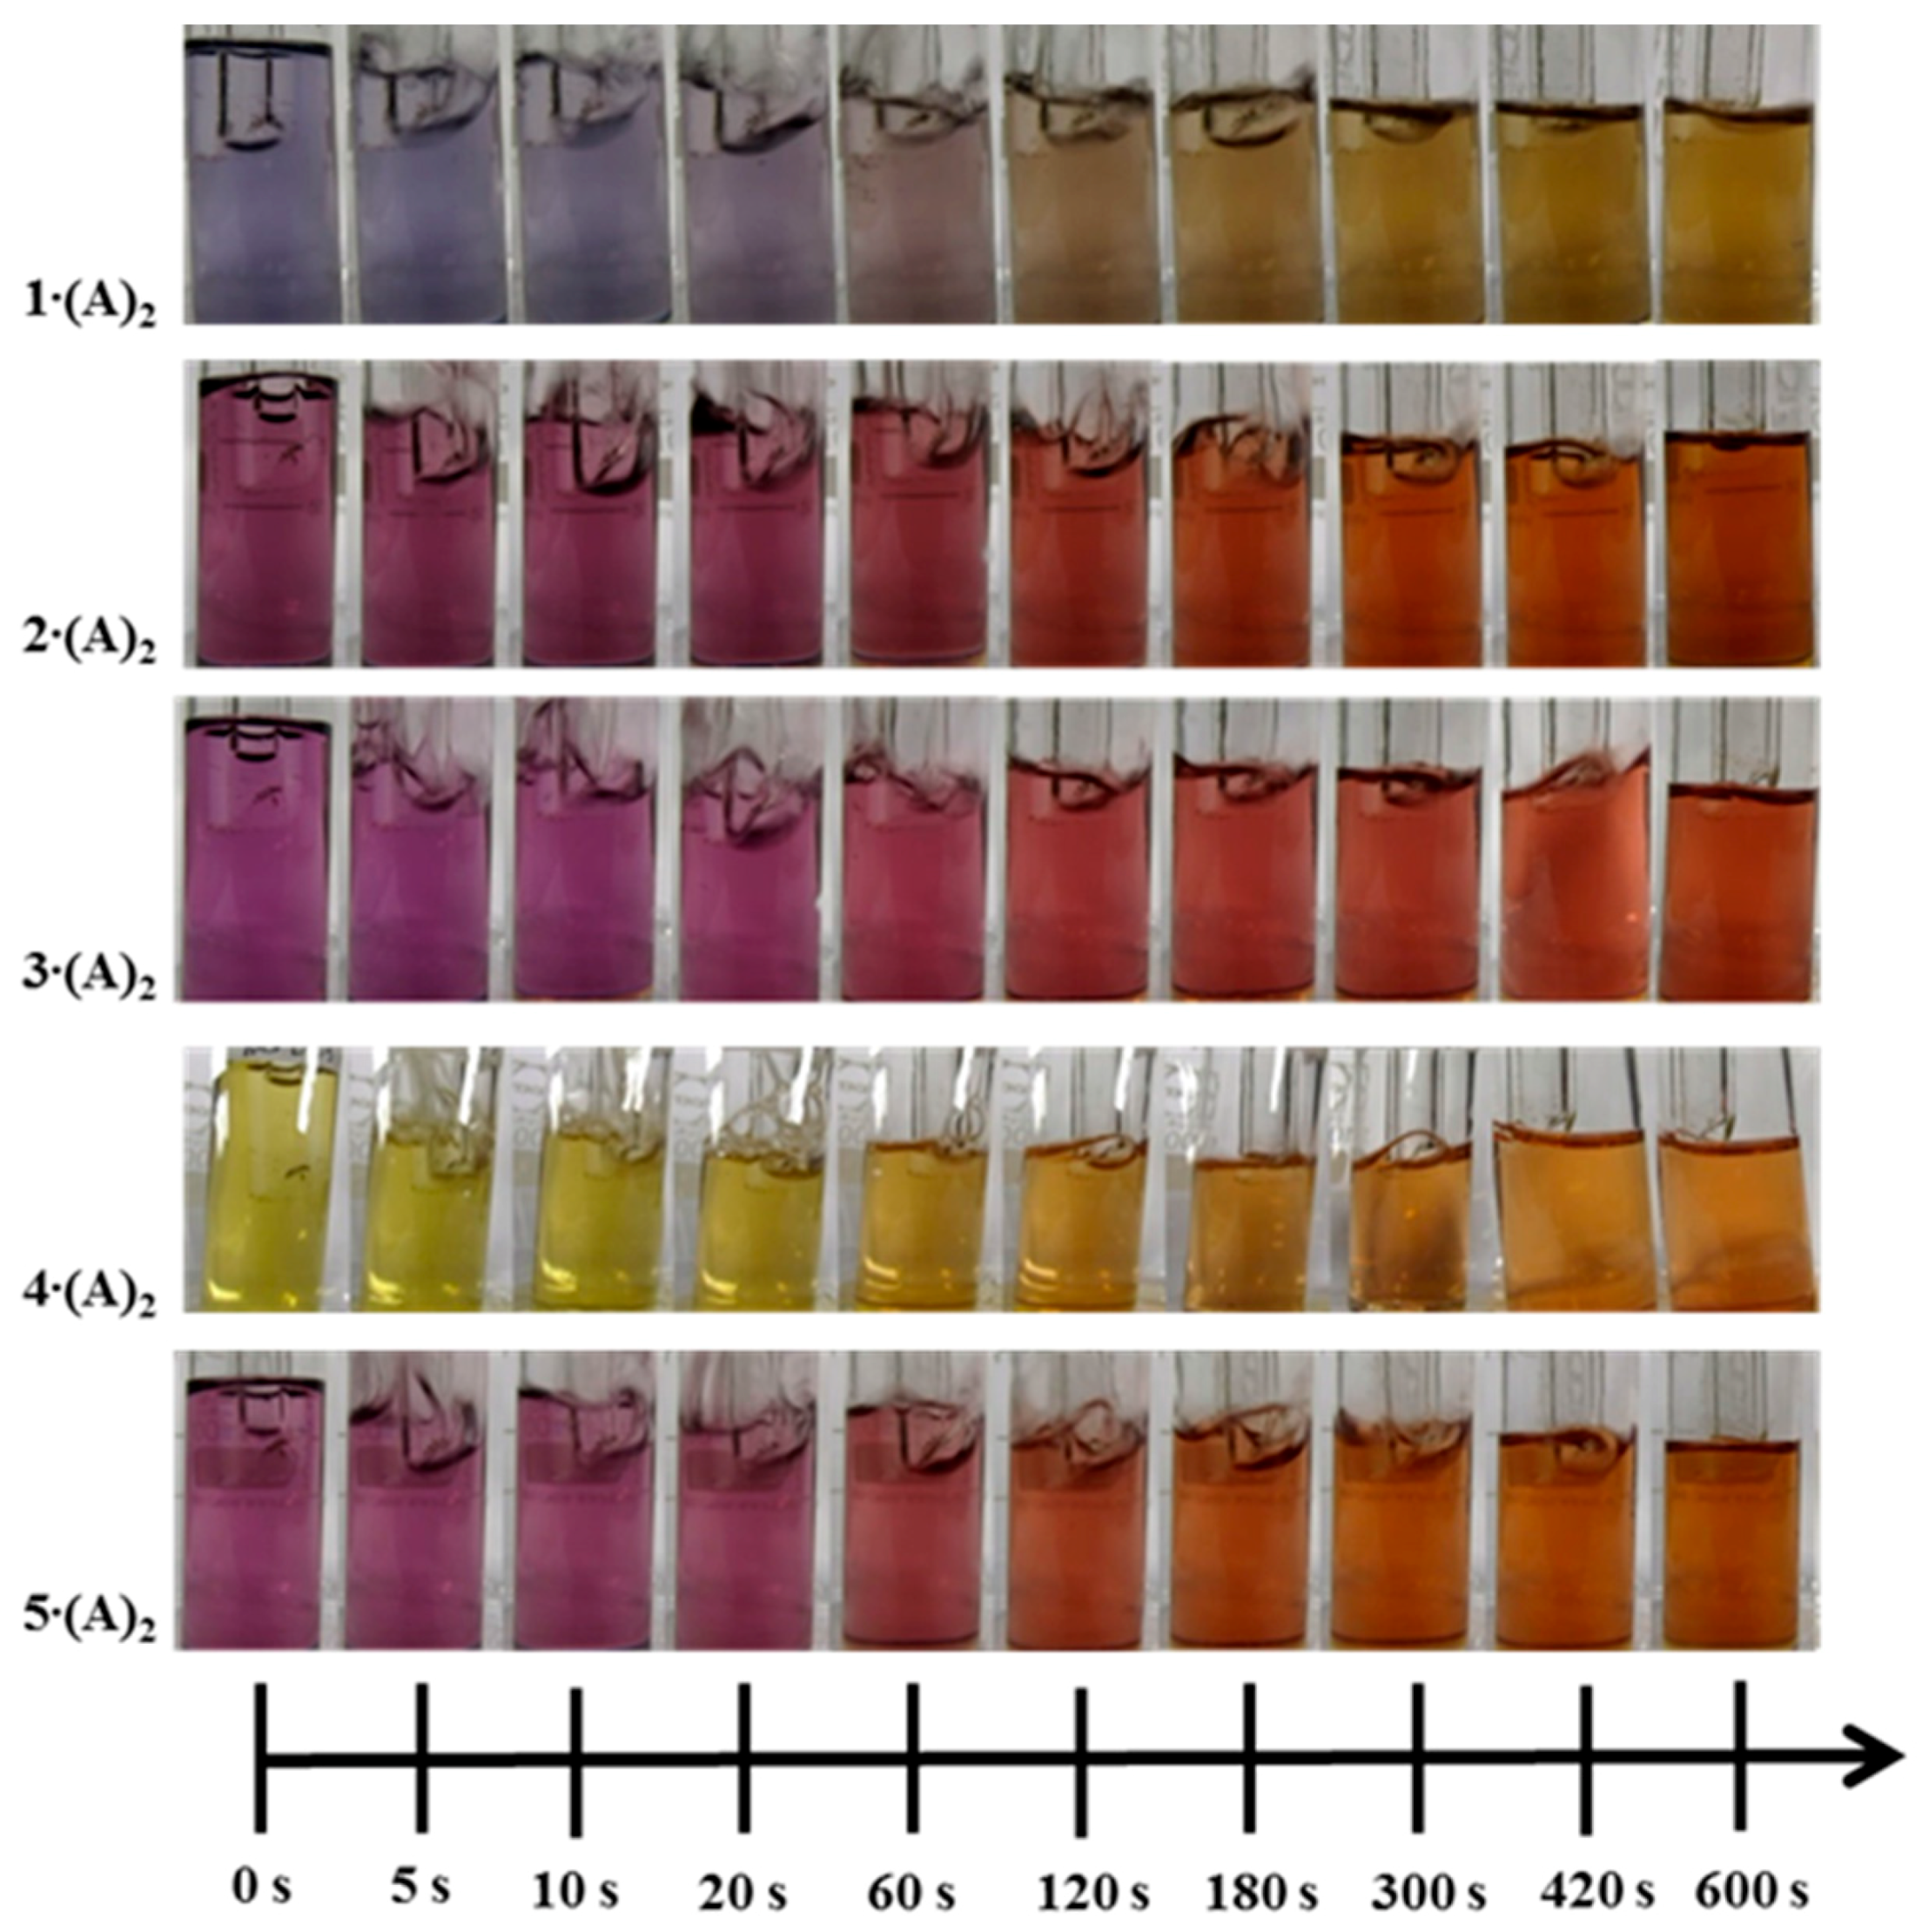
4.1. Colorimetric Reaction
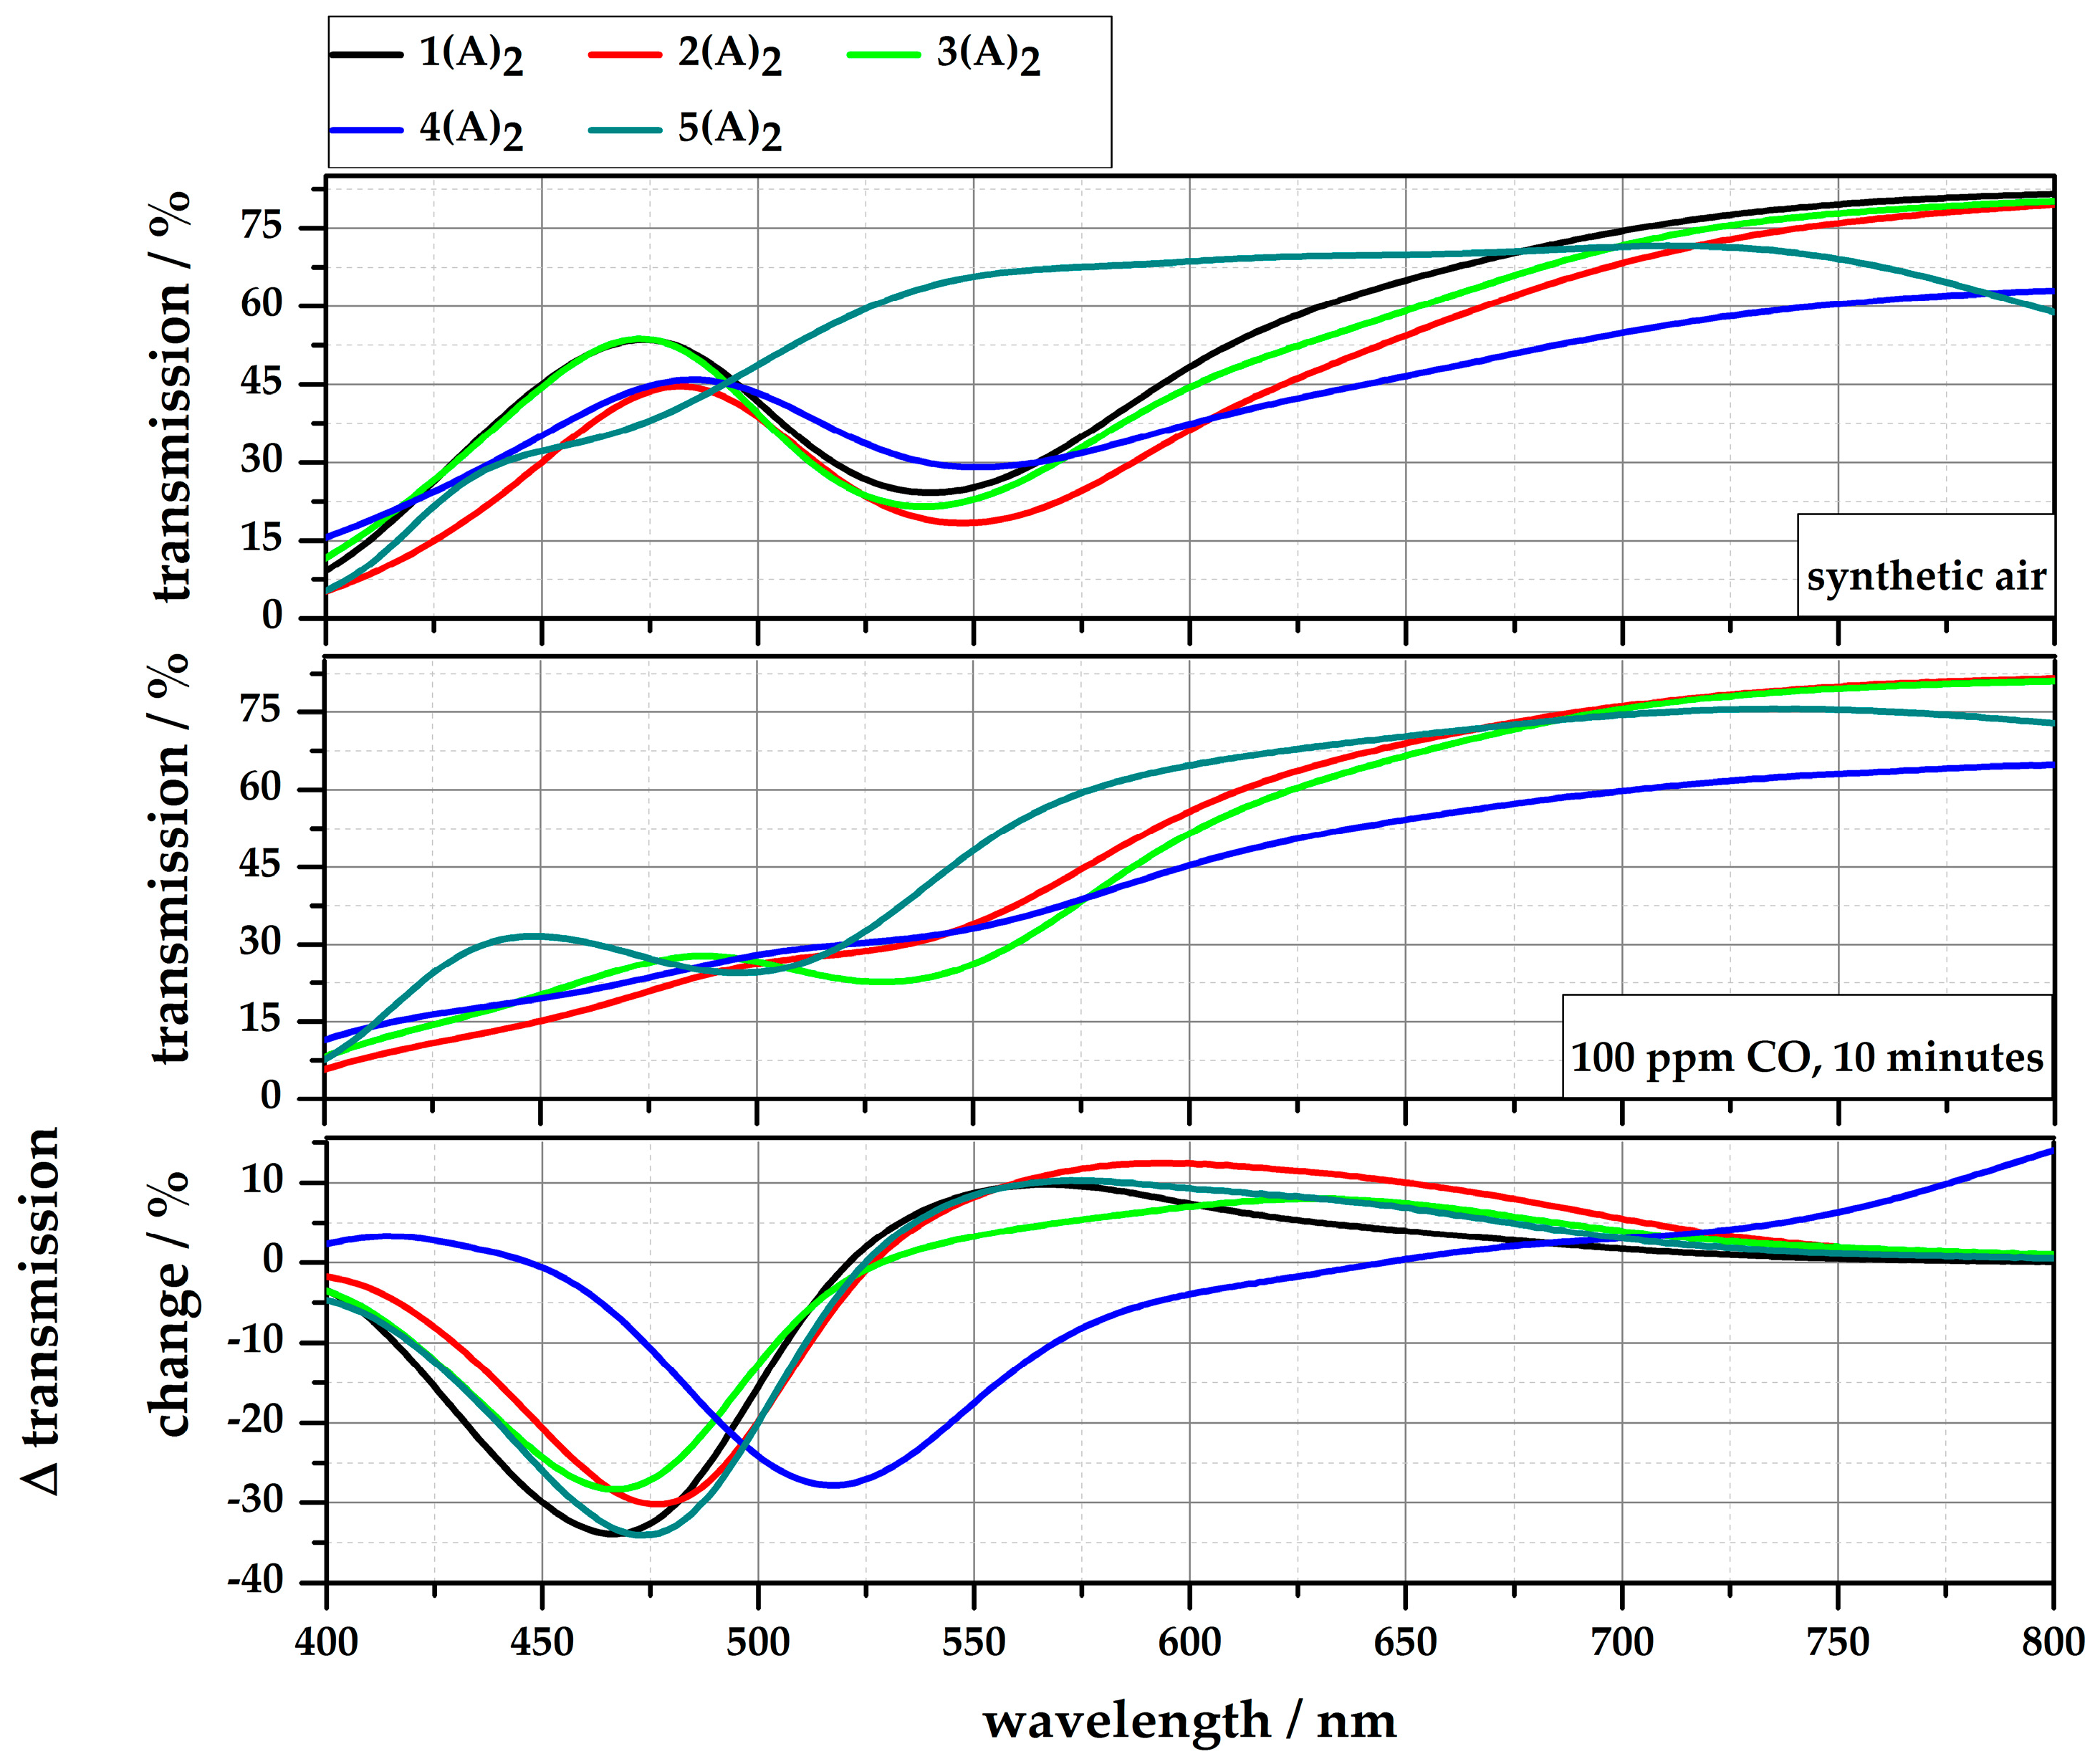
4.2. Reflection-Based Measurements
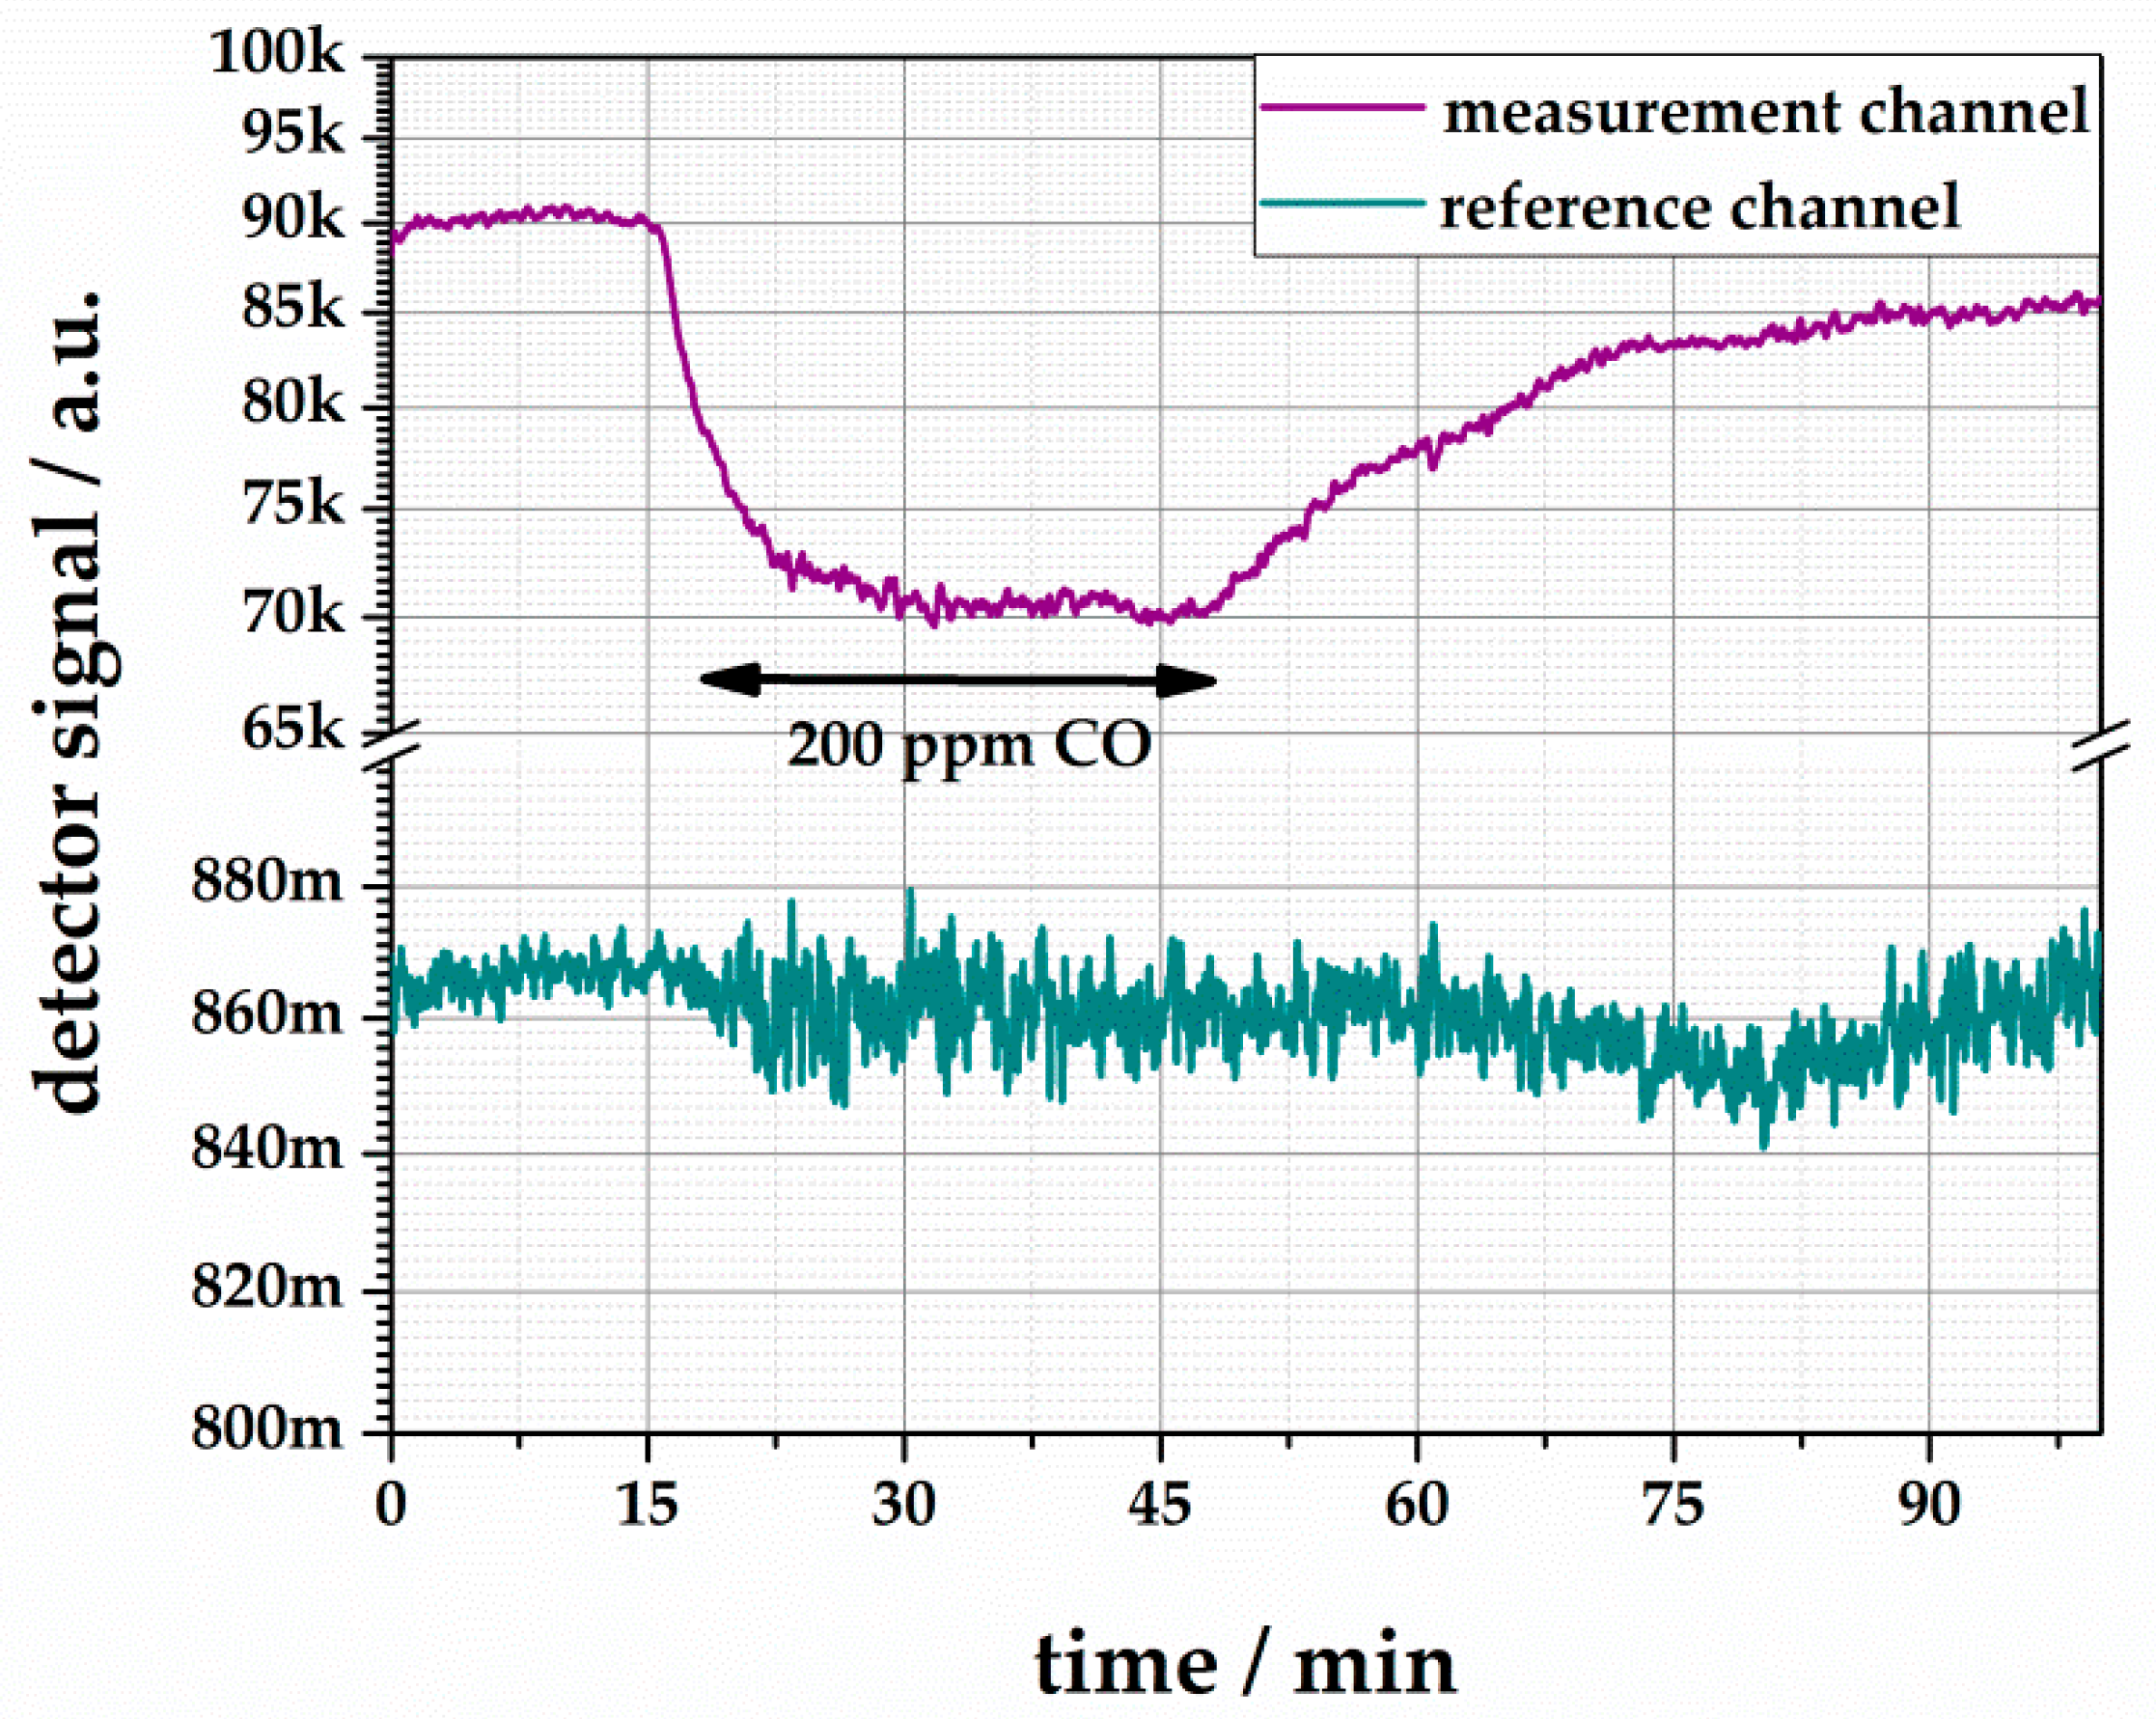
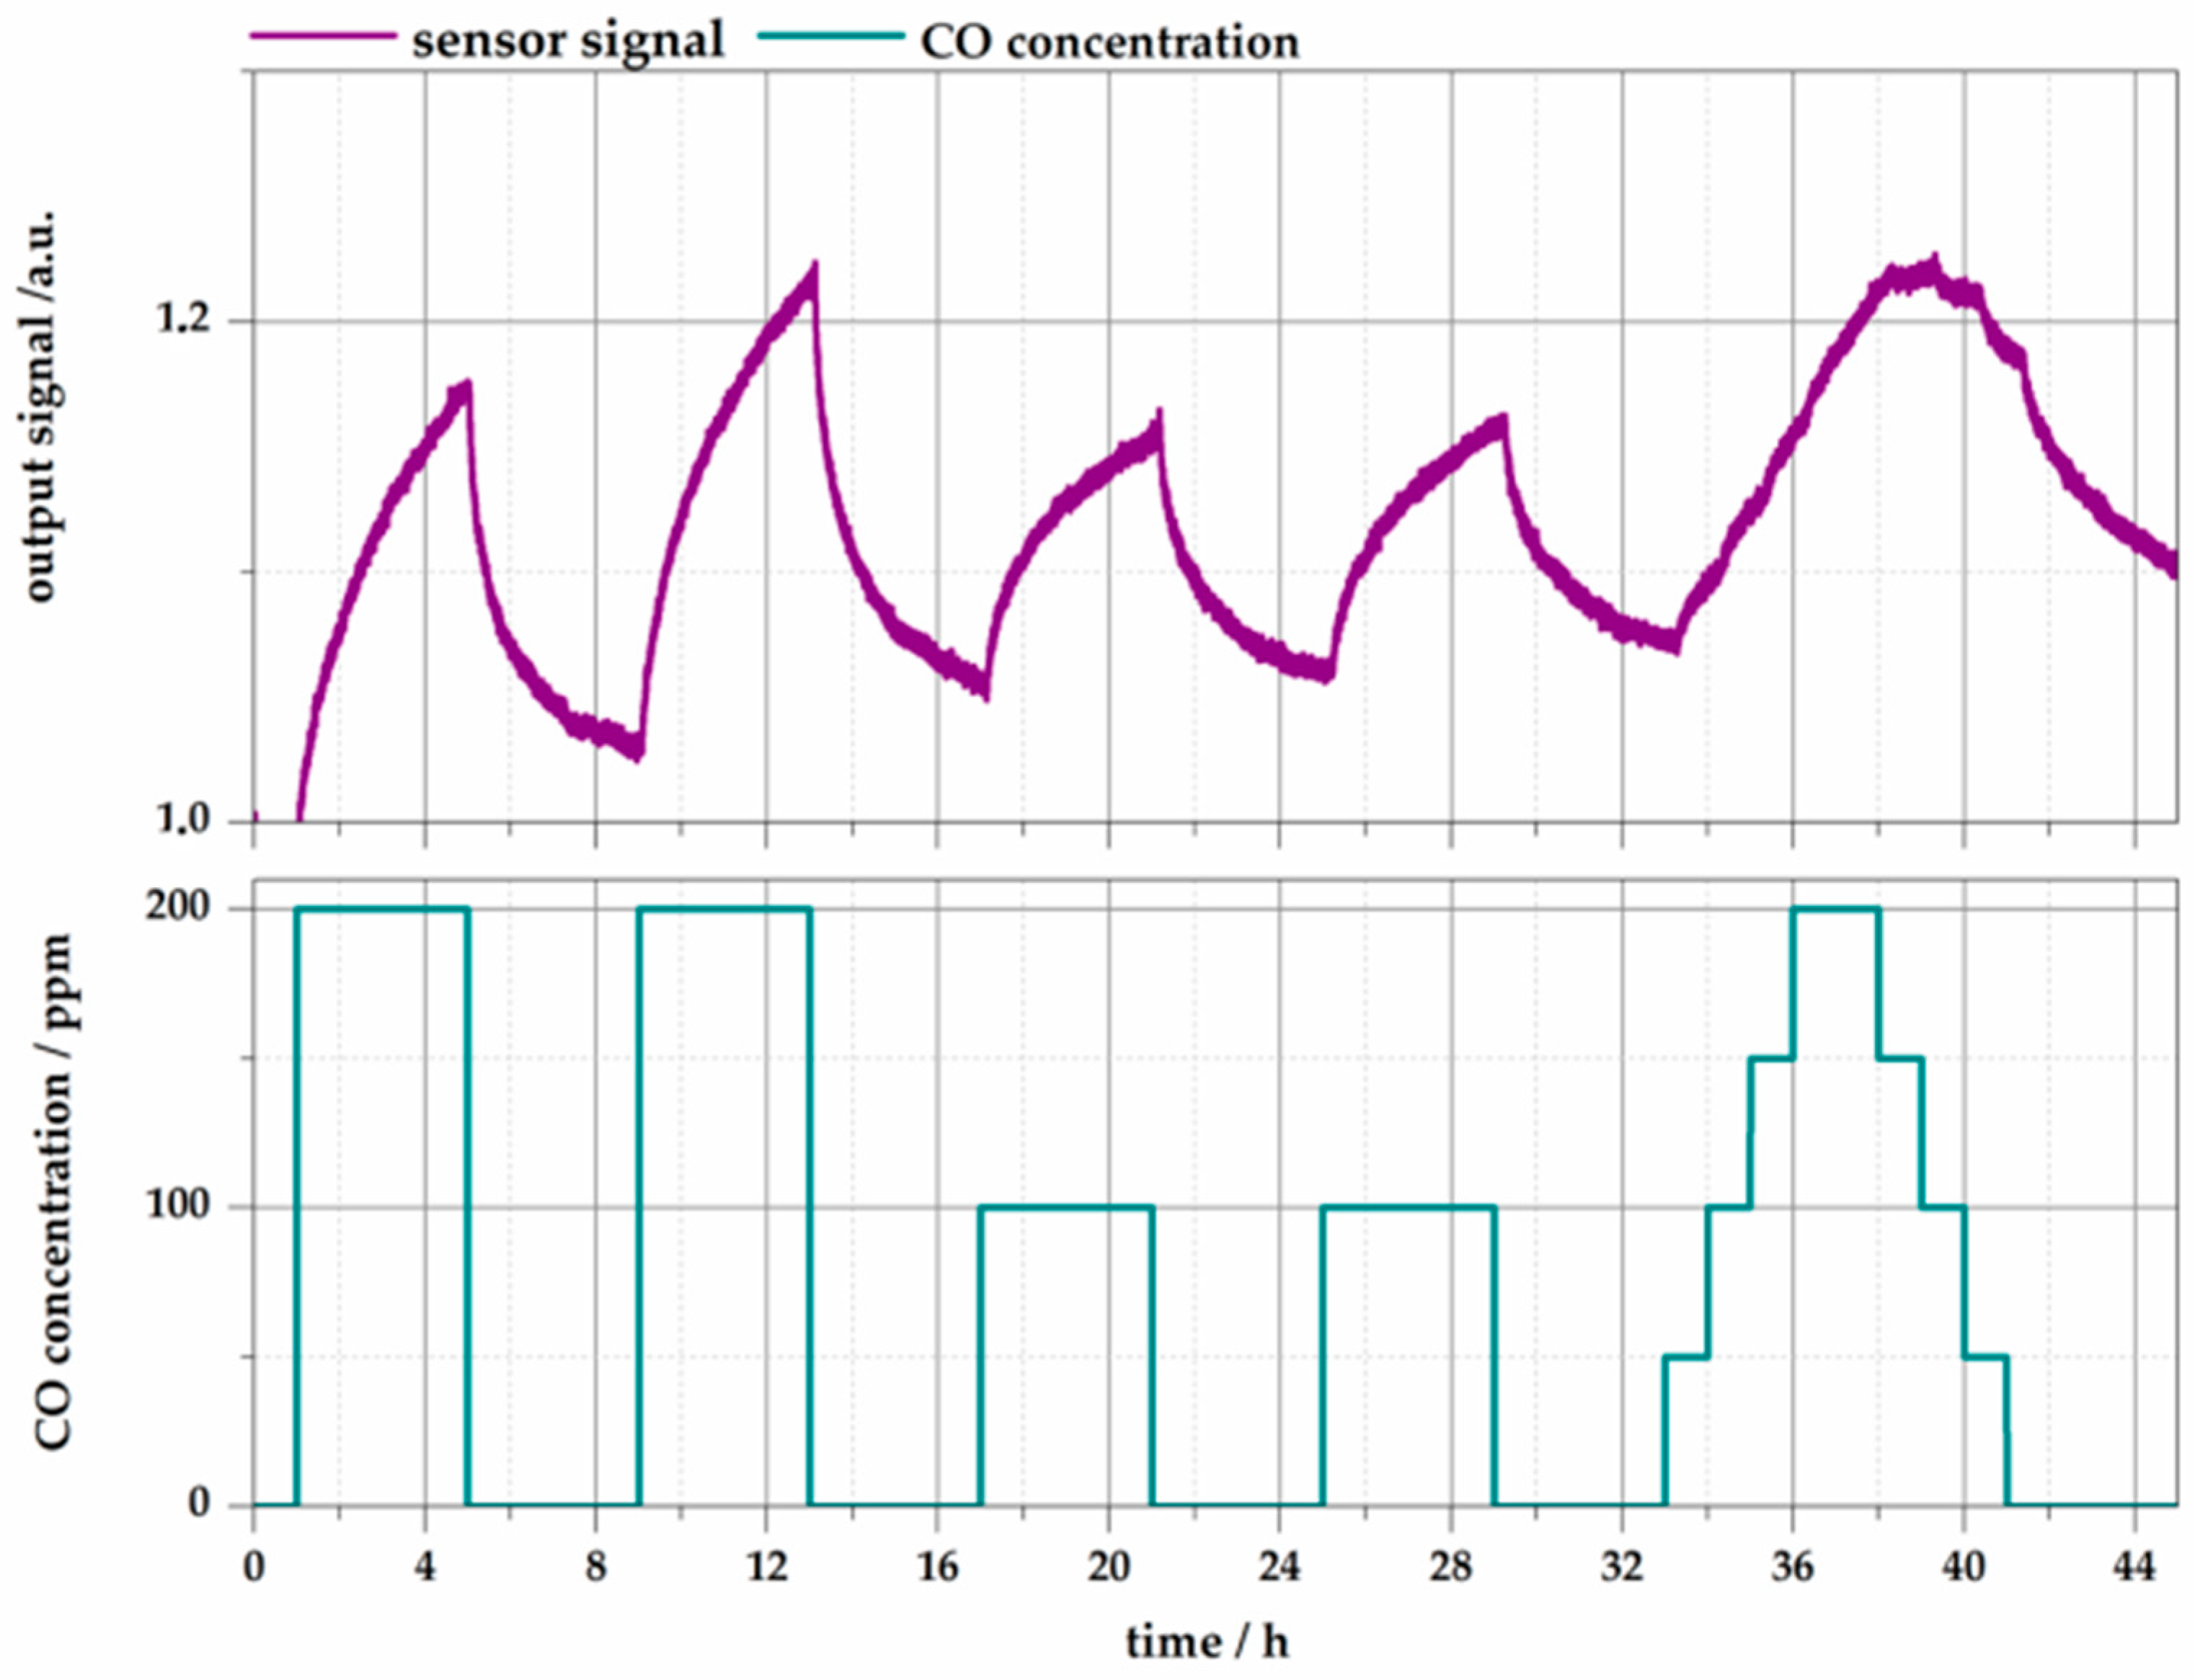
4.3. Waveguide-Based Measurements
5. Conclusions
Author Contributions
Funding
Conflicts of Interest
References
- National Research Council. Fire and Smoke: Understanding the Hazards; National Academies Press: Washington, DC, USA, 1986; ISBN 0309568609. [Google Scholar]
- Liu, Z.; Kim, A.K. Review of Recent Developments in Fire Detection Technologies. J. Fire Prot. Eng. 2003, 13, 129–151. [Google Scholar] [CrossRef] [Green Version]
- Fonollosa, J.; Solórzano, A.; Marco, S. Chemical Sensor System and Associated Algorithms for Fire Detection: A Review. Sensors 2018, 18, 553. [Google Scholar] [CrossRef] [PubMed]
- Harwood, J.A.; Moseley, P.T.; Peat, R.; Reynolds, C.A. The use of low power carbon monoxide sensors to provide early warning of fire. Fire Saf. J. 1991, 17, 431–443. [Google Scholar] [CrossRef]
- Kappler, J.; Tomescu, A.; Barsan, N.; Weimar, U. CO consumption of Pd doped SnO2 based sensors. Thin Solid Films 2001, 391, 186–191. [Google Scholar] [CrossRef]
- Burgés, J.; Marco, S. Low Power Operation of Temperature-Modulated Metal Oxide Semiconductor Gas Sensors. Sensors 2018, 18, 339. [Google Scholar] [CrossRef] [PubMed]
- Pohle, R.; Simon, E.; Schneider, R.; Fleischer, M.; Sollacher, R.; Gao, H.; Müller, K.; Jauch, P.; Loepfe, M.; Frerichs, H.-P.; et al. Fire detection with low power FET gas sensors. Sens. Actuators B Chem. 2007, 120, 669–672. [Google Scholar] [CrossRef]
- Stetter, J.R. Amperometric Gas Sensors—A Review. Chem. Rev. 2008, 108, 352–366. [Google Scholar] [CrossRef] [PubMed]
- Schmitt, K.; Tarantik, K.R.; Pannek, C.; Woellenstein, J. Colorimetric Materials for Fire Gas Detection—A Review. Chemosensors 2018, 6, 14. [Google Scholar] [CrossRef]
- Esteban, J.; Ros-Lis, J.V.; Martinez-Mánez, R. Sensitive and Selective Chromogenic Sensing of Carbon Monoxide by Using Binuclear Rhodium Complexes. Angew. Chem. 2010, 122, 4934–4937. [Google Scholar] [CrossRef] [PubMed]
- Moragues, M.E.; Esteban, J.; Ros-Lis, J.V.; Martínez-Máñez, R.; Marcos, M.D.; Martínez, M.; Sancenón, F. Sensitive and selective chromogenic sensing of carbon monoxide via reversible axial CO coordination in binuclear rhodium complexes. J. Am. Chem. Soc. 2011, 133, 15762–15772. [Google Scholar] [CrossRef] [PubMed]
- Moragues, M.E.; Esteban, J.; Ros-Lis, J.V.; Martínez-Máñez, R.; Marcos, M.D.; Martínez, M.; Sancenón, F. An optoelectronic sensing device for CO detection in air based on a binuclear rhodium complex. Sens. Actuators B Chem. 2014, 191, 257–263. [Google Scholar] [CrossRef] [Green Version]
- Peter, C.; Schulz, S.; Barth, M.; Gempp, M.; Rademacher, S.; Woellenstein, J. Low-cost roll-to-roll colorimetric gas sensor system for fire detection. In Proceedings of the 2013 Transducers & Eurosensors XXVII: The 17th International Conference on Solid-State Sensors, Actuators and Microsystems (TRANSDUCERS & EUROSENSORS XXVII), Barcelona, Spain, 16–20 June 2013. [Google Scholar]
- Courbat, J.; Briand, D.; Damon-Lacoste, J.; Woellenstein, J. Evaluation of pH indicator-based colorimetric films for ammonia detection using optical waveguides. Sens. Actuators B Chem. 2009, 143, 62–70. [Google Scholar] [CrossRef]
- Pannek, C. Mikrosystem zur Brandgasdetektion nach dem Farbumschlagsprinzip. Ph.D. Thesis, University of Freiburg, Freiburg im Breisgau, Germany, 2014. [Google Scholar]
- Cotton, F.A. Structural and electrochemical characterization of the novel orthometalated dirhodium(II)compounds Rh2(O2CMe)2[Ph2P(C6H4)]2L. Organometallics 1985, 4, 8–13. [Google Scholar] [CrossRef]
- Kneer, J.; Eberhardt, A.; Walden, P.; Ortiz Pérez, A.; Wöllenstein, J.; Palzer, S. Apparatus to characterize gas sensor response under real-world conditions in the lab. Rev. Sci. Instrum. 2014, 85, 055006. [Google Scholar] [CrossRef] [PubMed]
- Pinder, G.F.; Gray, W. Essentials of Multiphase Flow and Transport in Porous Media; Wiley: Hoboken, NJ, USA, 2008; ISBN 978-0-470-31762-4. [Google Scholar]


| Complex | X= | R= | A= |
|---|---|---|---|
| 1∙(A)2 | 4-OCH3 | CH3 | CH3CO2H |
| 2∙(A)2 | 3-CH3 | CH3 | CH3CO2H |
| 3∙(A)2 | 3-F | CH3 | CH3CO2H |
| 4∙(A)2 | 4-OCH3; 3,5-CH3 | CH3 | CH3CO2H |
| 5∙(A)2 | 3-CH3 | CF3 | CF3CO2H |
| Complex | Max. Negative ΔT | Max. Positive ΔT | ||
|---|---|---|---|---|
| (%) | (nm) | (%) | (nm) | |
| 1∙(A)2 | 33.9 | 466 | 9.7 | 597 |
| 2∙(A)2 | 30.2 | 477 | 12.4 | 566 |
| 3∙(A)2 | 28.3 | 466 | 8.0 | 592 |
| 4∙(A)2 | 27.8 | 517 | 14.0 | 800 |
| 5∙(A)2 | 34.1 | 473 | 10.3 | 572 |
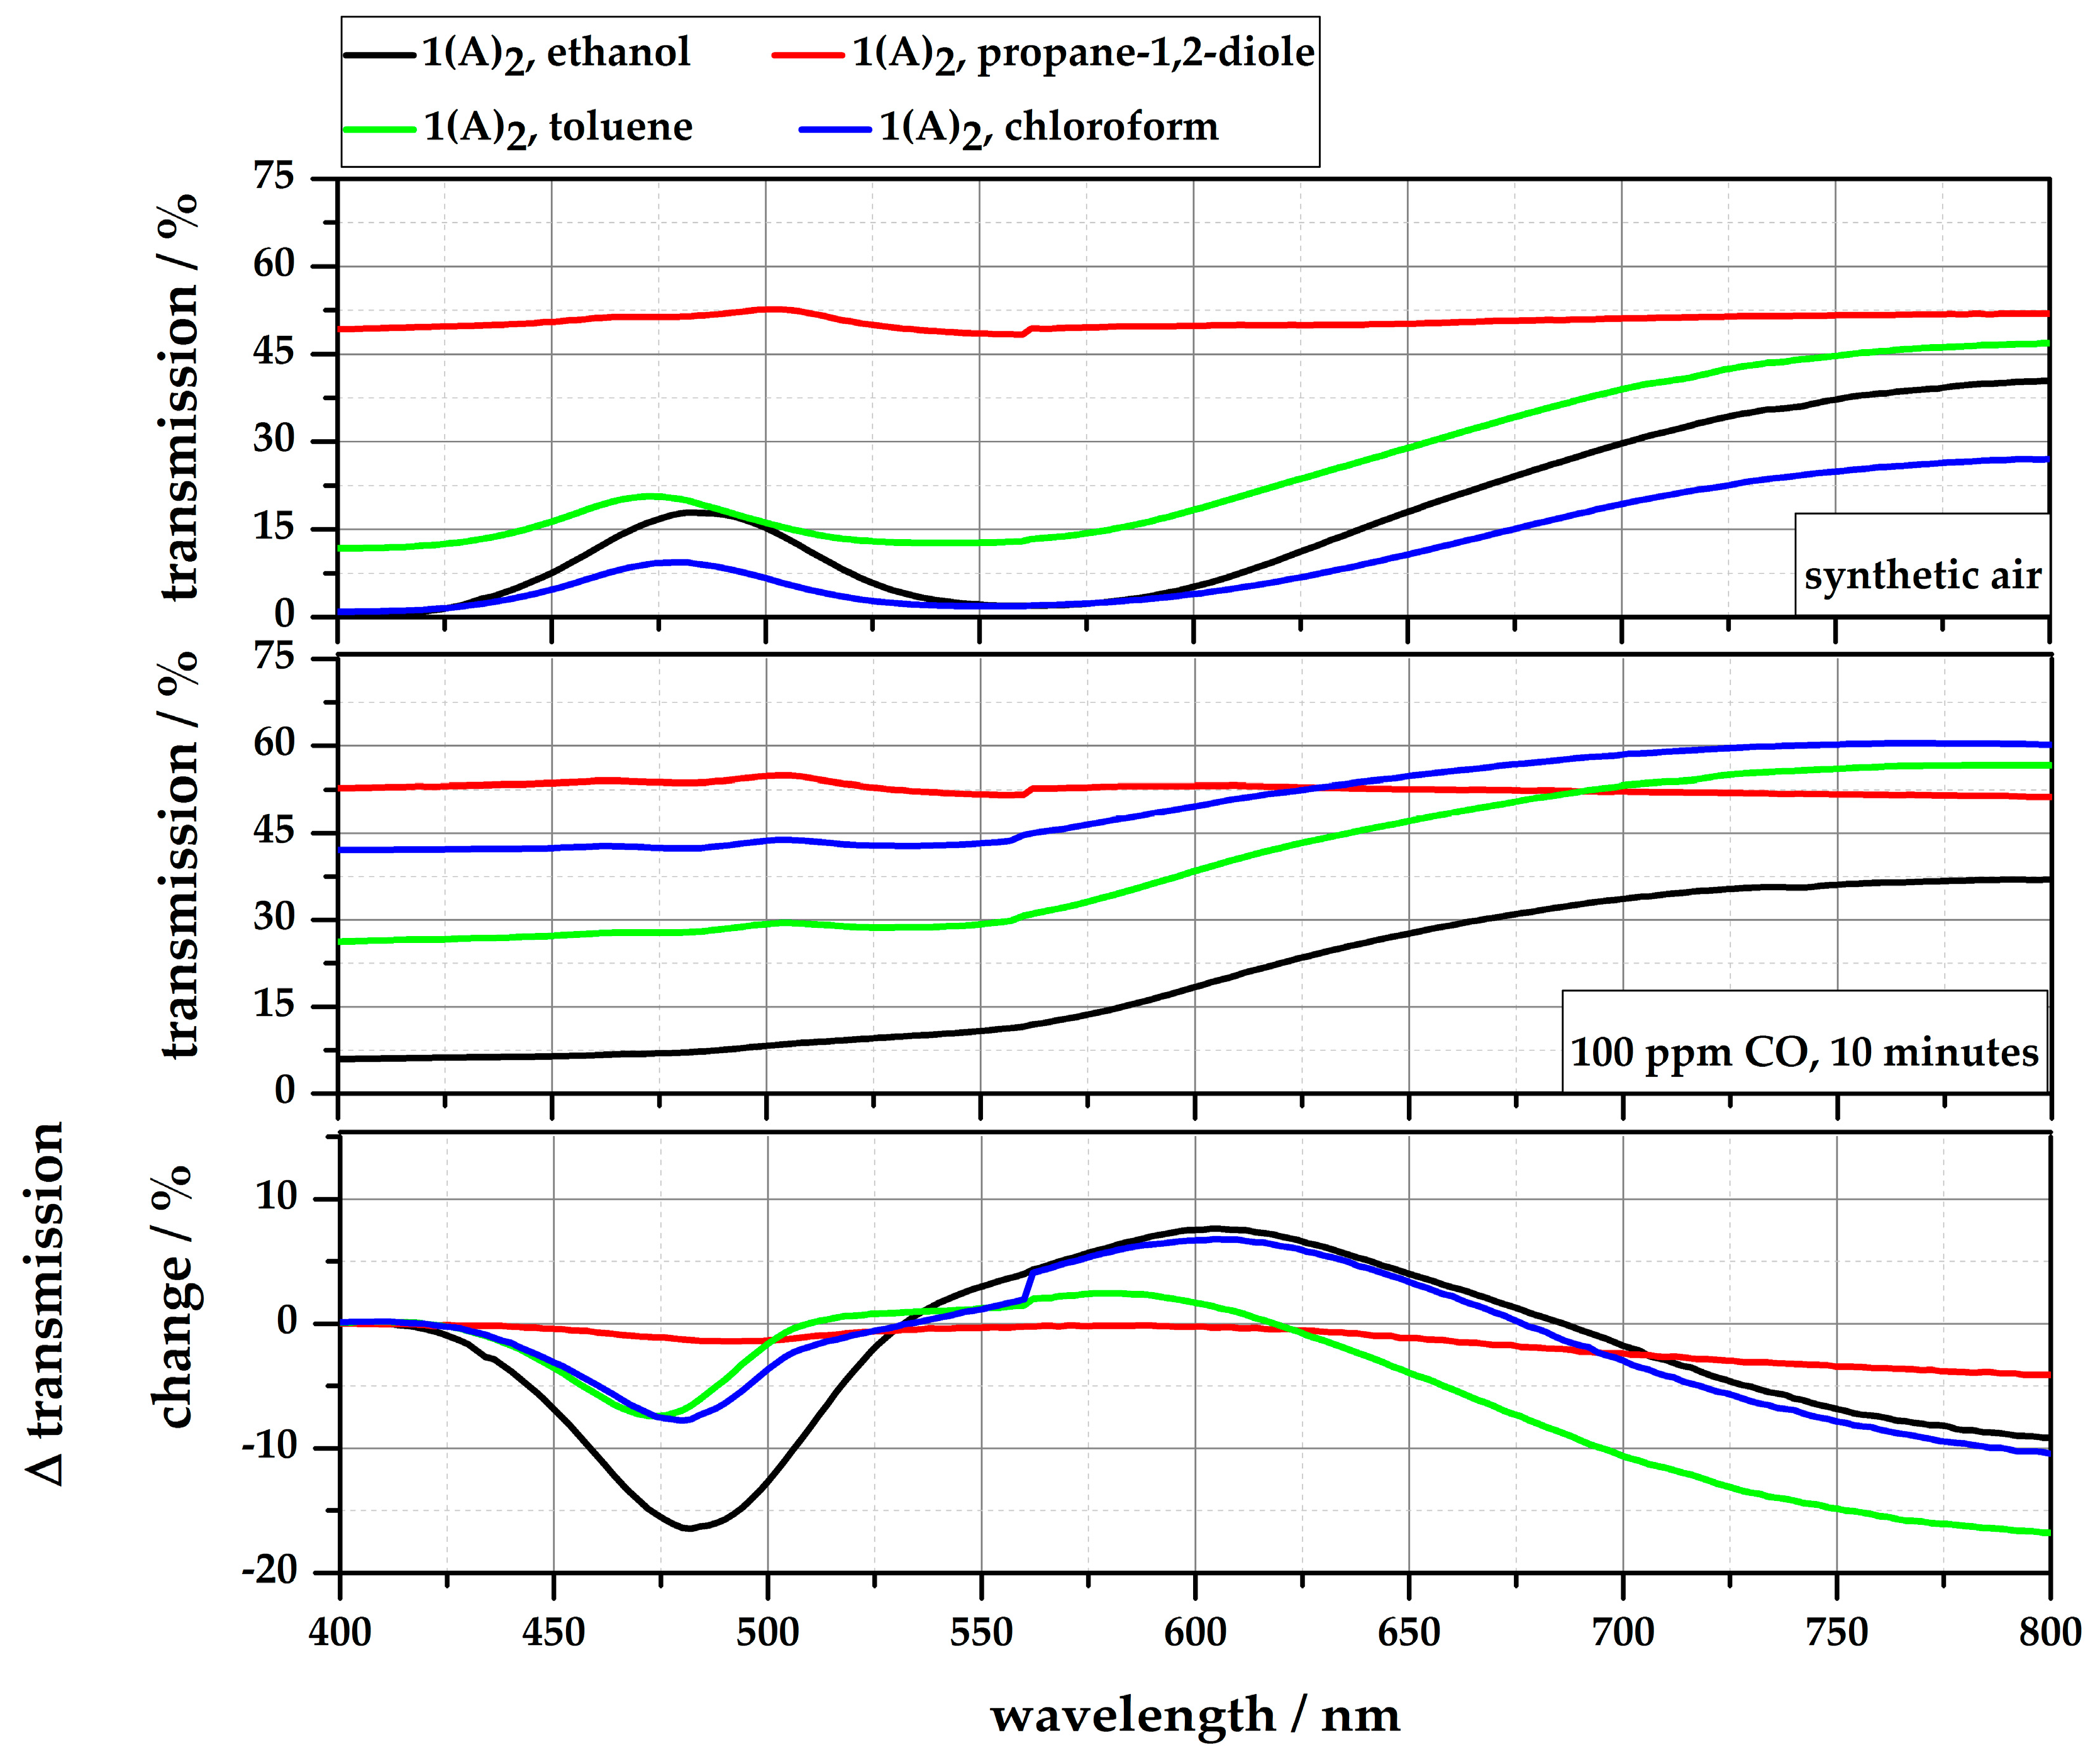
| Solution | Solubility (c = 2.5 g/L) | Color | Sensitivity [ΔT @ 100 ppm CO] | Stability |
|---|---|---|---|---|
| 1∙(A)2 in ethanol | <1 min @RT | clear, violet | 16.5% | <30 days |
| 1∙(A)2 in propane-1,2-diole | 3 h @ 40 °C | clear, blue | 1.4% | <60 days |
| 1∙(A)2 in toluene | <1 min @RT | clear, bright pink/violet | 7.4% | for month |
| 1∙(A)2 in chloroform | <1 min @RT | clear, violet | 7.8% | for month |
| 1∙(A)2 in water | not soluble | |||
© 2018 by the authors. Licensee MDPI, Basel, Switzerland. This article is an open access article distributed under the terms and conditions of the Creative Commons Attribution (CC BY) license (http://creativecommons.org/licenses/by/4.0/).
Share and Cite
Pannek, C.; Tarantik, K.R.; Schmitt, K.; Wöllenstein, J. Investigation of Gasochromic Rhodium Complexes Towards Their Reactivity to CO and Integration into an Optical Gas Sensor for Fire Gas Detection. Sensors 2018, 18, 1994. https://doi.org/10.3390/s18071994
Pannek C, Tarantik KR, Schmitt K, Wöllenstein J. Investigation of Gasochromic Rhodium Complexes Towards Their Reactivity to CO and Integration into an Optical Gas Sensor for Fire Gas Detection. Sensors. 2018; 18(7):1994. https://doi.org/10.3390/s18071994
Chicago/Turabian StylePannek, Carolin, Karina R. Tarantik, Katrin Schmitt, and Jürgen Wöllenstein. 2018. "Investigation of Gasochromic Rhodium Complexes Towards Their Reactivity to CO and Integration into an Optical Gas Sensor for Fire Gas Detection" Sensors 18, no. 7: 1994. https://doi.org/10.3390/s18071994