Classification of Bitter Orange Essential Oils According to Fruit Ripening Stage by Untargeted Chemical Profiling and Machine Learning

 ,
, 
Abstract
:1. Introduction
2. Materials and Methods
2.1. Experimental
2.1.1. Chemicals and Fruit Sampling
2.1.2. Peel Oil Extractions and Sample Preparation
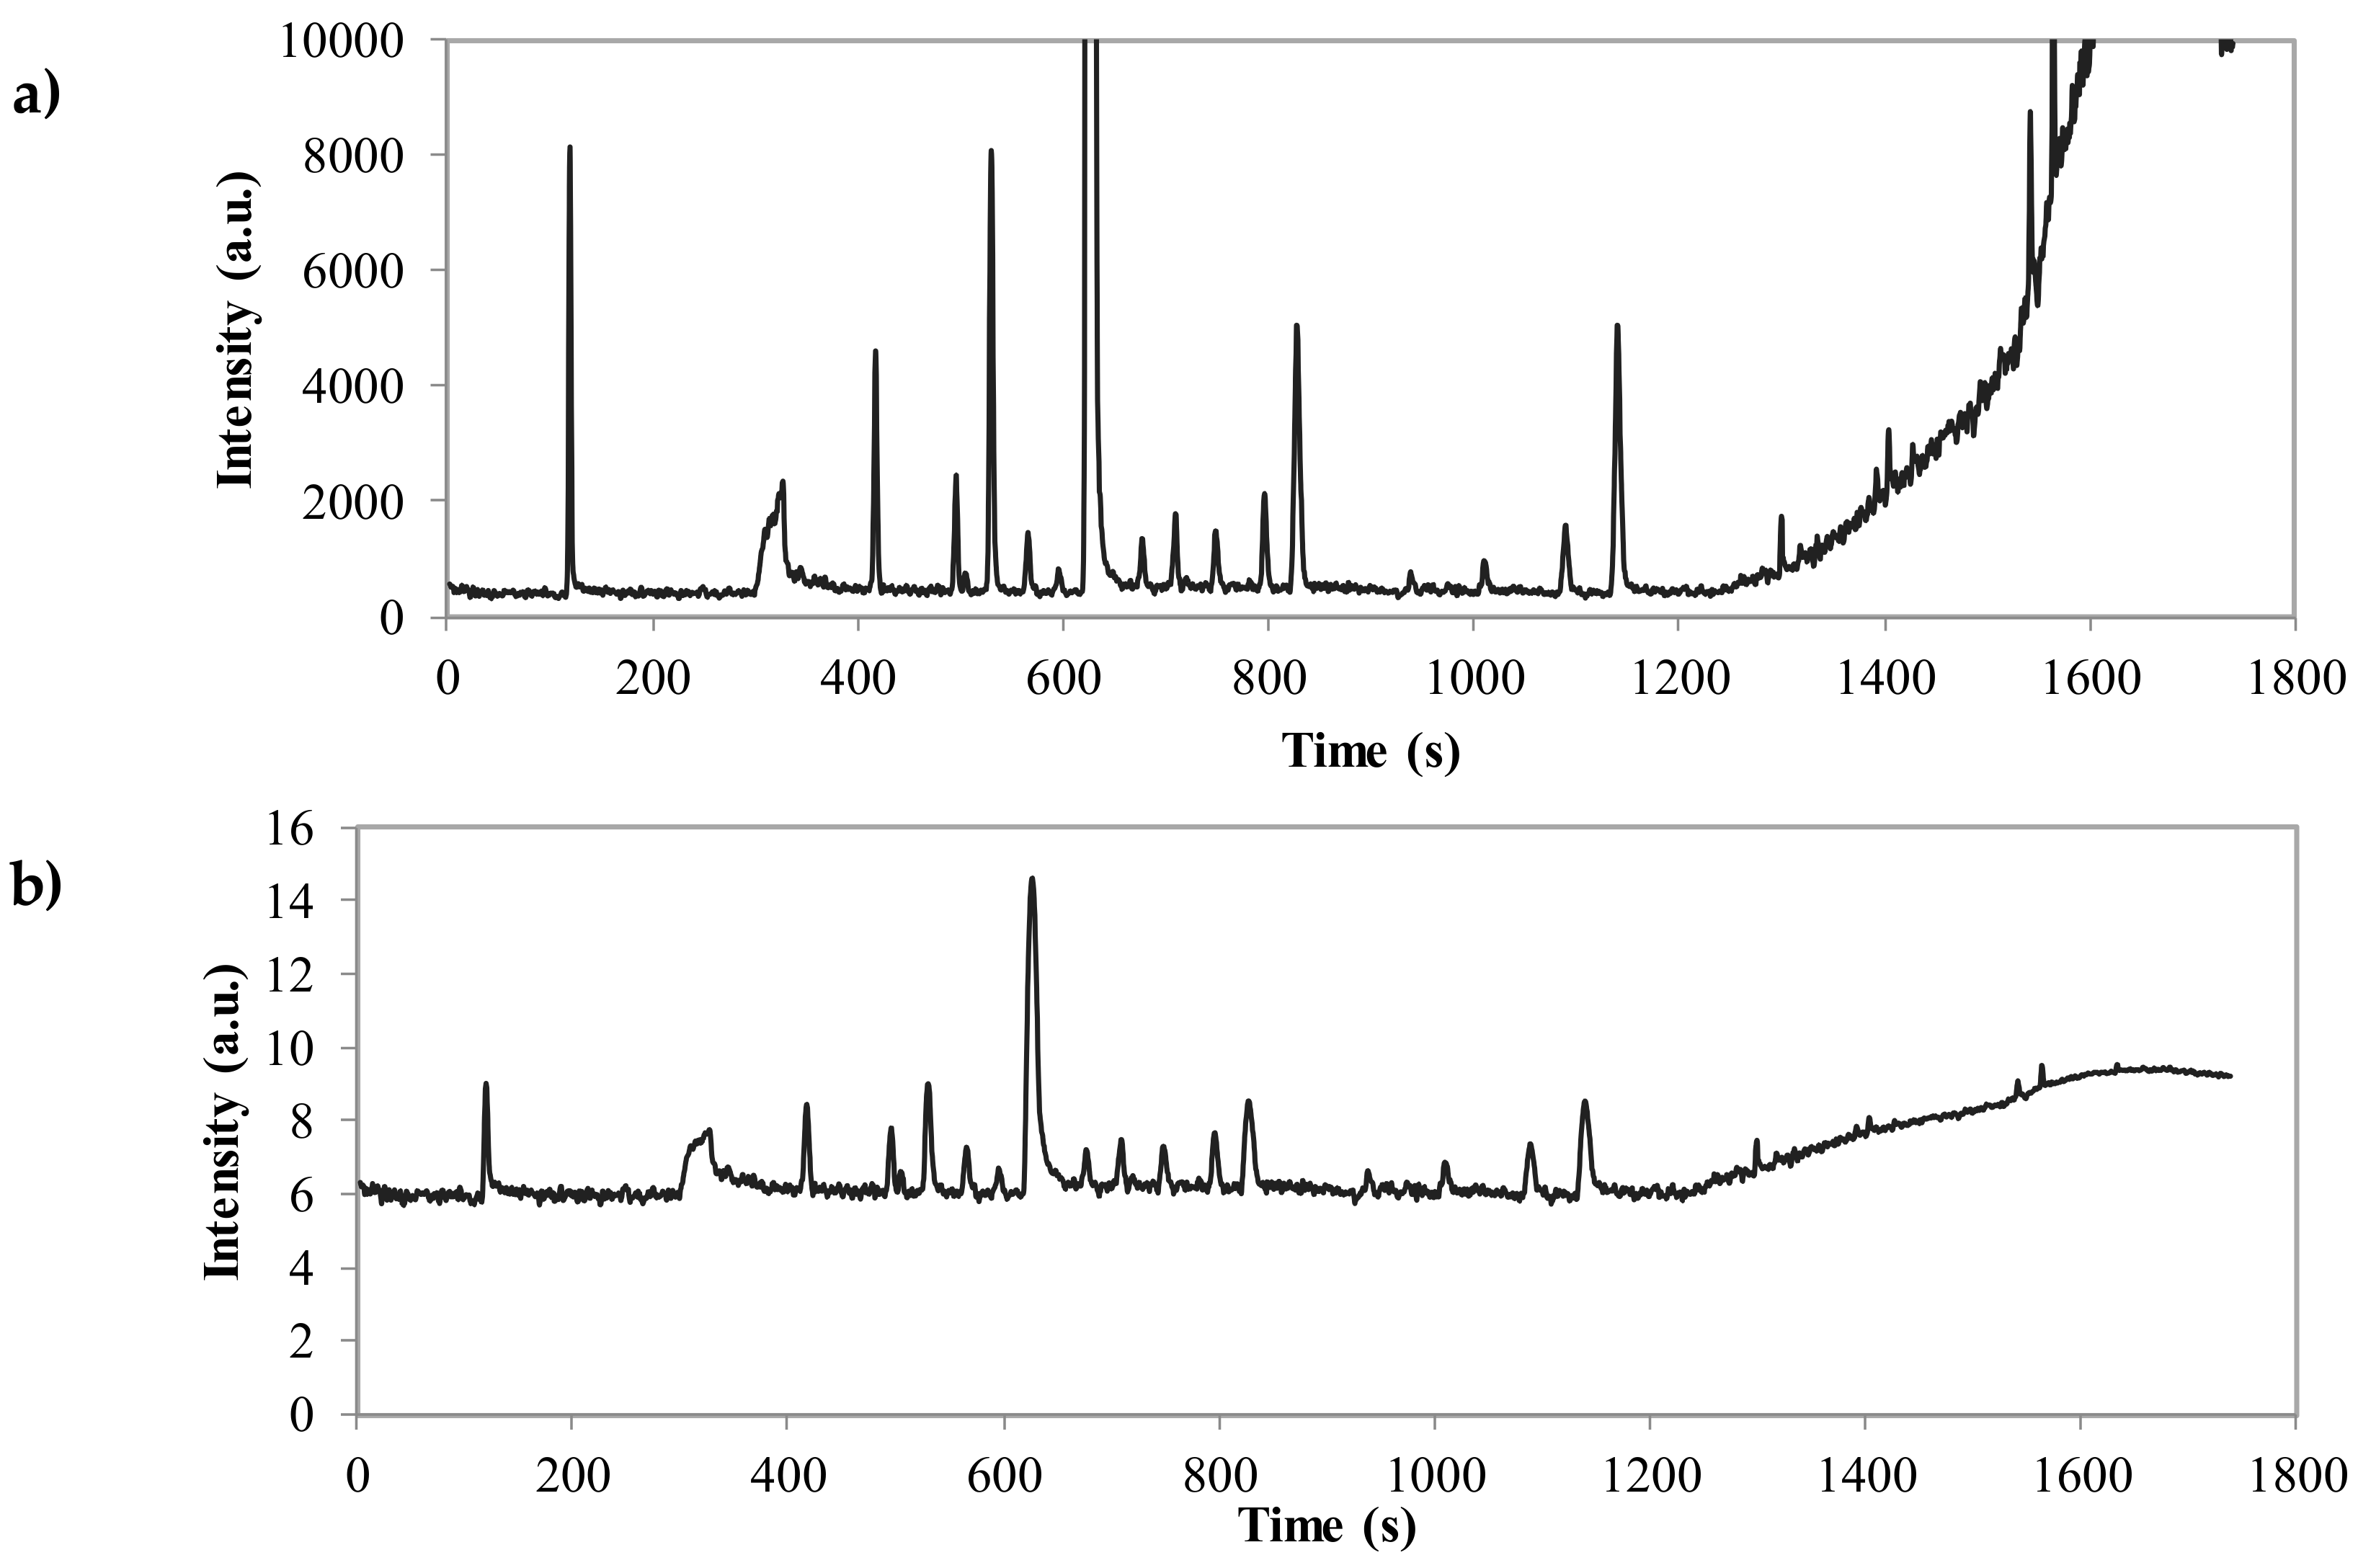
2.1.3. HS-GC-MS Analyses
2.2. Data Analysis
2.2.1. Data Preprocessing
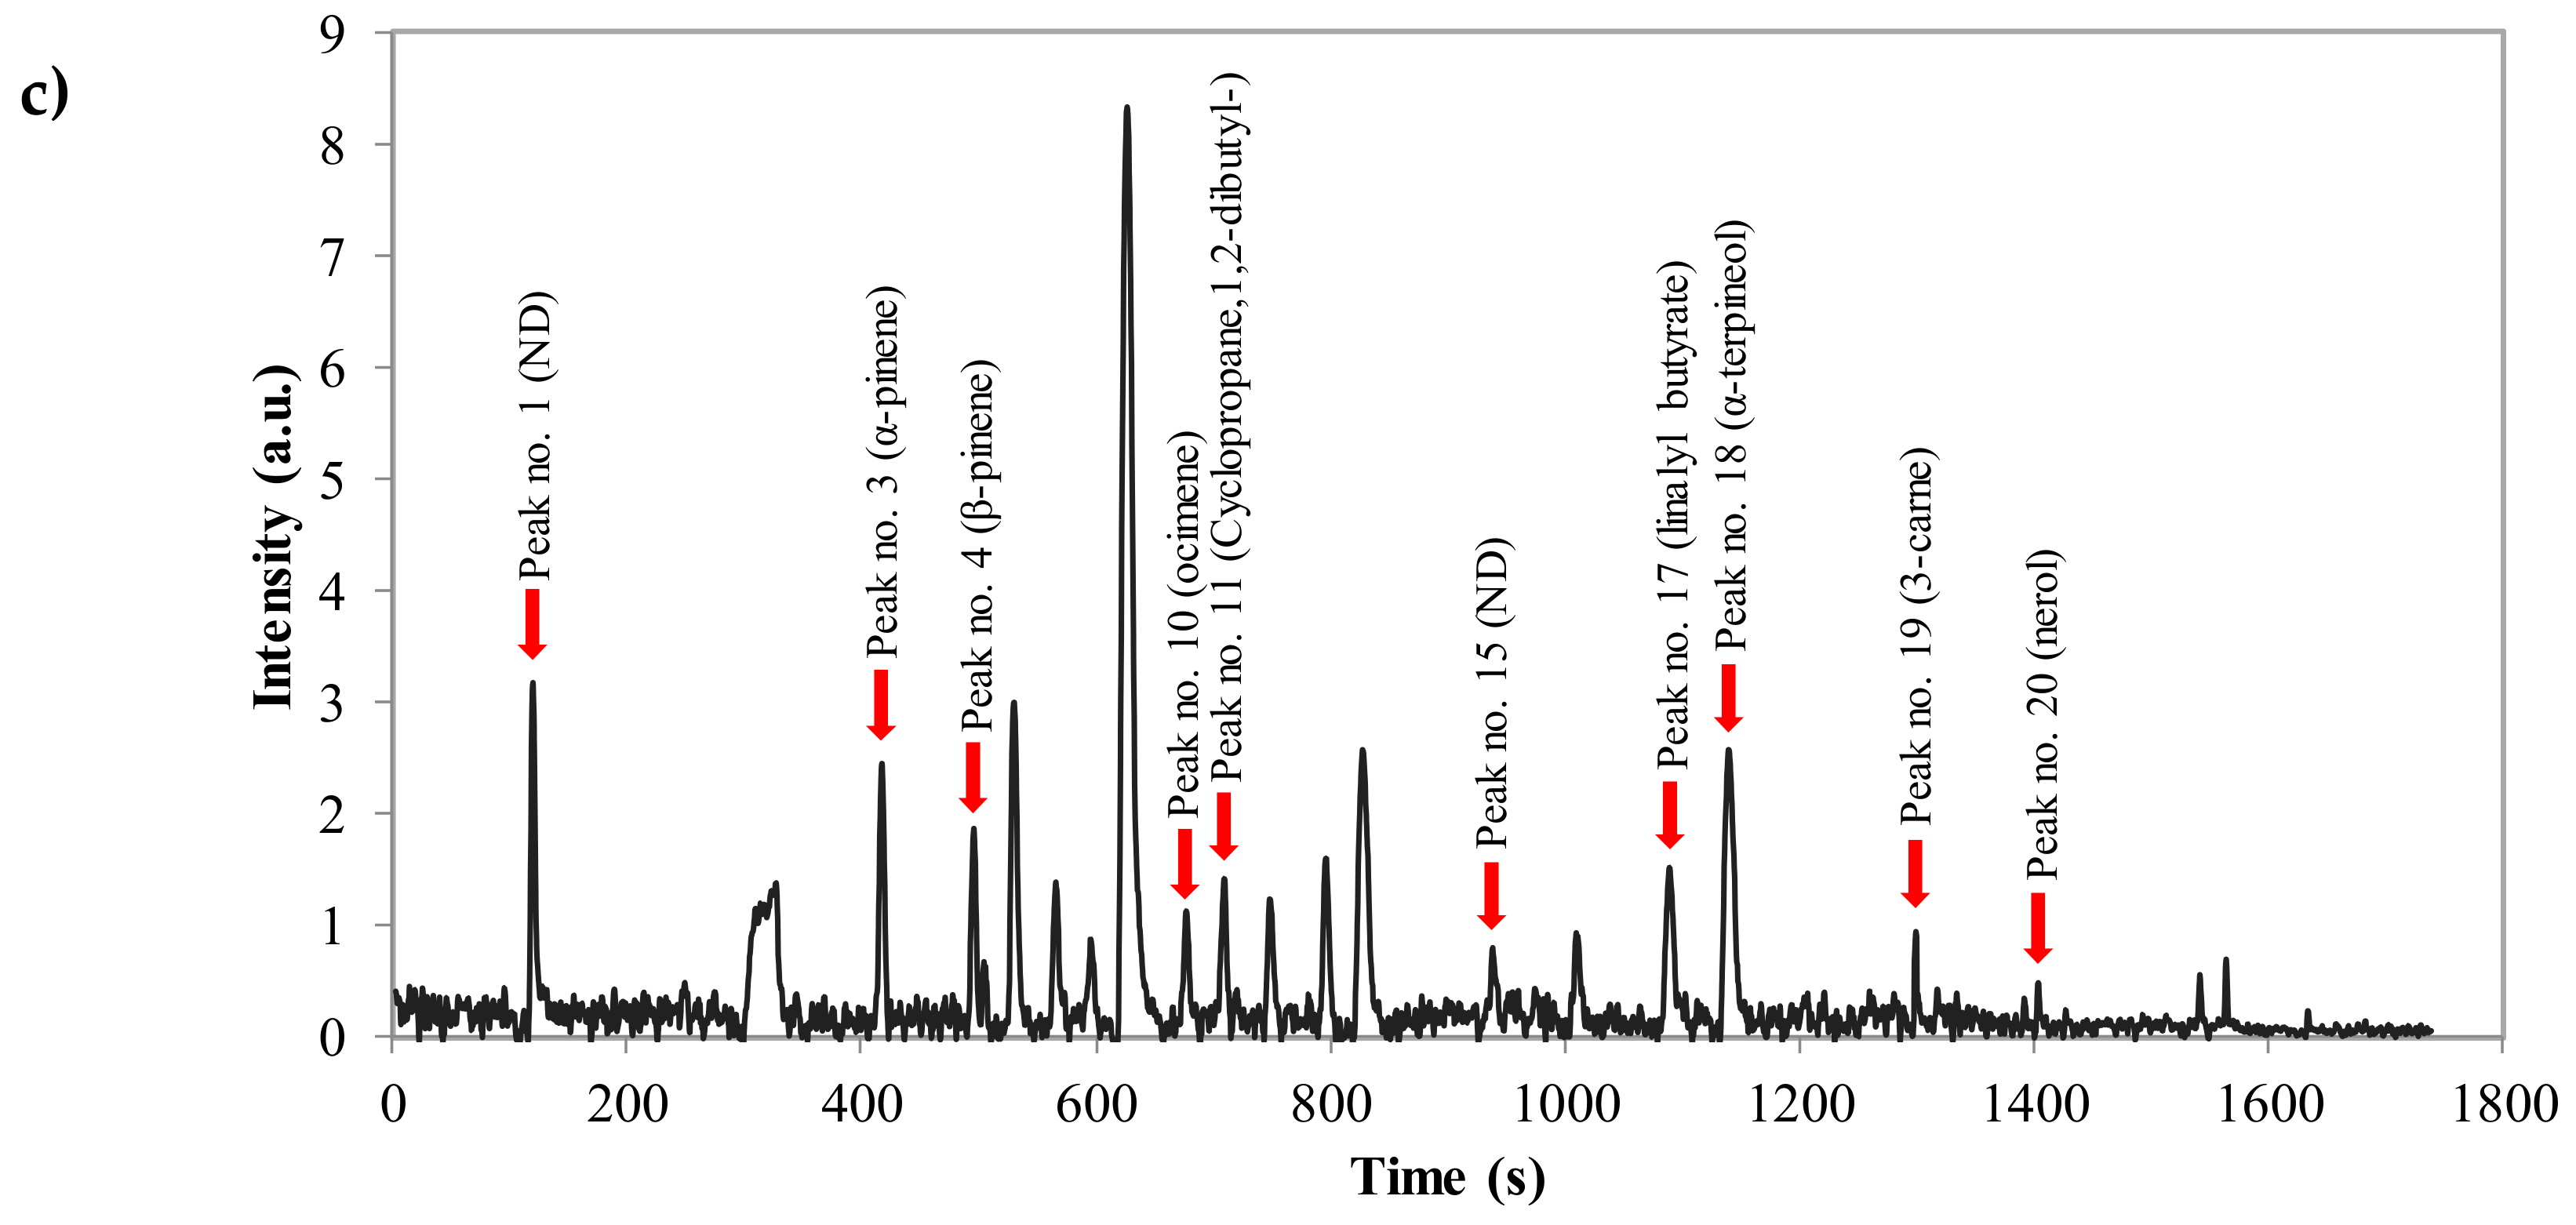
2.2.2. Feature Extraction
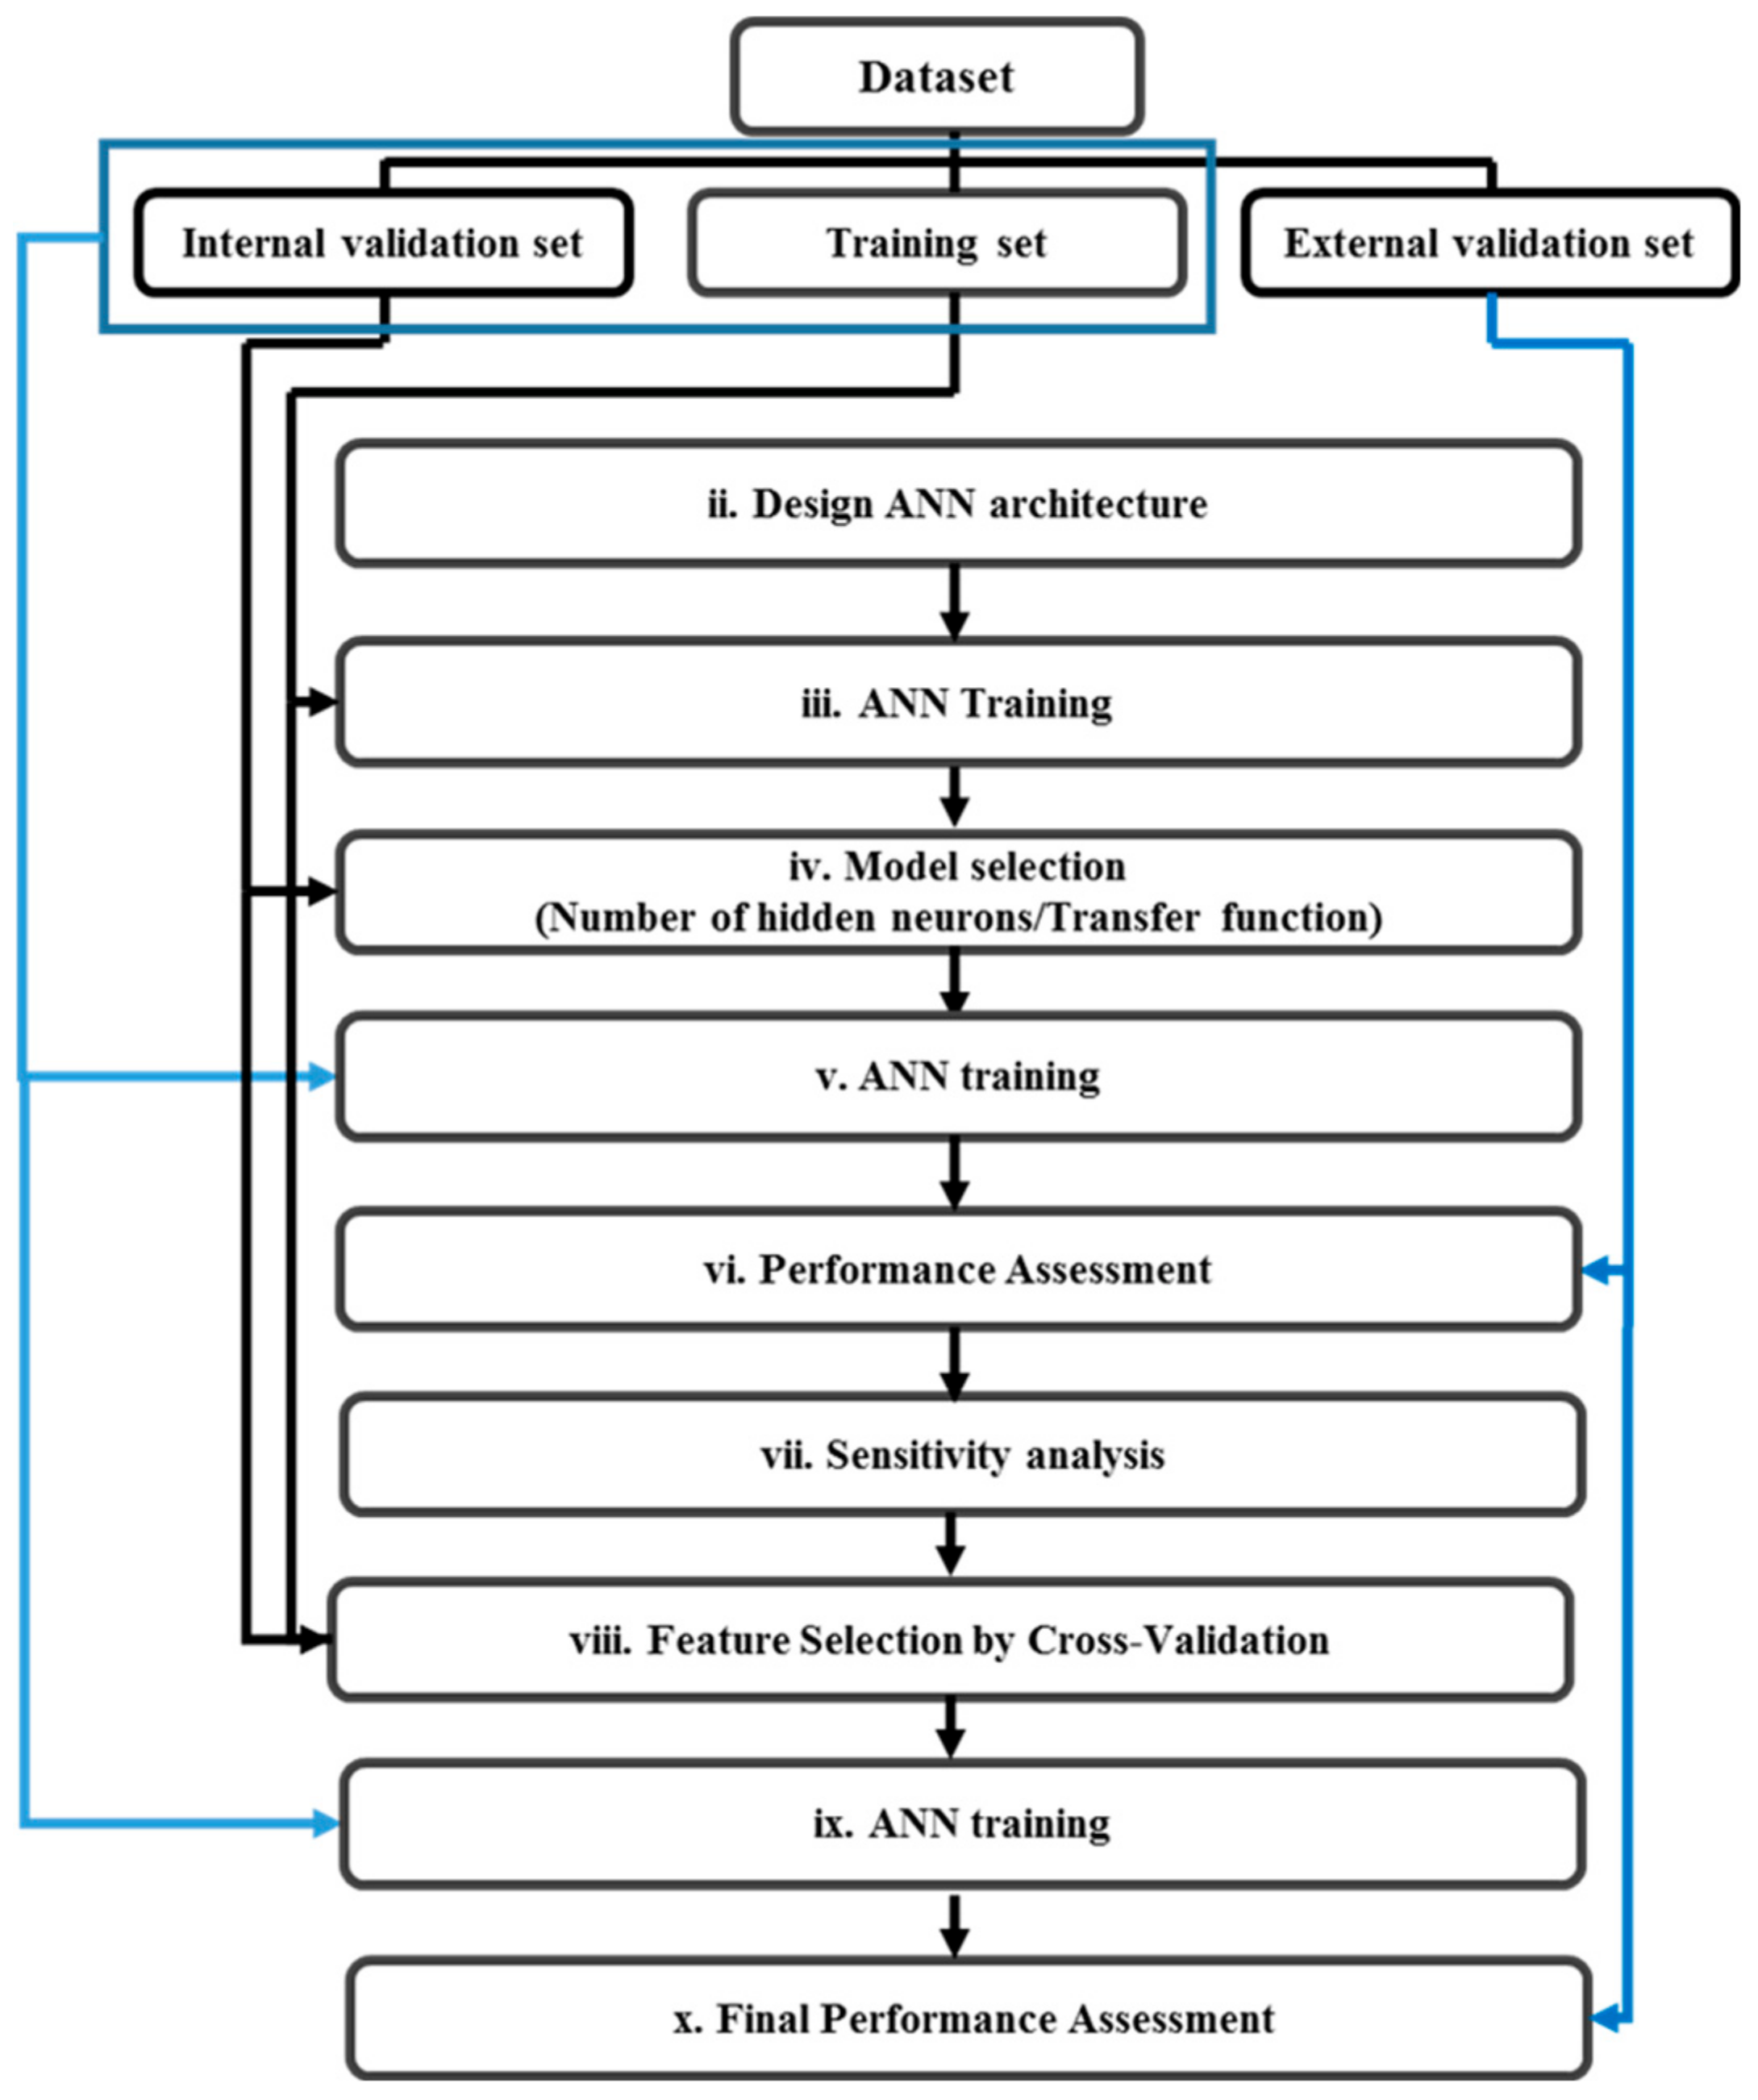
2.2.3. Non-Linear Classifier: Artificial Neural Network (ANN)
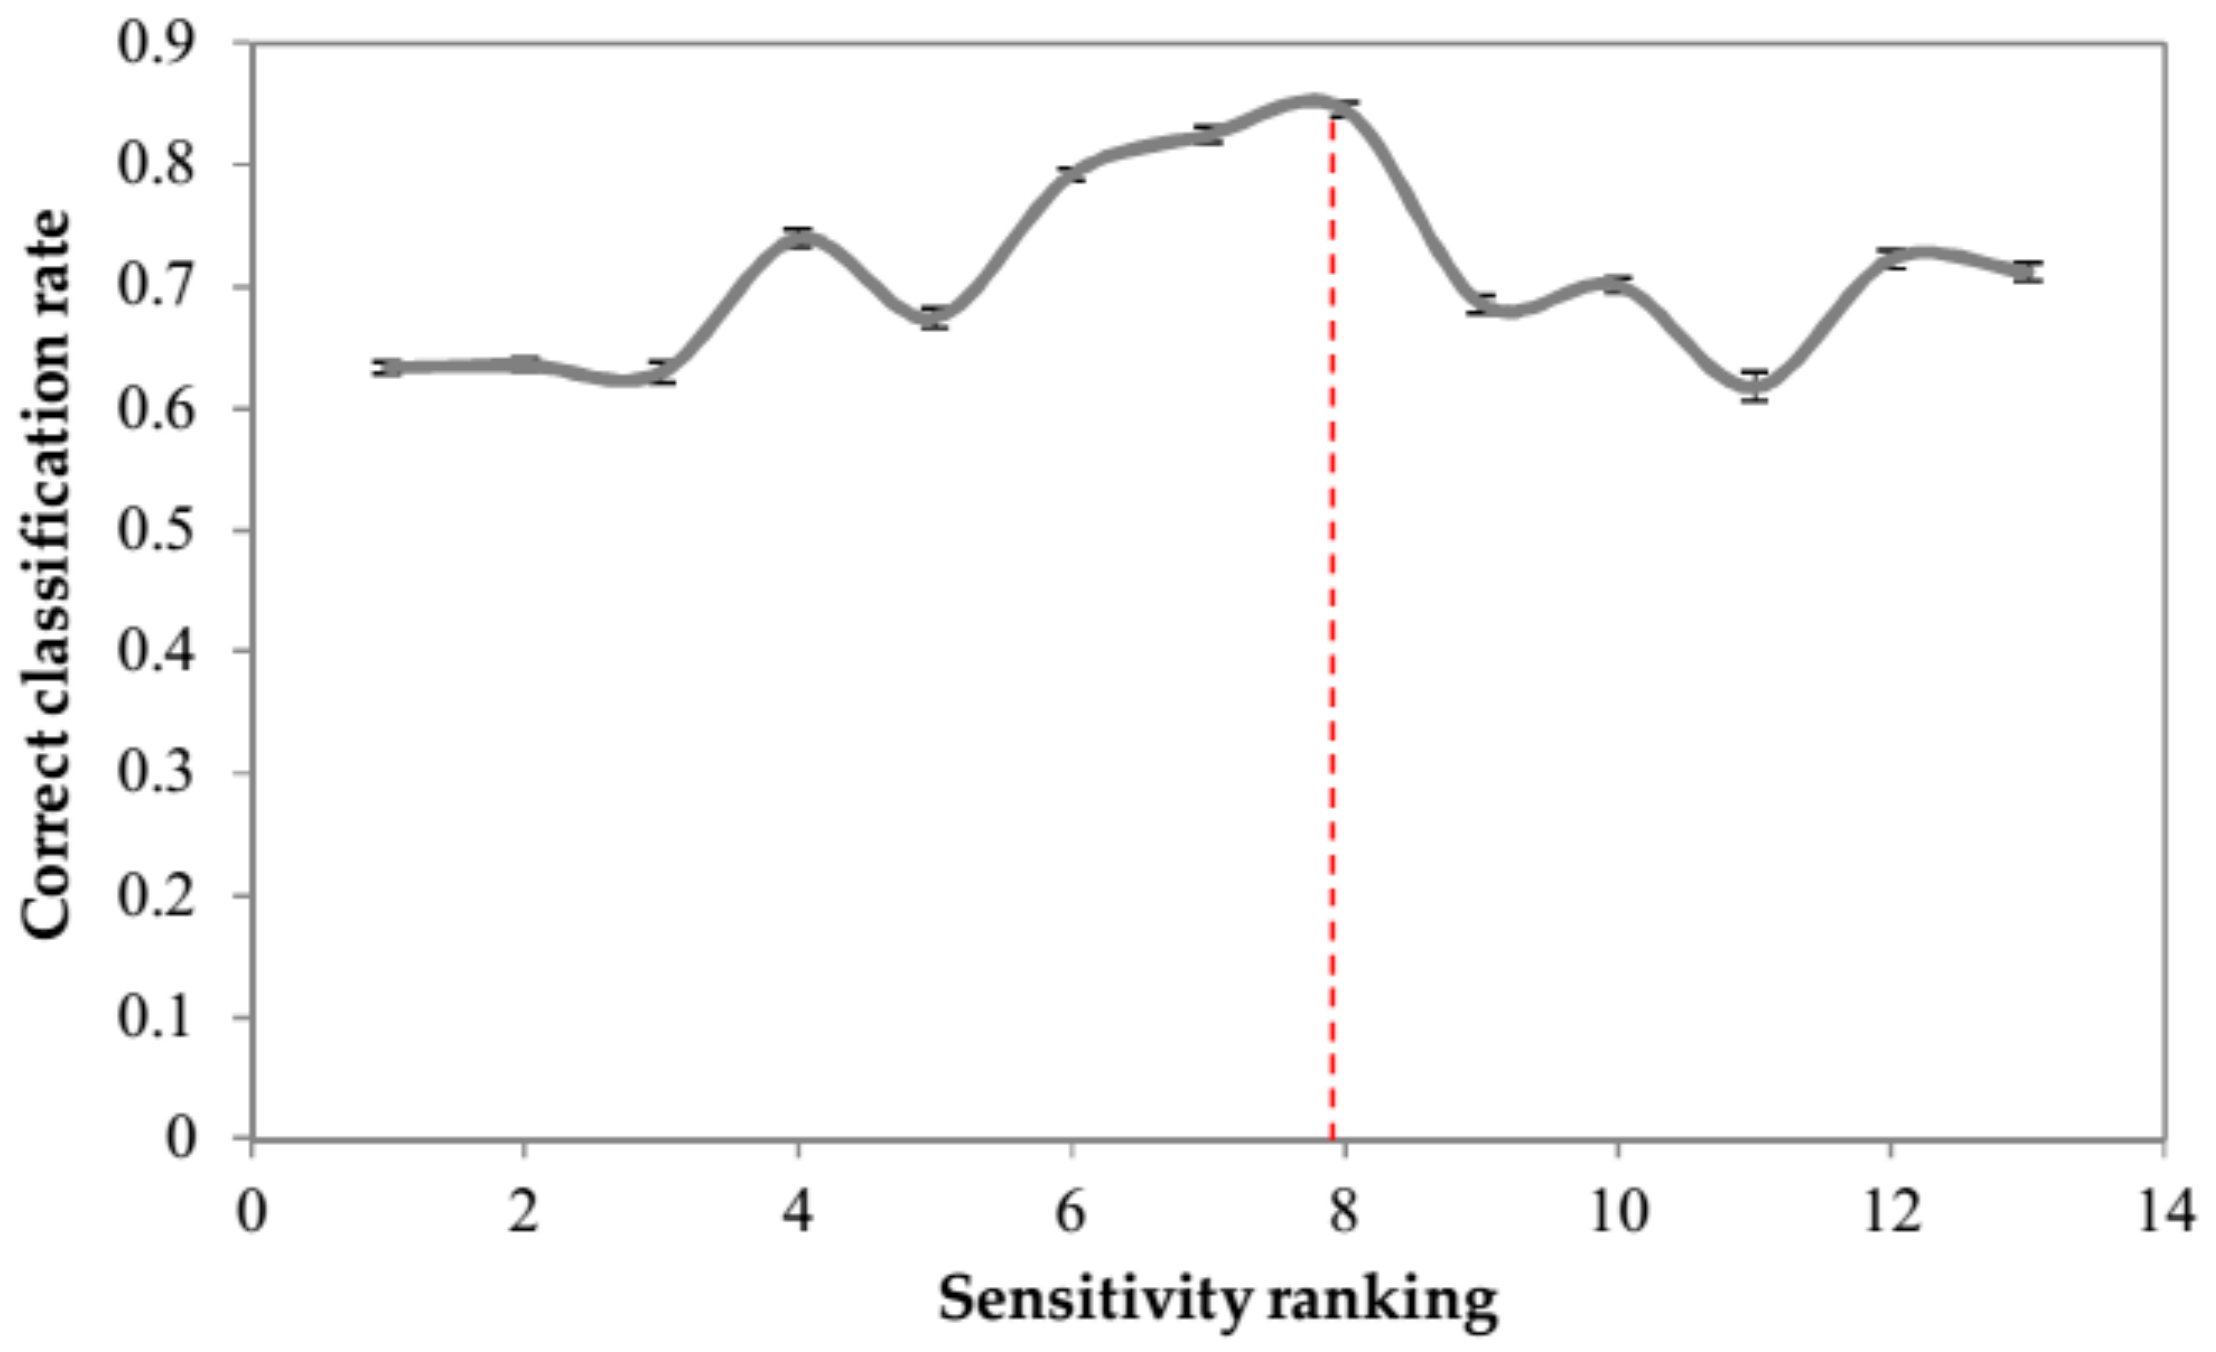
2.2.4. Feature Selection by Sensitivity Analysis
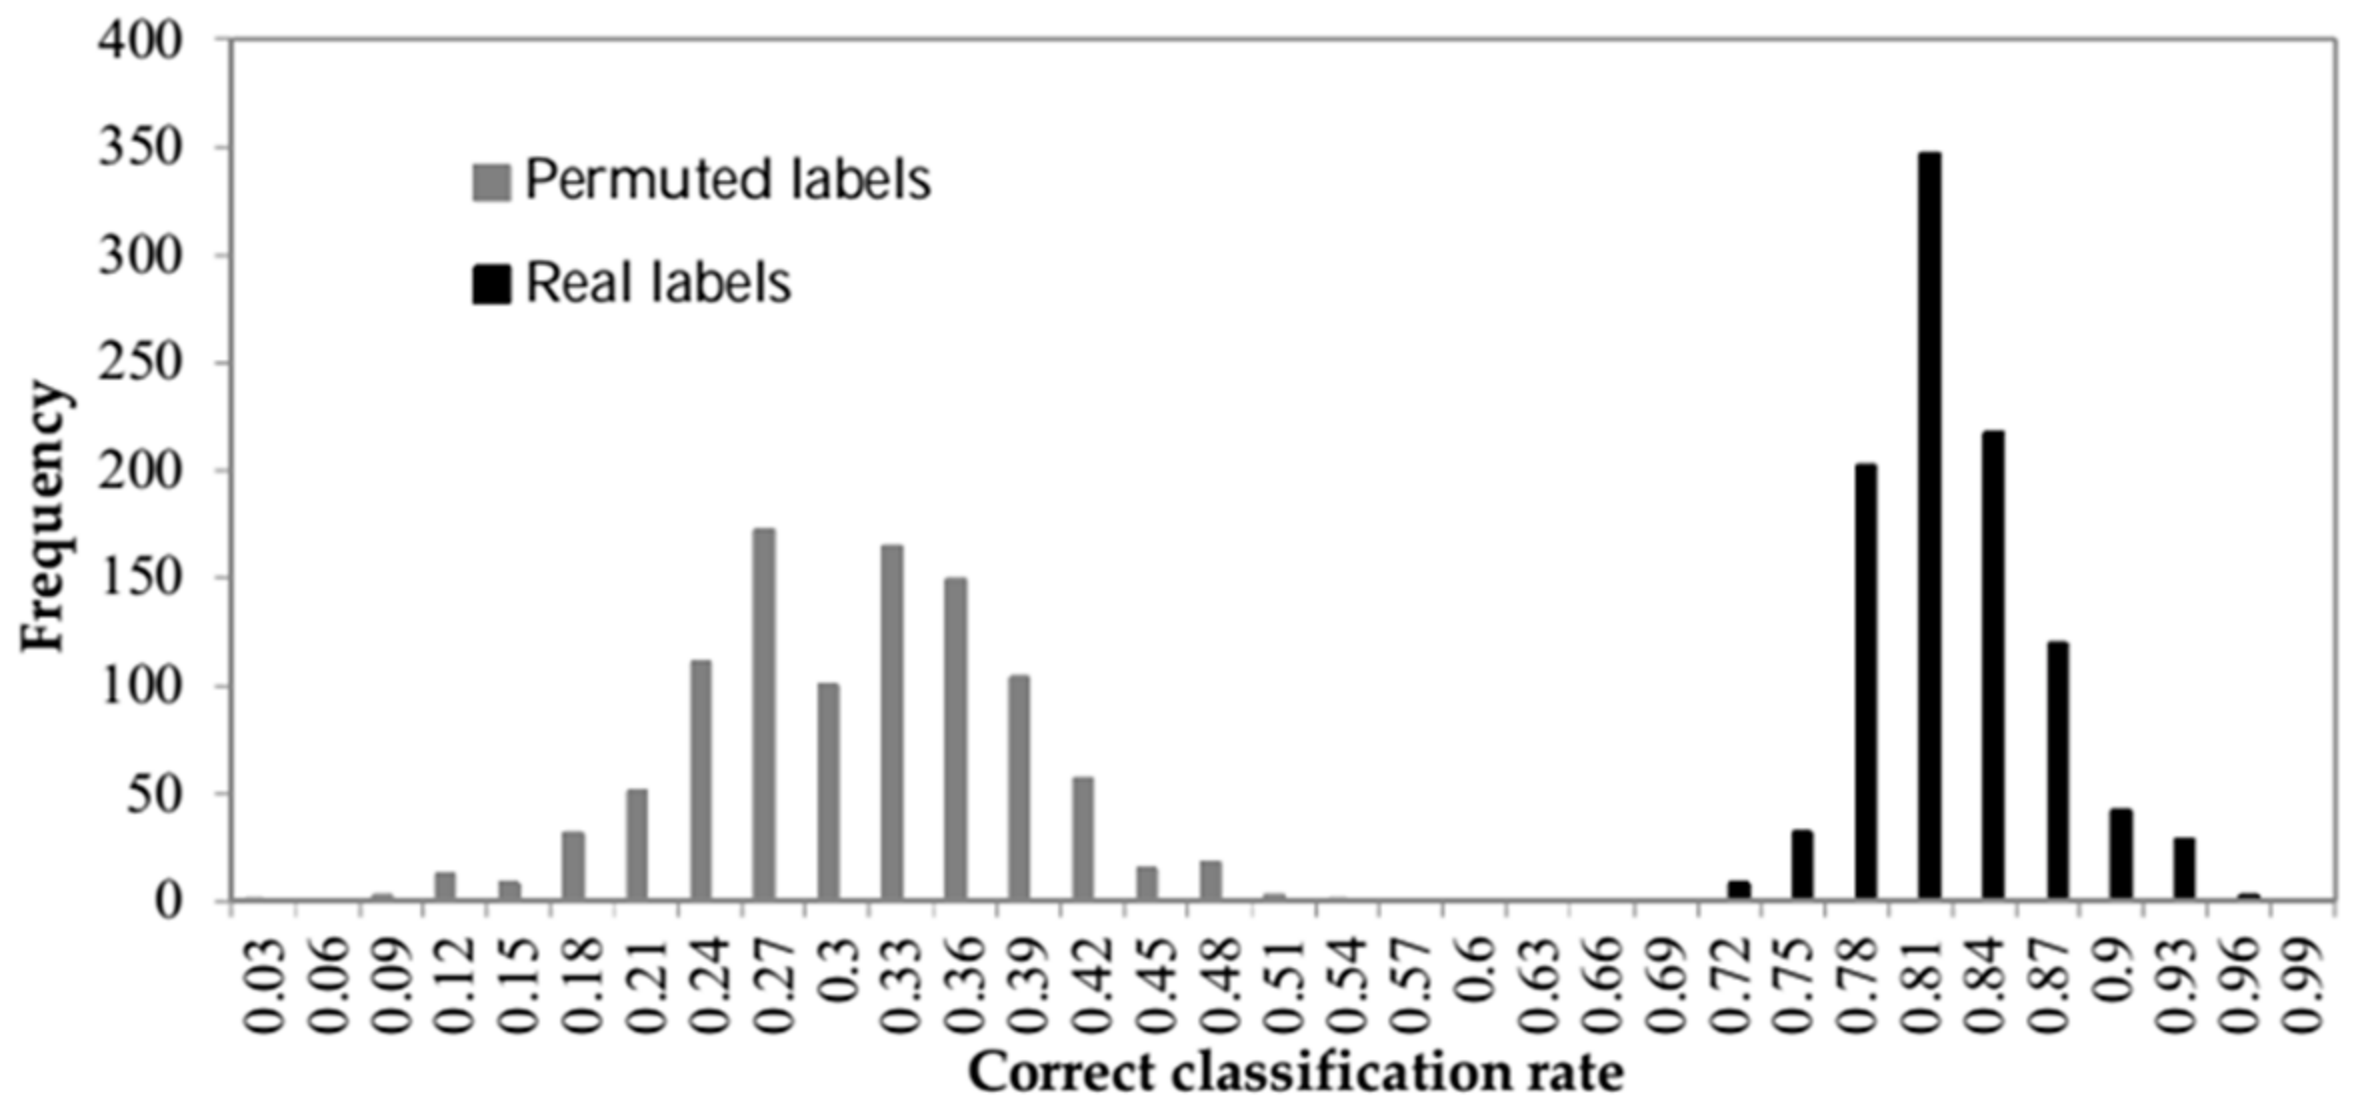
2.2.5. Statistical Significance of the Estimated Accuracy
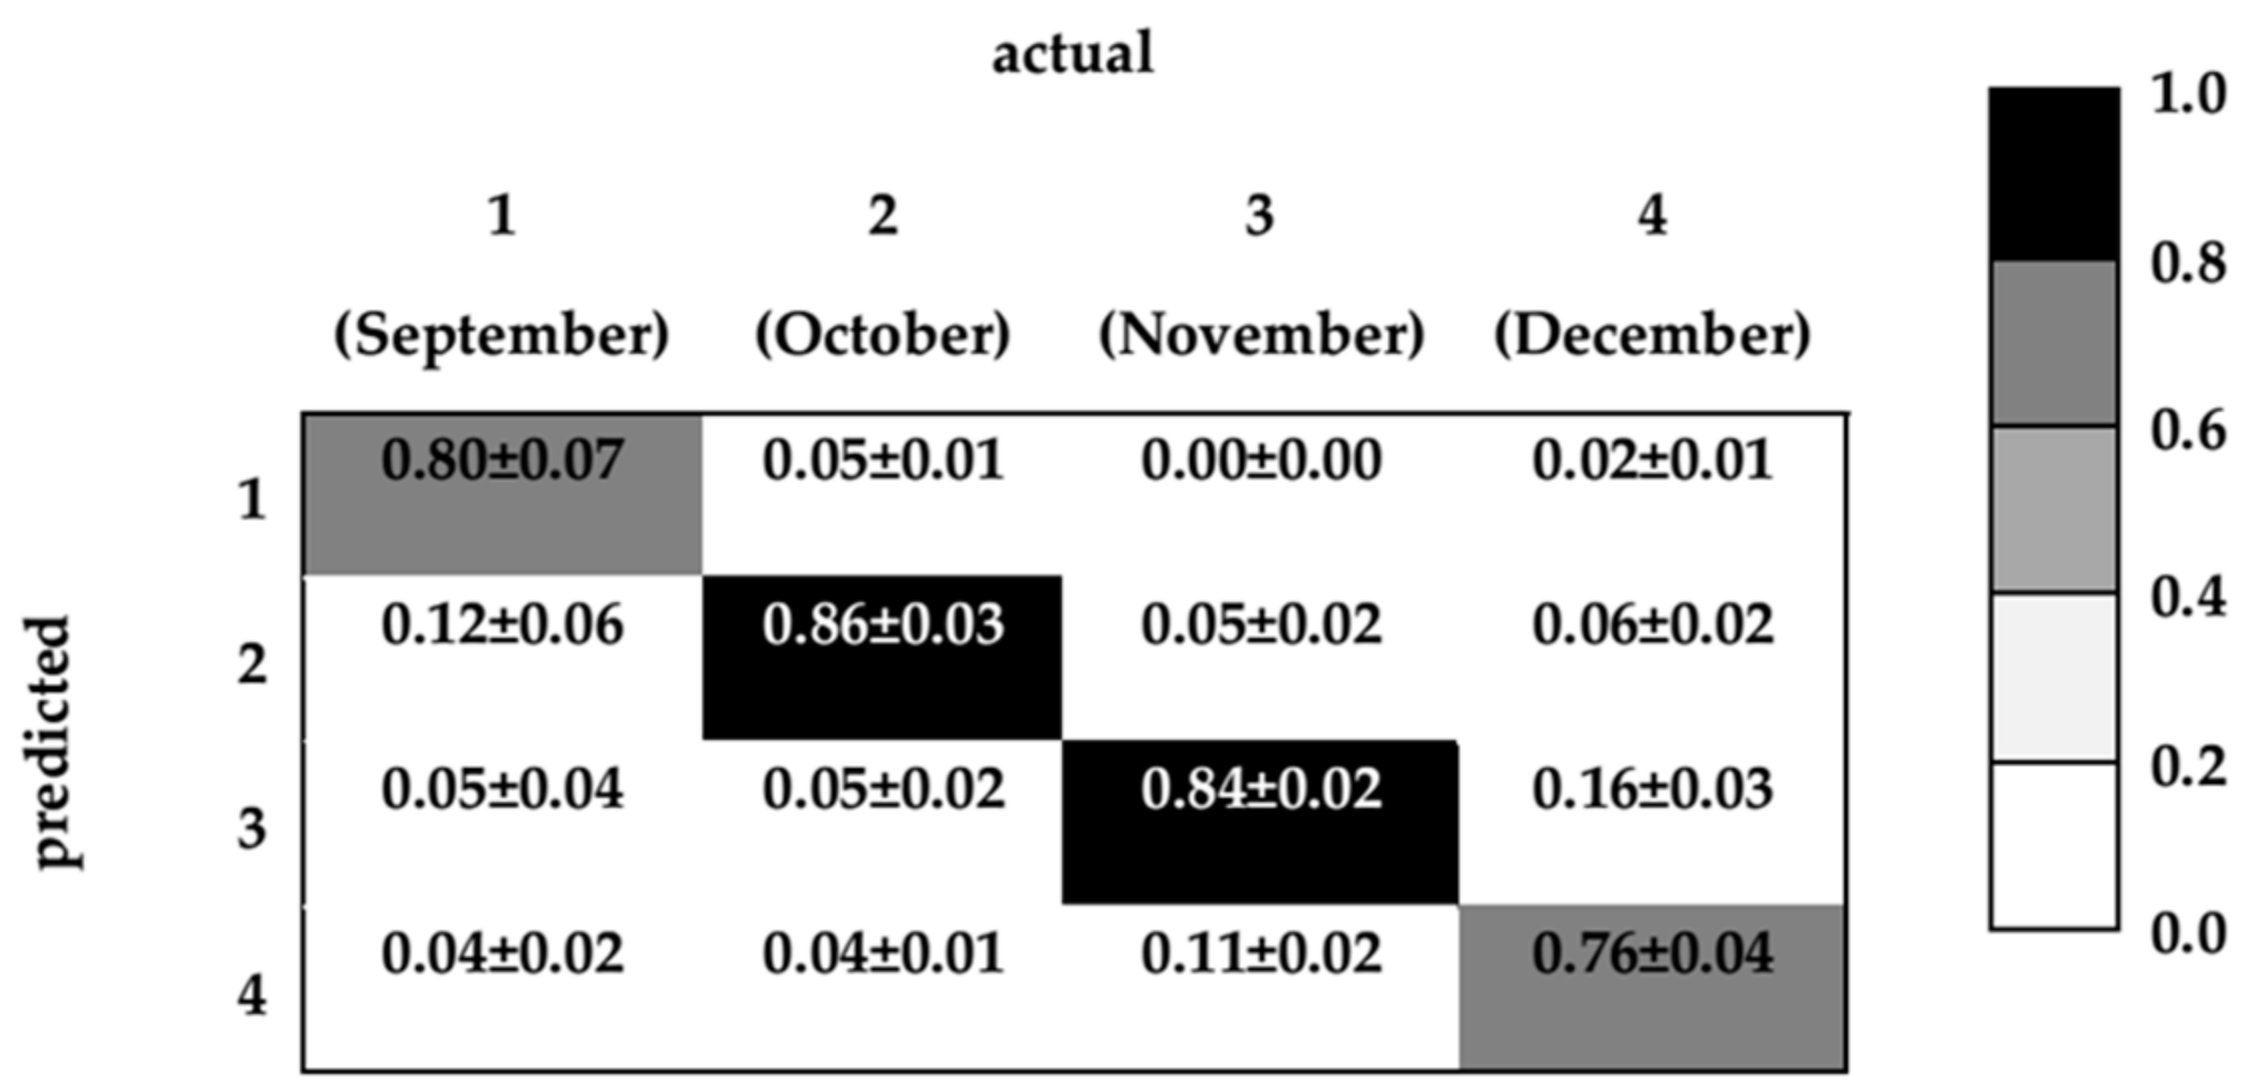
3. Results and Discussion
4. Conclusions
Author Contributions
Funding
Acknowledgments
Conflicts of Interest
References
- Edris, A.E. Pharmaceutical and therapeutic Potentials of essential oils and their individual volatile constituents: a review. Phyther. Res. 2007, 21, 308–323. [Google Scholar] [CrossRef] [PubMed]
- Sarrou, E.; Chatzopoulou, P.; Dimassi-Theriou, K.; Therios, I. Volatile Constituents and Antioxidant Activity of Peel, Flowers and Leaf Oils of Citrus aurantium L. Growing in Greece. Molecules 2013, 18, 10639–10647. [Google Scholar] [CrossRef] [PubMed] [Green Version]
- Ríos, J.-L. Essential Oils. In Essential Oils in Food Preservation, Flavor and Safety; Preedy, V.R., Ed.; Elsevier: London, UK, 2016; ISBN 978-0-12-416641-7. [Google Scholar]
- Sawamura, M. Citrus Essential Oils; Sawamura, M., Ed.; John Wiley & Sons, Inc.: Hoboken, NJ, USA, 2010; ISBN 9780470613160. [Google Scholar]
- Asikin, Y.; Maeda, G.; Tamaki, H.; Mizu, M.; Oku, H.; Wada, K. Cultivation line and fruit ripening discriminations of Shiikuwasha (Citrus depressa Hayata) peel oils using aroma compositional, electronic nose, and antioxidant analyses. Food Res. Int. 2015, 67, 102–110. [Google Scholar] [CrossRef]
- Fisher, K.; Phillips, C. Potential antimicrobial uses of essential oils in food: is citrus the answer? Trends Food Sci. Technol. 2008, 19, 156–164. [Google Scholar] [CrossRef]
- Espina, L.; Somolinos, M.; Lorán, S.; Conchello, P.; García, D.; Pagán, R. Chemical composition of commercial citrus fruit essential oils and evaluation of their antimicrobial activity acting alone or in combined processes. Food Control 2011, 22, 896–902. [Google Scholar] [CrossRef]
- Bourgou, S.; Rahali, F.Z.; Ourghemmi, I.; Saïdani Tounsi, M. Changes of Peel Essential Oil Composition of Four Tunisian Citrus during Fruit Maturation. Sci. World J. 2012, 2012, 1–10. [Google Scholar] [CrossRef] [PubMed]
- Rowshan, V.; Najafian, S. Changes of Peel Essential Oil Composition of Citrus aurantium L. During Fruit Maturation in Iran. J. Essent. Oil Bear. Plants 2015, 18, 1006–1012. [Google Scholar] [CrossRef]
- Veriotti, T.; Sacks, R. High-Speed Characterization and Analysis of Orange Oils with Tandem-Column Stop-Flow GC and Time-of-Flight MS. Anal. Chem. 2002, 74, 5635–5640. [Google Scholar] [CrossRef] [PubMed]
- Marsili, R. Sensory-Directed Flavor Analysis; CRC/Taylor & Francis: Boca Raton, FL, USA, 2007. [Google Scholar]
- Smyth, H.; Cozzolino, D. Instrumental Methods (Spectroscopy, Electronic Nose, and Tongue) as Tools to Predict Taste and Aroma in Beverages: Advantages and Limitations. Chem. Rev. 2013, 113, 1429–1440. [Google Scholar] [CrossRef] [PubMed]
- Meilgaard, M.; Vance Civille, G.; Thomas Carr, B. Sensory Evaluation Techniques, Fourth Edition; CRC Press: Boca Raton, FL, USA, 1999. [Google Scholar]
- Marriott, P.J.; Shellie, R.; Cornwell, C. Gas chromatographic technologies for the analysis of essential oils. J. Chromatogr. A 2001, 936, 1–22. [Google Scholar] [CrossRef]
- Mondello, L.; Dugo, P.; Bartle, K.D.; Dugo, G.; Cotroneo, A. Automated HPLC-HRGC: A powerful method for essential oils analysis. Part V. identification of terpene hydrocarbons of bergamot, lemon, mandarin, sweet orange, bitter orange, grapefruit, clementine and mexican lime oils by coupled HPLC-HRGC-MS(ITD). Flavour Fragr. J. 1995, 10, 33–42. [Google Scholar] [CrossRef]
- Lota, M.-L.; de Rocca Serra, D.; Jacquemond, C.; Tomi, F.; Casanova, J. Chemical variability of peel and leaf essential oils of sour orange. Flavour Fragr. J. 2001, 16, 89–96. [Google Scholar] [CrossRef]
- Chadwick, D.J.; Marsh, J. Bioactive Compounds from Plant; Wiley: Chichester, UK, 1993; Volume 525, p. 121. [Google Scholar]
- Deterre, S.; Rega, B.; Delarue, J.; Decloux, M.; Lebrun, M.; Giampaoli, P. Identification of key aroma compounds from bitter orange (Citrus aurantium L.) products: essential oil and macerate–distillate extract. Flavour Fragr. J. 2012, 27, 77–88. [Google Scholar] [CrossRef]
- Dugo, G.; Bonaccorsi, I.; Sciarrone, D.; Costa, R.; Dugo, P.; Mondello, L.; Santi, L.; Fakhry, A.H. Characterization of Oils from the Fruits, Leaves and Flowers of the Bitter Orange Tree. J. Essent. Oil Res. 2011, 23, 45–59. [Google Scholar] [CrossRef]
- Kirbaslar, F.G.; Kirbaslar, S.I. Composition of cold-pressed bitter orange peel oil from Turkey. J. Essent. Oil Res. 2003, 15, 6–9. [Google Scholar] [CrossRef]
- Boussaada, O.; Chemli, R. Seasonal Variation of Essential Oil Composition of Citrus Aurantium L. var. amara. J. Essent. Oil Bear. Plants 2007, 10, 109–120. [Google Scholar] [CrossRef]
- Boelens, M.H.; Jimenez, R. The chemical composition of the peel oils from unripe and ripe fruits of bitter orange, Citrus aurantium L. ssp.amara engl. Flavour Fragr. J. 1989, 4, 139–142. [Google Scholar] [CrossRef]
- Dawidowicz, A.L.; Szewczyk, J.; Dybowski, M.P. Modified application of HS-SPME for quality evaluation of essential oil plant materials. Talanta 2016, 146, 195–202. [Google Scholar] [CrossRef] [PubMed]
- Cuadros-Rodríguez, L.; Ruiz-Samblás, C.; Valverde-Som, L.; Pérez-Castaño, E.; González-Casado, A. Chromatographic fingerprinting: An innovative approach for food “identitation” and food authentication—A tutorial. Anal. Chim. Acta 2016, 909, 9–23. [Google Scholar] [CrossRef] [PubMed]
- Cappellin, L.; Costa, F.; Aprea, E.; Betta, E.; Gasperi, F.; Biasioli, F. Double clustering of PTR-ToF-MS data enables the mapping of QTLs related to apple fruit volatilome. Sci. Hortic. 2015, 197, 24–32. [Google Scholar] [CrossRef]
- Bergamaschi, M.; Cecchinato, A.; Biasioli, F.; Gasperi, F.; Martin, B.; Bittante, G. From cow to cheese: genetic parameters of the flavour fingerprint of cheese investigated by direct-injection mass spectrometry (PTR-ToF-MS). Genet. Sel. Evol. 2016, 48, 89–102. [Google Scholar] [CrossRef] [PubMed]
- Garrido-Delgado, R.; Arce, L.; Guamán, A.V.; Pardo, A.; Marco, S.; Valcárcel, M. Direct coupling of a gas-liquid separator to an ion mobility spectrometer for the classification of different white wines using chemometrics tools. Talanta 2011, 84, 471–479. [Google Scholar] [CrossRef] [PubMed]
- Arroyo-Manzanares, N.; Martín-Gómez, A.; Jurado-Campos, N.; Garrido-Delgado, R.; Arce, C.; Arce, L. Target vs spectral fingerprint data analysis of Iberian ham samples for avoiding labelling fraud using headspace–gas chromatography–ion mobility spectrometry. Food Chem. 2018, 246, 65–73. [Google Scholar] [CrossRef] [PubMed]
- Fernandez, L.; Martin-Gomez, A.; Mar Contreras, M.; Padilla, M.; Marco, S.; Arce, L. Ham quality evaluation assisted by gas chromatography ion mobility spectrometry. In Proceedings of the ISOEN 2017—ISOCS/IEEE International Symposium on Olfaction and Electronic Nose, Montreal, QC, Canada, 28–31 May 2017. [Google Scholar]
- Freitas, J.V.B.; Alves Filho, E.G.; Silva, L.M.A.; Zocolo, G.J.; de Brito, E.S.; Gramosa, N.V. Chemometric analysis of NMR and GC datasets for chemotype characterization of essential oils from different species of Ocimum. Talanta 2018, 180, 329–336. [Google Scholar] [CrossRef] [PubMed]
- Cubero-Leon, E.; Peñalver, R.; Maquet, A. Review on metabolomics for food authentication. Food Res. Int. 2014, 60, 95–107. [Google Scholar] [CrossRef]
- Parastar, H.; Jalali-Heravi, M.; Sereshti, H.; Mani-Varnosfaderani, A. Chromatographic fingerprint analysis of secondary metabolites in citrus fruits peels using gas chromatography-mass spectrometry combined with advanced chemometric methods. J. Chromatogr. A 2012, 1251, 176–187. [Google Scholar] [CrossRef] [PubMed]
- Russo, M.; Serra, D.; Suraci, F.; Postorino, S. Effectiveness of electronic nose systems to detect bergamot (Citrus bergamia Risso et Poiteau) essential oil quality and genuineness. J. Essent. Oil Res. 2012, 24, 137–151. [Google Scholar] [CrossRef]
- Do, T.K.T.; Hadji-Minaglou, F.; Antoniotti, S.; Fernandez, X. Authenticity of essential oils. TrAC Trends Anal. Chem. 2015, 66, 146–157. [Google Scholar] [CrossRef]
- Wei, A.; Shibamoto, T. Antioxidant/Lipoxygenase Inhibitory Activities and Chemical Compositions of Selected Essential Oils. J. Agric. Food Chem. 2010, 58, 7218–7225. [Google Scholar] [CrossRef] [PubMed]
- Virot, M.; Tomao, V.; Ginies, C.; Visinoni, F.; Chemat, F. Green procedure with a green solvent for fats and oils’ determination. J. Chromatogr. A 2008, 1196–1197, 147–152. [Google Scholar] [CrossRef] [PubMed]
- Sawamura, M.; Ito, T.; Une, A.; Ukeda, H.; Yamasaki, Y. Isotope Ratio by HRGC-MS of Citrus junos Tanaka (Yuzu) Essential Oils: m/z 137/136 of Terpene Hydrocarbons. Biosci. Biotechnol. Biochem. 2001, 65, 2622–2629. [Google Scholar] [CrossRef] [PubMed] [Green Version]
- Oller-Moreno, S.; Pardo, A.; Jimenez-Soto, J.M.; Samitier, J.; Marco, S. Adaptive Asymmetric Least Squares baseline estimation for analytical instruments. In Proceedings of the 2014 IEEE 11th International Multi-Conference on Systems, Signals & Devices (SSD14), Barcelona, Spain, 11–14 February 2014; pp. 1–5. [Google Scholar]
- Eilers, P.H.C.; Boelens, H.F.M. Baseline Correction with Asymmetric Least Squares Smoothing. Life Sci. 2005, 1–26. [Google Scholar]
- Mollazade, K.; Omid, M.; Arefi, A. Comparing data mining classifiers for grading raisins based on visual features. Comput. Electron. Agric. 2012, 84, 124–131. [Google Scholar] [CrossRef]
- Khoshnevisan, B.; Rafiee, S.; Omid, M.; Mousazadeh, H.; Clark, S. Environmental impact assessment of tomato and cucumber cultivation in greenhouses using life cycle assessment and adaptive neuro-fuzzy inference system. J. Clean. Prod. 2014, 73, 183–192. [Google Scholar] [CrossRef]
- Westerhuis, J.A.; Hoefsloot, H.C.J.; Smit, S.; Vis, D.J.; Smilde, A.K.; Velzen, E.J.J.; Duijnhoven, J.P.M.; Dorsten, F.A. Assessment of PLSDA cross validation. Metabolomics 2008, 4, 81–89. [Google Scholar] [CrossRef] [Green Version]
- Filzmoser, P.; Liebmann, B.; Varmuza, K. Repeated double cross validation. J. Chemom. 2009, 23, 160–171. [Google Scholar] [CrossRef]
- MATLAB 2008a and Neural Network Toolbox 2008a; The MathWorks, Inc.: Natick, MA, USA, 2008.
- Zurada, J.M.; Malinowski, A.; Cloete, I. Sensitivity analysis for minimization of input data dimension for feedforward neural network. In Proceedings of the IEEE International Symposium on Circuits and Systems—ISCAS ’94, London, UK, 30 May–2 June 1994; Volume 6, pp. 447–450. [Google Scholar]
- Lek, S.; Delacoste, M.; Baran, P.; Dimopoulos, I.; Lauga, J.; Aulagnier, S. Application of neural networks to modelling nonlinear relationships in ecology. Ecol. Model. 1996, 90, 39–52. [Google Scholar] [CrossRef]
- Gevrey, M.; Dimopoulos, I.; Lek, S. Review and comparison of methods to study the contribution of variables in artificial neural network models. Ecol. Model. 2003, 160, 249–264. [Google Scholar] [CrossRef]
- Klimasauskas, C. Neural Nets Tell Why. Dr. Dobb’s J. 1991, 1991, 16–24. [Google Scholar]
- Good, P.I. Dependence. In Permutation Tests: A Practical Guide to Resampling Methods for Testing Hypotheses; Springer: Berlin, Germany, 2000; p. 270. ISBN 038798898X. [Google Scholar]
- Annis, D.H. Permutation, Parametric, and Bootstrap Tests of Hypotheses. J. Am. Stat. Assoc. 2005, 100, 1457–1458. [Google Scholar] [CrossRef]
- Olden, J.D.; Jackson, D.A. Illuminating the “black box”: A randomization approach for understanding variable contributions in artificial neural networks. Ecol. Model. 2002, 154, 135–150. [Google Scholar] [CrossRef]
- Ahmed, E.M.; Dennison, R.A.; Shaw, P.E. Effect of selected oil and essence volatile components on flavor quality of pumpout orange juice. J. Agric. Food Chem. 1978, 26, 368–372. [Google Scholar] [CrossRef]


| No. | RT | Compounds * | Aromatic Note of EO | MW |
|---|---|---|---|---|
| 1 | 1.99 | ND | - | - |
| 2 | 5.17 | ND | - | - |
| 3 | 6.95 | α-pinene | Floral | 136.24 |
| 4 | 8.27 | β-pinene | Green | 136.24 |
| 5 | 8.41 | ND | - | - |
| 6 | 8.83 | β-myrcene | Green | 136.24 |
| 7 | 9.43 | ND | - | - |
| 8 | 9.92 | ND | - | - |
| 9 | 10.45 | limonene | Citrus | 136.24 |
| 10 | 11.30 | ocimene | Citrus | 136.24 |
| 11 | 11.82 | Cyclopropane,1,2-dibutyl- | - | 154.30 |
| 12 | 12.48 | cis-linalool oxide | Floral | 170.25 |
| 13 | 13.28 | myrcenol | - | 154.25 |
| 14 | 13.80 | linalool | Floral | 154.25 |
| 15 | 15.64 | ND | - | - |
| 16 | 16.83 | ND | - | - |
| 17 | 18.16 | linalyl butyrate | Floral | 224.34 |
| 18 | 19.01 | α-terpineol | Green | 154.25 |
| 19 | 21.66 | 3-carne | Sweet; citrus | 136.24 |
| 20 | 23.40 | nerol | Floral | 154.25 |
| 21 | 25.70 | ND | - | - |
| 22 | 26.07 | ND | - | - |
| Output | Peaks Ranking | |||||||||||||||||||||
|---|---|---|---|---|---|---|---|---|---|---|---|---|---|---|---|---|---|---|---|---|---|---|
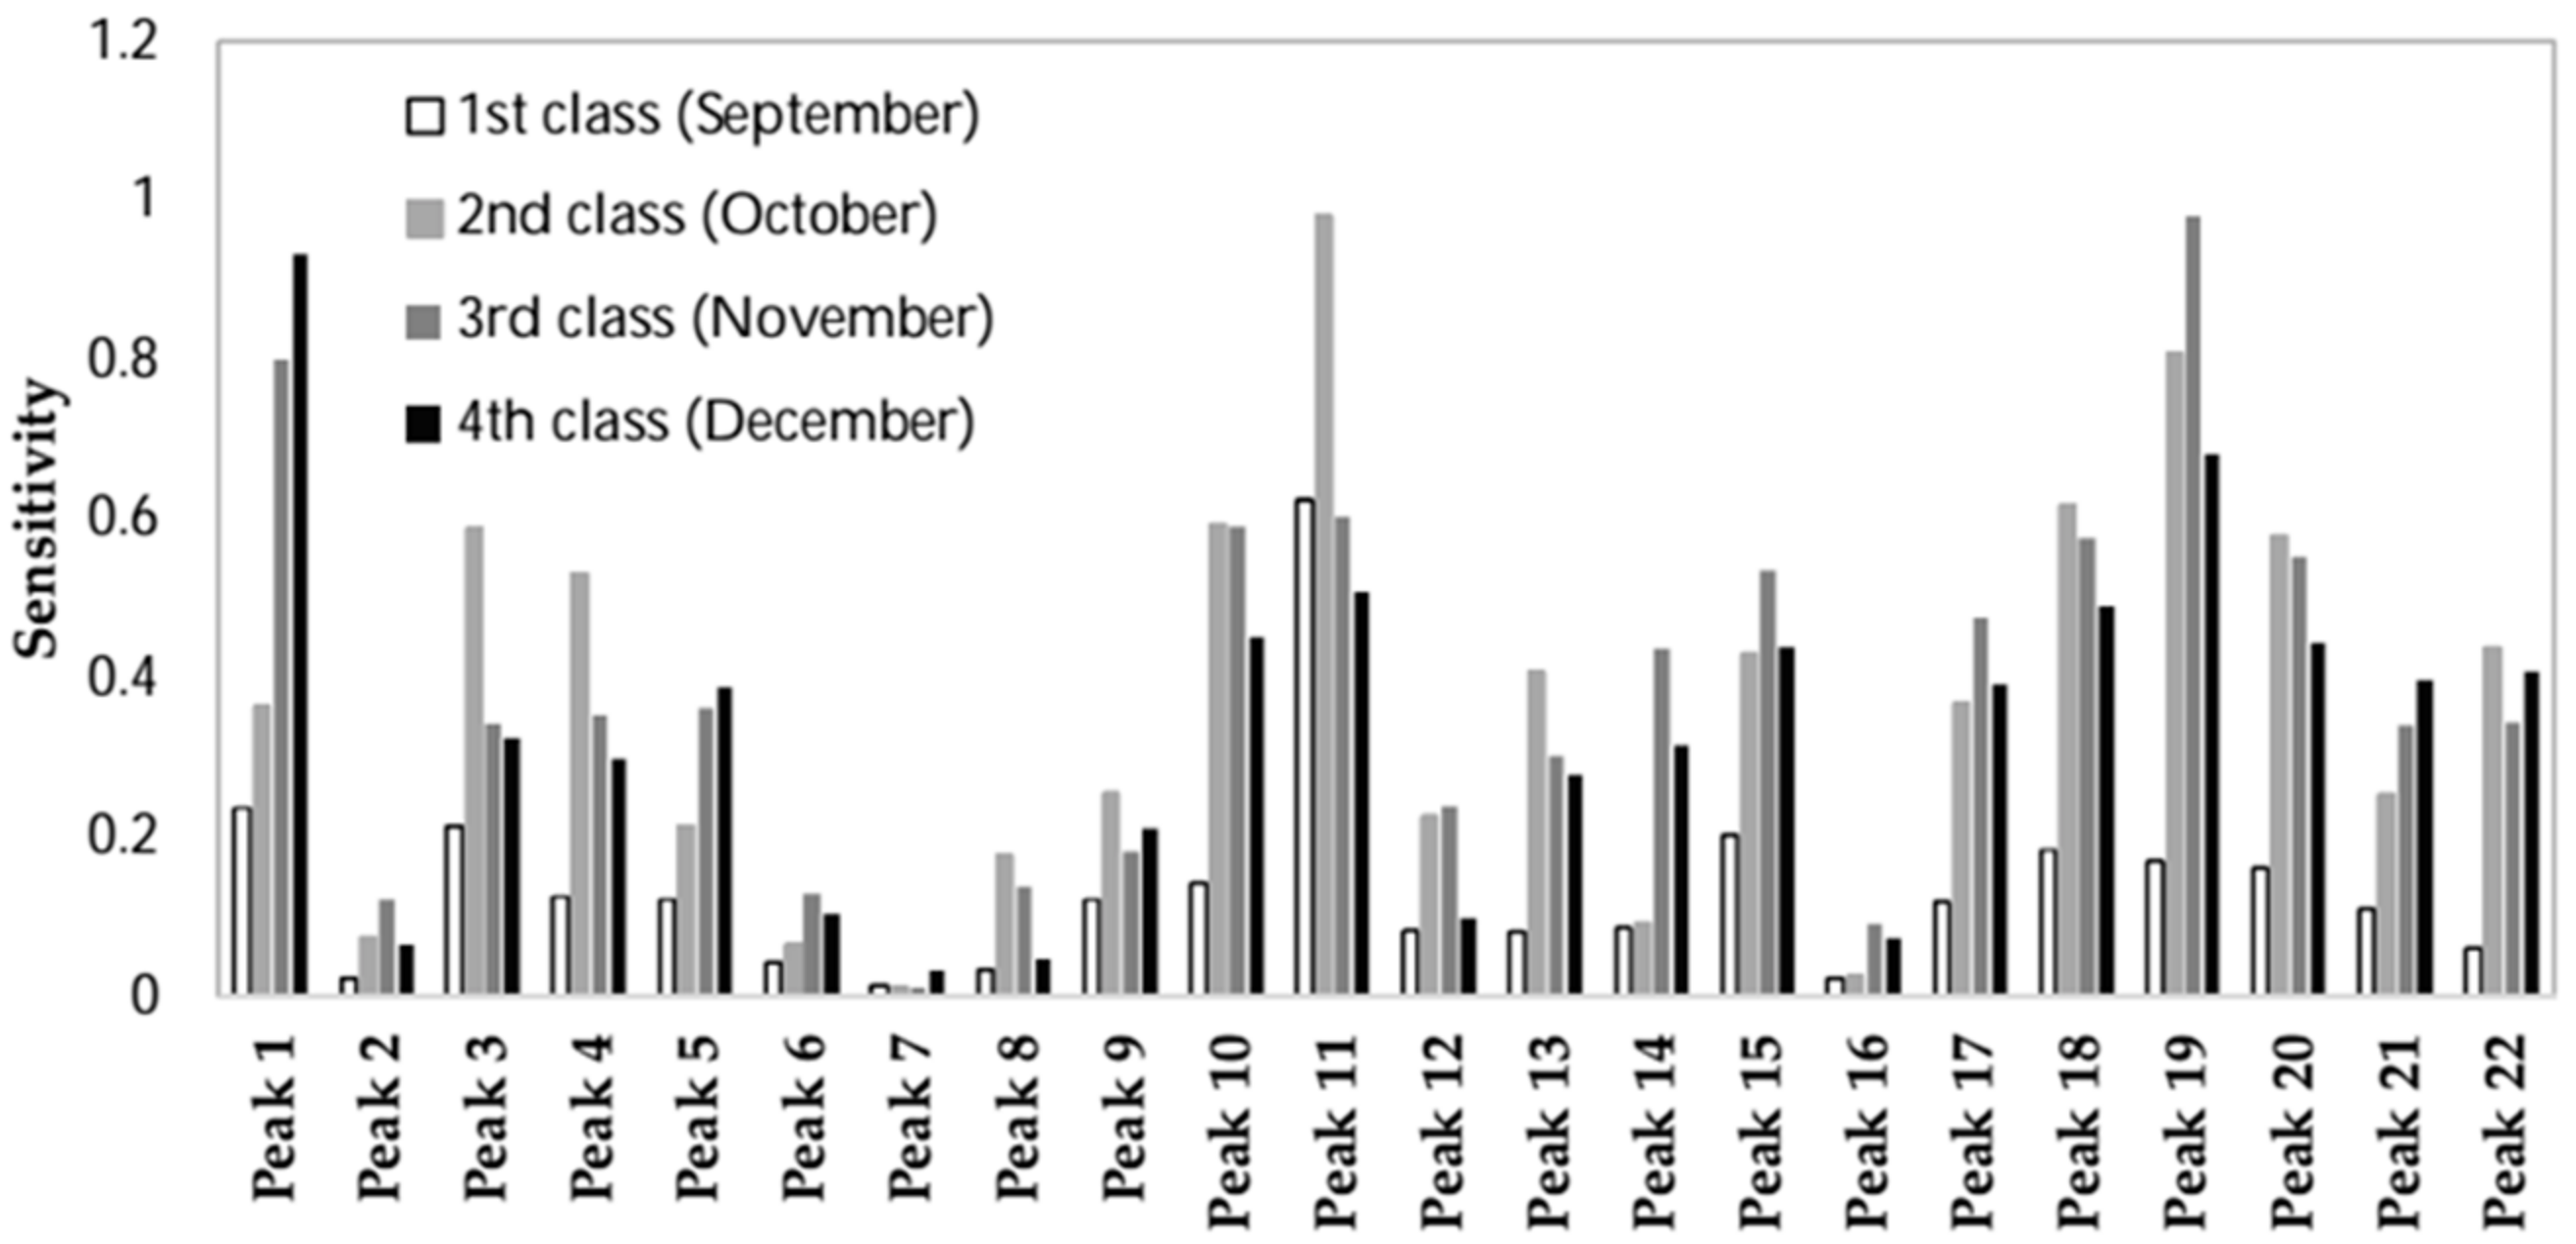
| First Class | 11 | 1 | 3 | 15 | 18 | 19 | 20 | 10 | 4 | 5 | 9 | 17 | 21 | 14 | 12 | 13 | 22 | 6 | 8 | 2 | 16 | 7 |
| Second Class | 11 | 19 | 18 | 10 | 3 | 20 | 4 | 22 | 15 | 13 | 17 | 1 | 9 | 21 | 12 | 5 | 8 | 14 | 2 | 6 | 16 | 7 |
| Third Class | 19 | 1 | 11 | 10 | 18 | 20 | 15 | 17 | 14 | 5 | 4 | 22 | 3 | 21 | 13 | 12 | 9 | 8 | 6 | 2 | 16 | 7 |
| Fourth Class | 1 | 19 | 11 | 18 | 10 | 20 | 15 | 22 | 21 | 17 | 5 | 3 | 14 | 4 | 13 | 9 | 6 | 12 | 16 | 2 | 8 | 7 |
| Sequence | 1 | 2 | 3 | 4 | 5 | 6 | 7 | 8 | 9 | 10 | 11 | 12 | 13 |
| No of Peaks (No. of ANN Inputs) | 3 | 5 | 7 | 8 | 9 | 11 | 13 | 15 | 16 | 17 | 19 | 21 | 22 |
| Peaks No. Added in Each Step | 1,11,19 | 3,18 | 10,15 | 20 | 4 | 17,22 | 14,21 | 5,13 | 9 | 12 | 6,8 | 2,16 | 7 |
© 2018 by the authors. Licensee MDPI, Basel, Switzerland. This article is an open access article distributed under the terms and conditions of the Creative Commons Attribution (CC BY) license (http://creativecommons.org/licenses/by/4.0/).
Share and Cite
Taghadomi-Saberi, S.; Mas Garcia, S.; Allah Masoumi, A.; Sadeghi, M.; Marco, S. Classification of Bitter Orange Essential Oils According to Fruit Ripening Stage by Untargeted Chemical Profiling and Machine Learning. Sensors 2018, 18, 1922. https://doi.org/10.3390/s18061922
Taghadomi-Saberi S, Mas Garcia S, Allah Masoumi A, Sadeghi M, Marco S. Classification of Bitter Orange Essential Oils According to Fruit Ripening Stage by Untargeted Chemical Profiling and Machine Learning. Sensors. 2018; 18(6):1922. https://doi.org/10.3390/s18061922
Chicago/Turabian StyleTaghadomi-Saberi, Saeedeh, Sílvia Mas Garcia, Amin Allah Masoumi, Morteza Sadeghi, and Santiago Marco. 2018. "Classification of Bitter Orange Essential Oils According to Fruit Ripening Stage by Untargeted Chemical Profiling and Machine Learning" Sensors 18, no. 6: 1922. https://doi.org/10.3390/s18061922