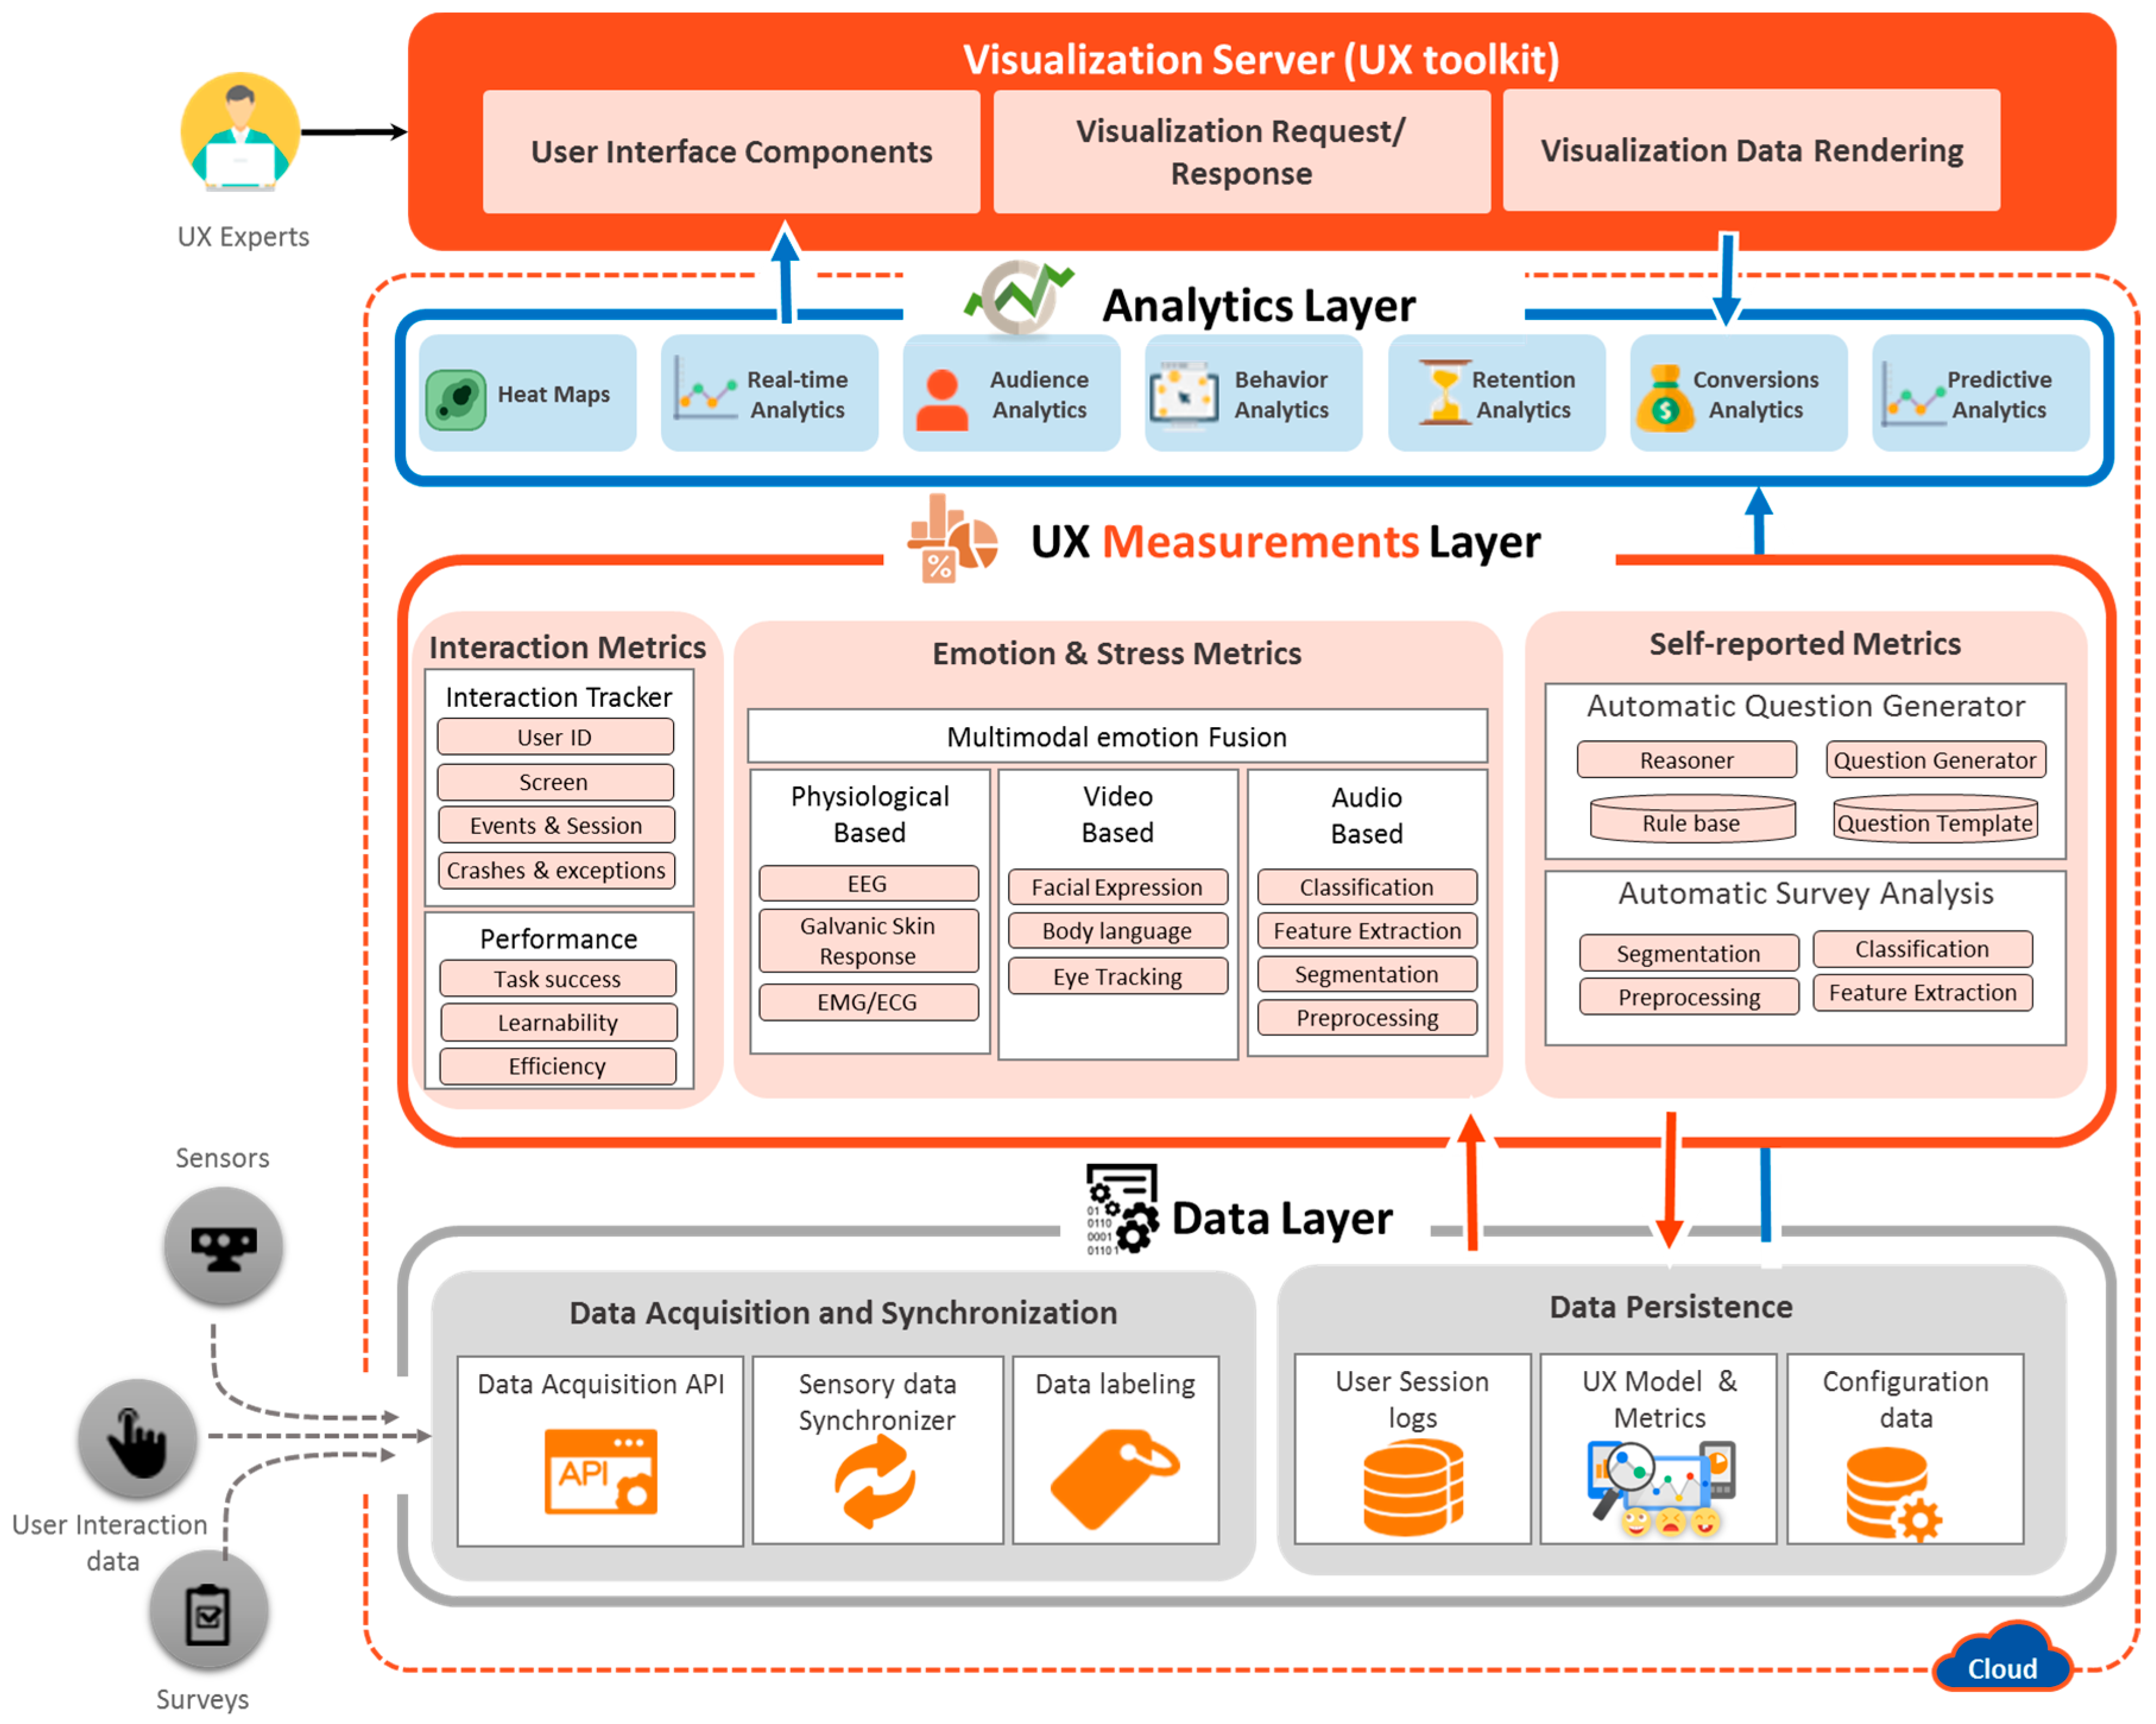
The UX measurements layer is the core of the lean UX platform for inference and modeling of the UX evaluation. It is composed of three main modules that deal with interaction metrics, emotion and stress metrics, and self-reported metrics.
4.2.2. Emotion and Stress Metrics
- ◯
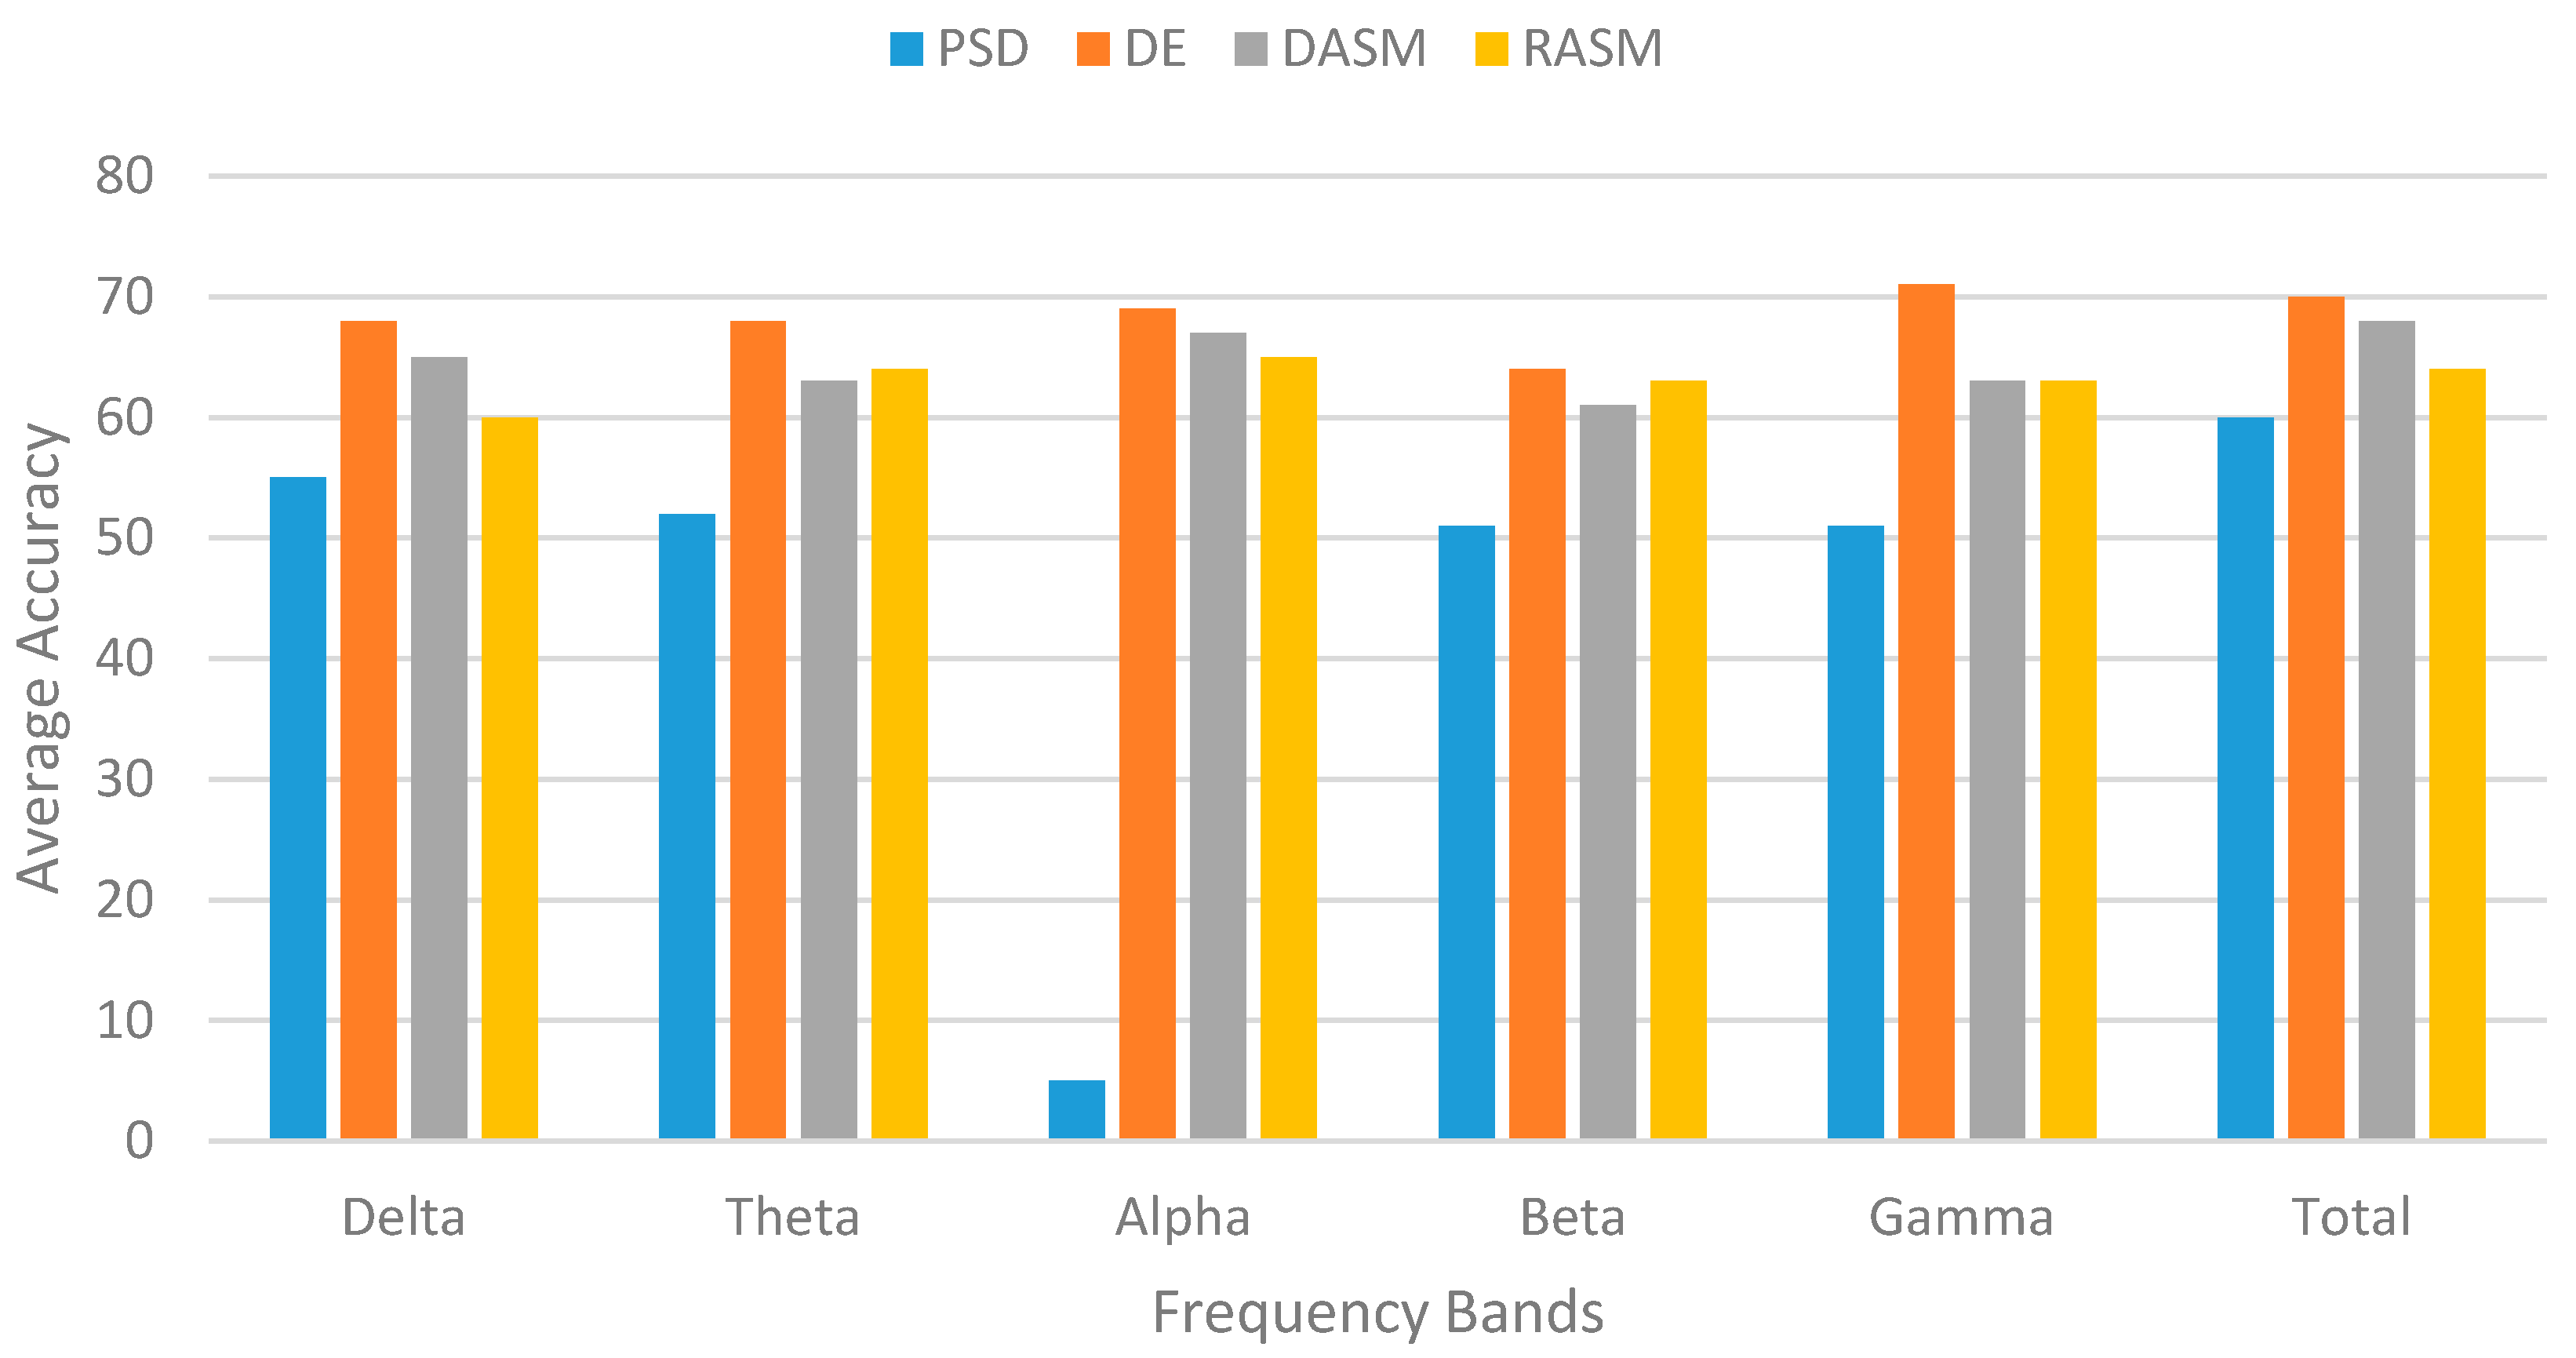
Physiological-based Emotion Recognition: We use the biometric measurement to understand the emotional engagement of user while the user interacts with the system. We use multimodal data from various sensors, such as eye tracking, for visual attention and EEG for quick detection of emotions, motivations, engagement (arousal) in the cognitive workload and frustration level. We will add more modules that can measure emotional arousal and stress by the galvanic skin response (GSR) via measuring changes in the conductivity of the skin, and we will use EMG/ECG for the detection of muscle activity, motion, stress, and arousal. In this study, we implemented the eye tracking and EEG modules.
- ◯
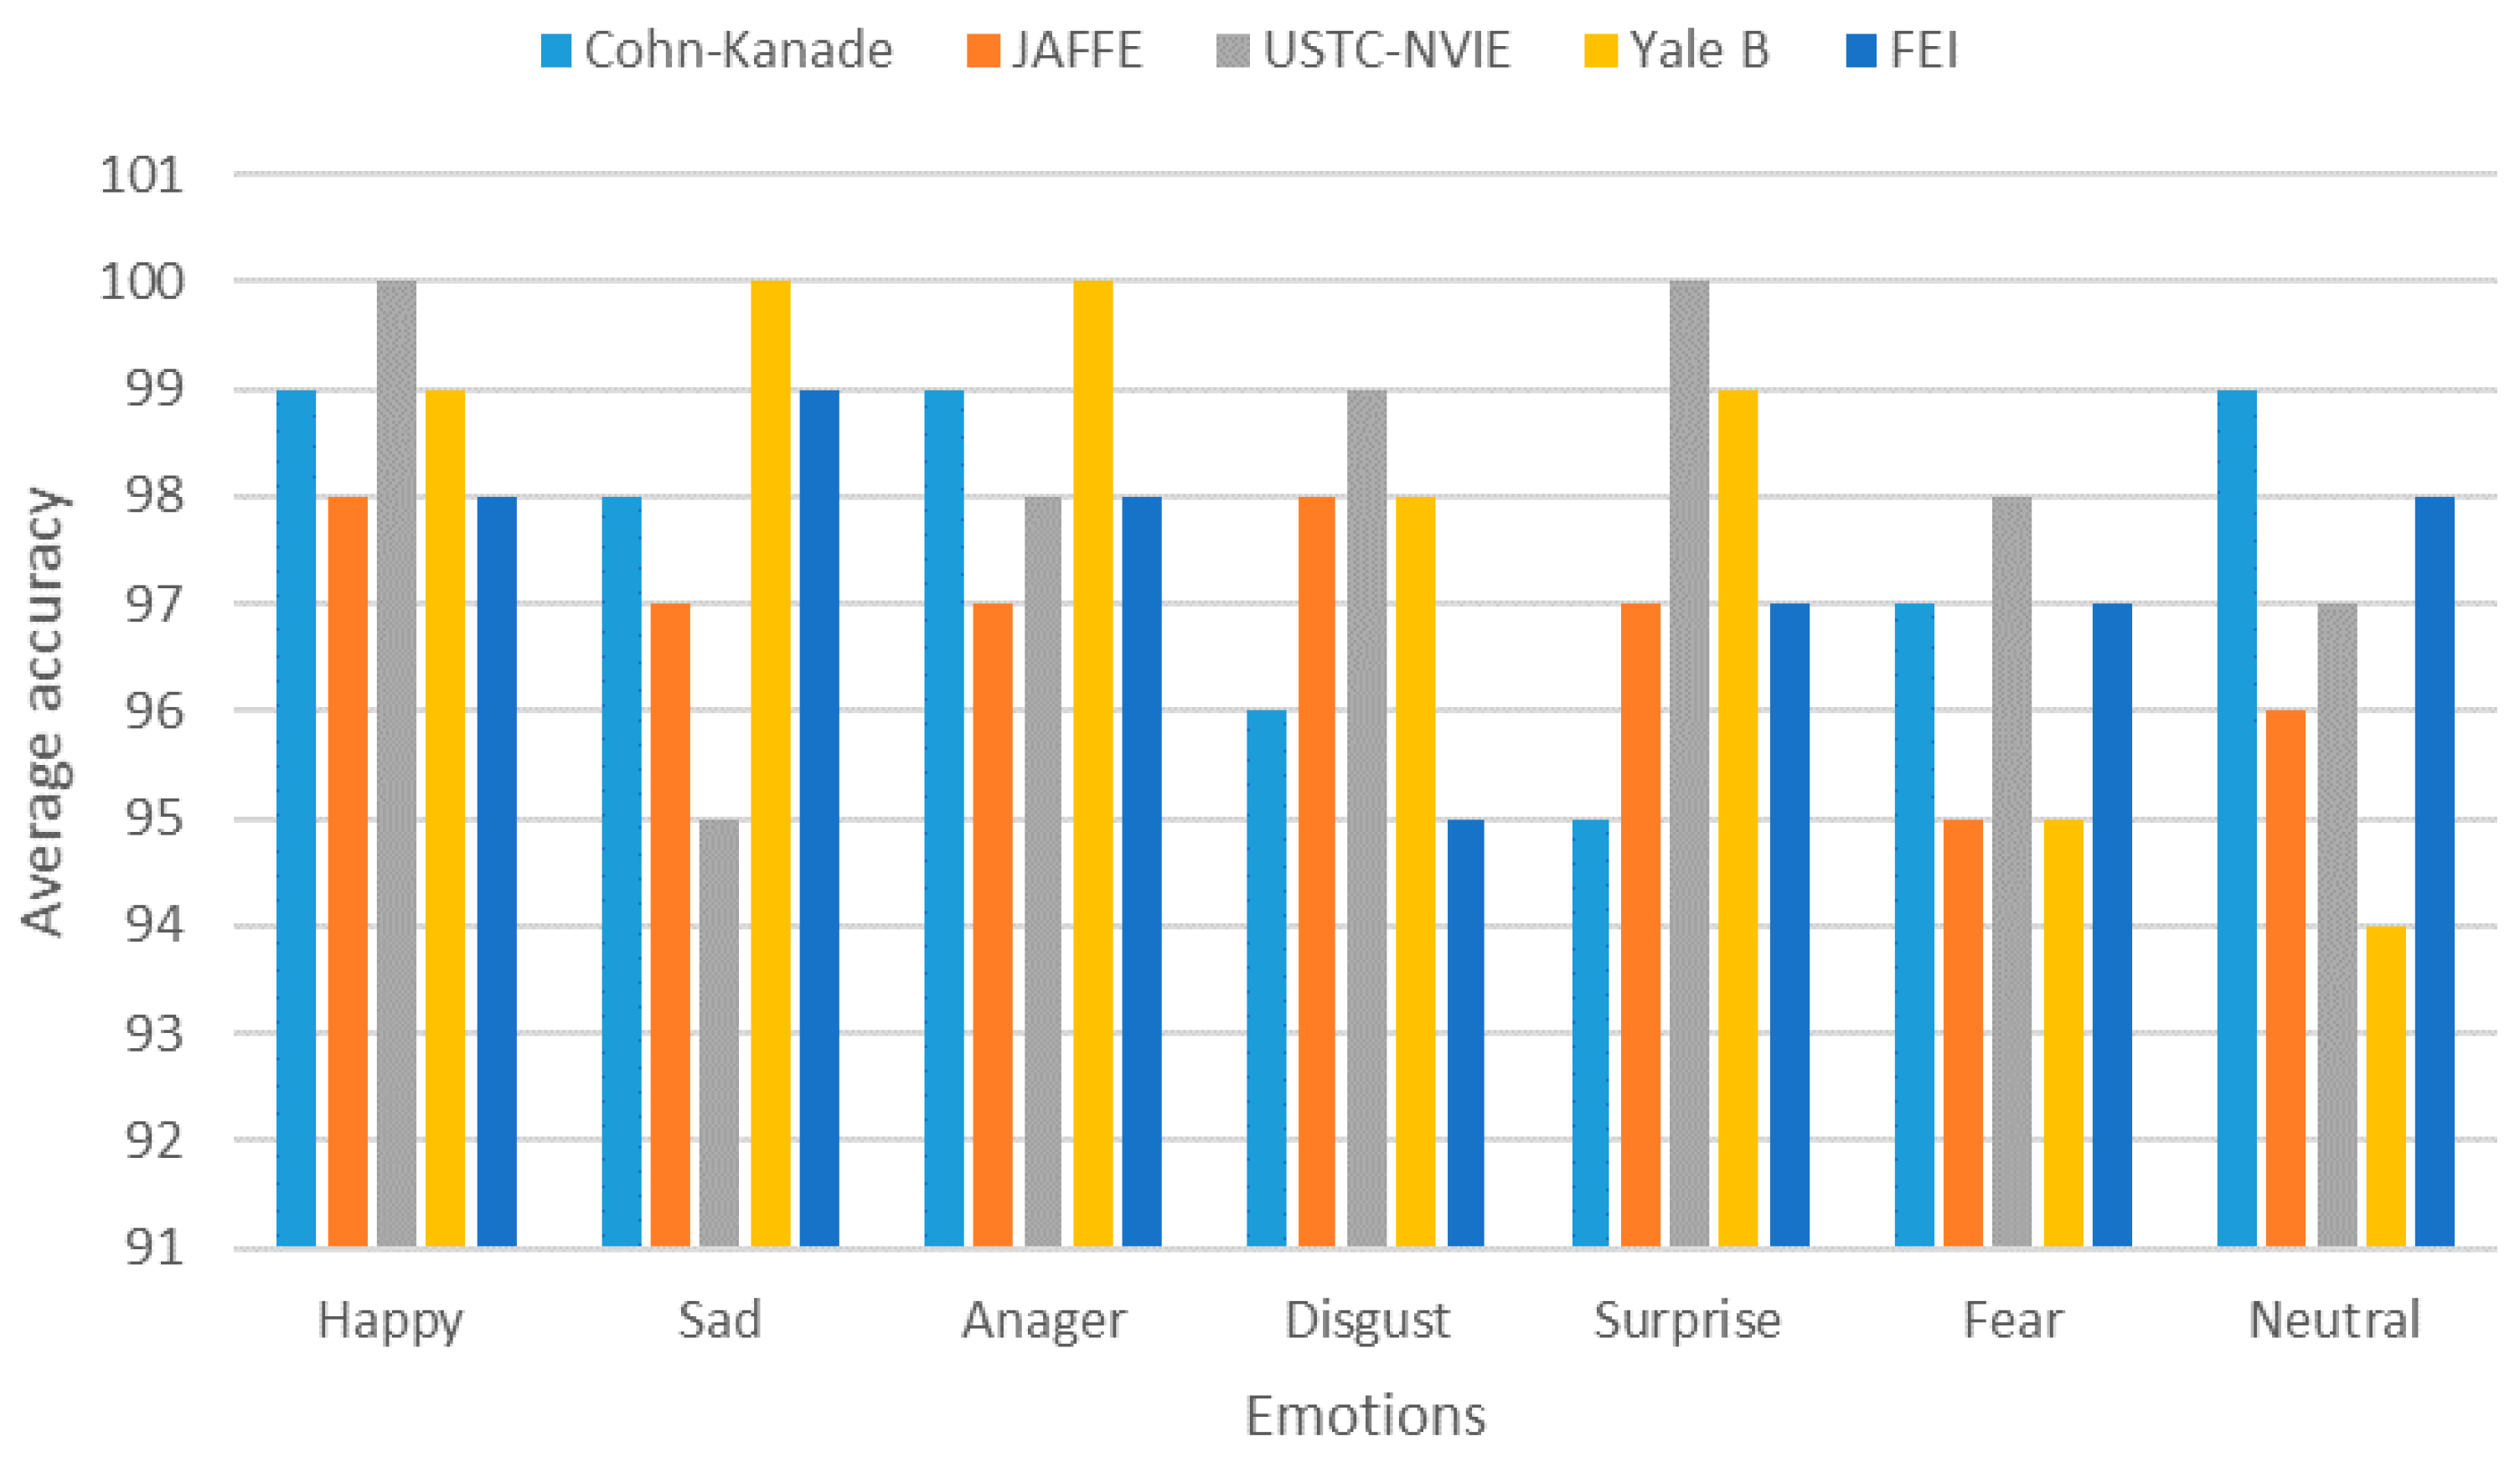
Video-based Emotion Recognition: The video-based emotion recognition metric consists of two methods and sub-modules: facial expression analysis [
41] and body language analysis. Automatic facial expression analysis (AFEA) plays an important role in producing deeper insights in human emotional reactions (valence), such as fear, happiness, sadness, surprise, anger, disgust, or neutrality. For AFEA, we used an inexpensive webcam to capture video of a participant in order to reduce the overall financial cost. Our developed AFEA first detects the face in a given video frame or image by applying the Viola Jones cascaded classifier algorithm. Second, different facial landmarks features are detected (e.g., eyes, brows, mouth, nose) as the face model. Finally, the face model is fed into the classifier to provide emotions and facial expression metrics as labels [
41]. Non-verbal gestures (i.e., body language) play a significant part in the communication process and can yield critical insight into one’s experience while interacting with any computing system. We will use a depth camera to recognize emotions through user body language in upcoming version of lean UX platform release.
- ◯
Audio-based Emotion Recognition: We used an automatic method of measuring human emotions by analyzing the human voice collected through a microphone while using the system [
71], such as anger, sadness, and happiness. The trained model is built on the emotion audio data collected from lab students using a microphone recording by manually labeling each audio clip, Berlin Emotional Speech (EMO-DB) [
72], and SEMAINE corpus [
73]. The model classifies incoming audio to the platform as seven basic emotions: fear, happiness, sadness, surprise, anger, disgust, or neutrality. A Voice Activity Detection (VAD) VAD technique that consists of short-time energy (STE) and short-time zero-crossing rate (STZCR) [
74,
75] is used to remove the background noise and eliminate the silent parts from audio signals. The speech signals are divided into frames, then STE detects the energy within each frame for voice segmentation. Afterward, STZCR is calculated from the rate of change of speech signal within a particular time window. These two features are used to extract the speech segment for emotion recognition and removed the unwanted frames from signals. The output of VAD is used by the audio feature extraction to extract the audio features such as pitch, log-energy, teager energy operator (TEO), and zero ZCR. Subsequently, we have employed the feature level fusion using a set of rules to choose the right emotions as a previous study [
75].
- ◯
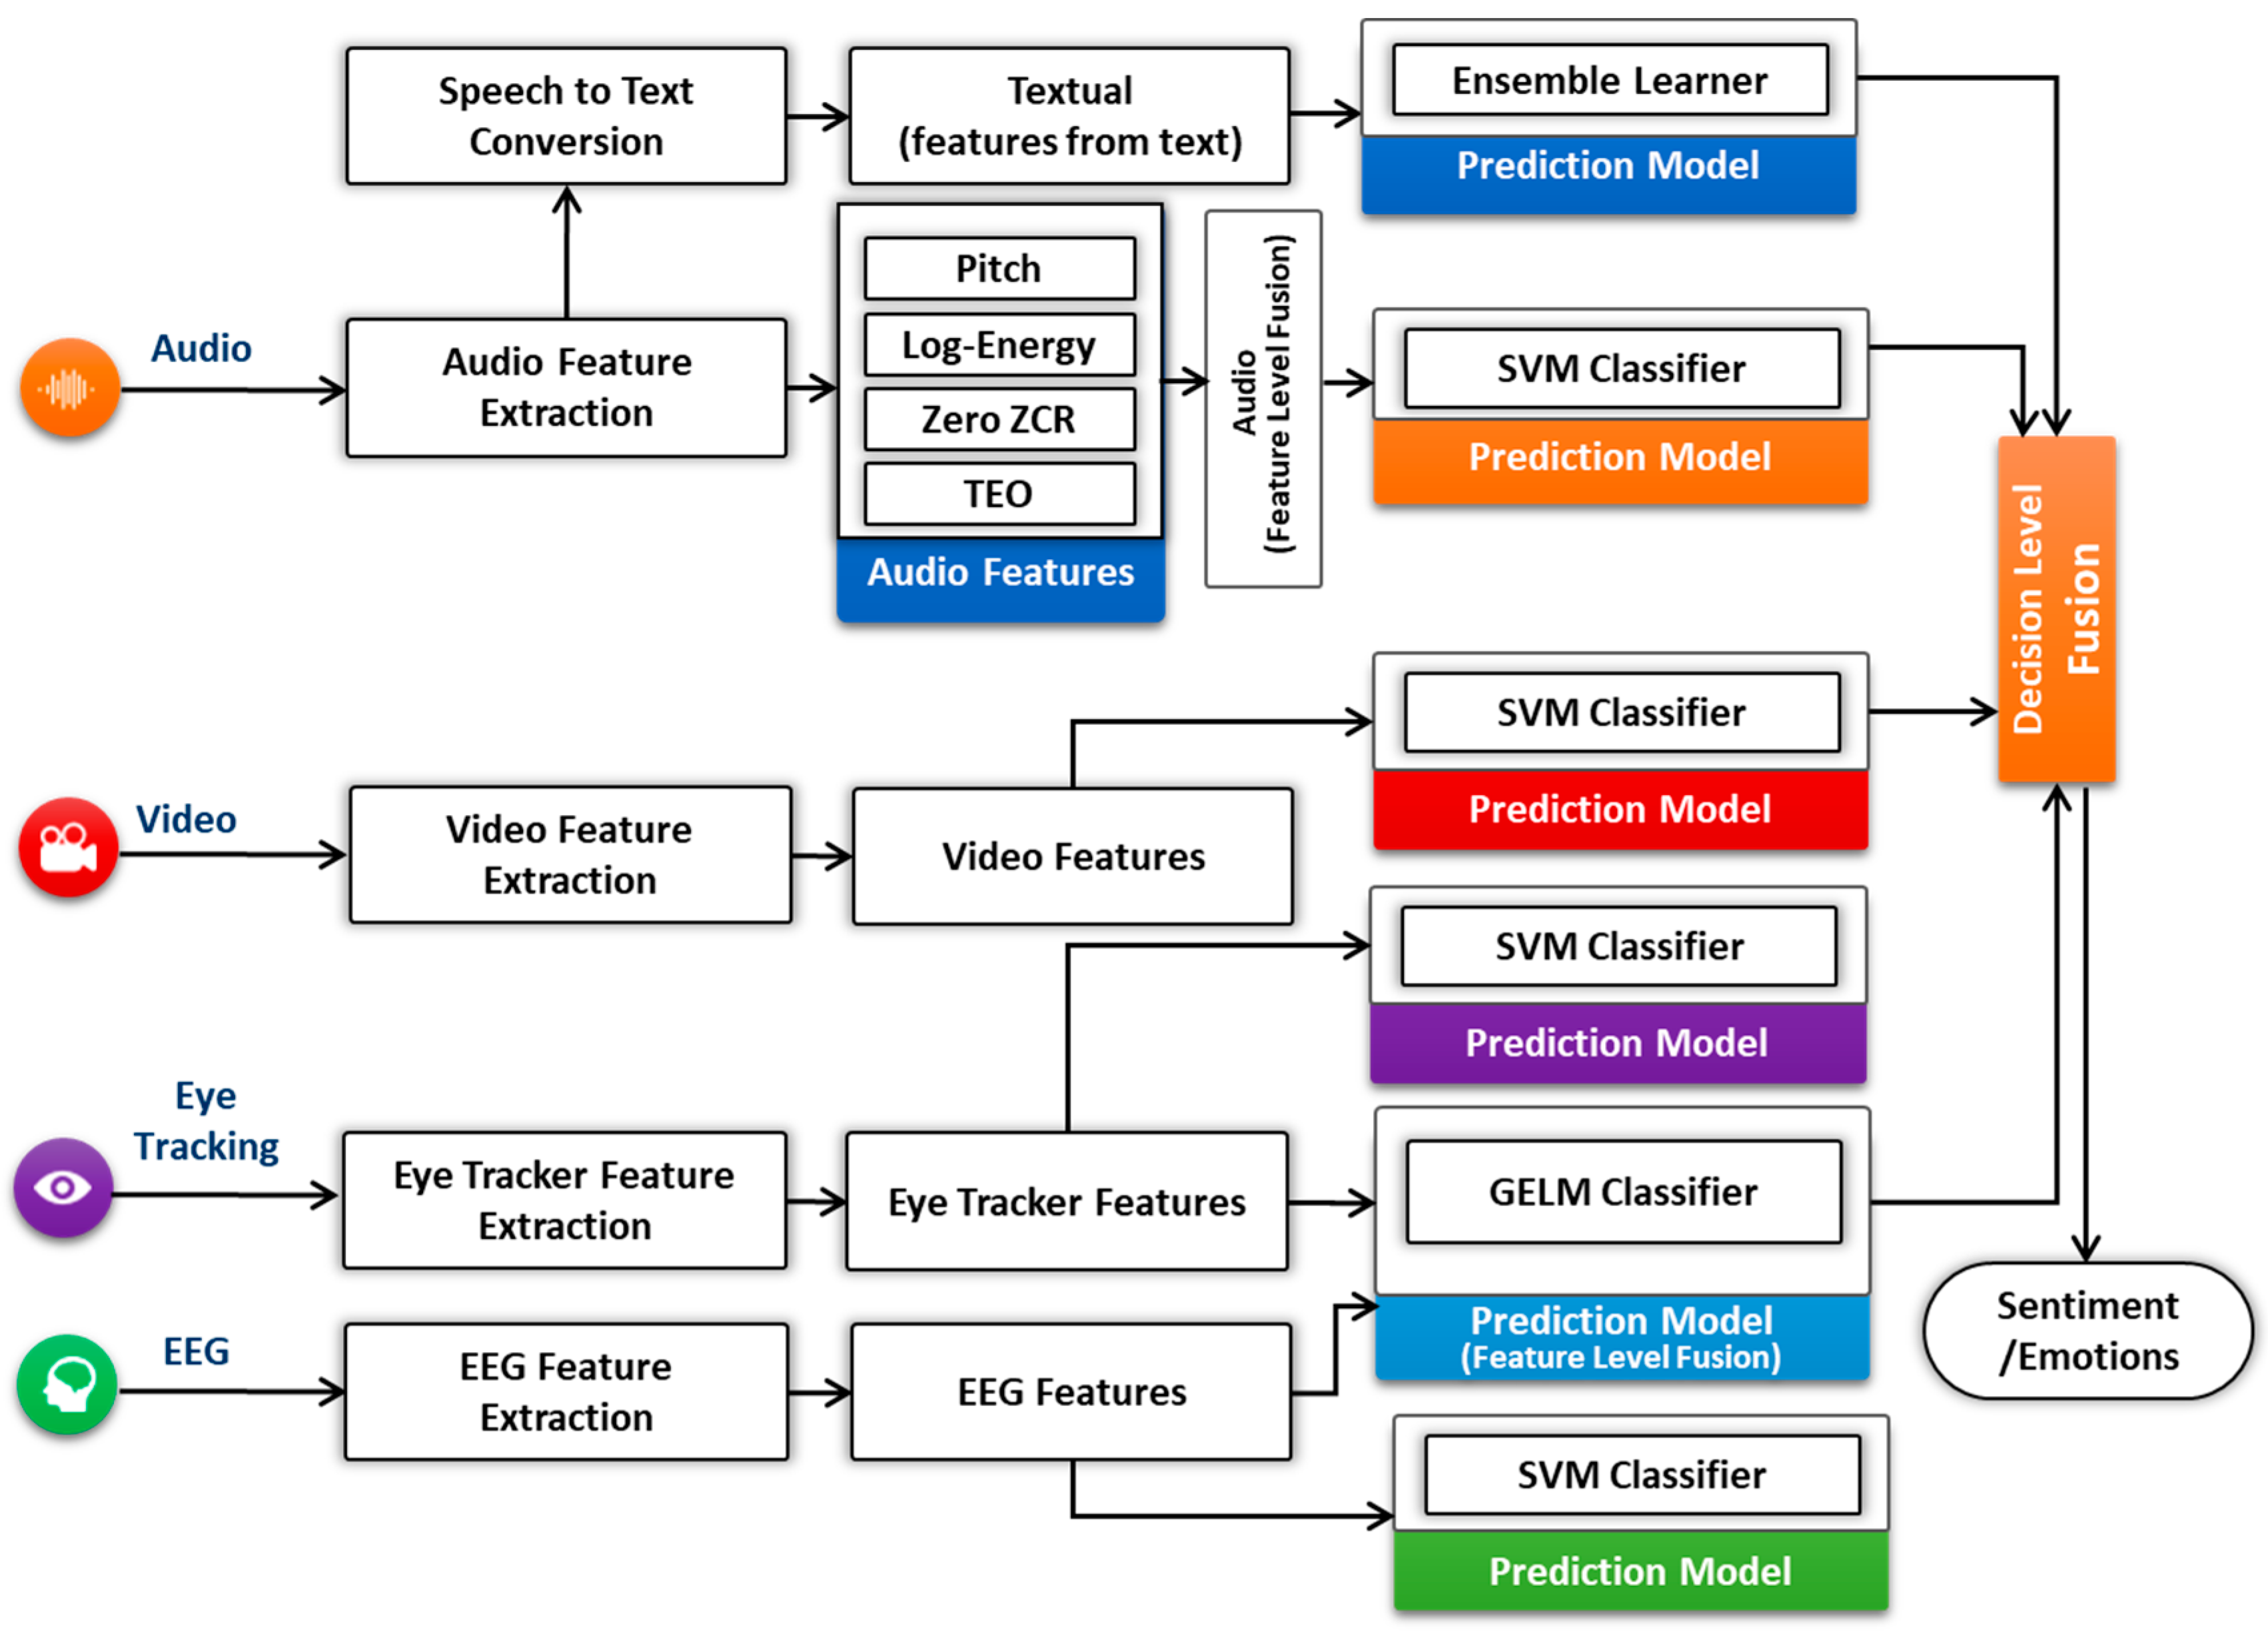
Multimodal Data Fusion: The primary goal of multimodal fusion is to enhance the accuracy of prediction classifiers [
76]. It shows the importance of making a multimodal fusion framework that could effectively extract emotions from different modalities in human-centric environment. The benefit of using multimodal data from different devices is to get deep insights of human emotions and motivations. The platform fuses the different emotional measurements, such as audio, video, physiological, and eye tracking to acquire the complete overview of the user’s emotional experience by using the mixed method approach to measure the actual user’s emotional experience, as shown in
Figure 5.
There are three different types of fusion level [
76,
77,
78]: feature level, decision level, and hybrid level. Feature-level [
79,
80,
81,
82,
83,
84] is also known as early fusion, that fuses the features extracted from different modalities (e.g., audio, textual, EEG, and eye tracking) for prediction. Decision-level fusion [
79,
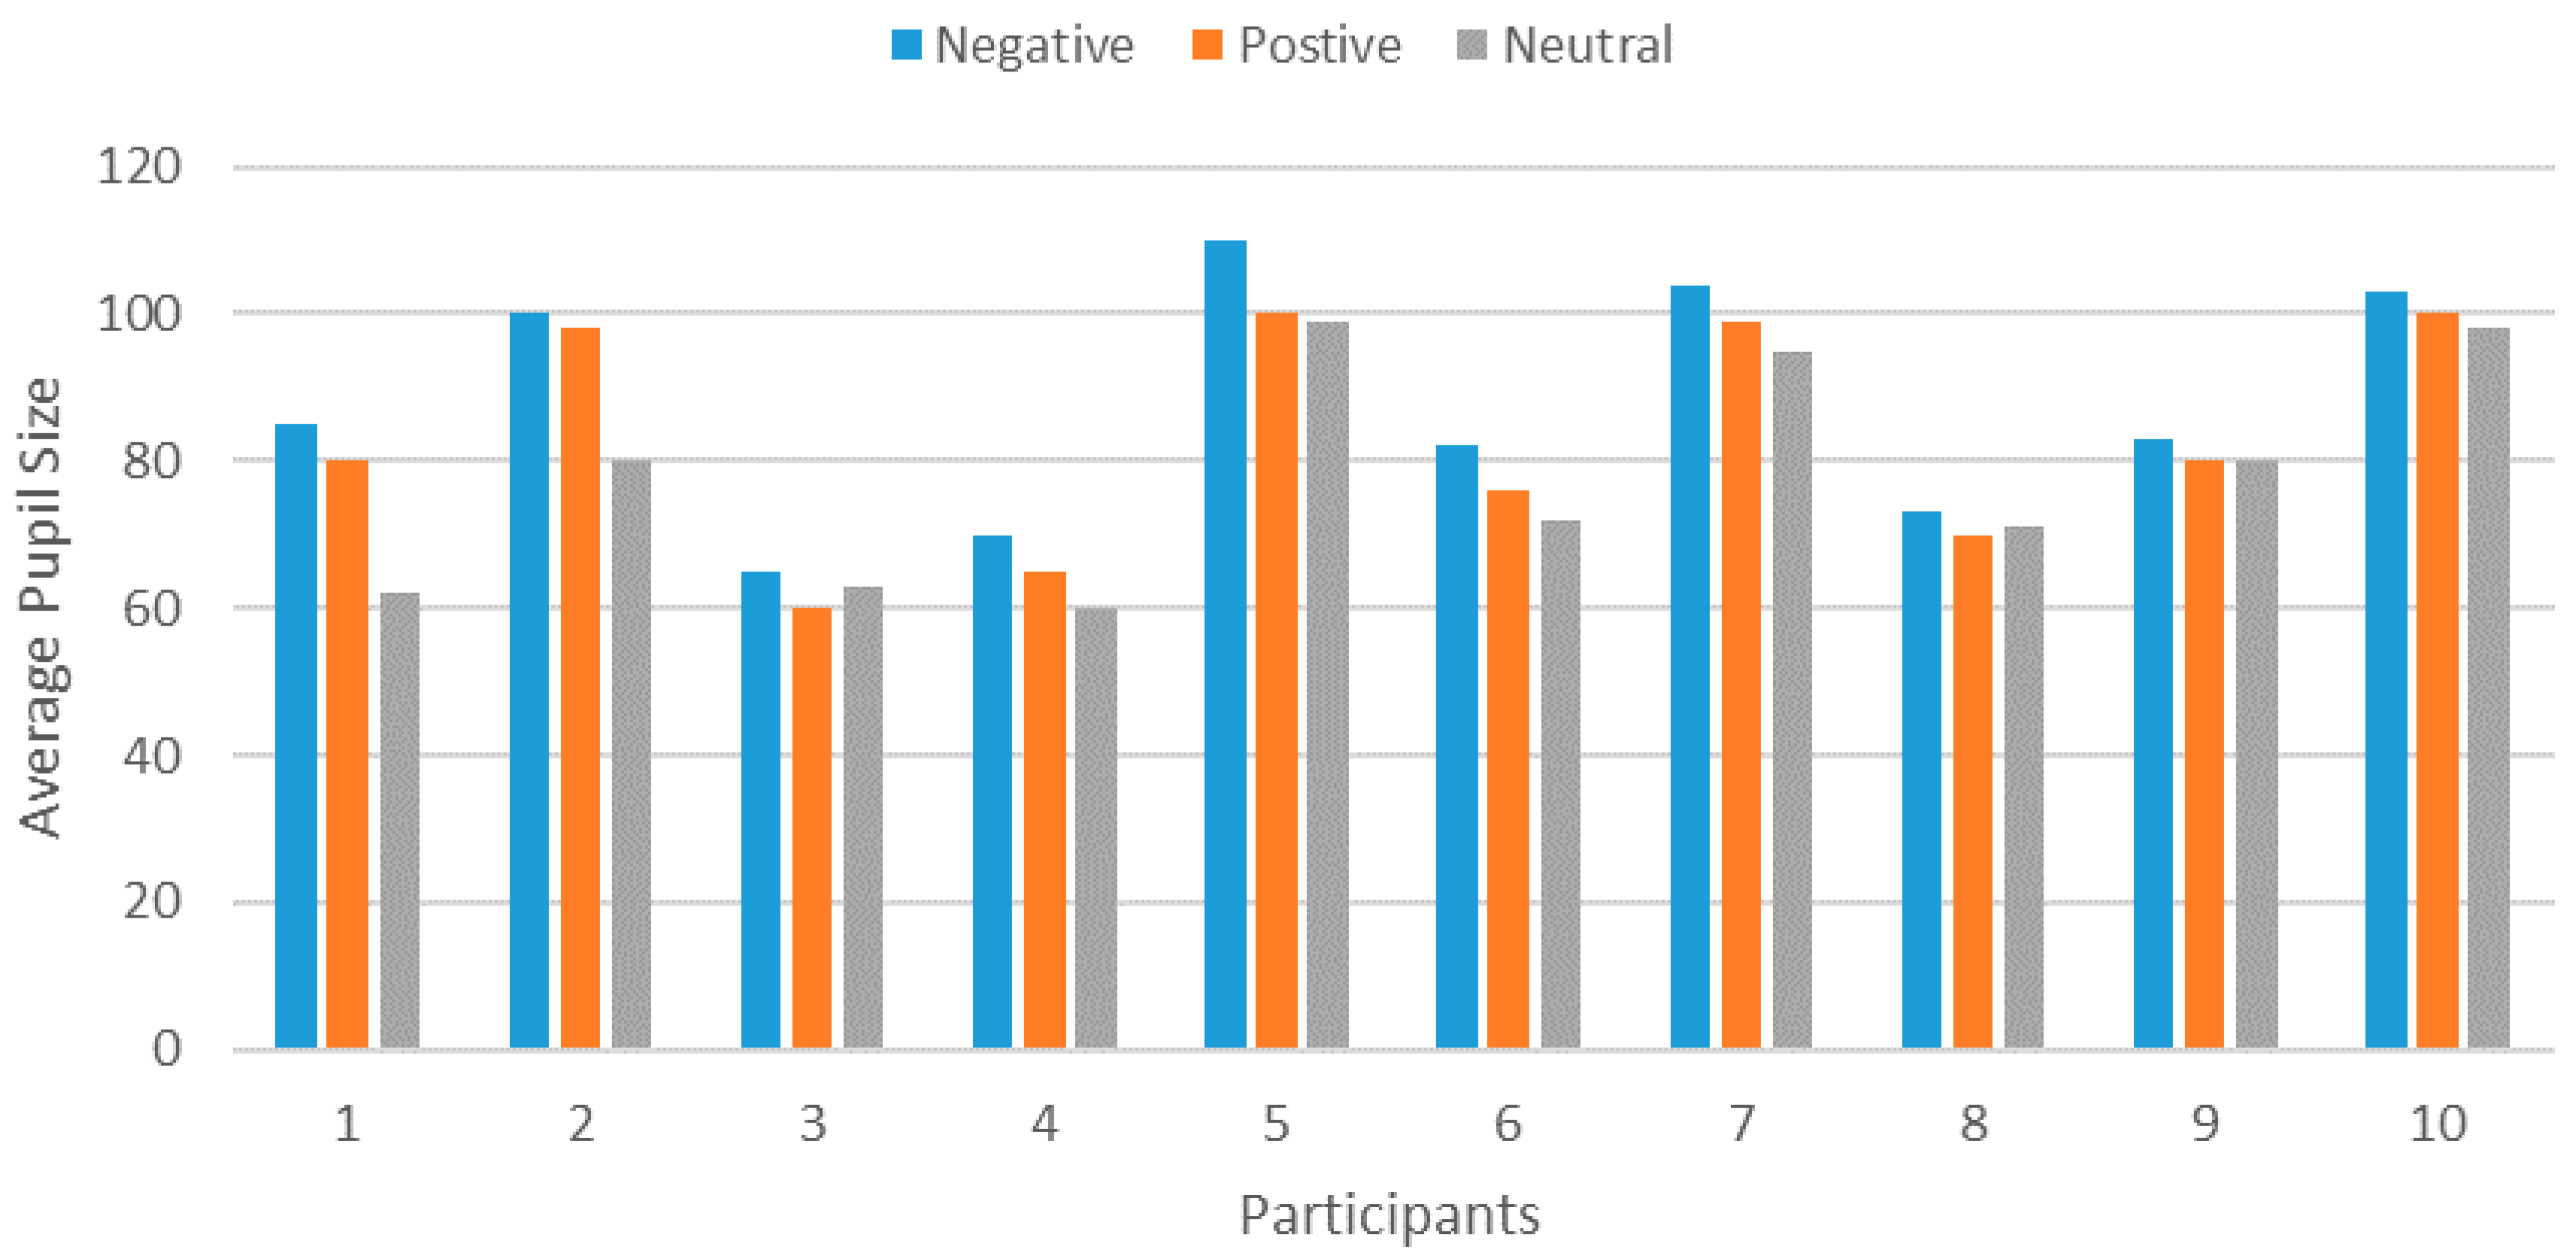
85] is called as late fusion, where the individual’s modalities classifier examined the features, gives the results, and then fuses the results to give a final decision. In feature-level, we combined the features of EEG and eye tracking (pupil size) for user sentiment recognition either positive, negative, or neutral. The combined feature vector has been used for the prediction classification. In decision-level fusion, we have employed the feature vector from each input modality and fed into individual classifier as shown in
Figure 5. We have adopted the 10-fold cross-validation to estimate the performance of each recognizer. We have used the mean values of all prediction confidences score for prediction fusion. In our case, the rule-based approach has calculated the final label of the prediction as shown in the formula given below:
where
w1,
w2,
w3, and
w4 represent the weights of each prediction classifier. We have assigned the equal weights (0.1) to each classifier.
C represents the classifier classes such as fear, happiness, sadness, surprise, anger, disgust, and neutrality, and
,
, and
represent the confidences score for audio, video, physiological, and textual modalities respectively. The textual modality has used the same prediction model discussed in
Section 4.2.3, after speech to text conversion.
4.2.3. Self-Reported Metrics
Self-reported metrics [
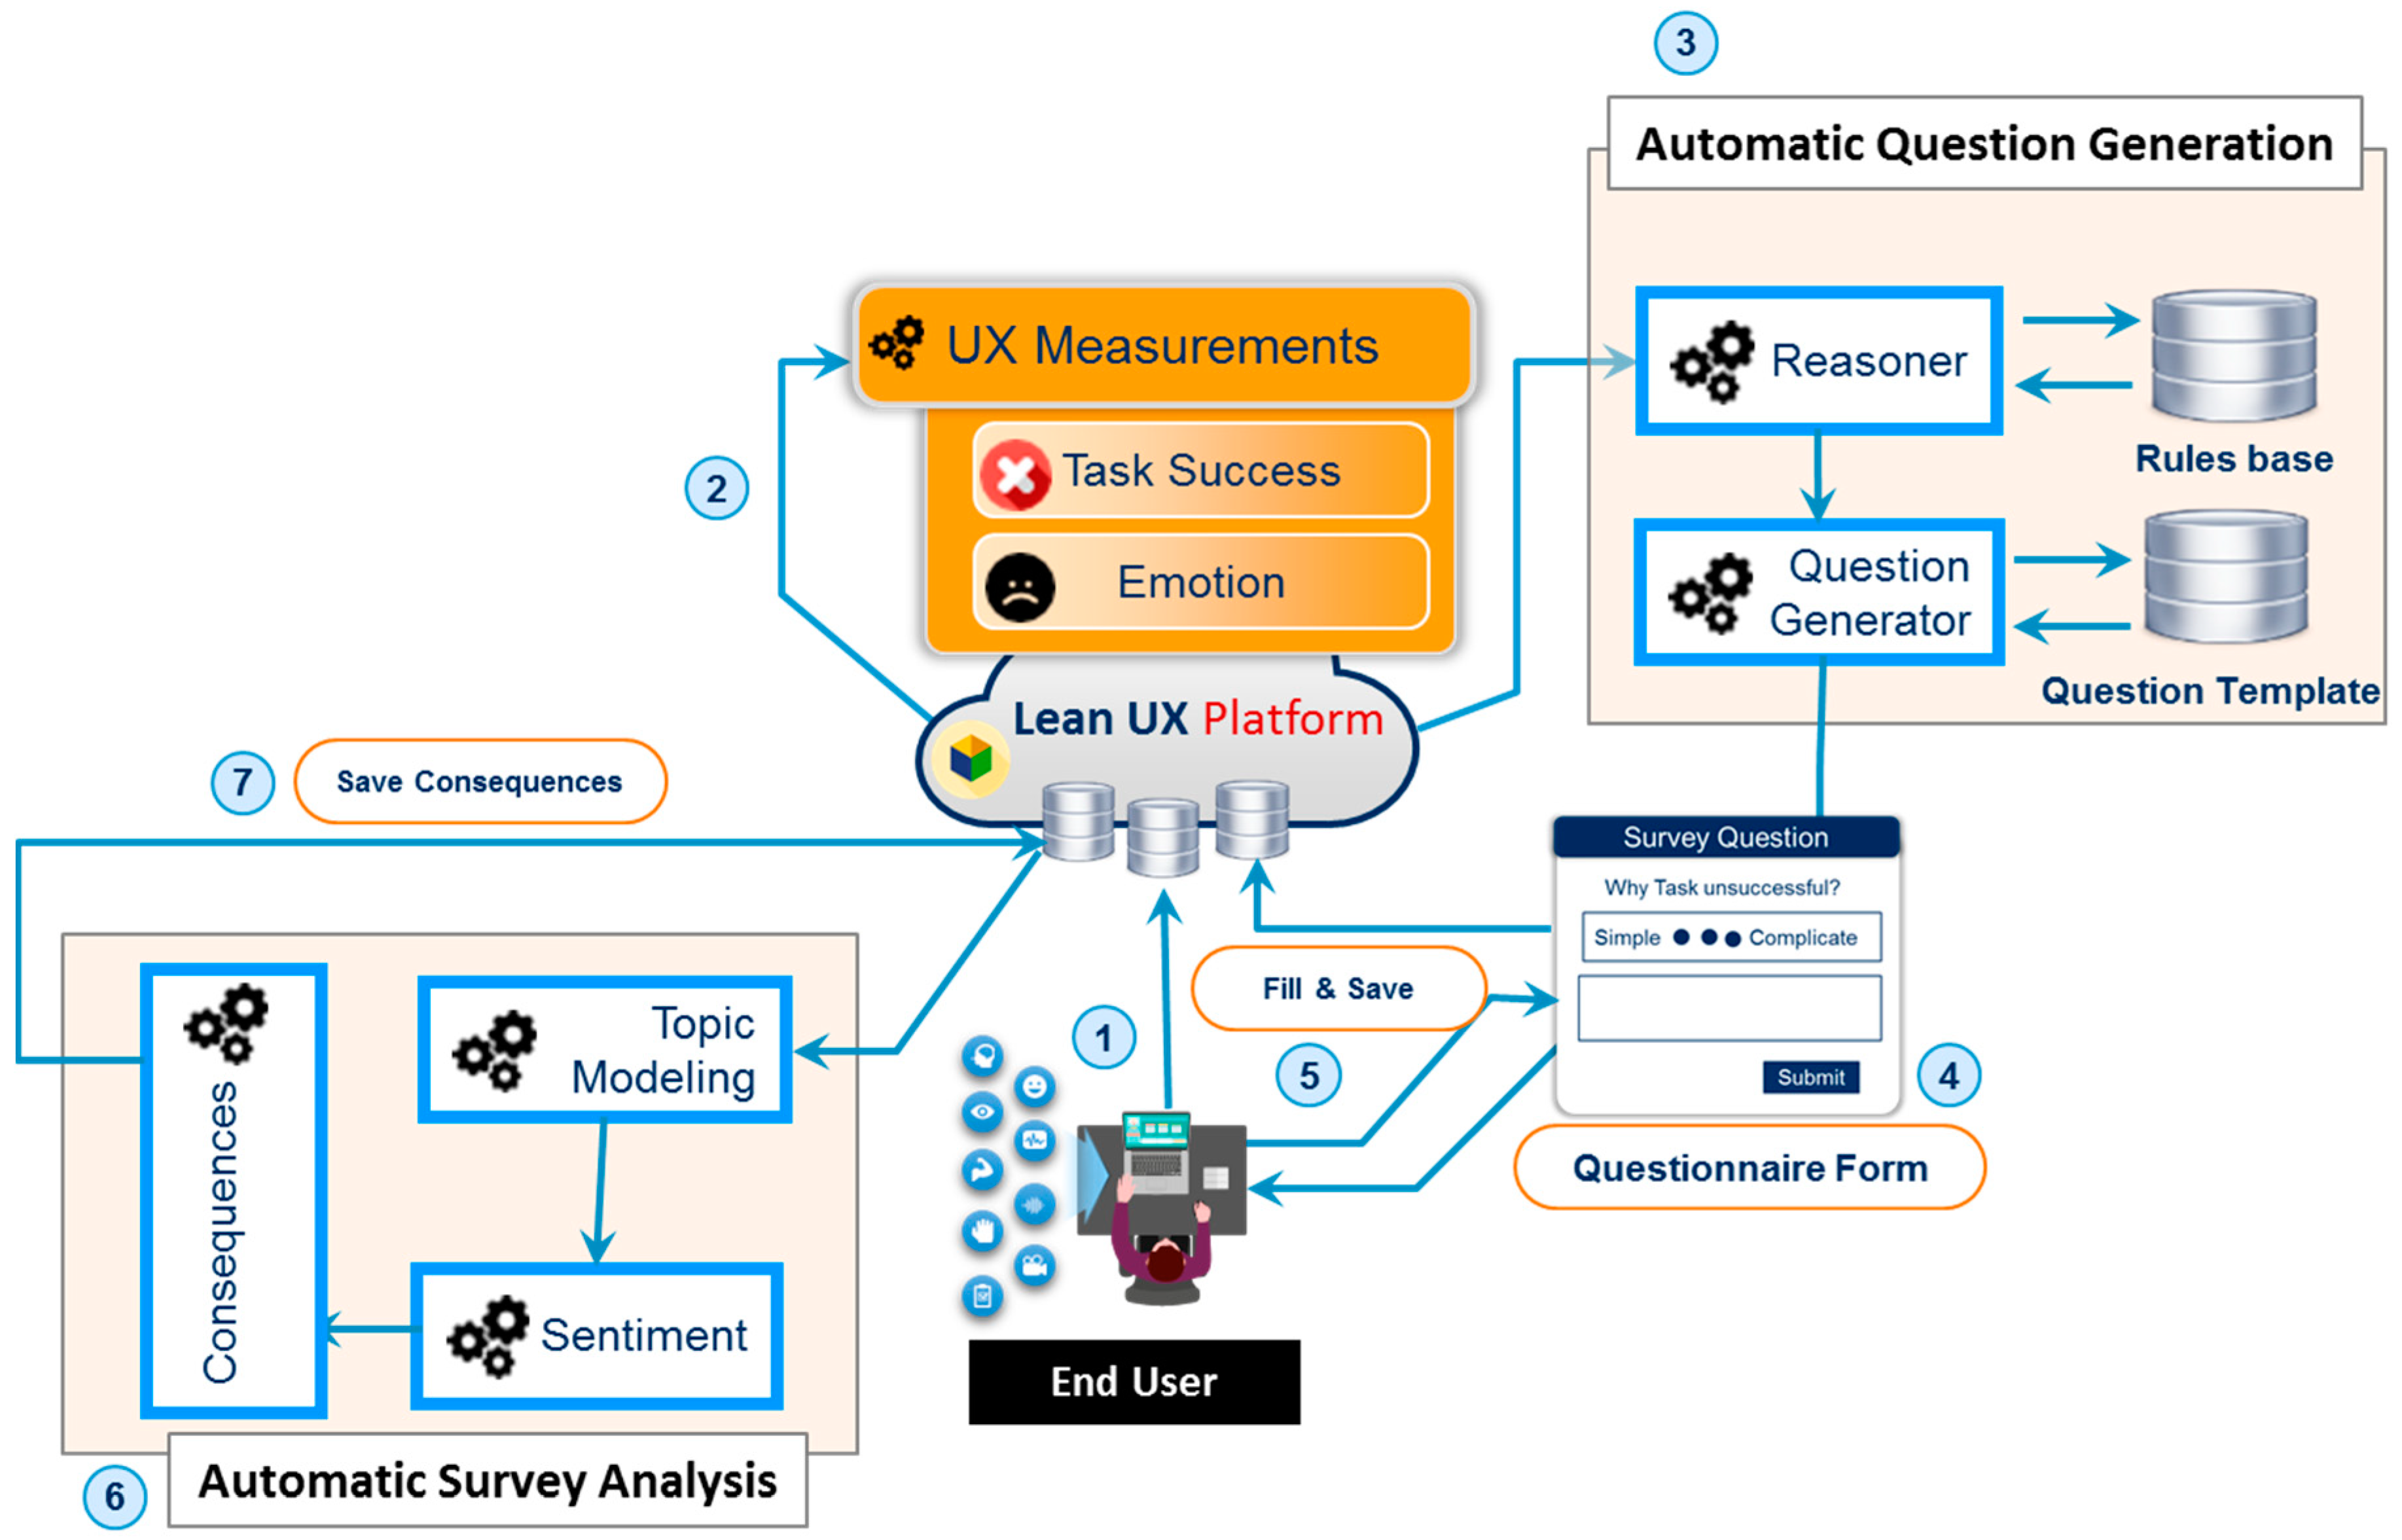
35] deal with post-tasks that explicitly ask questions about the participant for information about their opinion and their interaction with the system, for example, overall interaction, ease of use, satisfaction, effectiveness, and efficacy. It consists of two main modules: automatic question generation and automatic survey analysis. Automatic question generation asks questions based on UX measurement information that triangulates [
86] stated answers with biometric unconscious responses. The reasoner [
87] component uses the UX measurement information as input data, which are quantified by emotion and stress metrics and interaction metric modules. Based on input facts, the reasoner fires the rules. The fired rules are passed to the question generator, which uses the predefined question templates to ask selective questions against the post-task performed by the participant.
The rule base was constructed from the existing standardized usability and UX questionnaires, including AttrakDiff [
35], User Experience Questionnaire (UEQ) [
6], Questionnaire for User Interaction Satisfaction (QUIS) [
36], Single Ease Question [
88], Software Usability Measurement Inventory (SUMI) [
37], and Software Usability Scale (SUS) [
38]. The production rules “IF-THEN” was used to associate the selected questionnaires with post-task UX measurements from user observational data. First, we extracted all questions of bipolar words and merged the duplicate one, arranged it as an LTR (negative to positive), and assigned an ID to each bipolar word that uses an index, as shown in
Appendix Table A1, to load the bipolar word based on the reasoner action. Accordingly, the question template is filled by the question generator module. The partial list of candidate rules is presented in
Table 1.
We created predefined templates that store the question template repertory by ID, such as T1. One sample question template structure that uses the question generator component is the following:
The question generator selects and completes the template based on the resultant fired rules, e.g., R1, R3, and R4 based on the UX measurements facts.
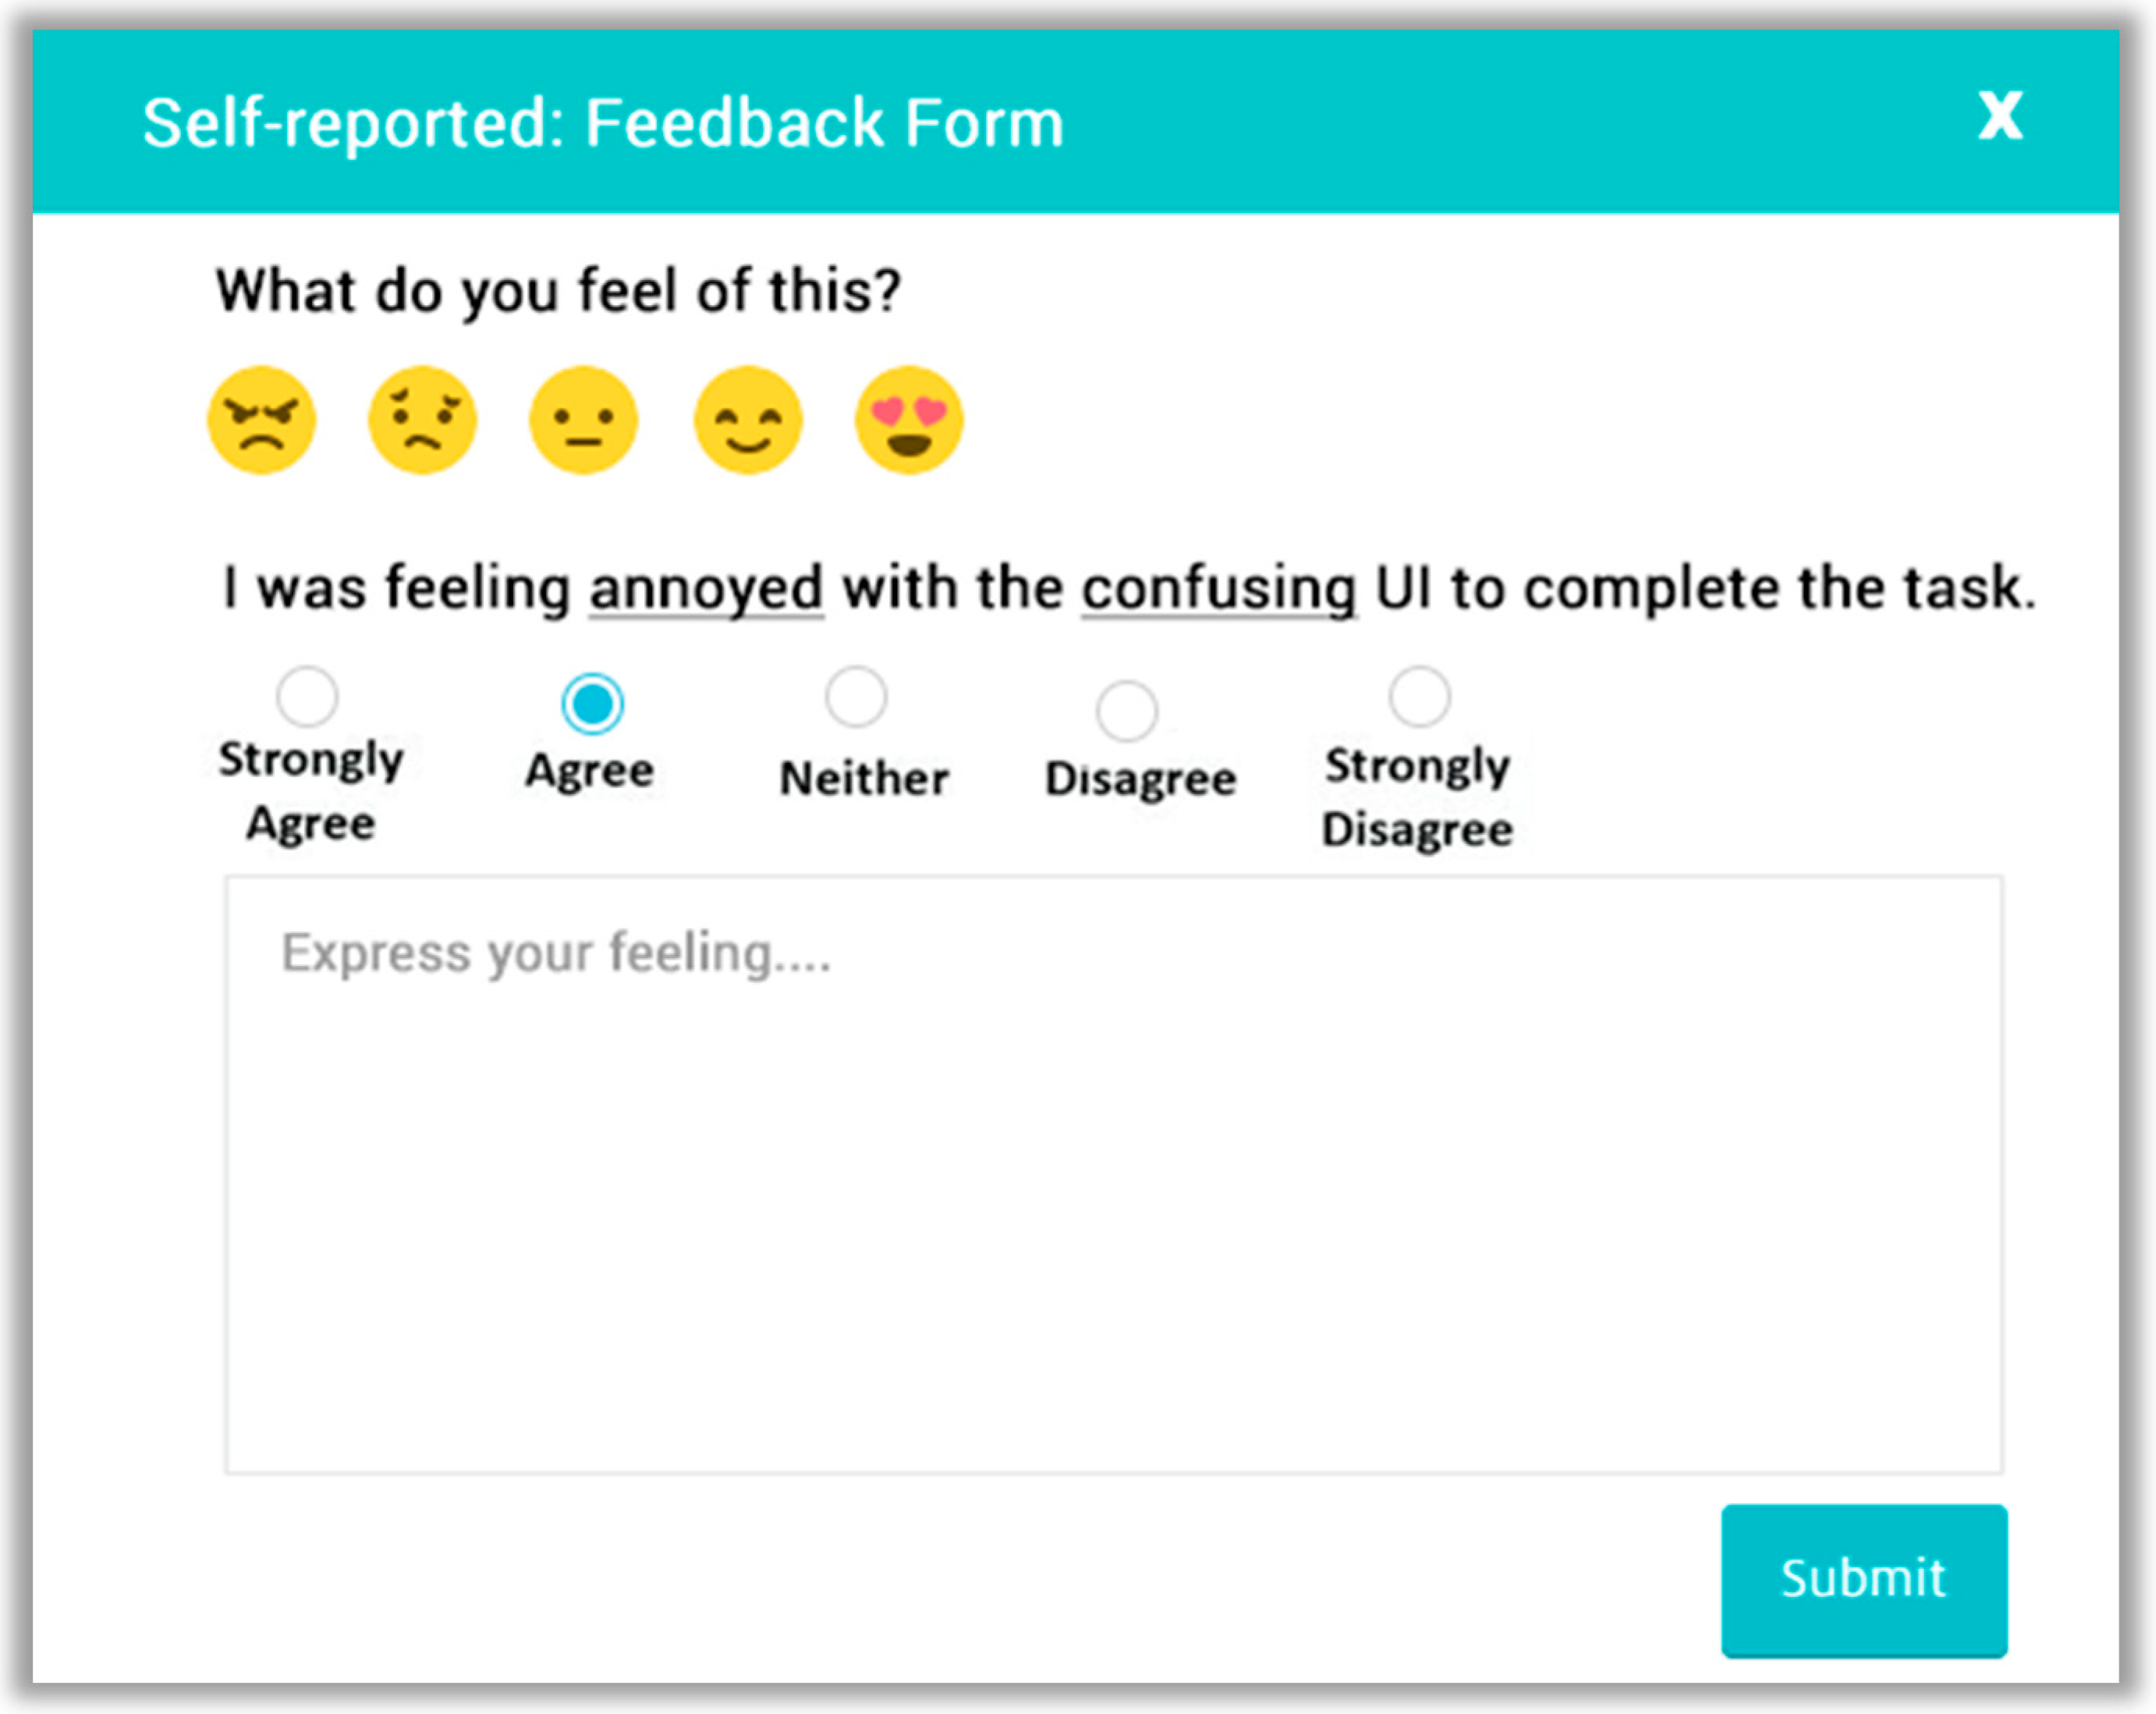
Example 1. I was feeling annoyed with the confusing UI to complete the task.
Example 2. I was feeling unfriendly with the unpleasant UI to complete the task.
Example 3. I was pleased with the time taken to complete the task.
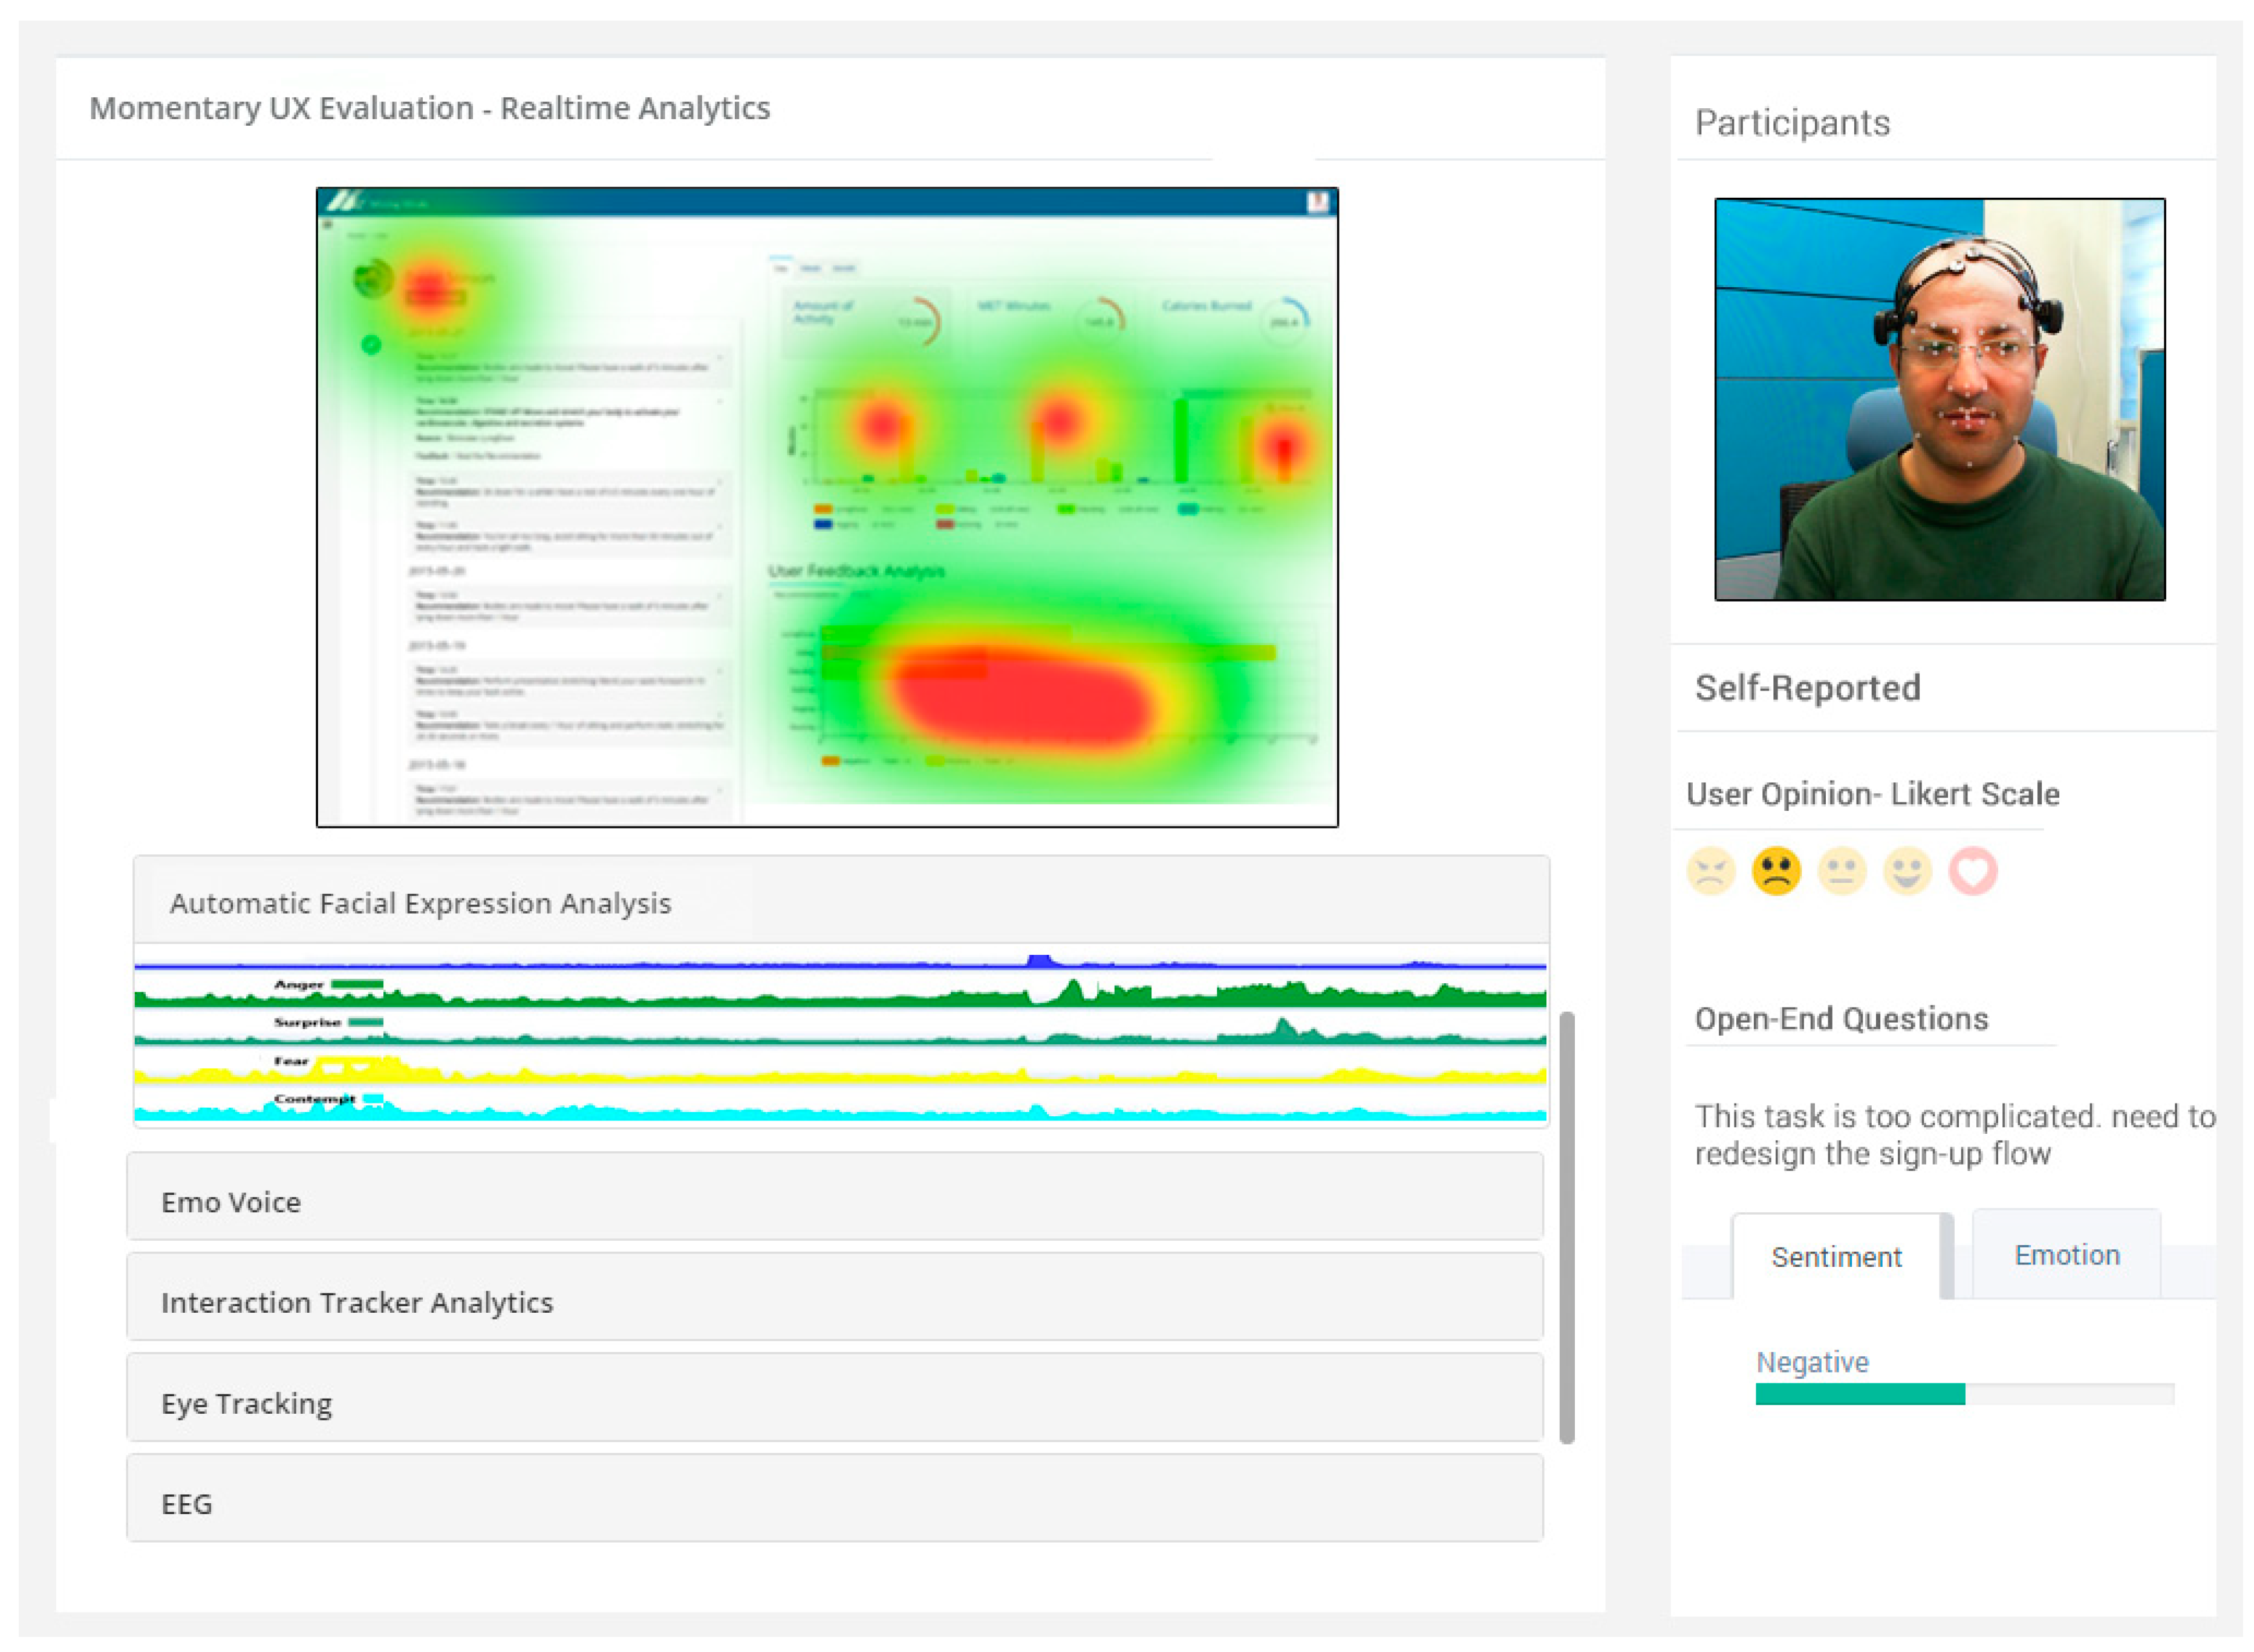
Additionally, the question generator adds a free text field, user emotions Likert scale emoticons as shown in
Figure 6 and then sends it to the participants for obtaining the response. The obtained user’s response is persisted in the database for analysis.
The automatic survey analysis deals with the analysis of closed-ended and open-ended questionnaires. Analysis of the former deals with the response transformation, measurement of central tendency, variance, confidence interval, and scale consistency by assigning the questions items to UX model. For example, word annoying belongs to the “attractiveness”, and “confusing” belongs to the “perspicuity” of UX scale. Based on that UX scale, UX moderator evaluates the UX of the project.
The latter analysis deals with the free text user responses. First, it loads all user free text responses, which are preprocessed before applying the topic modeling using Latent Dirichlet Allocation (LDA). LDA is an unsupervised generative statistical model, which assumes that each document may be consisted of different topics and words distribution over each topic. We implemented the pyLDAvis (
https://github.com/bmabey/pyLDAvis), a python library for interactive topic model visualization for the extraction of topics from the collected user’s feedback. All the collected user’s textual feedbacks are processed by preprocessor module to remove the numeric data, erase punctuation, remove stop words, convert text into lower case, and stemming. We set number of topics to 30, 50 number of words per topic, and 1000 number of iterations to interpret the results. LDA extracts the topics and assigns a topic name based on dictionary words. Based on the collected topics on a different project, we will extract the important UX constructs/dimensions, for the inclusion in the UX model.
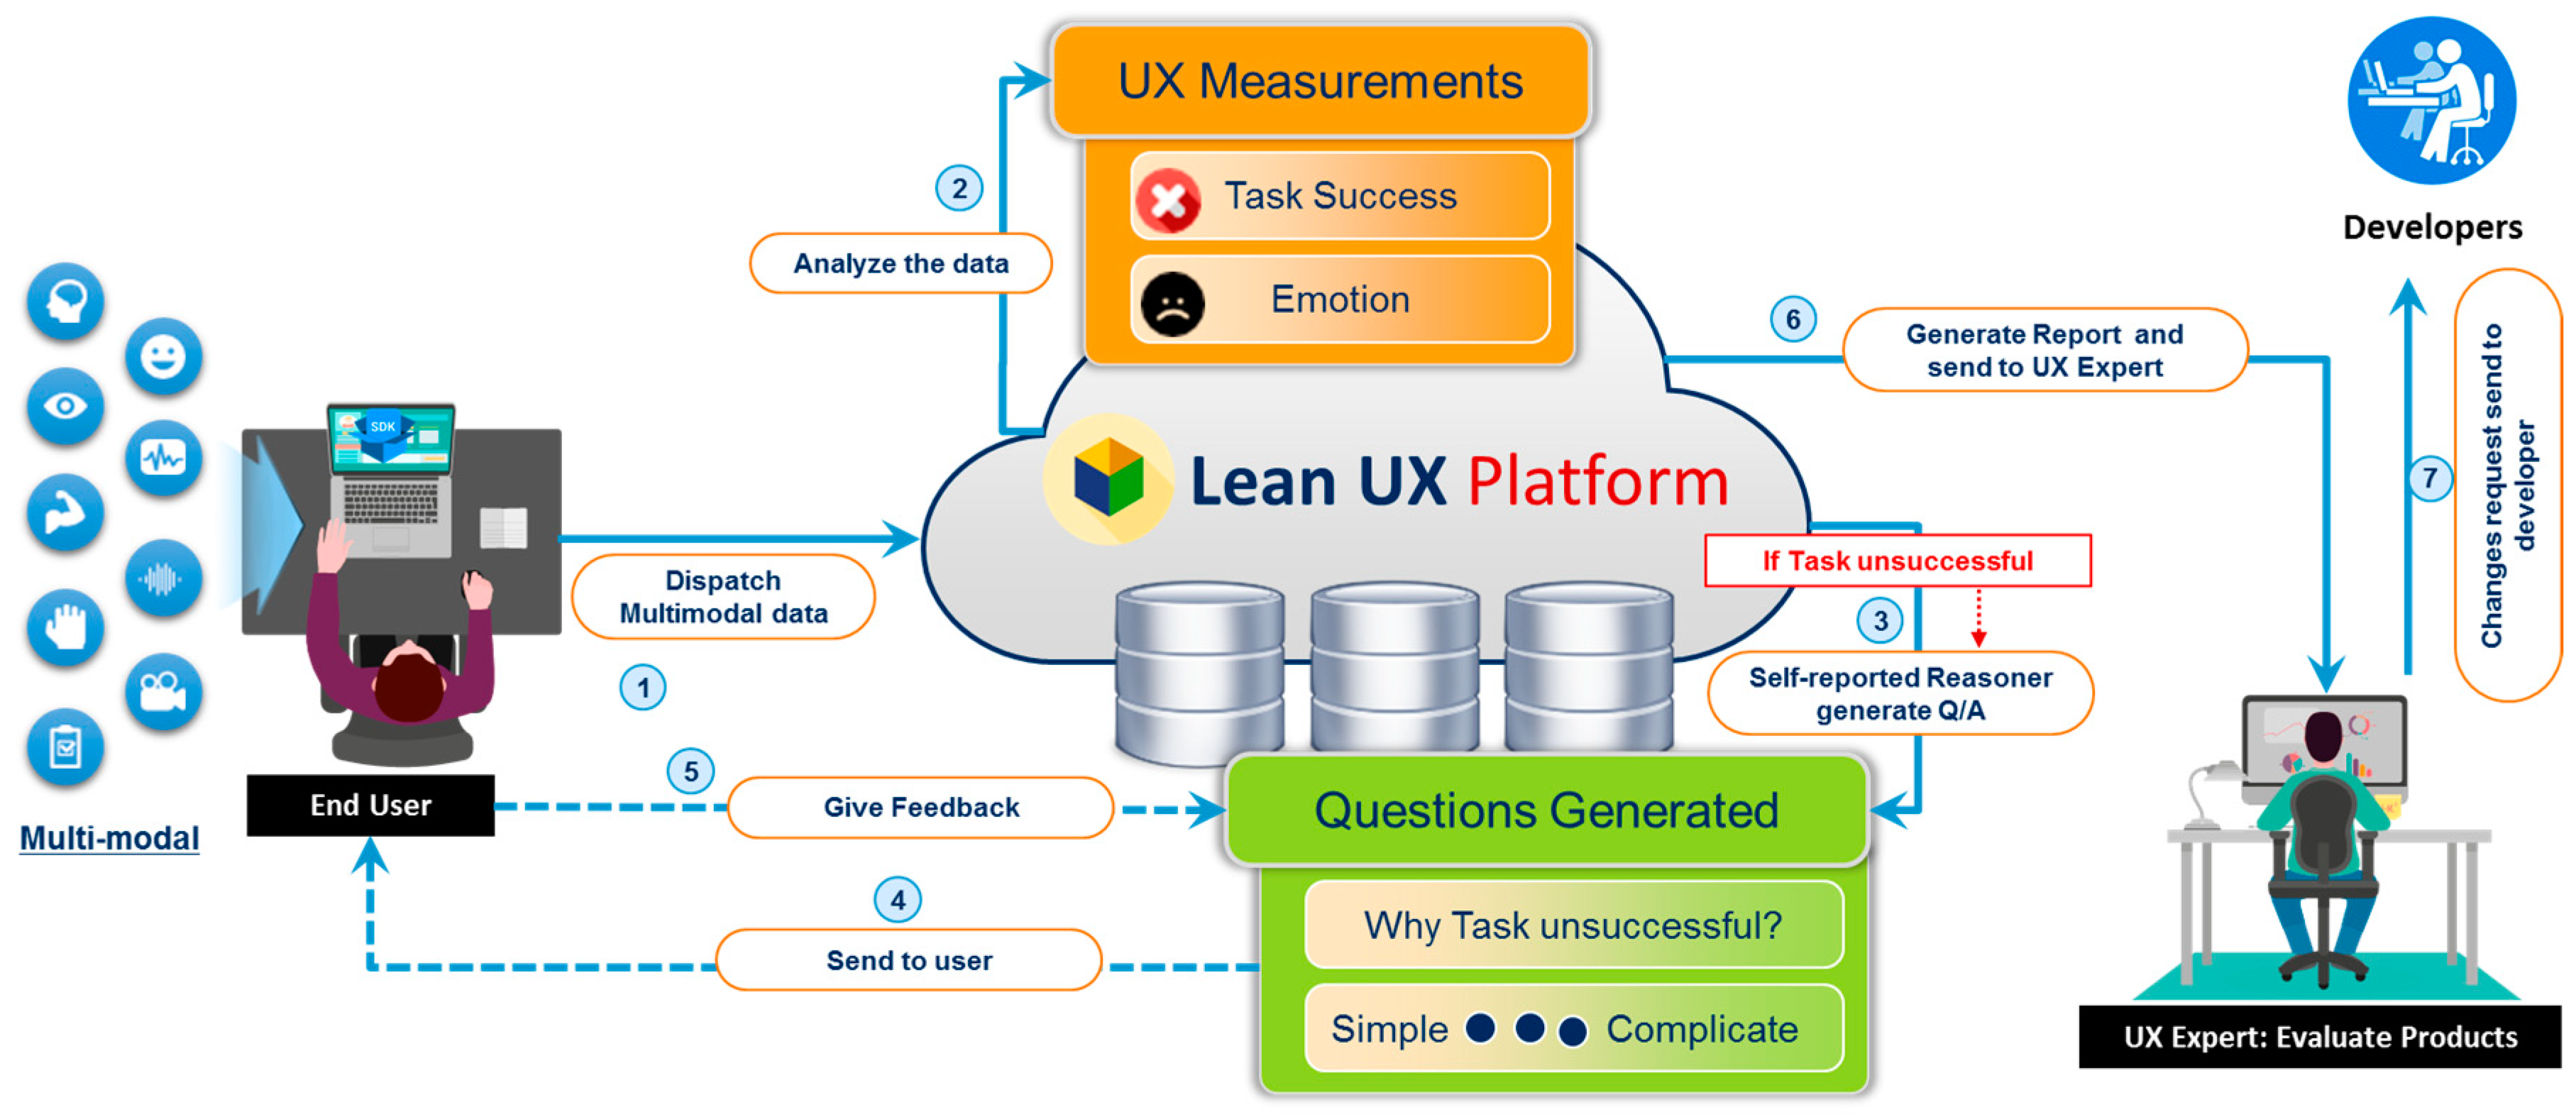
We have built the classifiers to classify the user textual feedback either as positive or negative along with emotions using automatic survey analysis module. Both positives and negatives user feelings are related to the post-task for determining the UX consequences. The overall workflow of the aforementioned process of the self-reporting metric is shown in
Figure 7.
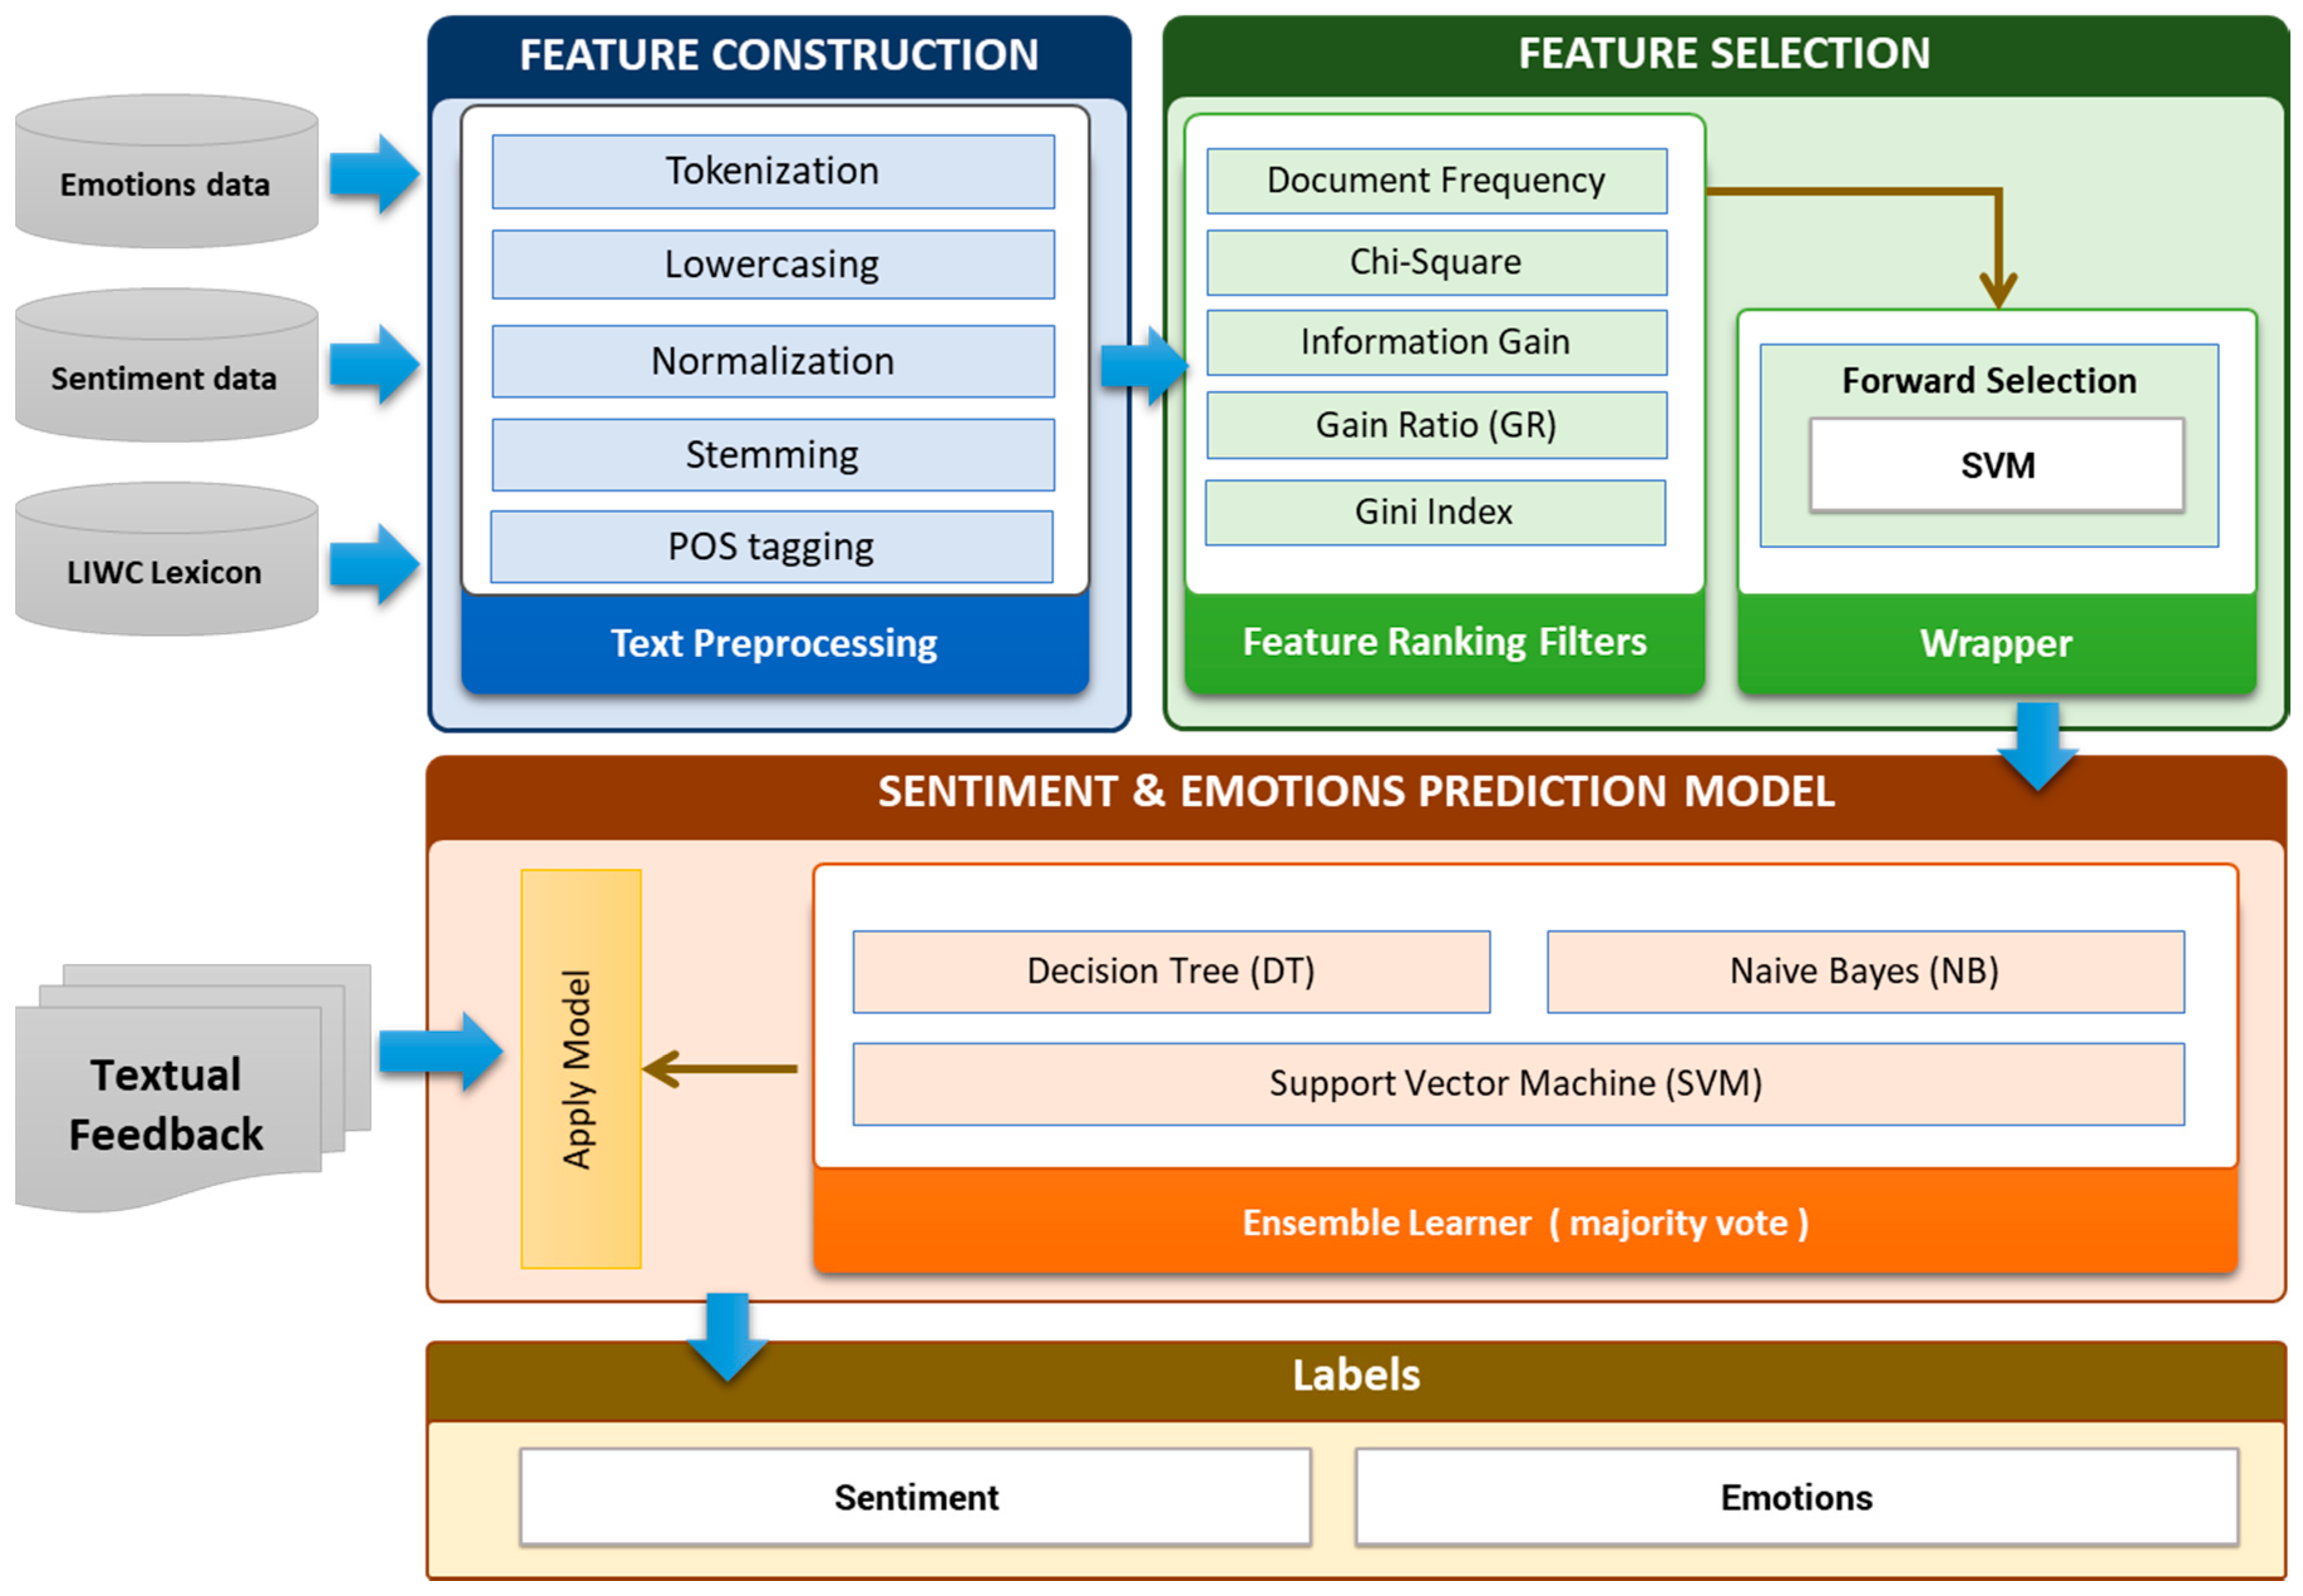
The workflow of sentiment and emotion analyzer is shown in
Figure 8. The workflow consists of three main steps (a) Feature construction (b) Feature Extraction and Selection (c) Learning of prediction model. The details of these steps are described in the subsequent sections.
(a) Feature construction
In text classification, conversion of text into feature vector is an essential task. The construction of an adequate feature space from the raw and unstructured text for better learning performance is necessary for text classification. It is essential to include only relevant/appropriate features for text representation. In the recent literature, different features representation methods have been used to represent text, for textual classification. These are bag-of-words (BOW), linguistic patterns using part-of-speech (POS) tags, high order n-gram features (character n-grams and word n-grams), dependency parsing tree, semantic features (lexicons and dictionaries) and structural features [
89,
90]. In this study, we used BOW, POS tags, semantic features (lexicons and dictionaries). For feature construction, we have applied preprocessing step to make the initial feature vectors which are suitable for further feature extraction and selection process. The preprocessing step contains tokenization, stop-word removal, and stemming (Porter algorithm). We used PENN Treebank scheme [
91] for POS tagging pattern. For example, the feature “excellent interface” filtered by the POS tag pattern “JJ NN” and “was disappointed” feature is filtered out by the pattern “VBD VBN”. TF-IDF term weight scheme have been applied for word vector creation.
(b) Feature Selection
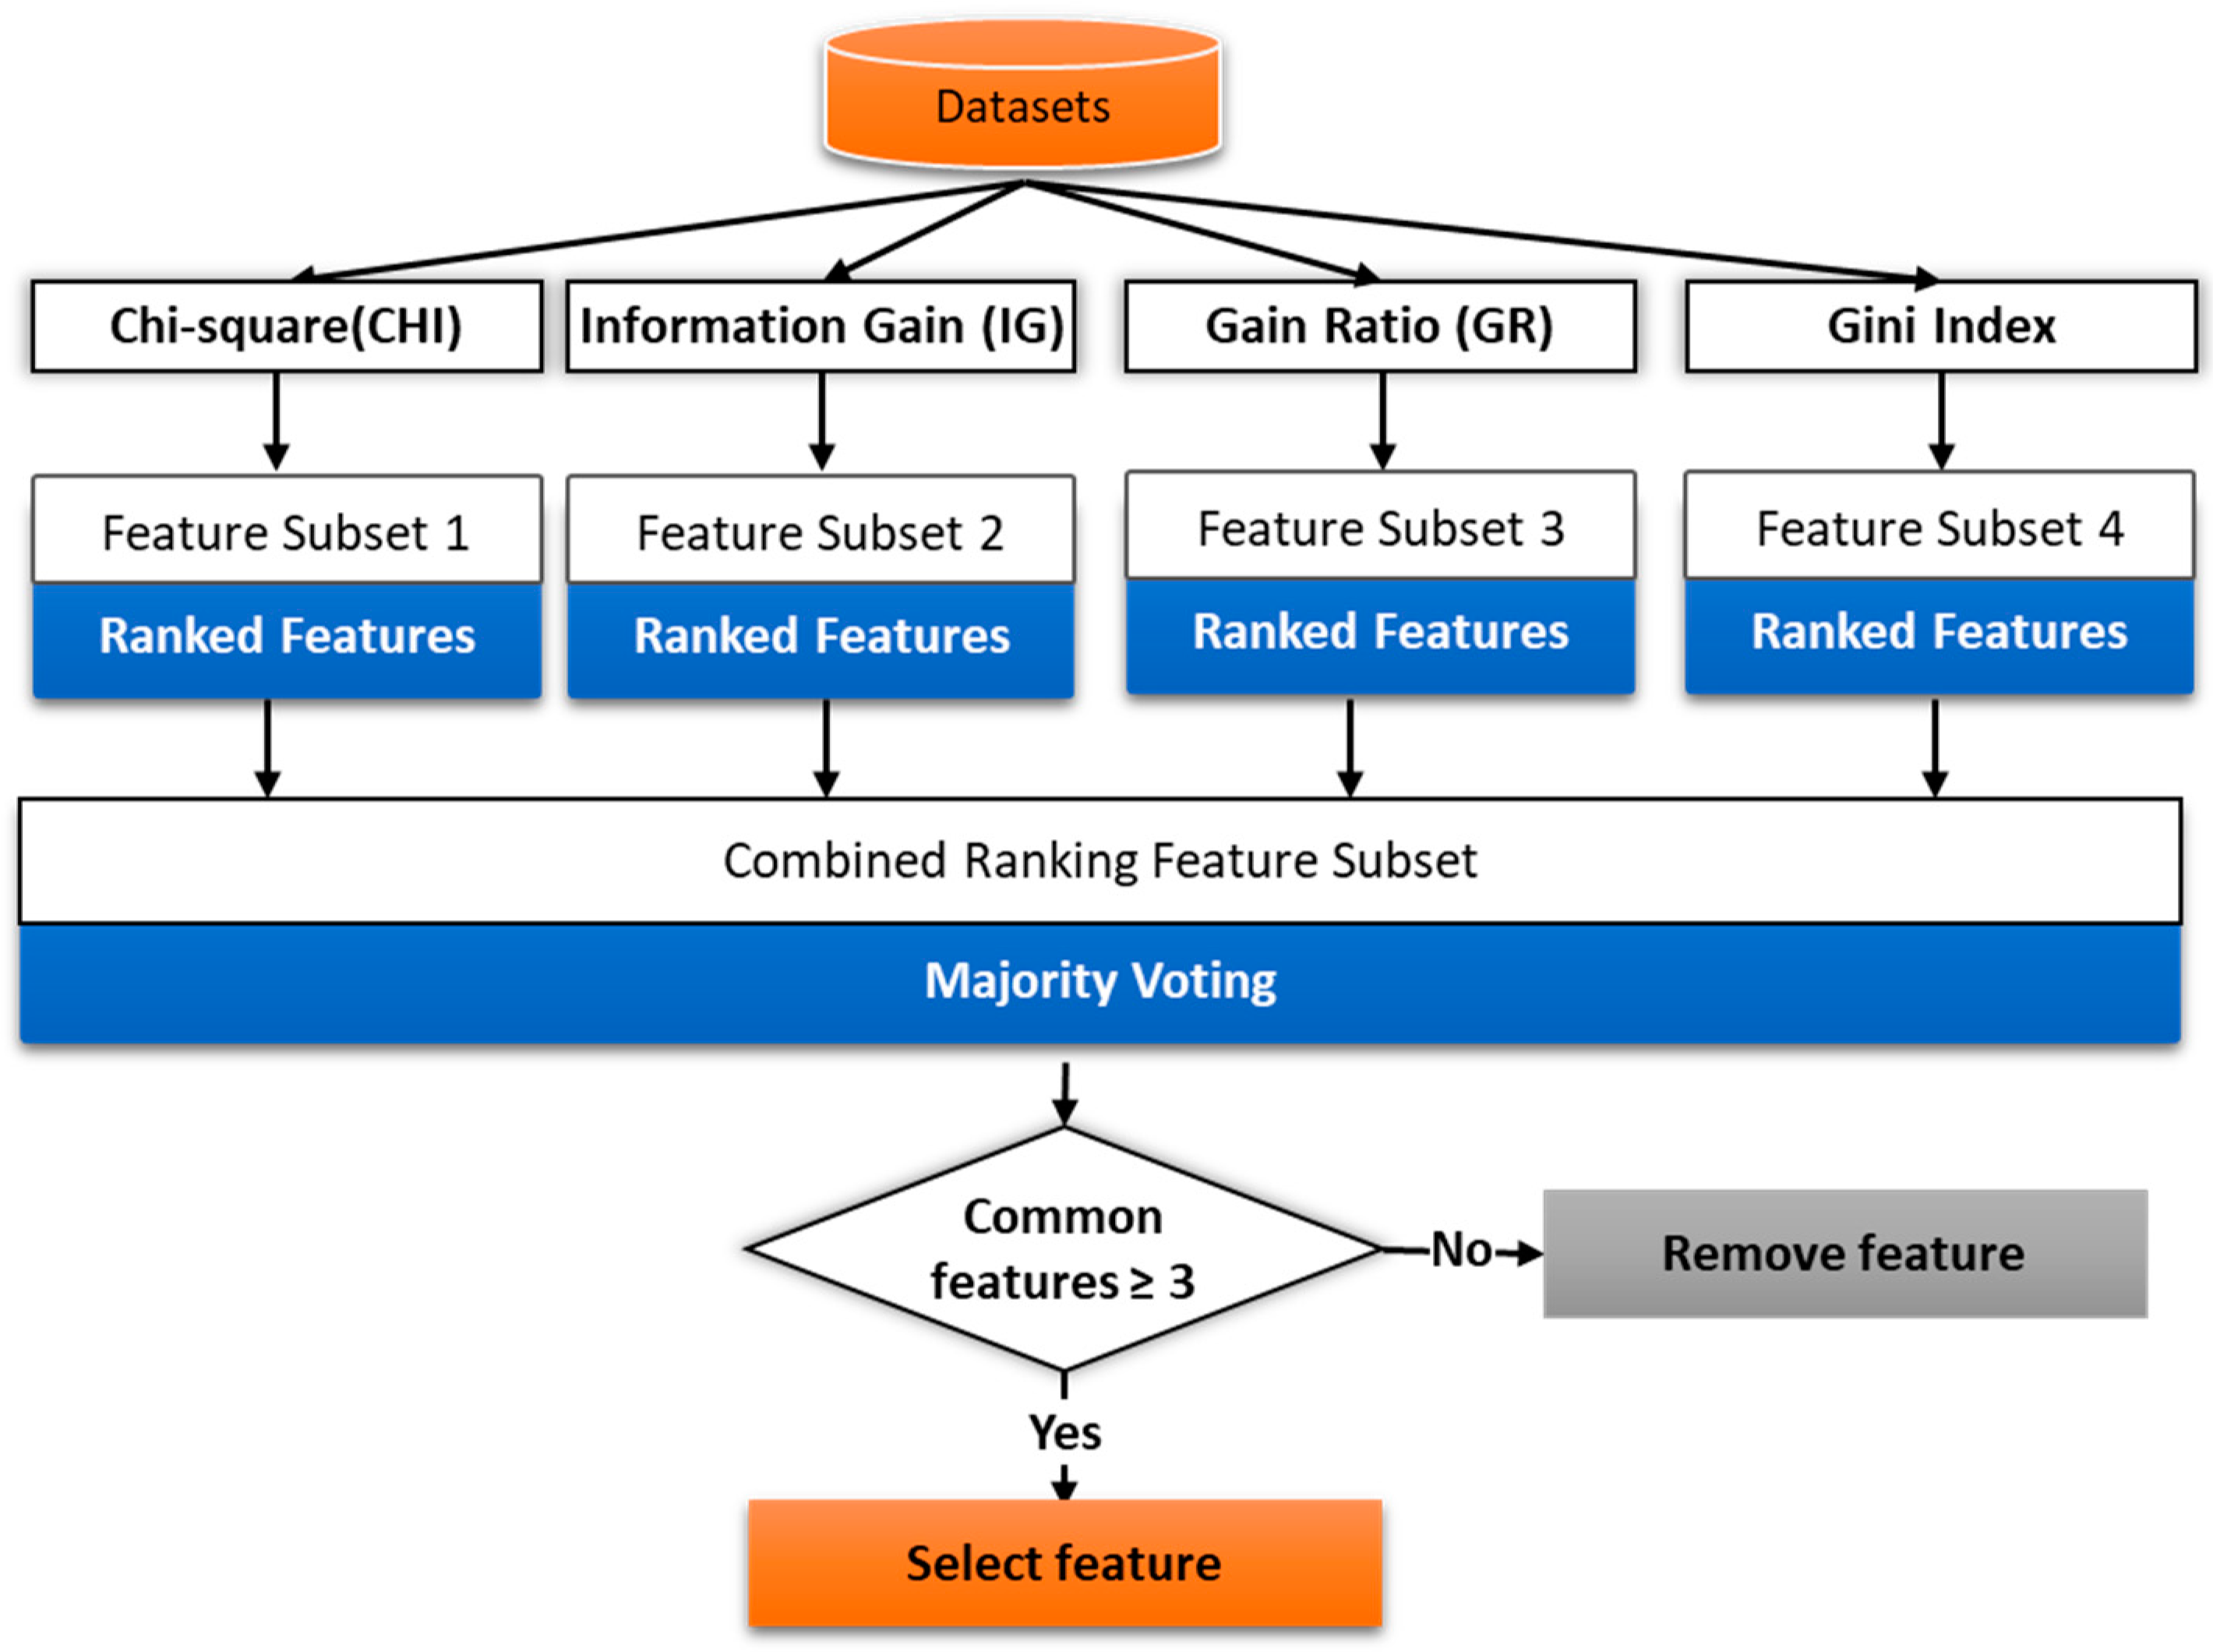
Feature selection is the way to extract and select the most important and relevant features. It reduces the dimensionality feature space without losing too much information for an accurate prediction. The selected features are used to train the predictive model. We have employed filter method and wrapper method for effective features selection. In the filtering method, the subset of important features/relevant features is selected by ranking them according to specific scoring schemes based on the intrinsic properties of the features. The low scoring features are removed while highest scoring features are selected. The filter uses a fast evaluation function and is independent of the classifier. In the filter based method, we have used the filters like chi-square, Gini index, gain ratio, and information gain as shown in
Figure 9.
The word-vector is input in feature selection module. The individual filter assigns weight to each feature using their internal logic and select the initial subset features. We apply the majority voting method for the final feature selection. We set the threshold value to 3 that checks for common features selected by at least three filters. Then we have applied the wrapper method (forward selection process), in subset feature selection. In wrapper method, various subsets of features are generated and evaluated. The forward selection starts with an empty selection of features/attributes and, in each iteration, it adds new attribute of the given recordset. We have applied 10-fold cross-validation using SVM learner to estimate the performance, if the added attribute gives the higher performance then is added to the selection. Then a new round is started with the modified selection. We have added the stopping behavior to stop the iteration if no significant increase in performance.
(c) Learning prediction model (Ensemble Learner)
We have employed the ensemble learning method for sentiment and emotion classification. Ensemble learning combines the predictions of multiple base learners to improve performance over a single learner. In this work, we have employed majority voting technique in conjunction with three base learners namely, Support Vector Machine (SVM), Naïve Bayes (NB) and Decision Tree. Based on the majority voting of base learners, the user textual feedback is classified into either positive or negative class along with basic emotions (Joy, anger, fear, sadness, and surprise).

 ,
, 


