1. Introduction
Exotic pathogens have caused irreversible damage to flora and fauna within a range of ecosystems worldwide. Popular outbreaks include the enormous devastations of chestnut blight (
Endothia parasitica) on American chestnut trees (
Castanea dentata) in the U.S. [
1,
2,
3], sudden oak death (
Phytophthora ramorum) on oak populations (
Quercus agrifolia) in Europe, California, and Oregon [
4,
5,
6], dieback (
Phytophthora cinnamomi) on hundreds of hosts globally [
7,
8,
9], and myrtle rust (
Austropuccinia psidii) on Myrtaceae family plants in Australia [
10,
11,
12,
13]. The effects of the latter case have raised national alerts and response programmes given the extensive host range and the ecological and economic importance of Myrtaceae plants in the Australian environment [
14,
15,
16,
17]. As a result, various surveillance and eradication programmes have been applied in an attempt to minimise the impacts invasive pathogens cause on local hosts such as dieback in the Western Australia Jarrah forests [
18], sudden oak death in the tan oak forests of the U.S. [
19], and rapid ohia death (
Ceratocystis fimbriata) on ohia trees (
Metrosideros polymorpha) in Hawaii [
20].
Modern surveillance methods to map hosts vulnerable to and affected by exotic pathogens can be classified in site-based and remote sensing methods, according to Lawley et al. [
21]. Site-based approaches are commonly small regions used to collect exhaustive compositional and structural indicators of vegetation condition with a strong focus on biophysical attributes of single vegetation communities [
22,
23]. These methods, nonetheless, require deep expertise and time to conduct experimentation, data collection, and validation that, along with their limited area they can cover, represent a challenge while assessing effects on a broad scale [
24]. Research has also suggested the design of decision frameworks to monitor and control the most threatened species [
17,
25,
26]. Although these models can determine flora species that require immediate management control, limitations on the amount of tangible, feasible, and broad quantified data of vulnerable host areas [
21] have resulted in lack of support from state and federal governments [
11].
The role of remote sensing methods to assess and quantify the impacts of invasive pathogens in broad scale has increased exponentially [
27,
28]. Standard approaches comprise the use of spectral and image sensors through satellite, manned, and unmanned aircraft technology [
29]. Concerning sensing technology by itself, applied methods by research communities include the use of non-imaging spectroradiometers, fluorescence, multispectral, hyperspectral, and thermal cameras, and light detection and ranging (LiDAR) technology [
30,
31,
32,
33]. These equipment are usually employed for the calculation of spectral indexes [
34,
35,
36,
37] and regression models in the host range [
38,
39]. Nevertheless, these methods are mainly focused on quantification and distribution, among other physical properties of flora species.
Satellite and manned aircraft surveys have reported limitations concerning resolution, operational costs, and unfavourable climate conditions (e.g., cloudiness and hazard winds) [
40]. In contrast, the continuous development of unmanned aerial vehicles (UAVs) designs, navigation systems, portable image sensors and cutting-edge machine learning methods allow unobtrusive, accurate, and versatile surveillance tools in precision agriculture and biosecurity [
41,
42,
43,
44]. Many studies have positioned UAVs for the collection of aerial imagery in applications such as weed, disease, and pest mapping and wildlife monitoring [
21,
45,
46,
47]. More recently, unmanned aerial systems (UASs) have been deployed in cluttered and global positioning system (GPS)-denied environments [
48].
Approaches to the use of UAVs, hyperspectral imagery and artificial intelligence are gaining popularity. For example, Aasen et al. [
49] deployed UAS to boost vegetation monitoring efforts using hyperspectral three-dimensional (3D) imagery. The authors of Nasi et al. [
50] developed techniques to assess pest damages at canopy levels using spectral indexes and k-nearest neighbour (k-NN) classifiers, achieving global detection rates of 90%. Similar research focused on disease monitoring, however, has been limited. The authors of Calderon et al. [
51], for instance, evaluated the early detection and quantification of verticillium wilt in olive plants using support vector machines (SVMs) and linear discriminant analysis (LDA), obtaining mixed accuracy results among the evaluated classes of infection severity (59–75%) [
52]. The authors of Albetis et al. [
53] presented a system to discriminate asymptomatic and symptomatic red and white vineyard cultivars by
Flavescence doree, using UAVs, multispectral imagery, and up to 20 data features, collecting contrasting results between the cultivars and maximum accuracy rates of 88%. In sum, the integration of site-based and remote sensing frameworks have boosted the capabilities of these surveillance solutions by combining data from abiotic and biotic factors and spectral responses, respectively [
54]. However, this synthesis is still challenging due to the high number of singularities, data correlation, and validation procedures presented in each case study.
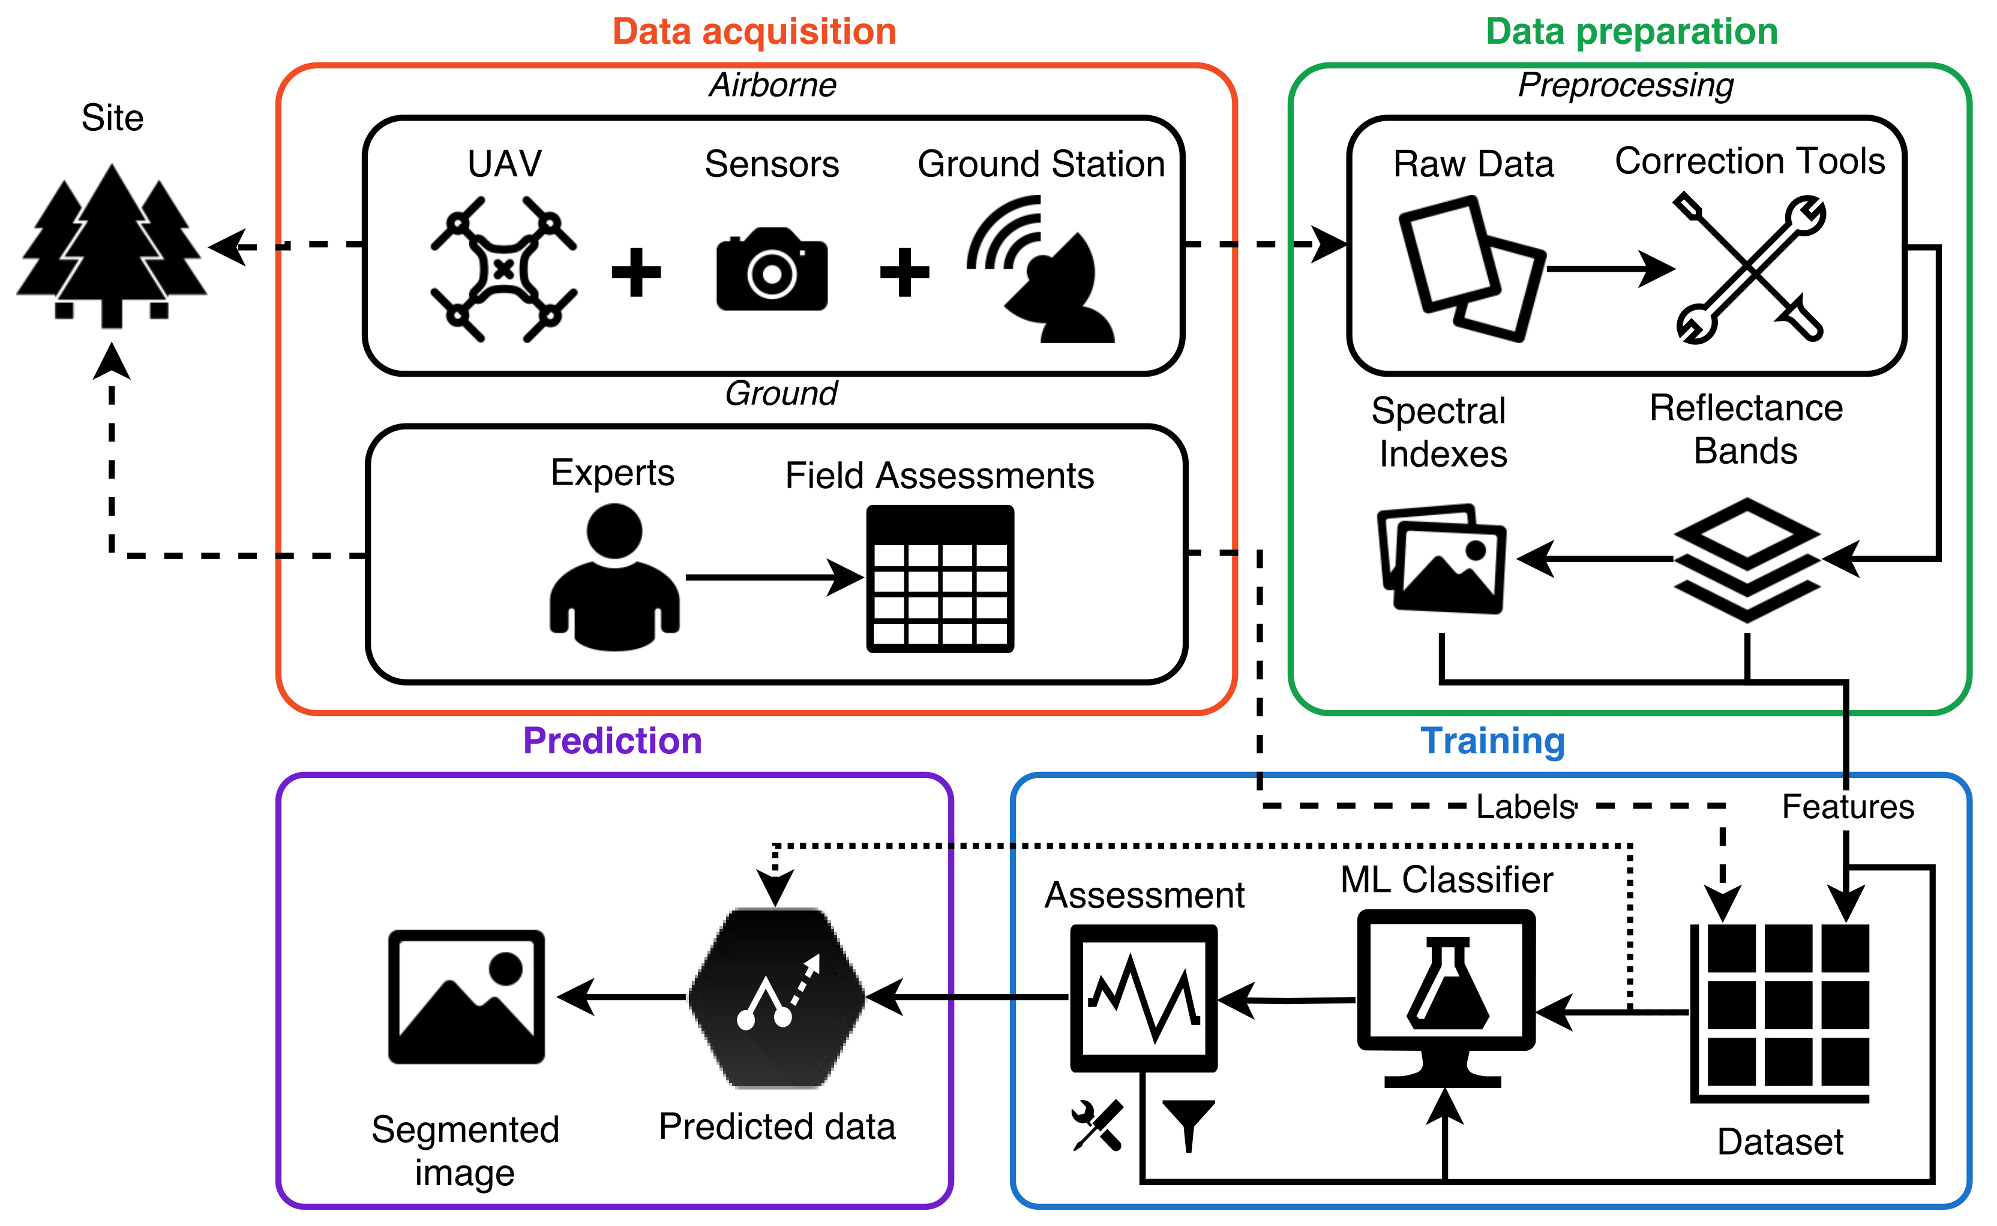
Considering the importance of site-based and remote sensing methods to obtain reliable and broader assessments of forest health, specifically, for pest and fungal assessments [
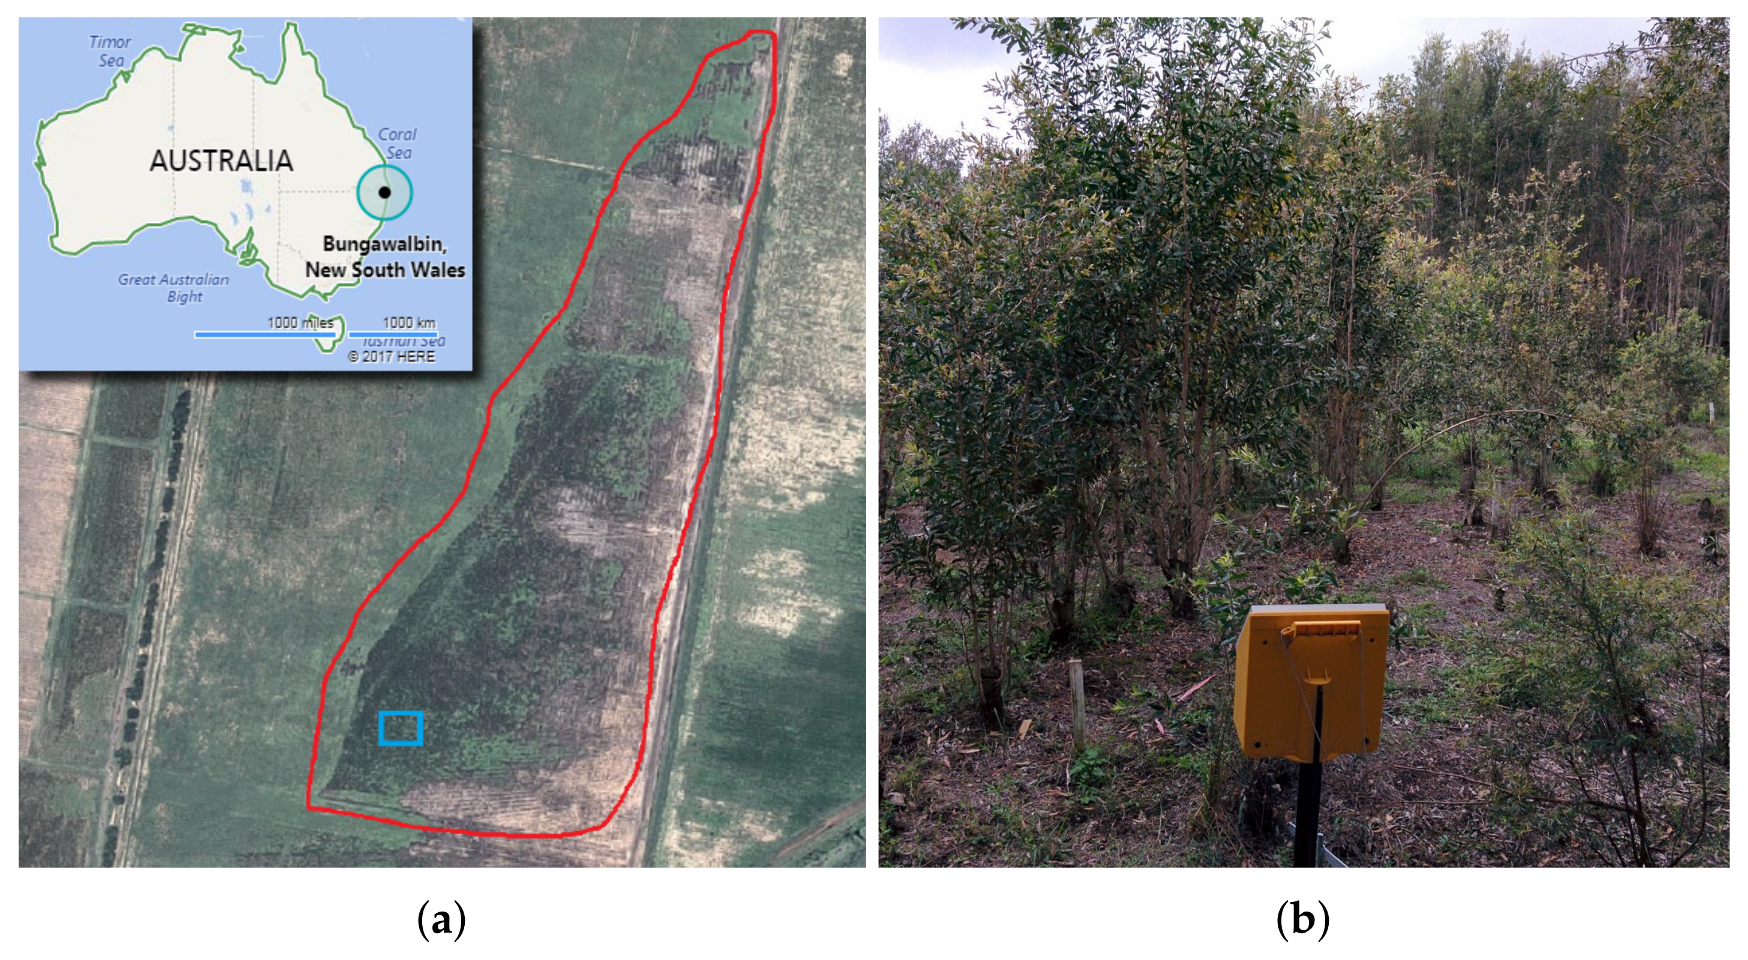
55], this paper presents an integrated system that classifies and maps natural and plantation forests exposed and deteriorated by fungal pathogens using UAVs, hyperspectral sensors, and artificial intelligence. The framework is exemplified by a case study of myrtle rust on paperbark tea trees (
Melaleuca quinquenervia) in a swamp ecosystem of Northeast New South Wales (NSW), Australia.
4. Results and Discussion
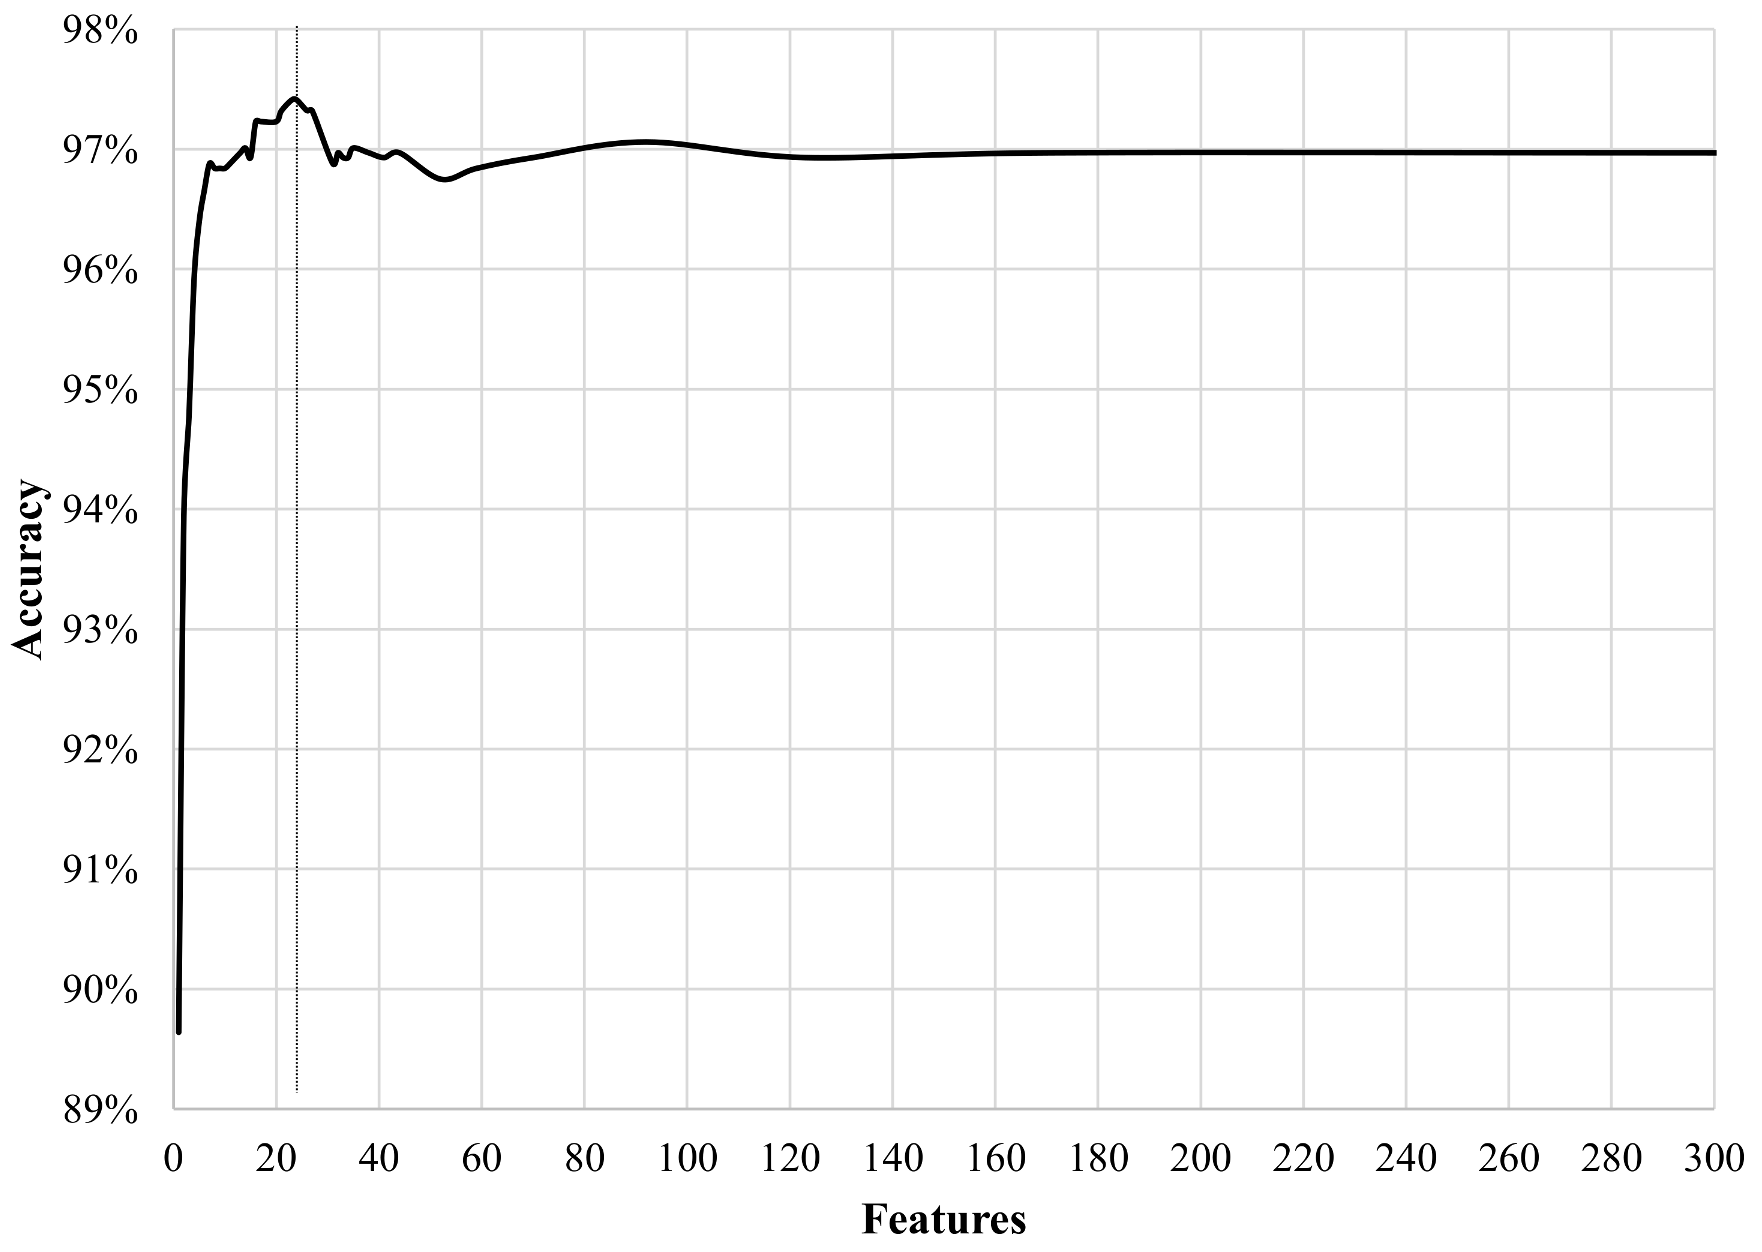
To visualise the benefits of inserting an optimisation scheme in Step 8 of Algorithm 1, detection rates were tracked by training and running the classifier multiple times with only a set of filtered features per instance. The features were ranked with their relevance by the XGBoost classifier and sorted consequently, as illustrated in
Figure 7.
The classifier can achieve high accuracy rates exceeding
of global accuracy when it processes data using from 10 to 40 features only, with an optimal number of features of 24. On the other hand, the classifier merely improves their registers when the number of processed features is more substantial. With this capability, the proposed approach can process fewer data and reduce the number of calculations to achieve high detection values. Additionally, this boosts the capability of the algorithm of processing large datasets in less time, an ideal scenario for mapping vast rural areas. The most relevant features of this study case are depicted in
Table 1 and
Figure 8.
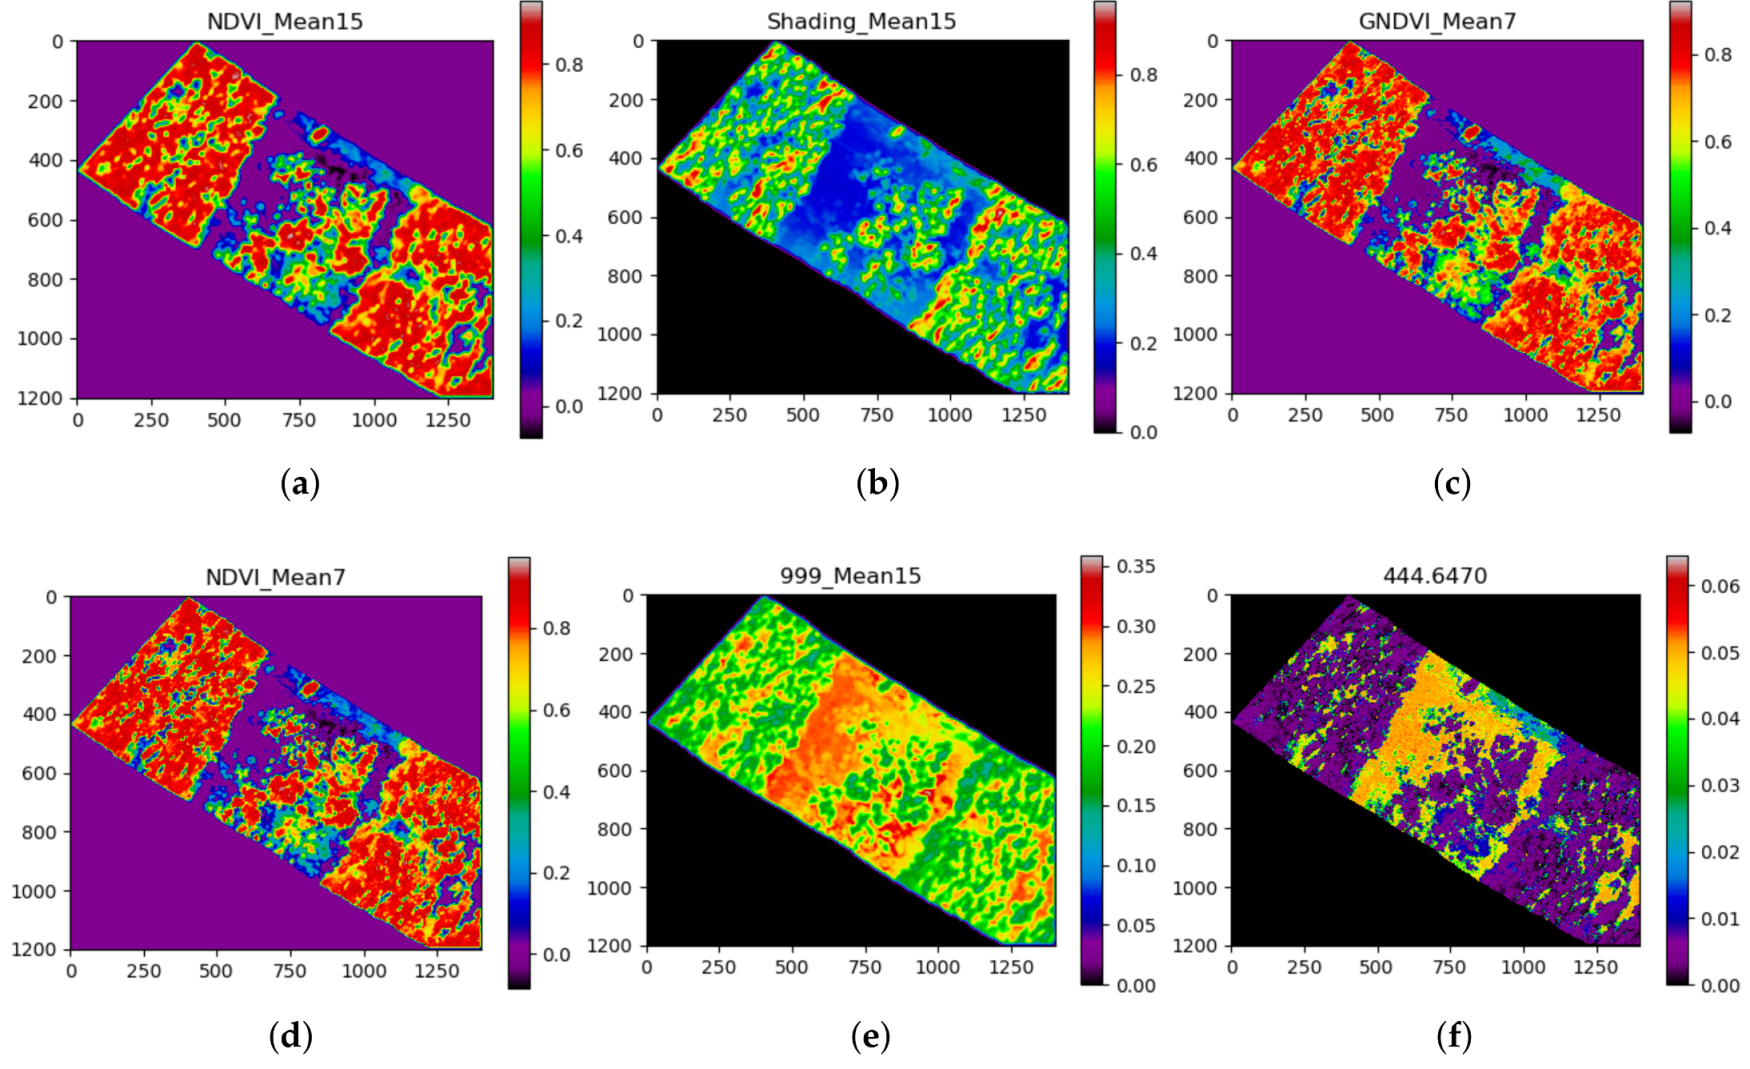
It is shown how the first four features for this classification task come from specific vegetation indexes and processed images by 2D kernels—specifically, NDVI, shading, and GNDVI features (
Figure 8a–d). Although their illustrations show insights of distinguishable intensities between healthy and affected tree regions from
Figure 5, these sets of features are insufficient for segmenting areas of other objects. Thus, specific reflectance wavelengths bands such as 999 and 444 nm (
Figure 8e,f) are also determinant. Additionally, features processed with 2D kernels obtained better relevance scores than their unprocessed counterparts. That difference was even greater for processed features using big window kernels considering that high amounts of noise, common in raw hyperspectral imagery, altered the performance of the approach. Nonetheless, these rankings do not suggest that these features can be used as global indicators to detect and map similar case studies (myrtle rust); the feature ranking table showed here is relevant to the fitted XGBoost model only, and results may differ if the same features are processed through other machine learning techniques. It is recommended, therefore, to perform individual analyses for every case study.
A total of
pixel contained in 23 features filtered by their relevance were read again in Step 14 of Algorithm 1. Data was divided into a training array
with 9108 pixel and a testing array
with 2277 pixel. The generated confusion matrix of the classifier and its performance report is shown in
Table 2 and
Table 3.
In sum, most of the classes were predicted favourably. The majority of misclassifications between the “Healthy” and “Affected” classes are possibly caused by human errors while labelling the regions manually in the raw imagery. Considering a weighed importance of precision and recall of 1:1, the F-support scores highlight a detection rate of for healthy trees, for affected trees, and an overall detection rate of . Validation through k-fold cross-validation shows that the presented approach has an accuracy of 96.79%, with a standard deviation of 0.567%.
The performance of Algorithm 1 was tested in a computer with the following characteristics: Processor Intel
Core™ i7-4770, 256 GB SSD, 16 GB RAM, Windows 7 64bit, and AMD Radeon™ HD 8490. It contains a report of the elapsed seconds for the application to accomplish the primary data processing, training, and prediction tasks, as illustrated in
Table 4.
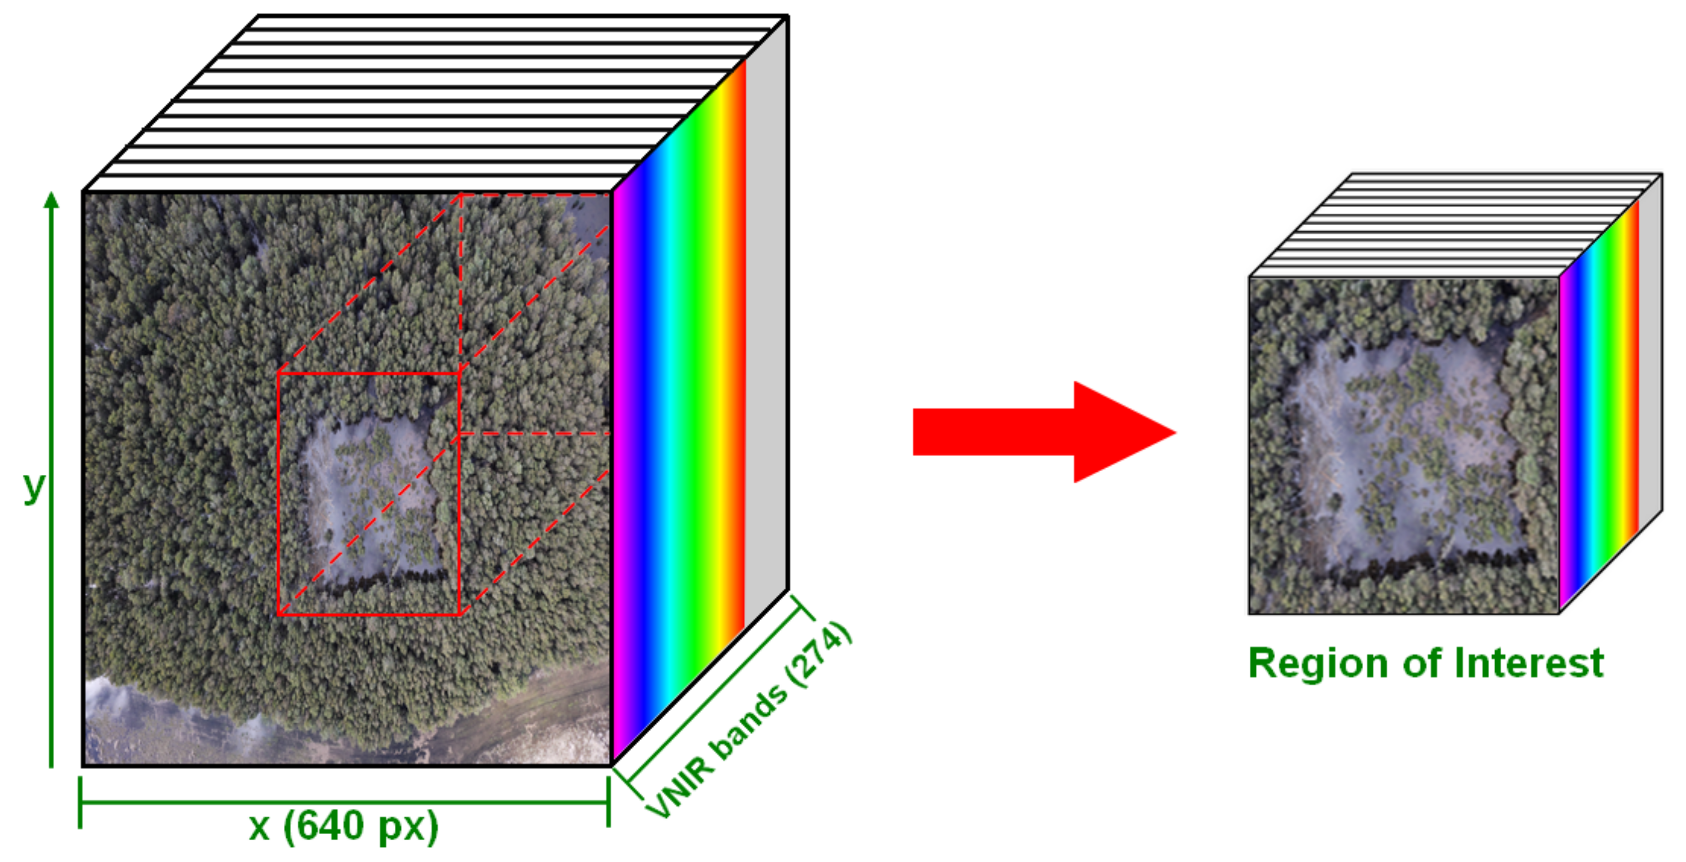
Taking into account the dimensions of the processed hypercube (1400 × 1200) and the initial number of bands (274), it was observed how a great demand of resources was required to open the file itself and calculate spectral indexes, accumulating 61.7 s on average. Similarly, the features filtering process in the training section also demanded considerable time, exceeding 50 s. On the other hand, the elapsed time executing the remaining tasks of the training phase was remarkably short. Specifically, the report highlights the benefits of filtering irrelevant features by comparing the duration of fitting the classifier for the first time with the duration of re-fitting it again with less yet relevant data from 8.74 to 0.99 s. Overall, the application spent 2 min and 51 s to evaluate and map an area of 338 m approximately.
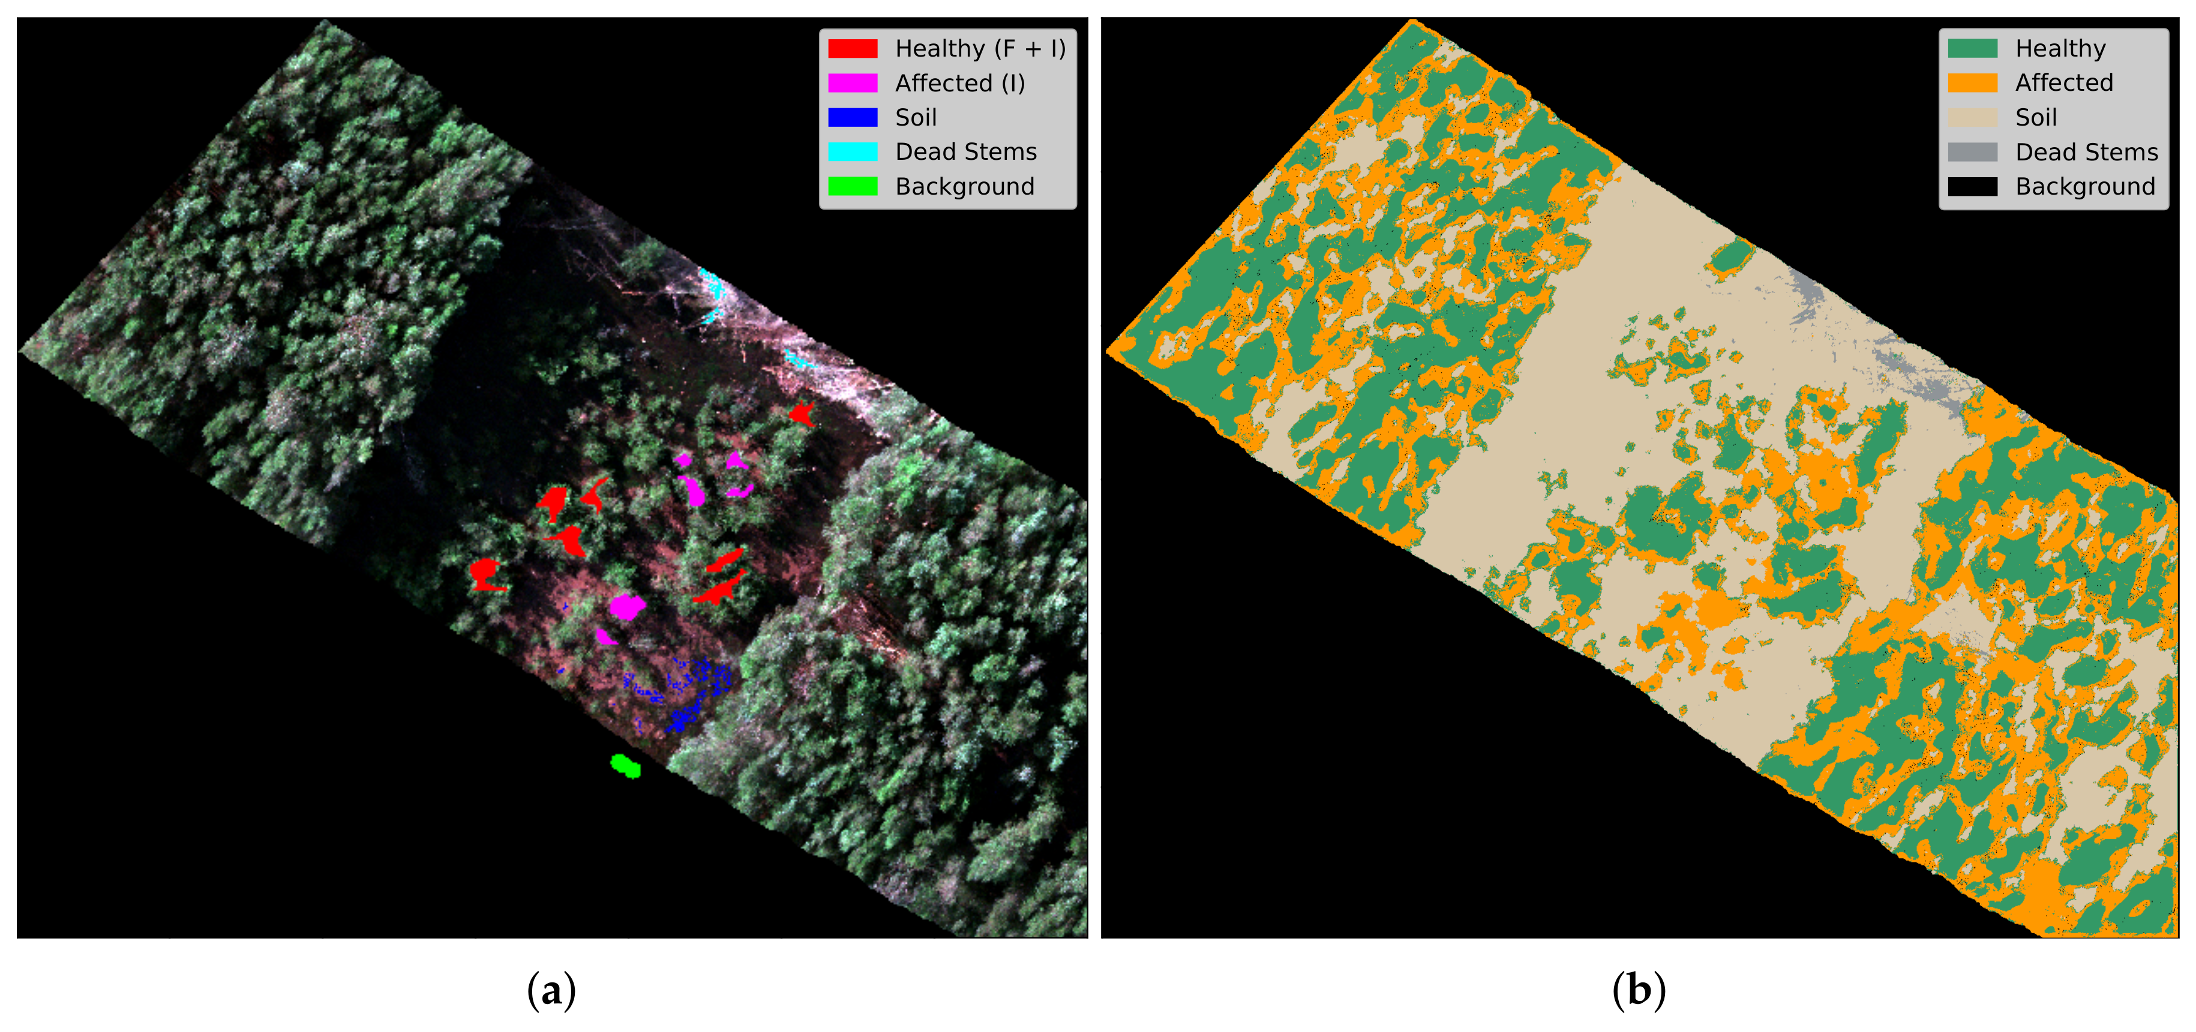
The GSD value of
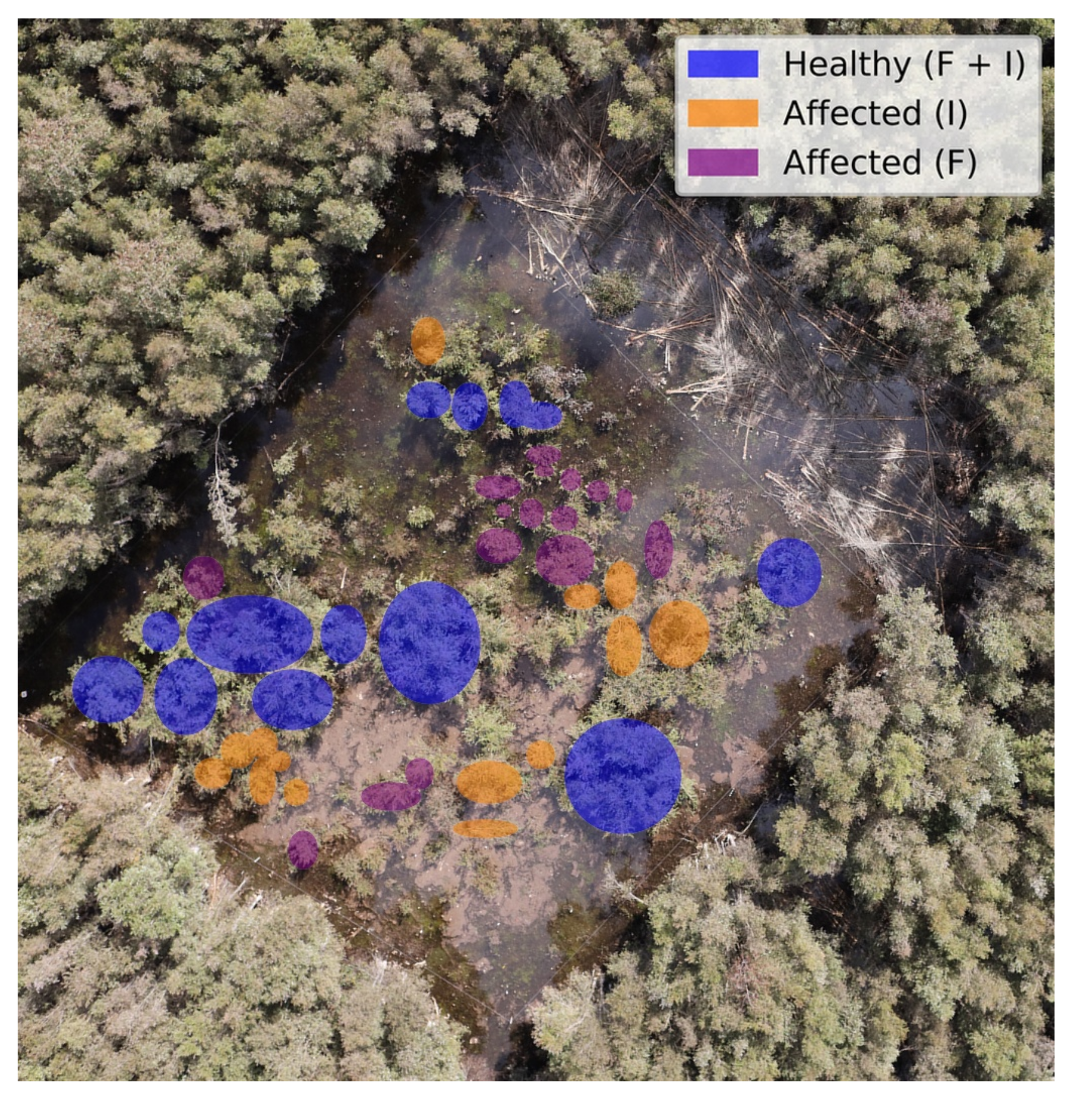
cm/pixel from the acquired hyperspectral imagery represented a minor challenge in labelling individual trees, but is still problematic when specific stems or leaflets need to be highlighted. Higher resolution can assist in higher classification rates. As an illustration, the final segmented image of the optimised classifier is shown in
Figure 9, where
Figure 9a shows the digital labelling of every class region and
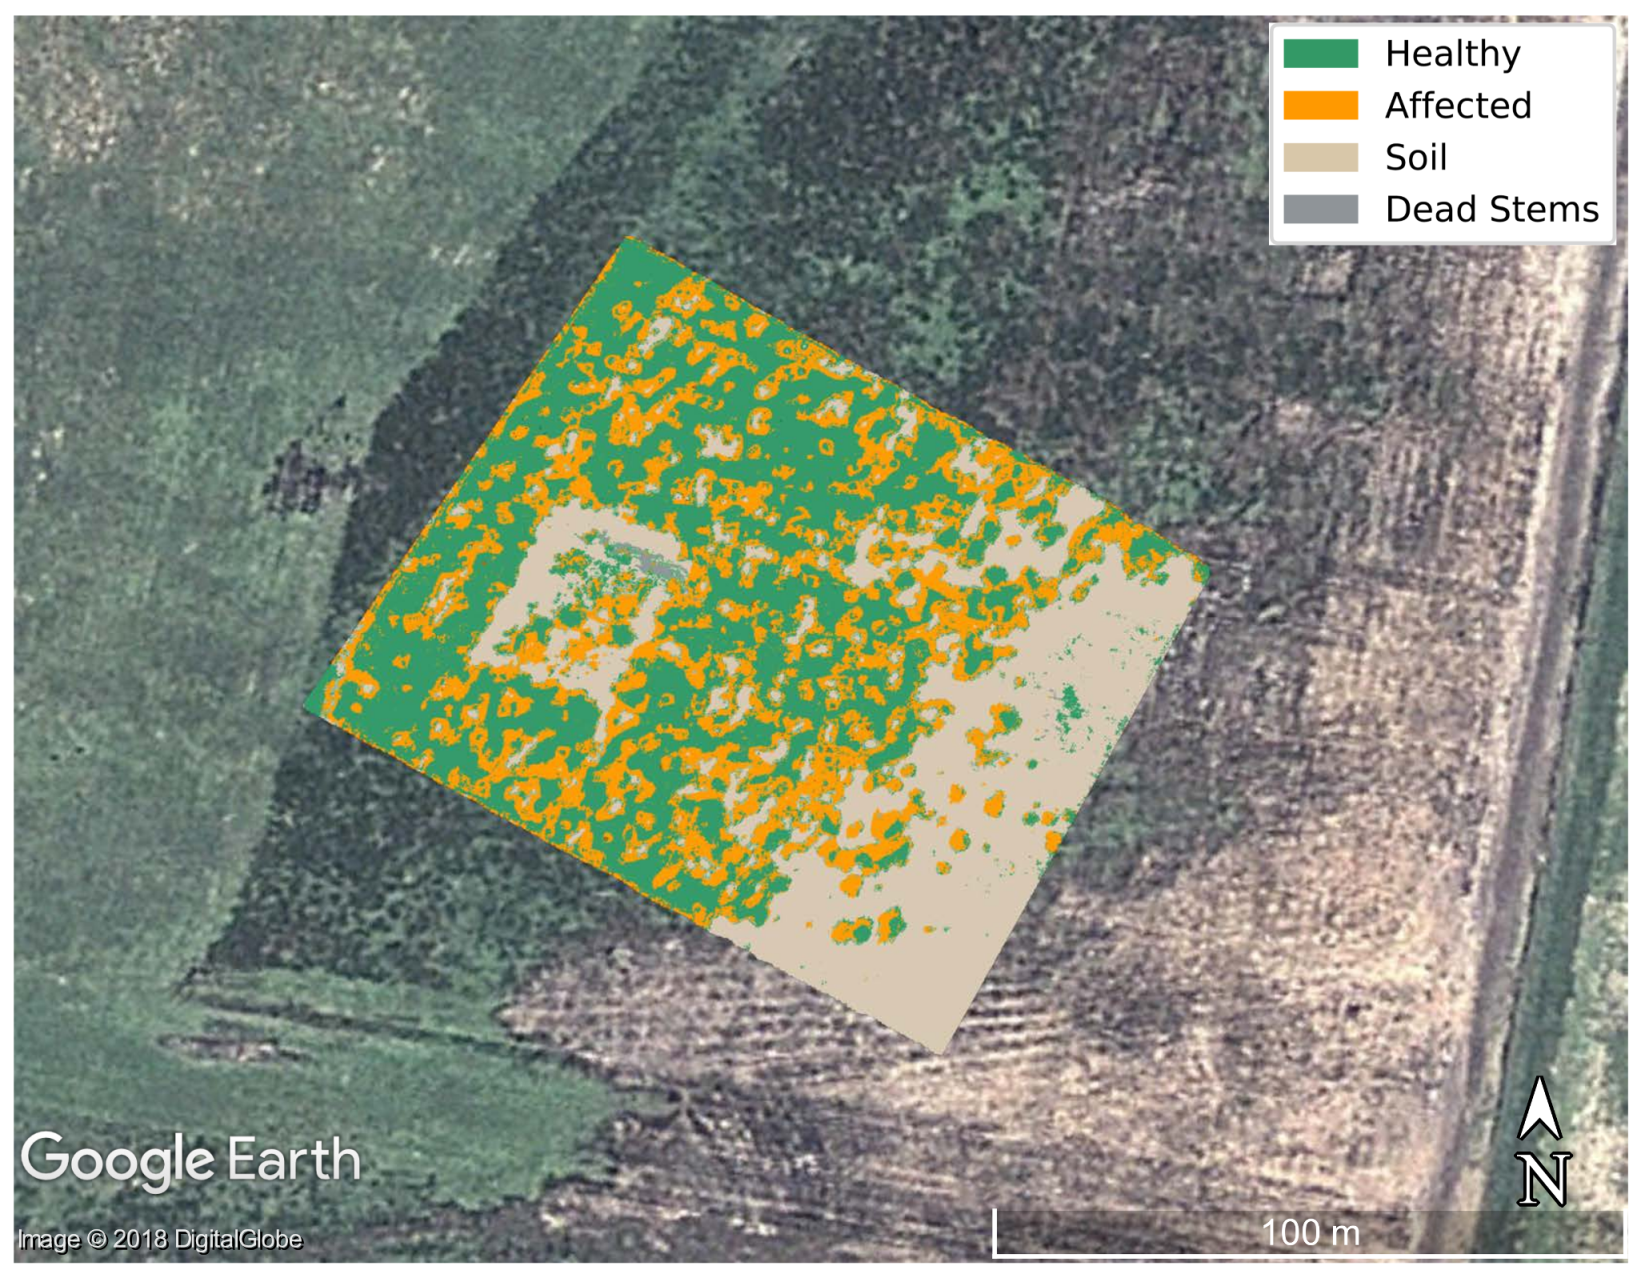
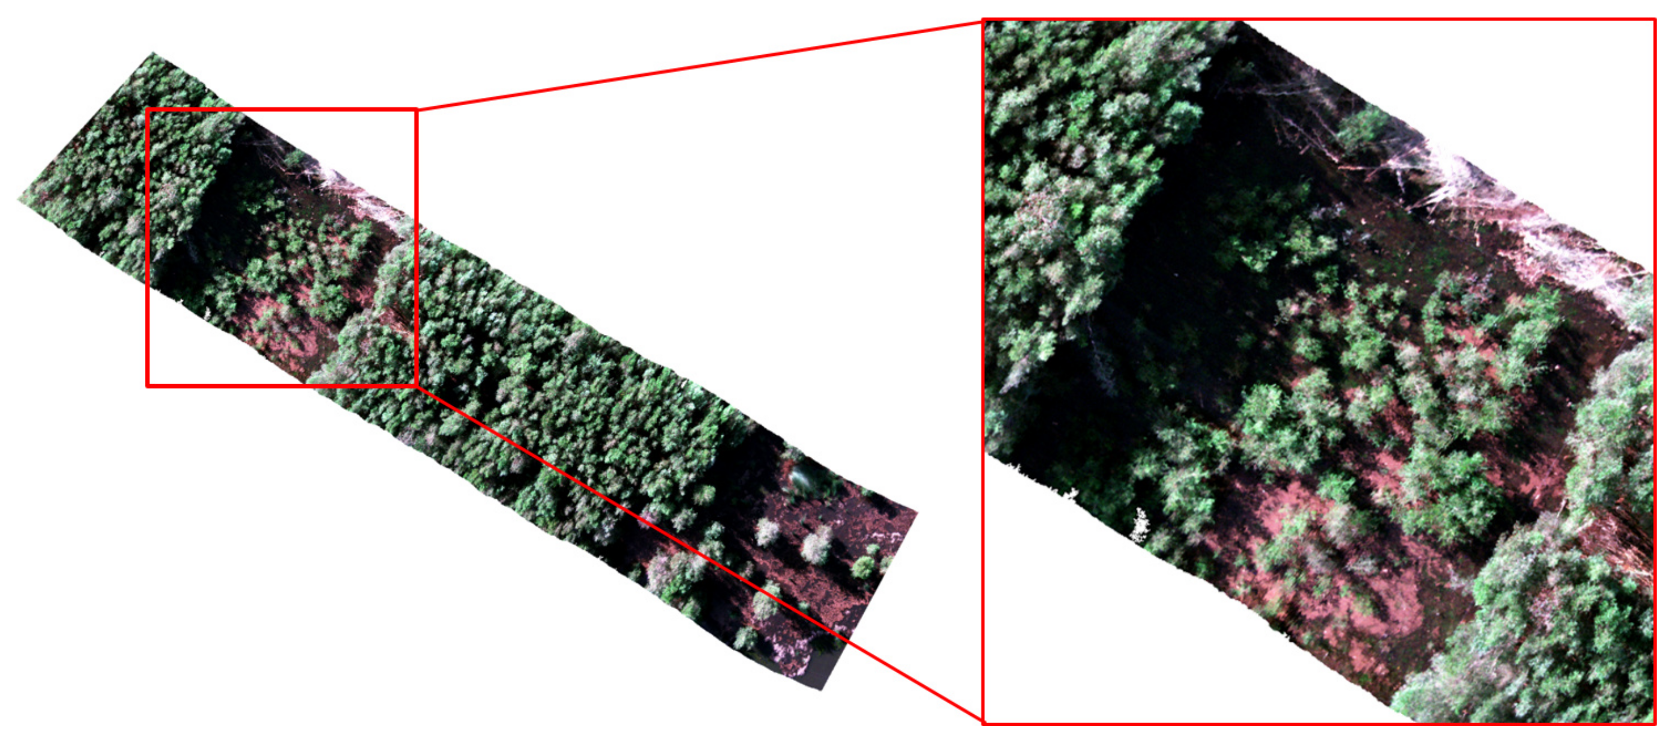
Figure 9b depicts the generated segmentation output by Algorithm 1. A hypercube covering the entire area flown was also processed using the trained model, with results shown in
Figure 10.
Results show a segmentation output using XGBoost as the supervised machine learning classifier that works well for this task. This classifier as well as Algorithm 1 are not only important for their capabilities to offer a pixel-wise classification task, but they also allow a rapid convergence, do not involve many complex mathematical calculations, and filter irrelevant data, compared to other methods. Nevertheless, it is suggested that their prediction performance be revised with new data. Like any model based on decision trees, over-fitting may occur, and misleading results might be generated. In those situations, labelling misclassified data, aggregating them into the features database and rerunning the algorithm is suggested.
The availability to process and classify data with small GSD values demonstrates the potential of UASs for remote sensing equipment compared with satellite and manned aircraft for forest health assessments on forest and tree plantations and with traditional estimation methods, such as statistical regression models. In comparison with similar approaches of non-invasive assessment techniques using UAVs and spectral sensors, this framework does not provide general spectral indexes that can be applied with different classifiers and similar evaluations. In contrast, this presented method boosts the efficiency of the classifier by receiving feedback from the accuracy scores of every feature and transforming the input data in consequence. The more explicit the data for the classifier is, the better the classification rates are. Furthermore, it is also demonstrated that a classifier which processes and combines data from multiple spectral indexes provides better performance than analysing individual components from different source sensors.
5. Conclusions
This paper describes a pipeline methodology for effective detection and mapping of indicators of poor health in forest and plantation trees integrating UAS technology and artificial intelligence approaches. The techniques were illustrated with an accurate classification and segmentation task of paperbark tea trees deteriorated by myrtle rust from an exclusion trial in NSW, Australia. Here, the system achieved detection rates of for healthy trees and for affected trees. The algorithm obtained a multiclass detection rate of . Data labelling is a task that demands many resources from both site-based and remote sensing methods, and, due to human error, affects the accuracy and reliability of the classifier results.
The approach can be used to train various datasets from different sensors to improve detection rates that single solutions offer as well as the capability of processing large datasets using freeware software. The case study demonstrates an effective approach that allows for rapid and accurate indicators, and for alterations of exposed areas at early stages. However, understanding disease epidemiology and interactions between pathogens and hosts is still required for the effective use of these technologies.
Future research should discuss the potential of monitoring the evolution of affected species through time, the prediction of expansion directions and rates of the disease, and how data will contribute to improving control actions to deter their presence in unaffected areas. Technologically, future works should analyse and compare the efficacy of unsupervised algorithms to label vegetation items accurately, integrate the best approaches in the proposed pipeline, and evaluate regression models that predict data based on other biophysical information offered by site-based methods.


